107
Lampiran 1
Kuesioner Responden

108
LAMPIRAN I Daftar Pertanyaan/Kuesioner
DAFTAR PERTANYAAN : KUESIONER
PENGARUH AUDIT TENURE, TEKANAN
DARI KLIEN, PEER REVIEW, JASA NON
AUDIT, KOMPETENSI, TEKANAN
ANGGARAN WAKTU, DUE PROFESSIONAL
CARE, DAN MOTIVASI TERHADAP
KUALITAS AUDIT.
IDENTITAS RESPONDEN
a. Nama Responden : …………………………………(boleh tidak diisi)
b. Jenis Kelamin : L / P
c. Umur : …..... tahun
d. Pendidikan :
D3 S1 S2
e. Jabatan Fungsional :
Junior Auditor Senior Auditor
f. Masa Kerja : ……. tahun ….… bulan
109
PETUNJUK PENGISIAN
Berikan tanda cek ( √ ) pada kolom “alternatif jawaban”, atas pernyataan-
pernyataan yang ada, sesuai dengan kenyataan yang saudara rasakan atau alami
dalam instansi atau pekerjaan saudara.
Kategori Jawaban :
STS = Sangat Tidak Setuju
TS = Tidak Setuju
N = Netral
S = Setuju
SS = Sangat Setuju
LAMA HUBUNGAN DENGAN KLIEN (AUDIT TENURE)
Pernyataan Alternatif Jawaban
STS TS N S SS
1. Saya sebaiknya melakukan audit dengan
klien yang sama paling lama 3 tahun.
2. Saya harus tetap menjaga kredibilitas saya
dalam melakukan audit walaupun telah lama
menjalin hubungan dengan klien.
3. Karena lamanya hubungan dengan klien,
maka tidak semua kesalahan klien yang saya
temukan saya laporkan.
Sumber : Harhinto (2004)
TEKANAN DARI KLIEN
Pernyataan Alternatif Jawaban
STS TS N S SS
1. Saya diminta klien untuk membuat hasil
pemeriksaan yang baik walaupun
faktanya buruk.
2. Kepentingan dari klien seringkali
mendorong saya bersikap tidak jujur.
110
Pernyataan STS TS N S SS
3. Jika saya tidak mengikuti keinginan
klien, maka saya mendapat sanksi dari
klien berupa penghentian penugasan
atau mengganti posisi saya dengan
auditor lain.
4. saya tidak berani melaporkan kesalahan
klien, karena klien dapat menghentikan
penugasan dan mengganti posisi saya
dengan auditor lain.
Sumber : Harhinto (2004)
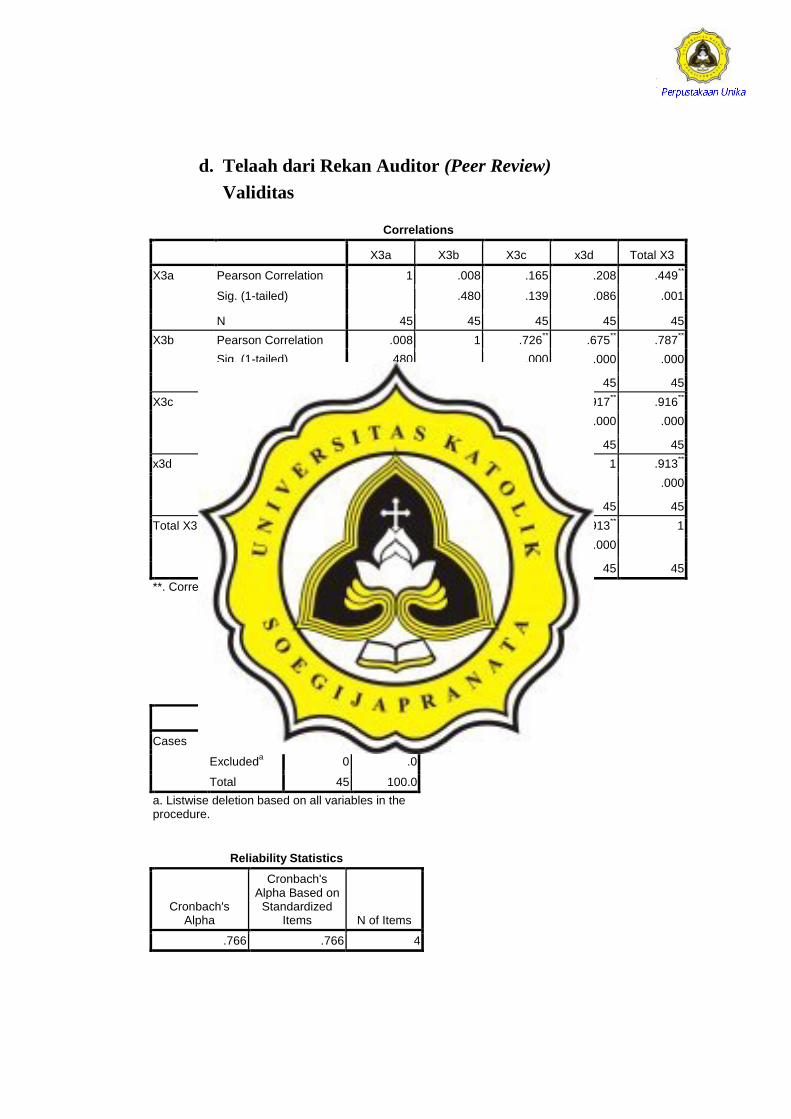
TELAAH DARI REKAN AUDITOR (PEER REVIEW)
Pernyataan Alternatif Jawaban
STS TS N S SS
1. Saya tidak membutuhkan telaah dari rekan
auditor dalam tim untuk menilai prosedur
audit yang telah saya lakukan.
2. Selama ini telaah dari rekan auditor dalam
tim yang dilakukan terhadap saya untuk
menilai kelayakan desain sistem
pengendalian kualitas.
3. Selama ini telaah dari rekan auditor dalam
tim yang dilakukan terhadap saya untuk
melihat kepatuhan saya terhadap Standar
Pengendalian Mutu yang ada.
4. Selama ini telaah dari rekan auditor dalam
tim yang dilakukan terhadap saya untuk
meningkatkan kualitas jasa akuntansi dan
audit.
Sumber : Harhinto (2004)
111
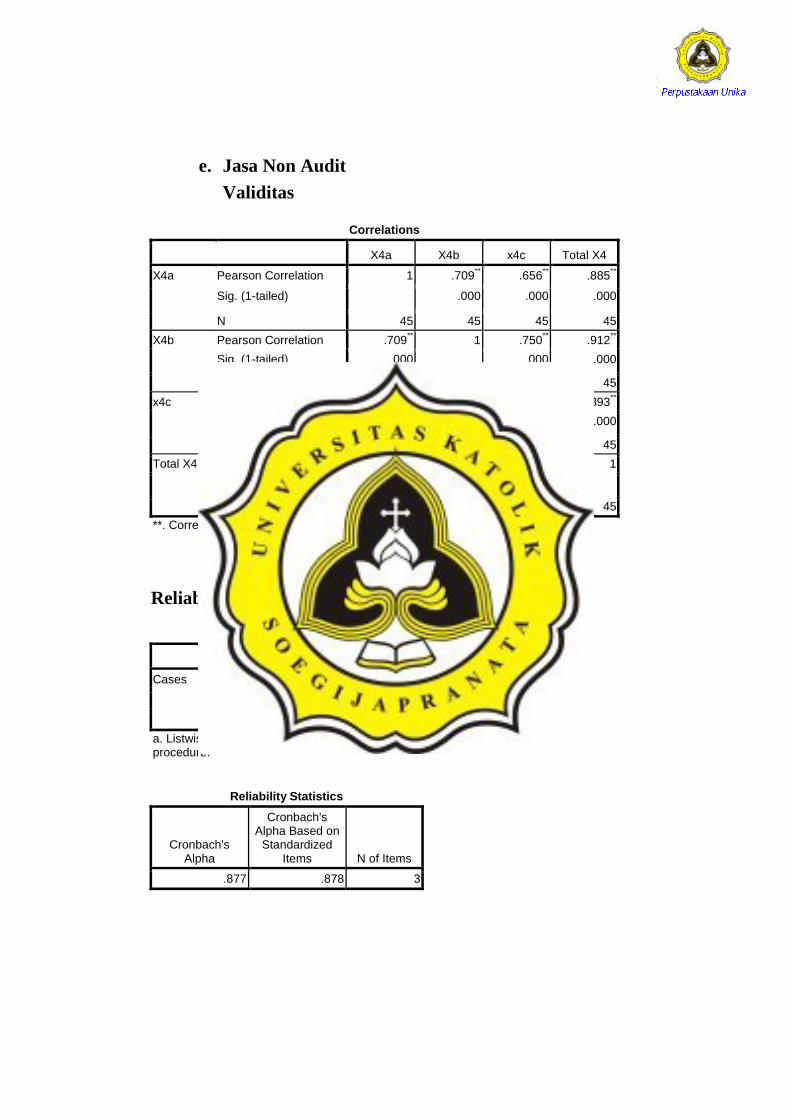
JASA NON AUDIT
Pernyataan Alternatif Jawaban
STS TS N S SS
1. Selain memberikan jasa audit, suatu
kantor akuntan dapat pula memberikan
jasa-jasa lainnya kepada klien yang sama.
2. Jasa non audit yang diberikan pada klien
dapat merusak kredibilitas penampilan
akuntan publik.
3. Saya sering mendapatkan permintaan jasa
non audit oleh klien yang sama sehingga
meningkatkan info yang disajikan dalam
laporan keuangan.
Sumber : Elfarini (2007)
KOMPETENSI
Dimensi Pernyataan Alternatif Jawaban
STS TS N S SS
Pengetahuan
1. Setiap akuntan publik harus
memahami dan melaksanakan jasa
profesionalnya sesuai dengan Standar
Akuntan Keuangan (SAK) dan
Standar profesional Akuntan Publik
(SPAP) yang relevan.
2. Untuk melaksanakan audit yang baik,
saya perlu memahami jenis industri
perusahaan klien.
3. Untuk melaksanakan audit yang baik,
saya perlu memahami kondisi
perusahaan klien.
4. Untuk melakukan audit yang baik,
saya membutuhkan pengetahuan
yang diperoleh dari tingkat
pendidikan formal.
112
Pernyataan STS TS N S SS
5. Selain pendidikan formal, saya juga
membutuhkan pengetahuan yang
diperoleh dari kursus dan pelatihan
khususnya dibidang audit.
6. Keahlian khusus yang saya miliki
dapat mendukung proses audit yang
saya lakukan.
Sumber : elfarini (2007)
Pengalaman
1. Semakin banyak jumlah klien yang
saya audit, menjadikan audit yang
saya lakukan semakin lebih baik
2. Saya telah lama melakukan audit
dengan berbagai macam dan jenis
klien sehingga audit yang saya
lakukan menjadi lebih baik.
3. Walaupun sekarang jumlah klien
saya banyak, audit yang saya lakukan
belum tentu lebih baik dari
sebelumnya.
4. Saya pernah mengaudit perusahaan
besar, sehingga saya dapat mengaudit
perusahaan yang kecil dengan lebih
baik.
Sumber : Elfarini (2007)
113
TEKANAN ANGGARAN WAKTU
Pernyataan Alternatif Jawaban
STS TS N S SS
1. Saat saya menghadapi anggaran waktu audit yang
ketat, saya tidak membebankan seluruh waktu yang
seharusnya digunakan untuk menyelesaikan
pekerjaan saya.
2. Saat saya menghadapi anggaran waktu audit yang
ketat, saya mengurangi ukuran sampel untuk
menyesuaikan dengan waktu audit yang tersedia.
3. Saat saya menghadapi anggaran waktu audit yang
ketat, saya memeriksa secara cepat bukti-bukti audit
untuk menyesuaikan dengan waktu audit yang
tersedia.
4. Saat saya menghadapi anggaran waktu audit yang
ketat, saya tidak sempat mendokumentasikan
pekerjaan audit saya.
Sumber : Imammudin A (2007)
DUE PROFESSIONAL CARE
Pernyataan Alternatif Jawaban
STS TS N S SS
1. Sebelum melakukan audit, saya meminta bahan-
bahan bukti disiapkan dengan lengkap.
2. Bahan bukti yang harus disiapkan adalah bahan bukti
yang asli dan legal.
3. Bila akan ganti alat bukti selama pelaksanaan audit,
saya harus lakukan dengan penuh ketelitian dan
kewajaran.
4. Saya tidak memberikan dispensasi terhadap
penjelasan rasional untuk menguatkan bukti yang
tidak resmi.
Sumber : Singgih dan Bawono (2010)
114
Sumber : Efendy (2010)
MOTIVASI
Pernyataan Alternatif Jawaban
STS TS N S SS
1. Hasil audit saya benar-benar dimanfaatkan oleh klien
sehingga akan memberi pengaruh yang cukup besar
bagi peningkatan kualitas perusahaan.
2. Saya tidak akan menerima dampak negatif apapun
jika tidak melakukan audit dengan baik.
3. Apa yang saya lakukan selama ini sudah cukup baik,
tidak perlu adanya perbaikan.
4. Saya sering melakukan intropeksi diri.
5. Saya akan mempertahankan hasil audit saya
meskipun berbeda dengan hasil audit rekan lain
dalam tim.
6. Kesungguhan saya dalam menjalankan tugas sering
dipengaruhi mood (suasana hati).
Sumber : Efendy (2010)
KUALITAS AUDIT
Pernyataan Alternatif Jawaban
STS TS N S SS
1. Laporan hasil audit saya dapat dipahami oleh
auditee.
2. Pemahaman terhadap sistem informasi klien dapat
menjadikan pelaporan audit saya menjadi lebih
baik.
3. Saya menjamin temuan audit saya akurat. Saya bisa
menemukan sekecil apapun kesalahan atau
penyimpangan yang ada.
4. Saya tidak pernah melakukan rekayasa. Temuan
audit apapun saya laporkan apa adanya.
5. Audit yang saya lakukan akan dapat menurunkan
tingkat kesalahan atau penyimpangan yang selama
ini terjadi.
6. Saya selalu berusaha berhati-hati dalam
pengambilan keputusan selama melakukan audit..

115
Lampiran 2
Rekapitulasi Data
Kuesioner
116
Res Jenis
Kelamin Usia Pendidikan Jabatan
Masa Kerja
(Bulan)
1 Pria 23 S1 Yunior 18
2 Wanita 25 S1 Yunior 12
3 Wanita 25 S1 Yunior 12
4 Pria 26 S1 Yunior 14
5 Wanita 22 S1 Yunior 12
6 Pria 23 S1 Yunior 24
7 Pria 24 S1 Yunior 24
8 Wanita 23 S1 Senior 33
9 Pria 22 S1 Yunior 12
10 Wanita 23 S1 Senior 27
11 Pria 24 S1 Yunior 12
12 Wanita 23 S1 Yunior 18
13 Wanita 24 S1 Yunior 20
14 Wanita 21 S1 Yunior 17
15 Pria 23 S1 Yunior 12
16 Wanita 22 S1 Yunior 12
17 Wanita 25 S1 Yunior 24
18 Wanita 24 S1 Yunior 12
19 Wanita 23 S1 Yunior 20
20 Pria 24 S1 Yunior 24
21 Pria 25 S1 Yunior 24
22 Pria 63 S1 Senior 84
23 Pria 63 S1 Senior 84
24 Pria 66 S1 Senior 120
25 Pria 66 S1 Senior 120
26 Pria 66 S2 Senior 120
27 Pria 64 S1 Senior 96
28 Wanita 25 S1 Senior 36
29 Pria 27 S3 Senior 65
30 Wanita 23 S1 Yunior 15
31 Pria 26 S1 Yunior 20
32 Pria 23 S1 Yunior 12
33 Pria 23 S1 Yunior 12
34 Pria 25 S1 Yunior 18
35 Pria 24 S1 Senior 26
36 Pria 43 S2 Senior 224
37 Pria 35 S1 Senior 74
REKAPITULASI IDENTITAS RESPONDEN
117
38 Pria 27 S1 Senior 40
39 Pria 25 S1 Senior 43
40 Wanita 26 S1 Senior 54
41 Pria 25 D3 Senior 36
42 Pria 24 S1 Senior 37
43 Pria 24 D3 Senior 36
44 Pria 23 D3 Yunior 25
45 Pria 23 D3 Yunior 19
118
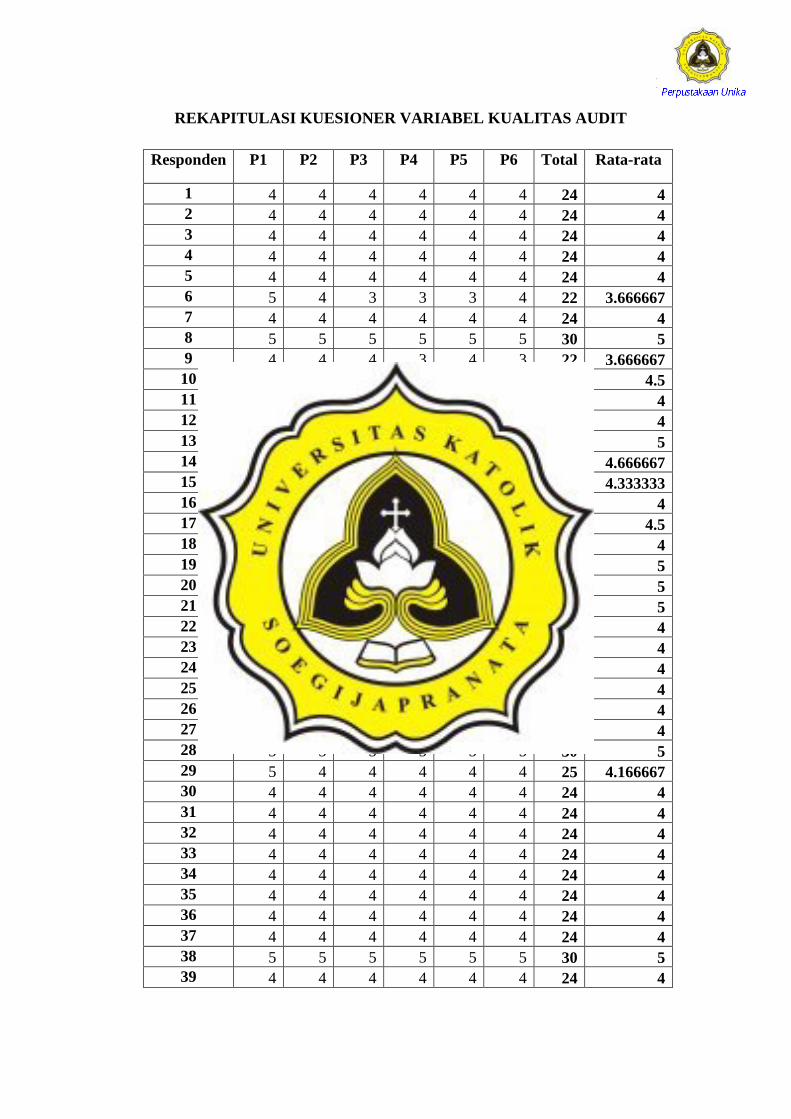
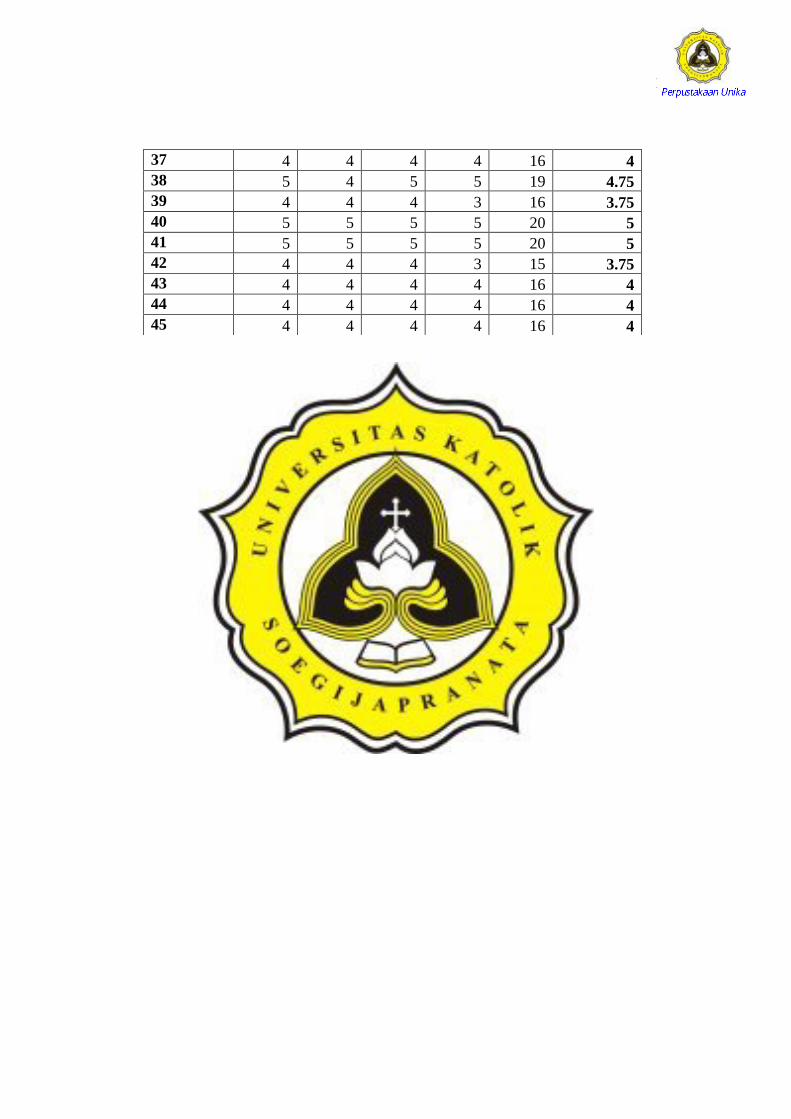
Responden P1 P2 P3 P4 P5 P6 Total Rata-rata
1 4 4 4 4 4 4 24 4
2 4 4 4 4 4 4 24 4
3 4 4 4 4 4 4 24 4
4 4 4 4 4 4 4 24 4
5 4 4 4 4 4 4 24 4
6 5 4 3 3 3 4 22 3.666667
7 4 4 4 4 4 4 24 4
8 5 5 5 5 5 5 30 5
9 4 4 4 3 4 3 22 3.666667
10 4 4 5 5 5 4 27 4.5
11 4 4 4 4 4 4 24 4
12 4 4 4 4 4 4 24 4
13 5 5 5 5 5 5 30 5
14 4 5 4 5 5 5 28 4.666667
15 5 5 4 4 4 4 26 4.333333
16 4 4 4 4 4 4 24 4
17 5 5 3 4 5 5 27 4.5
18 4 4 4 4 4 4 24 4
19 5 5 5 5 5 5 30 5
20 5 5 5 5 5 5 30 5
21 5 5 5 5 5 5 30 5
22 4 4 4 4 4 4 24 4
23 4 4 4 4 4 4 24 4
24 4 4 4 4 4 4 24 4
25 4 4 4 4 4 4 24 4
26 4 4 4 4 4 4 24 4
27 4 4 4 4 4 4 24 4
28 5 5 5 5 5 5 30 5
29 5 4 4 4 4 4 25 4.166667
30 4 4 4 4 4 4 24 4
31 4 4 4 4 4 4 24 4
32 4 4 4 4 4 4 24 4
33 4 4 4 4 4 4 24 4
34 4 4 4 4 4 4 24 4
35 4 4 4 4 4 4 24 4
36 4 4 4 4 4 4 24 4
37 4 4 4 4 4 4 24 4
38 5 5 5 5 5 5 30 5
39 4 4 4 4 4 4 24 4
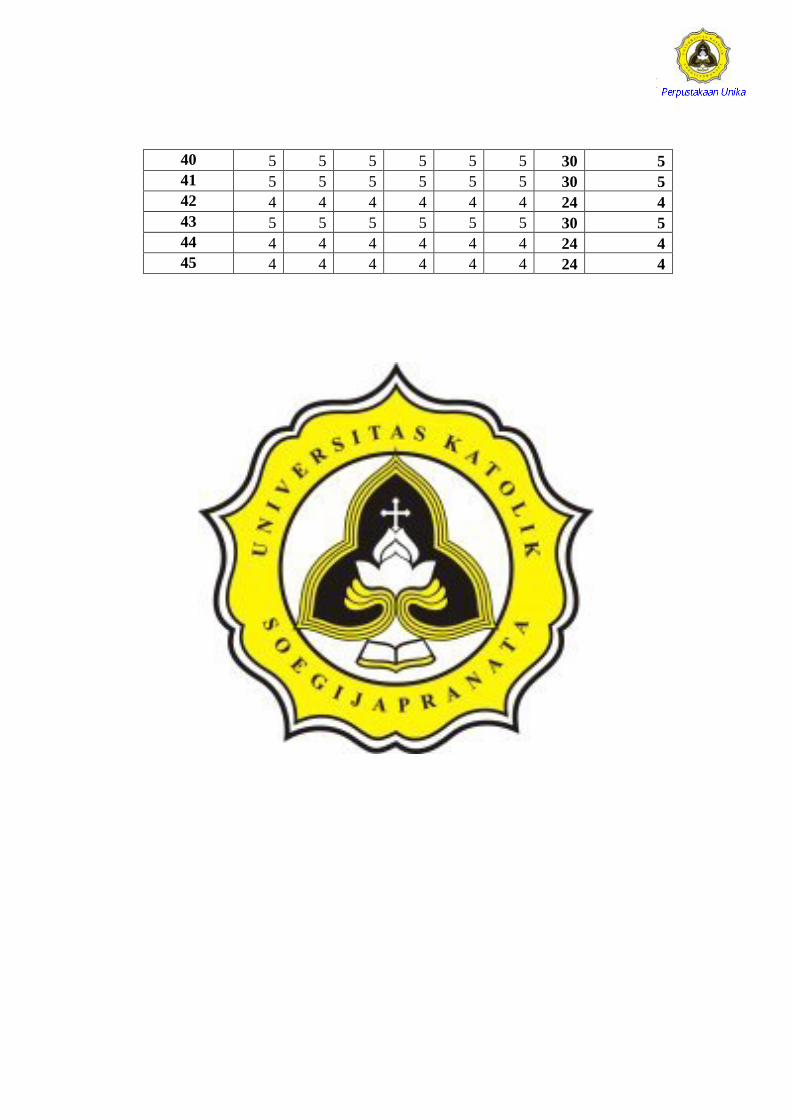
REKAPITULASI KUESIONER VARIABEL KUALITAS AUDIT
119
40 5 5 5 5 5 5 30 5
41 5 5 5 5 5 5 30 5
42 4 4 4 4 4 4 24 4
43 5 5 5 5 5 5 30 5
44 4 4 4 4 4 4 24 4
45 4 4 4 4 4 4 24 4
120
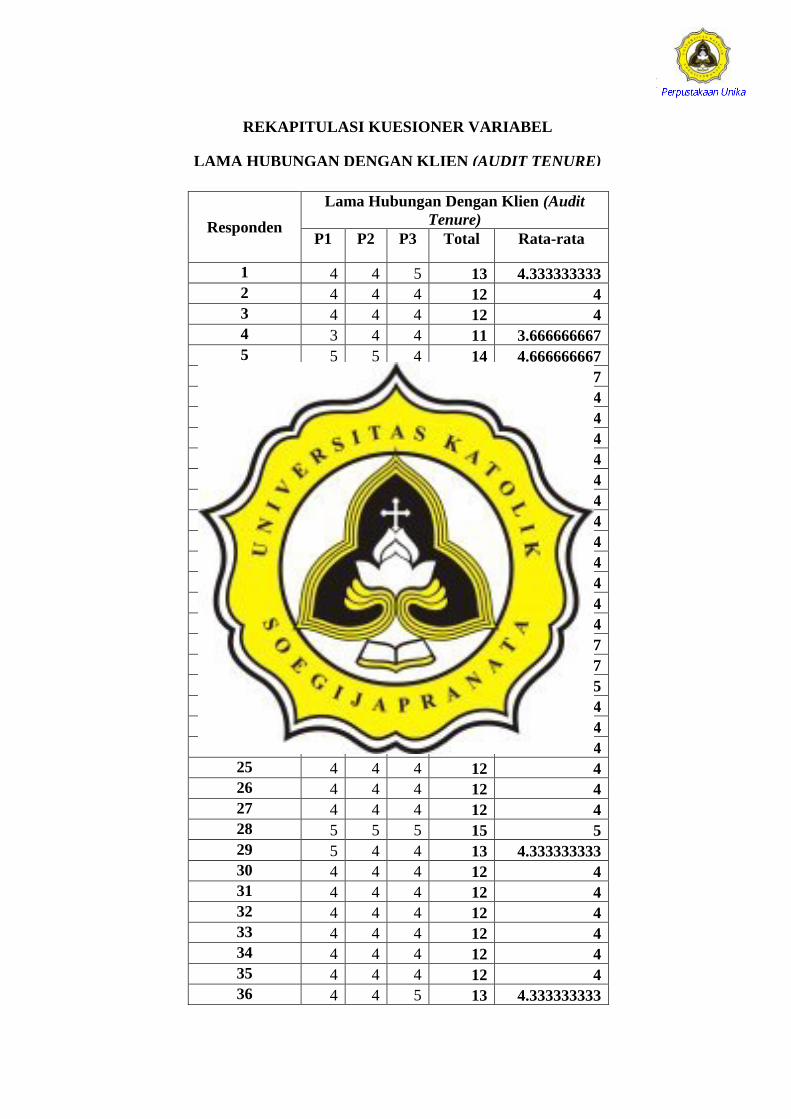
Responden
Lama Hubungan Dengan Klien (Audit
Tenure)
P1 P2 P3 Total Rata-rata
1 4 4 5 13 4.333333333
2 4 4 4 12 4
3 4 4 4 12 4
4 3 4 4 11 3.666666667
5 5 5 4 14 4.666666667
6 5 5 4 14 4.666666667
7 4 4 4 12 4
8 4 4 4 12 4
9 4 4 4 12 4
10 4 4 4 12 4
11 4 4 4 12 4
12 4 4 4 12 4
13 4 4 4 12 4
14 4 4 4 12 4
15 4 4 4 12 4
16 4 4 4 12 4
17 3 5 4 12 4
18 4 4 4 12 4
19 5 5 4 14 4.666666667
20 5 5 4 14 4.666666667
21 5 5 5 15 5
22 4 4 4 12 4
23 4 4 4 12 4
24 4 4 4 12 4
25 4 4 4 12 4
26 4 4 4 12 4
27 4 4 4 12 4
28 5 5 5 15 5
29 5 4 4 13 4.333333333
30 4 4 4 12 4
31 4 4 4 12 4
32 4 4 4 12 4
33 4 4 4 12 4
34 4 4 4 12 4
35 4 4 4 12 4
36 4 4 5 13 4.333333333
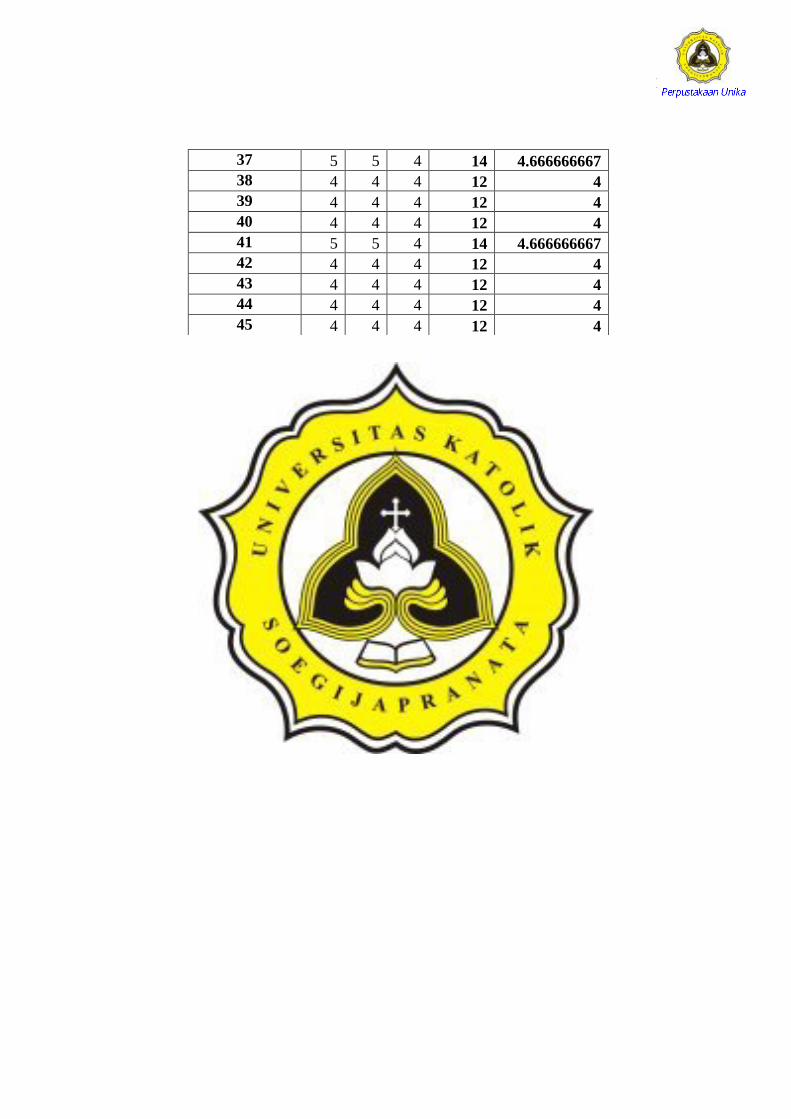
REKAPITULASI KUESIONER VARIABEL
LAMA HUBUNGAN DENGAN KLIEN (AUDIT TENURE)
121
37 5 5 4 14 4.666666667
38 4 4 4 12 4
39 4 4 4 12 4
40 4 4 4 12 4
41 5 5 4 14 4.666666667
42 4 4 4 12 4
43 4 4 4 12 4
44 4 4 4 12 4
45 4 4 4 12 4
122
Responden P1 P2 P3 P4 Total Rata-rata
1 1 1 1 1 4 1
2 3 2 2 2 9 2.25
3 2 2 2 2 8 2
4 2 2 2 2 8 2
5 4 4 3 2 13 3.25
6 3 3 1 1 8 2
7 2 2 2 2 8 2
8 2 2 3 2 9 2.25
9 3 3 2 2 10 2.5
10 2 2 2 2 8 2
11 1 1 1 1 4 1
12 2 2 2 2 8 2
13 2 2 2 2 8 2
14 4 4 2 2 12 3
15 2 2 2 2 8 2
16 2 2 2 2 8 2
17 1 1 2 1 5 1.25
18 2 3 2 2 9 2.25
19 1 1 1 1 4 1
20 1 2 1 1 5 1.25
21 1 1 1 1 4 1
22 2 2 2 2 8 2
23 2 2 2 2 8 2
24 2 2 2 2 8 2
25 2 2 2 2 8 2
26 2 2 2 2 8 2
27 2 2 2 2 8 2
28 1 1 1 1 4 1
29 2 2 2 2 8 2
30 2 2 2 2 8 2
31 2 2 2 2 8 2
32 2 2 2 2 8 2
33 2 2 2 2 8 2
34 2 2 2 2 8 2
35 2 2 2 2 8 2
36 2 2 2 2 8 2
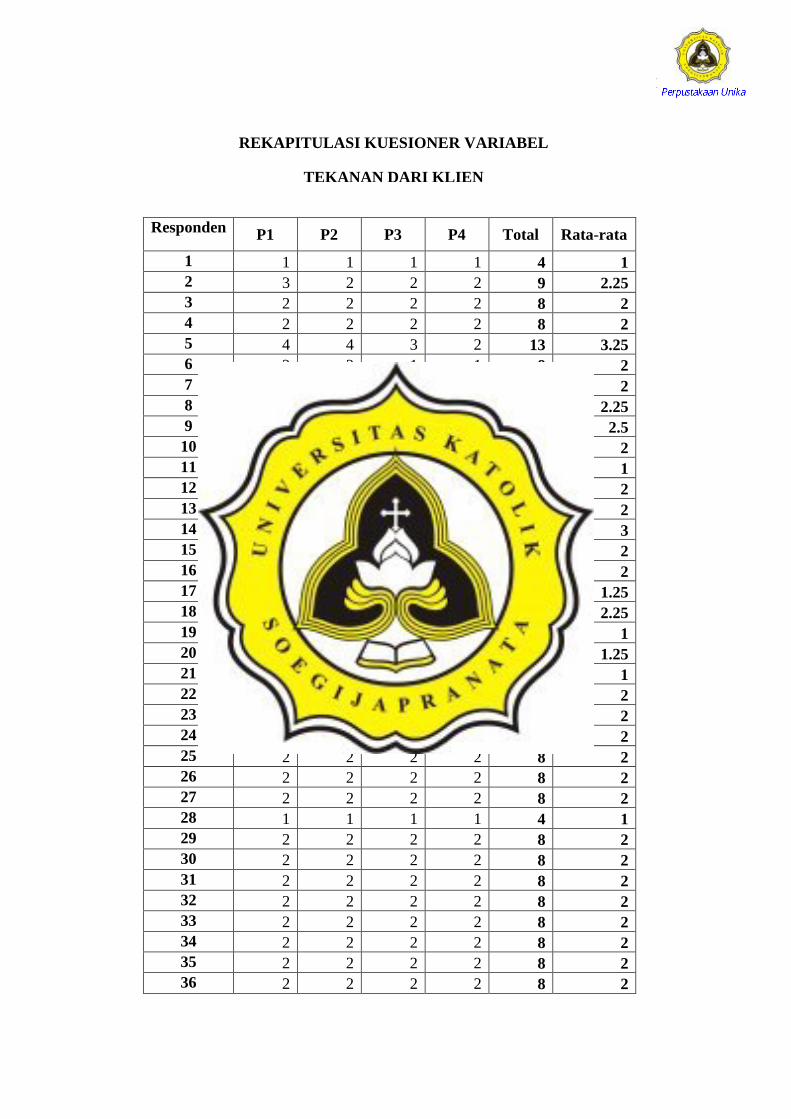
REKAPITULASI KUESIONER VARIABEL
TEKANAN DARI KLIEN

123
37 1 1 1 1 4 1
38 2 2 2 2 8 2
39 1 1 1 1 4 1
40 2 2 2 2 8 2
41 2 2 2 2 8 2
42 1 1 1 1 4 1
43 2 2 2 2 8 2
44 2 2 2 2 8 2
45 2 2 2 2 8 2
124
Responden P1 P2 P3 P4 Total Rata-rata
1 2 4 4 4 14 3.5
2 4 4 4 4 16 4
3 4 4 4 4 16 4
4 4 2 4 4 14 3.5
5 2 4 4 4 14 3.5
6 4 4 5 5 18 4.5
7 4 3 3 3 13 3.25
8 4 3 3 4 14 3.5
9 4 4 4 4 16 4
10 4 4 4 4 16 4
11 5 3 3 3 14 3.5
12 4 4 4 4 16 4
13 4 4 4 4 16 4
14 4 2 4 4 14 3.5
15 4 4 4 4 16 4
16 3 4 4 4 15 3.75
17 4 3 3 3 13 3.25
18 4 3 3 4 14 3.5
19 4 4 4 5 17 4.25
20 4 4 4 4 16 4
21 5 4 5 5 19 4.75
22 3 3 3 3 12 3
23 3 3 3 3 12 3
24 3 3 3 3 12 3
25 3 3 3 3 12 3
26 3 3 3 3 12 3
27 3 3 3 3 12 3
28 4 5 5 5 19 4.75
29 4 4 4 4 16 4
30 3 4 4 4 15 3.75
31 4 3 3 3 13 3.25
32 4 3 3 3 13 3.25
33 4 4 4 4 16 4
34 3 4 4 4 15 3.75
35 4 3 3 3 13 3.25
36 4 4 4 4 16 4
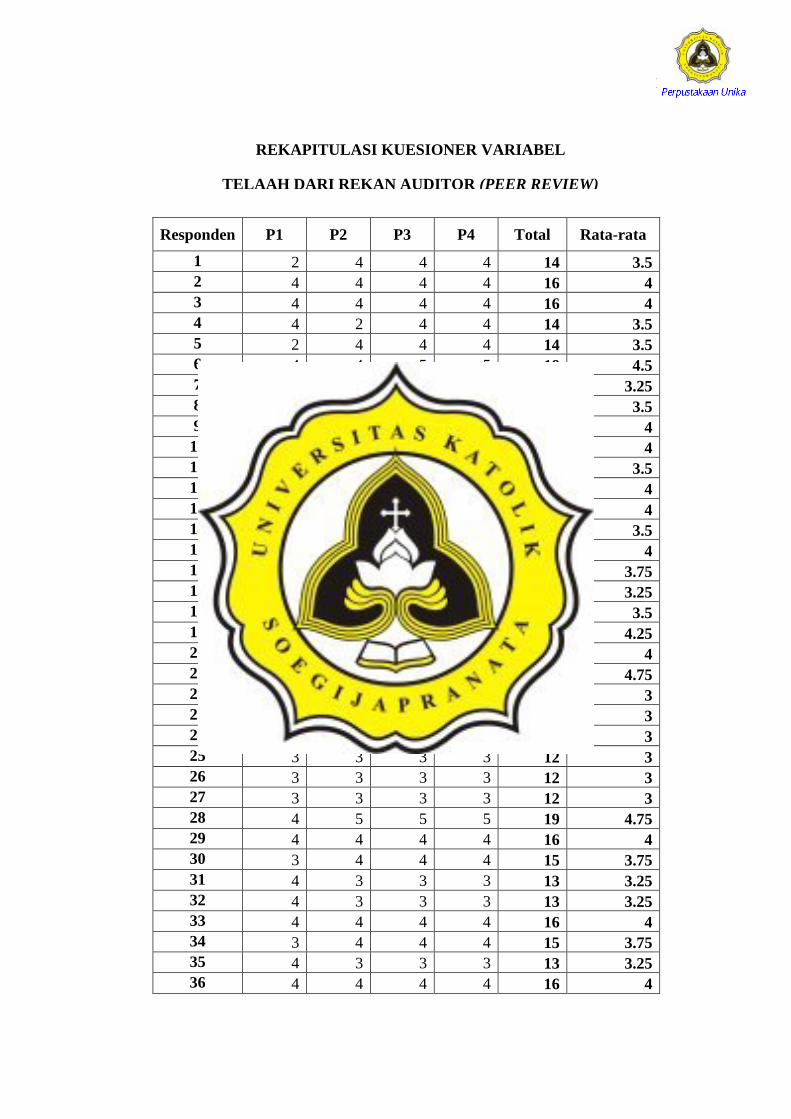
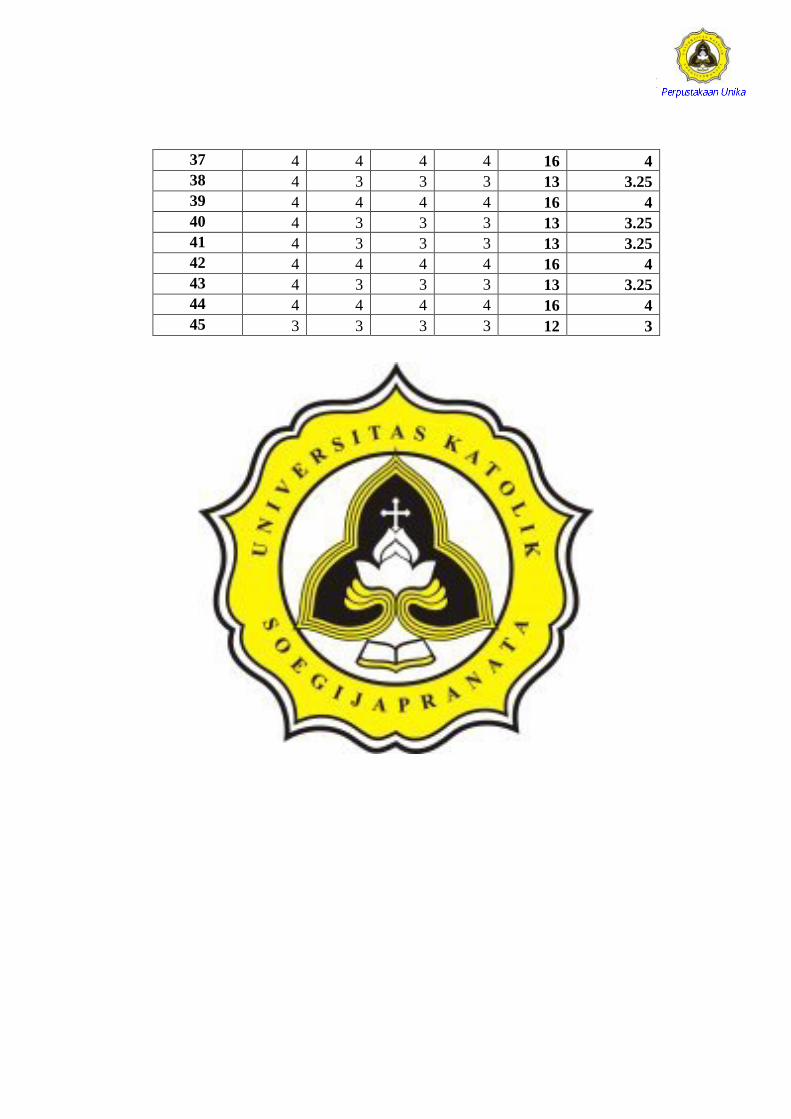
REKAPITULASI KUESIONER VARIABEL
TELAAH DARI REKAN AUDITOR (PEER REVIEW)
125
37 4 4 4 4 16 4
38 4 3 3 3 13 3.25
39 4 4 4 4 16 4
40 4 3 3 3 13 3.25
41 4 3 3 3 13 3.25
42 4 4 4 4 16 4
43 4 3 3 3 13 3.25
44 4 4 4 4 16 4
45 3 3 3 3 12 3
126
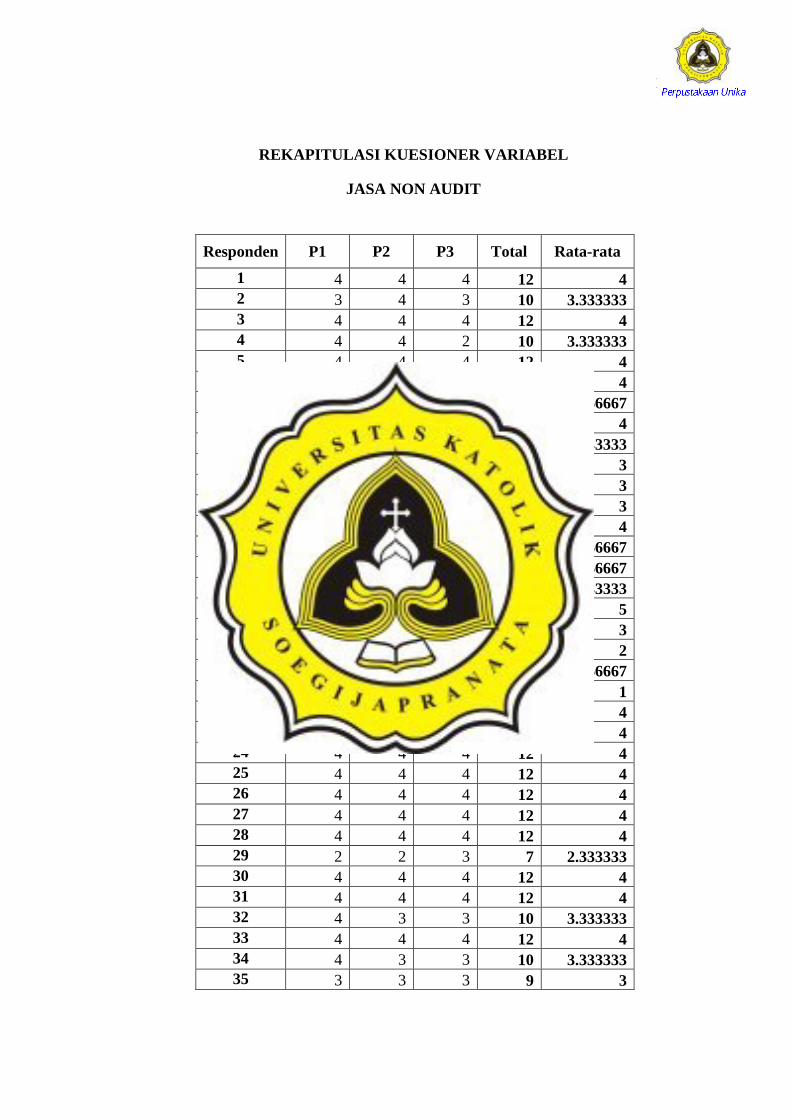
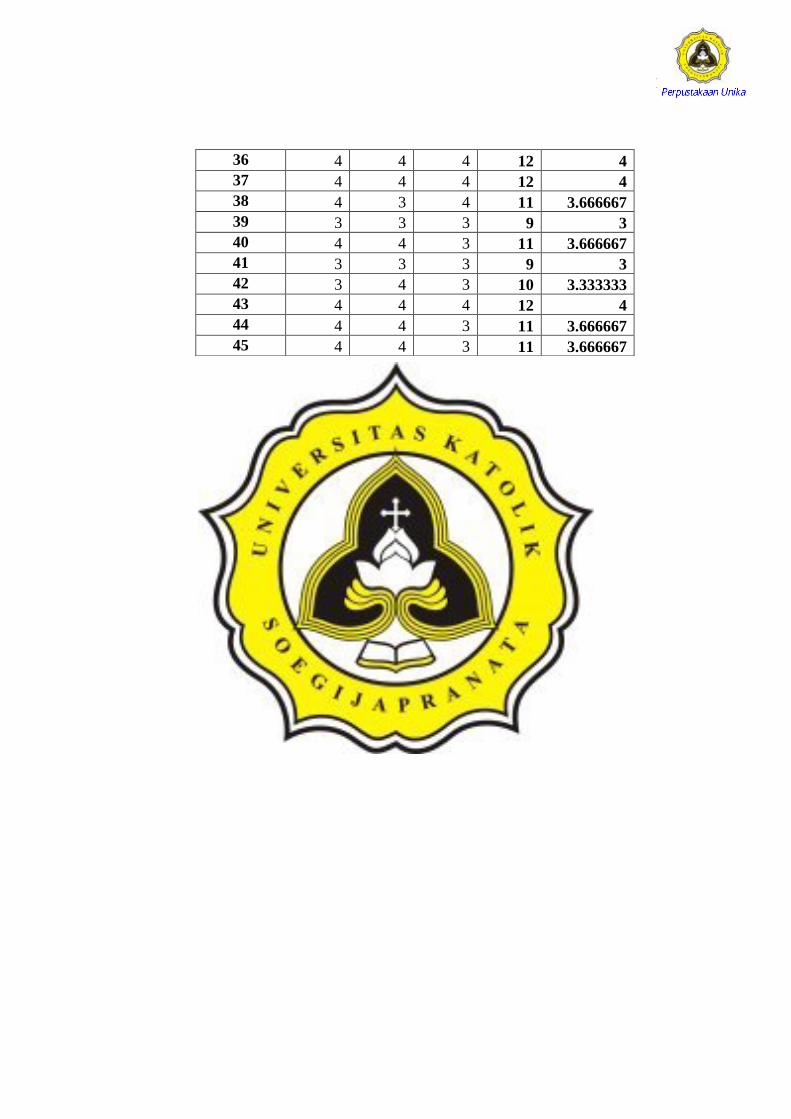
Responden P1 P2 P3 Total Rata-rata
1 4 4 4 12 4
2 3 4 3 10 3.333333
3 4 4 4 12 4
4 4 4 2 10 3.333333
5 4 4 4 12 4
6 4 4 4 12 4
7 4 4 3 11 3.666667
8 4 4 4 12 4
9 4 3 3 10 3.333333
10 2 4 3 9 3
11 3 3 3 9 3
12 4 3 2 9 3
13 4 4 4 12 4
14 4 2 2 8 2.666667
15 4 4 3 11 3.666667
16 3 4 3 10 3.333333
17 5 5 5 15 5
18 3 3 3 9 3
19 2 2 2 6 2
20 1 2 2 5 1.666667
21 1 1 1 3 1
22 4 4 4 12 4
23 4 4 4 12 4
24 4 4 4 12 4
25 4 4 4 12 4
26 4 4 4 12 4
27 4 4 4 12 4
28 4 4 4 12 4
29 2 2 3 7 2.333333
30 4 4 4 12 4
31 4 4 4 12 4
32 4 3 3 10 3.333333
33 4 4 4 12 4
34 4 3 3 10 3.333333
35 3 3 3 9 3
REKAPITULASI KUESIONER VARIABEL
JASA NON AUDIT
127
36 4 4 4 12 4
37 4 4 4 12 4
38 4 3 4 11 3.666667
39 3 3 3 9 3
40 4 4 3 11 3.666667
41 3 3 3 9 3
42 3 4 3 10 3.333333
43 4 4 4 12 4
44 4 4 3 11 3.666667
45 4 4 3 11 3.666667
128
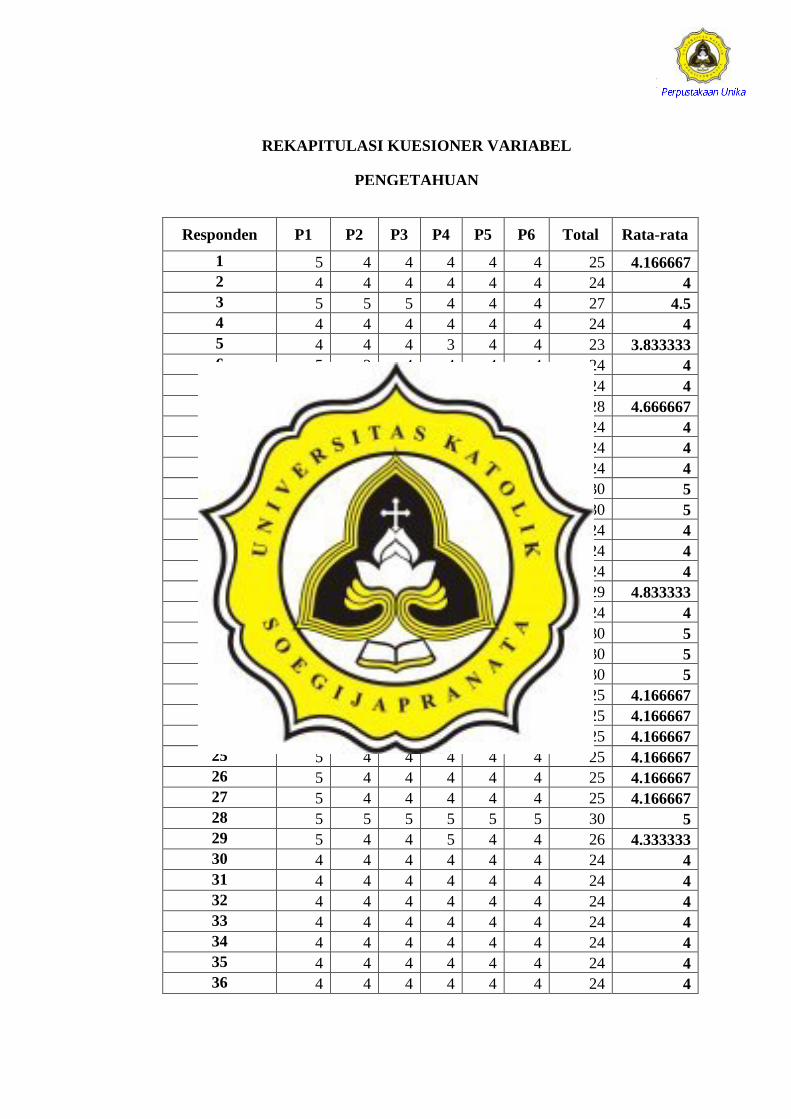
Responden P1 P2 P3 P4 P5 P6 Total Rata-rata
1 5 4 4 4 4 4 25 4.166667
2 4 4 4 4 4 4 24 4
3 5 5 5 4 4 4 27 4.5
4 4 4 4 4 4 4 24 4
5 4 4 4 3 4 4 23 3.833333
6 5 3 4 4 4 4 24 4
7 4 4 4 4 4 4 24 4
8 5 5 5 4 4 5 28 4.666667
9 4 4 4 4 4 4 24 4
10 4 4 4 4 4 4 24 4
11 4 4 4 4 4 4 24 4
12 5 5 5 5 5 5 30 5
13 5 5 5 5 5 5 30 5
14 4 4 4 4 4 4 24 4
15 4 4 4 4 4 4 24 4
16 4 4 4 4 4 4 24 4
17 5 5 5 5 4 5 29 4.833333
18 4 4 4 4 4 4 24 4
19 5 5 5 5 5 5 30 5
20 5 5 5 5 5 5 30 5
21 5 5 5 5 5 5 30 5
22 5 4 4 4 4 4 25 4.166667
23 5 4 4 4 4 4 25 4.166667
24 5 4 4 4 4 4 25 4.166667
25 5 4 4 4 4 4 25 4.166667
26 5 4 4 4 4 4 25 4.166667
27 5 4 4 4 4 4 25 4.166667
28 5 5 5 5 5 5 30 5
29 5 4 4 5 4 4 26 4.333333
30 4 4 4 4 4 4 24 4
31 4 4 4 4 4 4 24 4
32 4 4 4 4 4 4 24 4
33 4 4 4 4 4 4 24 4
34 4 4 4 4 4 4 24 4
35 4 4 4 4 4 4 24 4
36 4 4 4 4 4 4 24 4
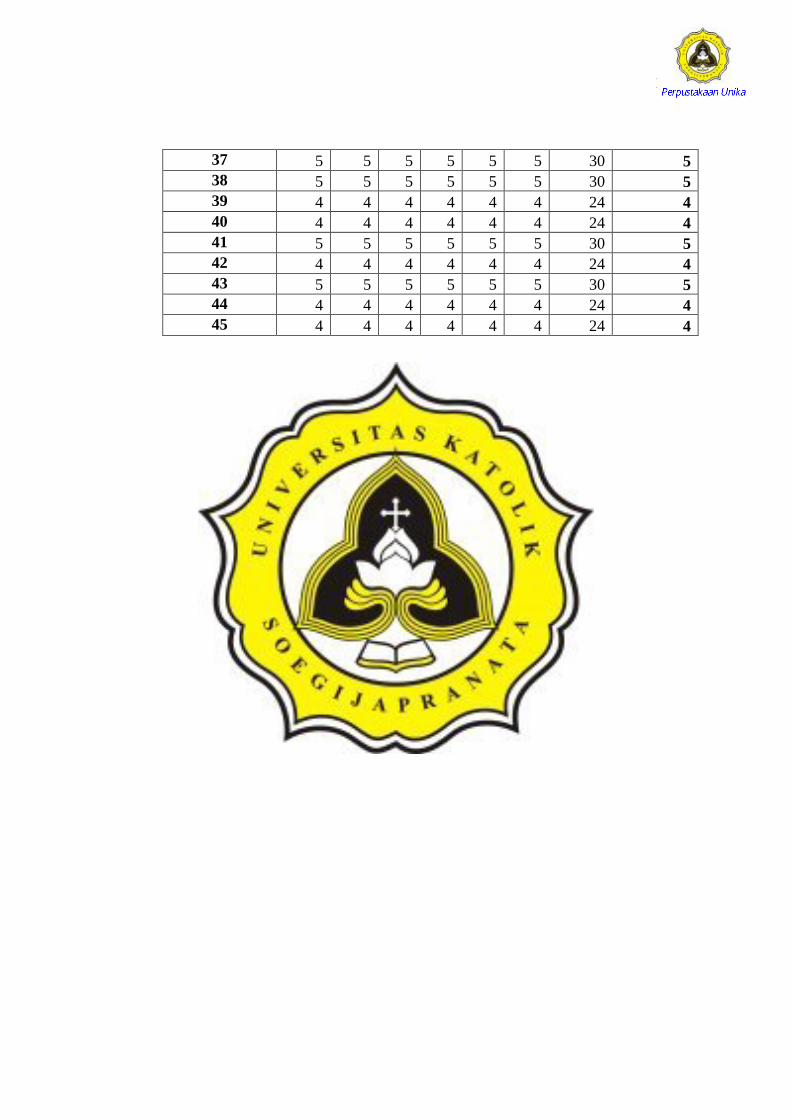
REKAPITULASI KUESIONER VARIABEL
PENGETAHUAN
129
37 5 5 5 5 5 5 30 5
38 5 5 5 5 5 5 30 5
39 4 4 4 4 4 4 24 4
40 4 4 4 4 4 4 24 4
41 5 5 5 5 5 5 30 5
42 4 4 4 4 4 4 24 4
43 5 5 5 5 5 5 30 5
44 4 4 4 4 4 4 24 4
45 4 4 4 4 4 4 24 4
130
Responden P1 P2 P3 P4 Total Rata-rata
1 5 4 4 3 13 4
2 4 4 3 4 15 3.75
3 4 4 4 3 15 3.75
4 4 4 4 4 16 4
5 4 4 3 4 15 3.75
6 4 4 5 4 17 4.25
7 4 4 5 4 17 4.25
8 5 5 5 5 20 5
9 4 4 5 4 17 4.25
10 4 4 4 4 16 4
11 4 4 3 4 15 3.75
12 5 5 5 3 18 4.5
13 5 5 4 5 19 4.75
14 4 4 5 4 17 4.25
15 5 5 4 5 19 4.75
16 4 4 3 4 15 3.75
17 5 5 3 3 16 4
18 4 3 4 4 15 3.75
19 5 5 4 5 19 4.75
20 4 4 4 4 16 4
21 5 5 5 5 20 5
22 4 4 4 3 15 3.75
23 4 4 4 3 15 3.75
24 4 4 4 3 15 3.75
25 4 4 4 3 15 3.75
26 4 4 4 3 15 3.75
27 4 4 4 3 15 3.75
28 5 5 4 5 19 4.75
29 4 4 5 5 18 4.5
30 4 4 4 4 16 4
31 5 5 4 5 19 4.75
32 4 4 4 4 16 4
33 4 4 4 4 16 4
34 4 4 4 4 16 4
35 4 4 4 4 16 4
36 4 4 4 4 16 4
37 5 5 4 4 16 4.5
REKAPITULASI KUESIONER VARIABEL
PENGALAMAN

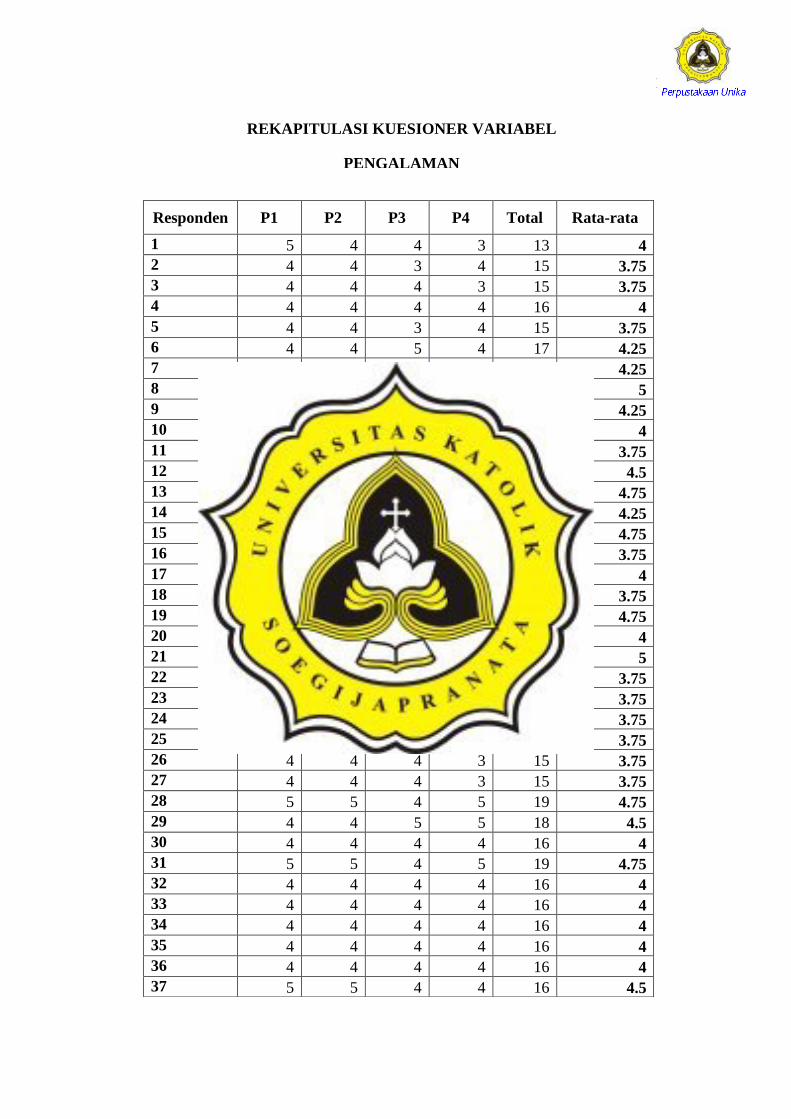
131
38 4 4 4 4 19 4
39 5 5 4 5 19 4.75
40 5 5 5 5 20 5
41 5 5 4 5 19 4.75
42 4 4 4 4 16 4
43 5 5 4 5 19 4.75
44 4 4 4 4 16 4
45 5 5 4 5 19 4.75
132
Responden P1 P2 P3 P4 Total Rata-rata
1 4 4 4 4 16 4
2 3 4 4 4 15 3.75
3 4 4 4 5 17 4.25
4 4 4 4 4 16 4
5 4 4 3 4 15 3.75
6 4 4 4 4 16 4
7 3 4 3 4 14 3.5
8 4 4 3 3 14 3.5
9 4 4 4 4 16 4
10 4 4 4 4 16 4
11 4 4 4 4 16 4
12 4 4 3 4 15 3.75
13 3 4 4 4 15 3.75
14 4 4 4 4 16 4
15 3 4 4 4 15 3.75
16 3 4 4 4 15 3.75
17 4 4 4 4 16 4
18 4 4 3 4 15 3.75
19 3 3 3 3 12 3
20 4 5 4 4 17 4.25
21 4 4 4 4 16 4
22 4 4 3 4 15 3.75
23 4 4 5 4 17 4.25
24 4 4 4 4 16 4
25 4 4 4 4 16 4
26 4 4 4 4 16 4
27 4 4 4 4 16 4
28 4 4 4 4 16 4
29 4 4 4 4 16 4
30 4 4 4 4 16 4
31 4 4 4 4 16 4
32 4 4 4 4 16 4
33 4 4 4 4 16 4
34 4 4 4 4 16 4
35 4 4 3 4 15 3.75
36 4 4 4 4 16 4
REKAPITULASI KUESIONER VARIABEL
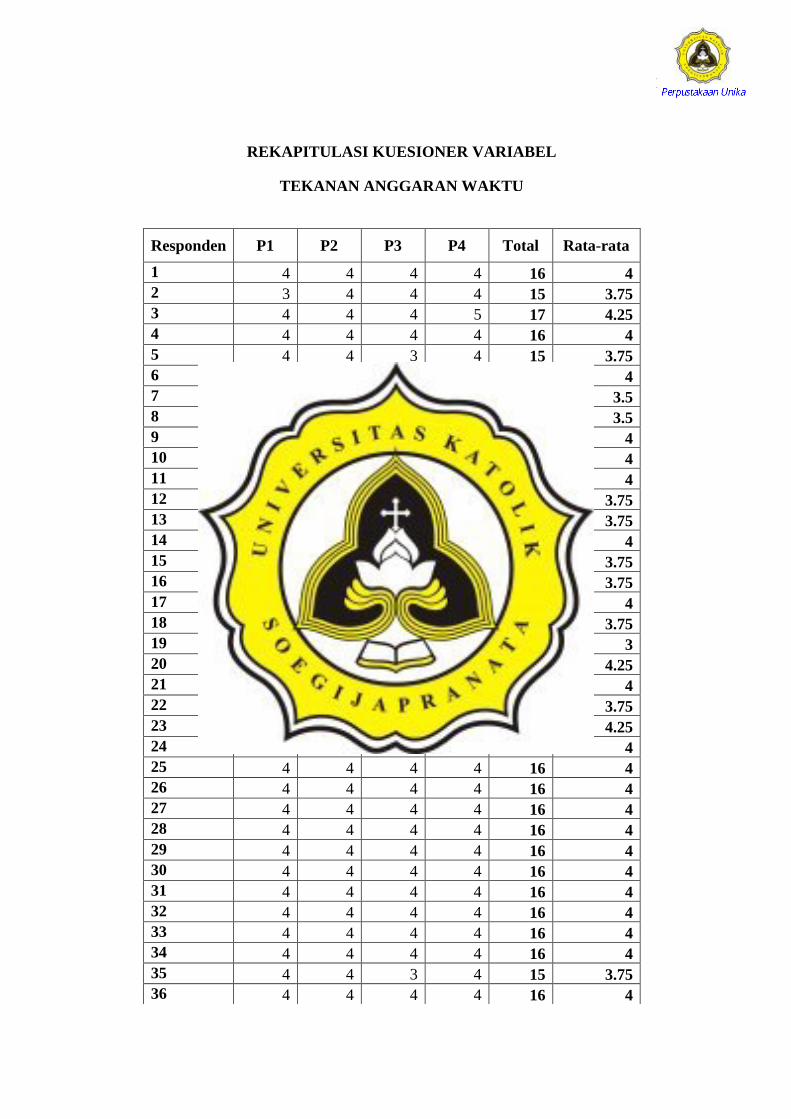
TEKANAN ANGGARAN WAKTU
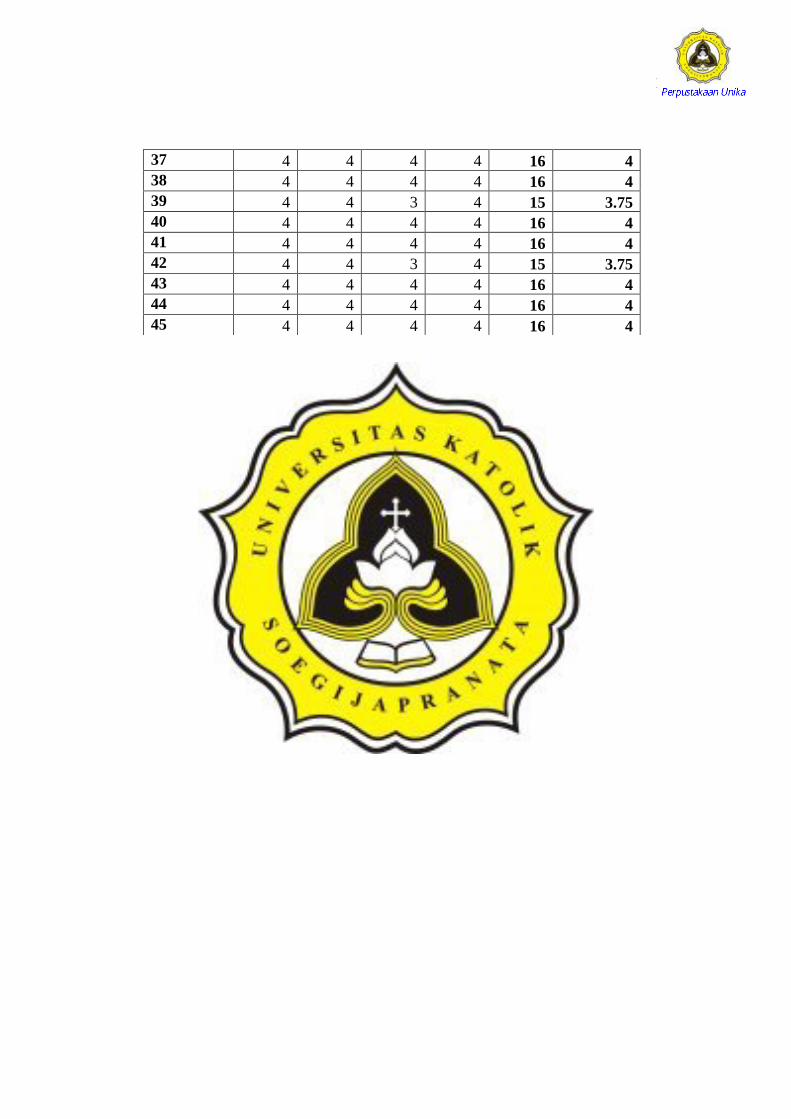
133
37 4 4 4 4 16 4
38 4 4 4 4 16 4
39 4 4 3 4 15 3.75
40 4 4 4 4 16 4
41 4 4 4 4 16 4
42 4 4 3 4 15 3.75
43 4 4 4 4 16 4
44 4 4 4 4 16 4
45 4 4 4 4 16 4
134
Responden P1 P2 P3 P4 Total Rata-rata
1 4 4 4 4 16 4
2 4 4 4 3 15 3.75
3 5 5 4 3 17 4.25
4 4 4 4 2 14 3.5
5 4 4 4 3 15 3.75
6 4 3 4 3 14 3.5
7 4 4 4 4 16 4
8 5 5 5 5 20 5
9 4 4 4 3 15 3.75
10 4 4 4 4 16 4
11 4 4 4 4 16 4
12 5 5 5 3 18 4.5
13 5 5 5 4 19 4.75
14 4 4 4 4 16 4
15 4 4 5 4 17 4.25
16 5 5 5 3 18 4.5
17 5 5 5 3 18 4.5
18 4 4 4 4 16 4
19 5 5 5 5 20 5
20 5 5 5 5 20 5
21 5 5 5 5 20 5
22 4 4 4 3 15 3.75
23 4 4 4 3 15 3.75
24 4 4 4 3 15 3.75
25 4 4 4 3 15 3.75
26 4 4 4 3 15 3.75
27 4 4 4 3 15 3.75
28 5 5 5 3 18 4.5
29 5 5 4 5 19 4.75
30 4 4 4 4 16 4
31 4 4 4 3 15 3.75
32 4 4 4 4 16 4
33 4 4 4 4 16 4
34 4 4 4 3 15 3.75
35 4 4 4 4 16 4
36 4 4 4 4 16 4
REKAPITULASI KUESIONER VARIABEL
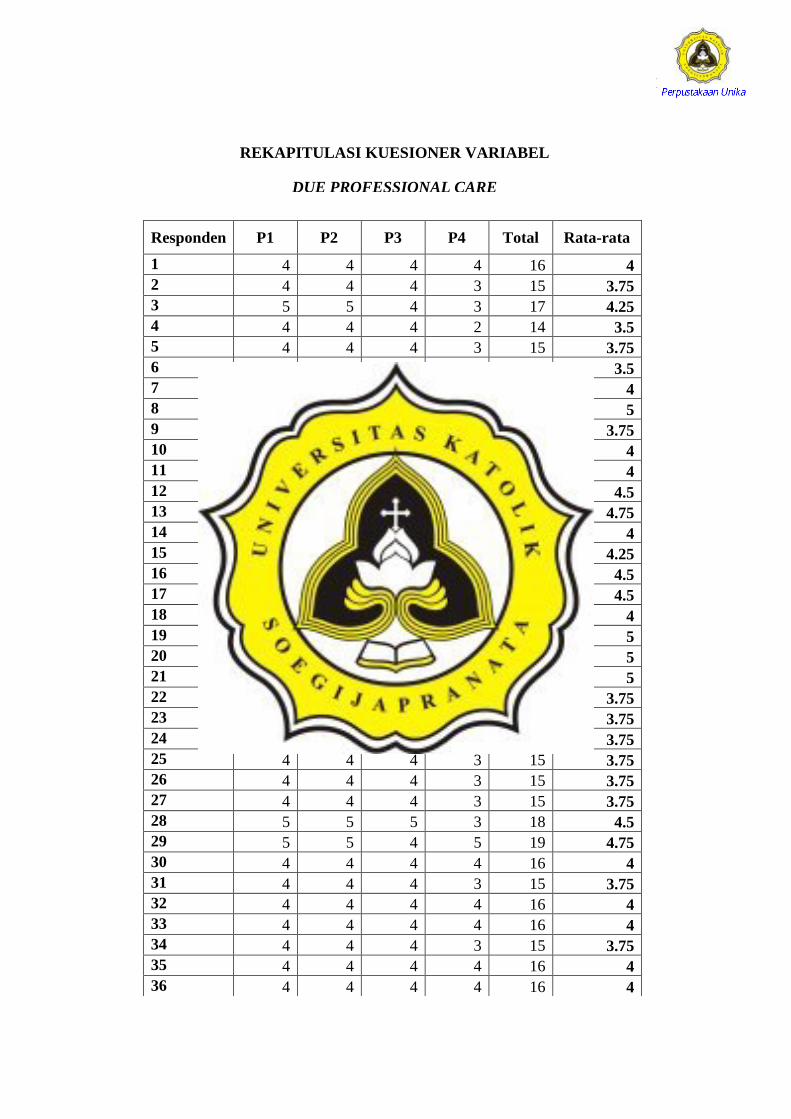
DUE PROFESSIONAL CARE
135
37 4 4 4 4 16 4
38 5 4 5 5 19 4.75
39 4 4 4 3 16 3.75
40 5 5 5 5 20 5
41 5 5 5 5 20 5
42 4 4 4 3 15 3.75
43 4 4 4 4 16 4
44 4 4 4 4 16 4
45 4 4 4 4 16 4
136
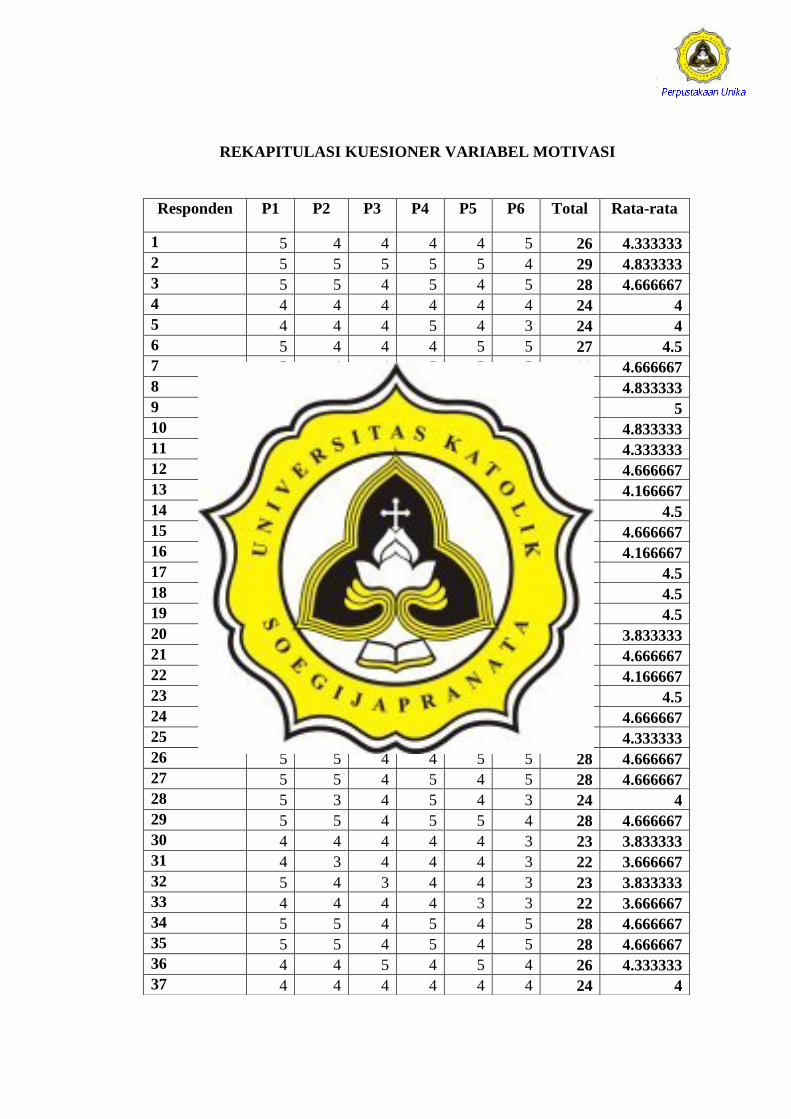
Responden P1 P2 P3 P4 P5 P6 Total Rata-rata
1 5 4 4 4 4 5 26 4.333333
2 5 5 5 5 5 4 29 4.833333
3 5 5 4 5 4 5 28 4.666667
4 4 4 4 4 4 4 24 4
5 4 4 4 5 4 3 24 4
6 5 4 4 4 5 5 27 4.5
7 5 4 4 5 5 5 28 4.666667
8 5 5 5 5 4 5 29 4.833333
9 5 5 5 5 5 5 30 5
10 5 5 5 5 5 4 29 4.833333
11 4 4 4 5 4 5 26 4.333333
12 5 5 4 5 4 5 28 4.666667
13 4 4 4 5 4 4 25 4.166667
14 4 4 4 5 4 4 27 4.5
15 4 5 4 5 5 5 28 4.666667
16 4 4 4 5 4 4 25 4.166667
17 5 4 4 5 4 5 27 4.5
18 5 4 4 4 5 5 27 4.5
19 5 4 4 4 5 5 27 4.5
20 4 5 3 5 4 2 23 3.833333
21 5 5 4 5 4 5 28 4.666667
22 4 5 4 4 4 4 25 4.166667
23 4 5 4 4 5 5 27 4.5
24 4 5 4 5 5 5 28 4.666667
25 5 4 4 5 4 4 26 4.333333
26 5 5 4 4 5 5 28 4.666667
27 5 5 4 5 4 5 28 4.666667
28 5 3 4 5 4 3 24 4
29 5 5 4 5 5 4 28 4.666667
30 4 4 4 4 4 3 23 3.833333
31 4 3 4 4 4 3 22 3.666667
32 5 4 3 4 4 3 23 3.833333
33 4 4 4 4 3 3 22 3.666667
34 5 5 4 5 4 5 28 4.666667
35 5 5 4 5 4 5 28 4.666667
36 4 4 5 4 5 4 26 4.333333
37 4 4 4 4 4 4 24 4
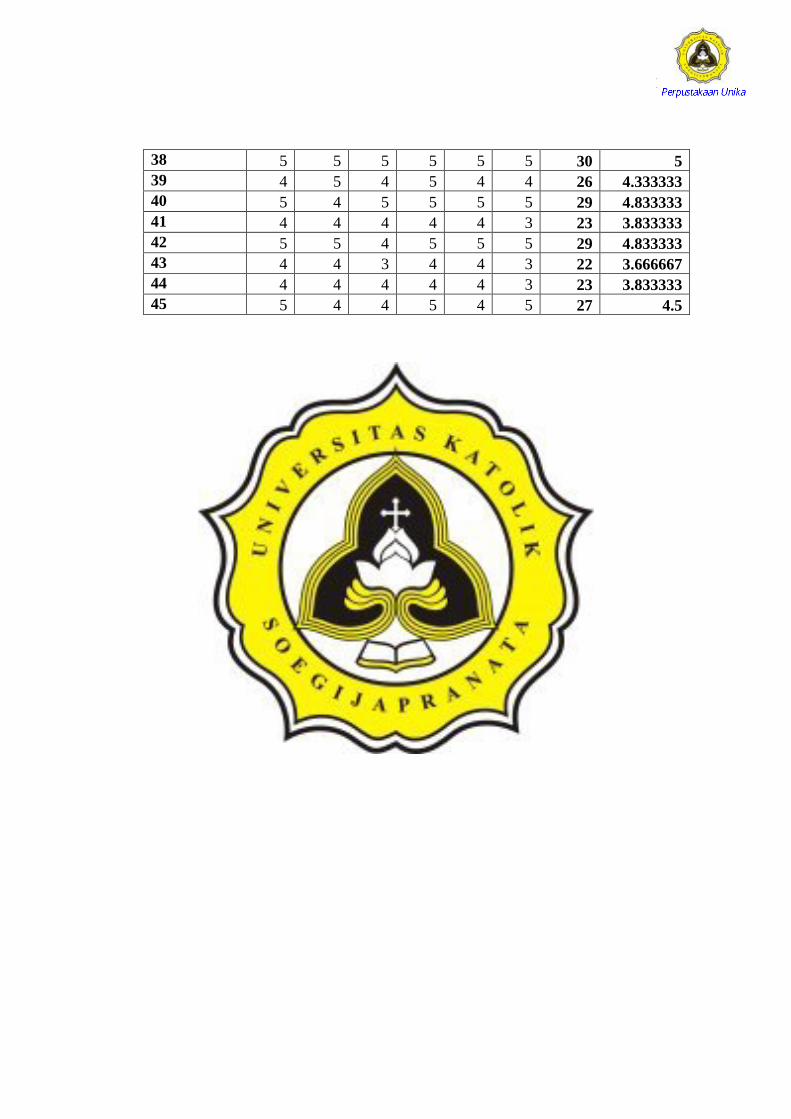
REKAPITULASI KUESIONER VARIABEL MOTIVASI
137
38 5 5 5 5 5 5 30 5
39 4 5 4 5 4 4 26 4.333333
40 5 4 5 5 5 5 29 4.833333
41 4 4 4 4 4 3 23 3.833333
42 5 5 4 5 5 5 29 4.833333
43 4 4 3 4 4 3 22 3.666667
44 4 4 4 4 4 3 23 3.833333
45 5 4 4 5 4 5 27 4.5

138
Lampiran 3
Output SPSS
139
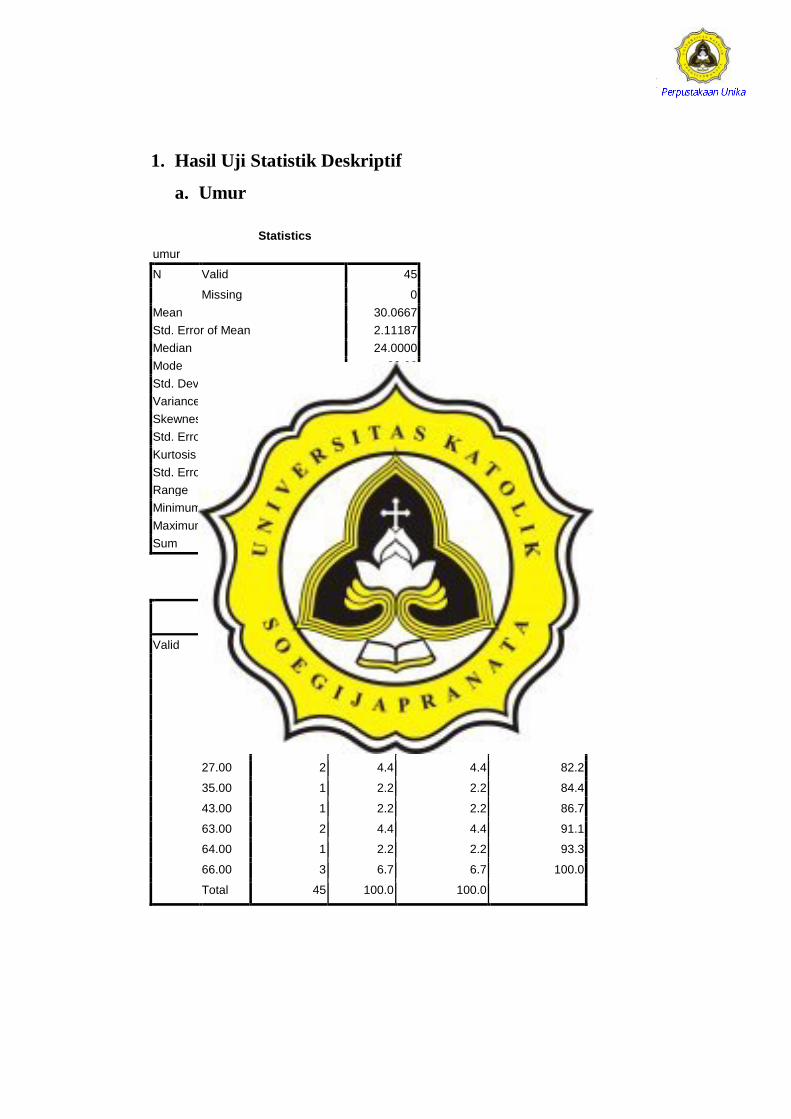
1. Hasil Uji Statistik Deskriptif
a. Umur
Statistics
umur
N Valid 45
Missing 0
Mean 30.0667
Std. Error of Mean 2.11187
Median 24.0000
Mode 23.00
Std. Deviation 14.16686
Variance 200.700
Skewness 2.027
Std. Error of Skewness .354
Kurtosis 2.459
Std. Error of Kurtosis .695
Range 45.00
Minimum 21.00
Maximum 66.00
Sum 1353.00
umur
Frequency Percent Valid Percent
Cumulative Percent
Valid 21.00 1 2.2 2.2 2.2
22.00 3 6.7 6.7 8.9
23.00 12 26.7 26.7 35.6
24.00 8 17.8 17.8 53.3
25.00 8 17.8 17.8 71.1
26.00 3 6.7 6.7 77.8
27.00 2 4.4 4.4 82.2
35.00 1 2.2 2.2 84.4
43.00 1 2.2 2.2 86.7
63.00 2 4.4 4.4 91.1
64.00 1 2.2 2.2 93.3
66.00 3 6.7 6.7 100.0
Total 45 100.0 100.0
140
Descriptive Statistics
N Minimum Maximum Mean Std. Deviation
Umur 45 21.00 66.00 30.0667 14.16686
Valid N (listwise) 45
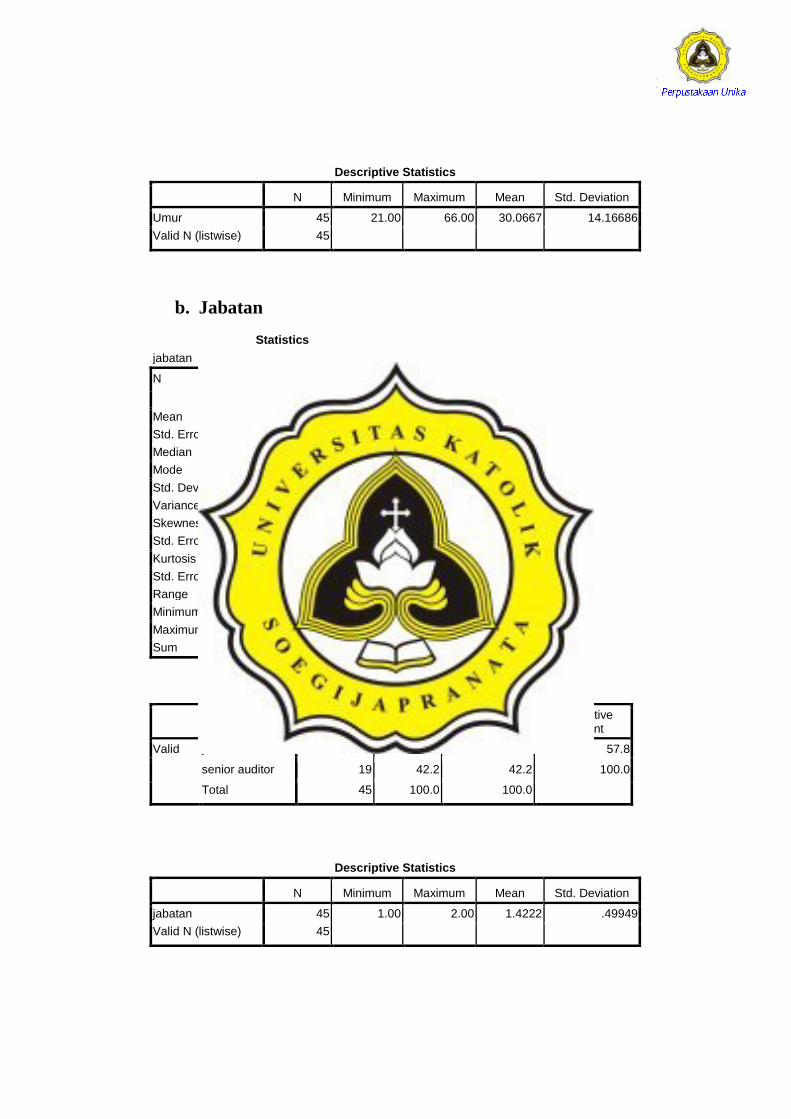
b. Jabatan
Statistics
jabatan
N Valid 45
Missing 0
Mean 1.4222
Std. Error of Mean .07446
Median 1.0000
Mode 1.00
Std. Deviation .49949
Variance .249
Skewness .326
Std. Error of Skewness .354
Kurtosis -1.984
Std. Error of Kurtosis .695
Range 1.00
Minimum 1.00
Maximum 2.00
Sum 64.00
jabatan
Frequency Percent Valid Percent
Cumulative Percent
Valid junior auditor 26 57.8 57.8 57.8
senior auditor 19 42.2 42.2 100.0
Total 45 100.0 100.0
Descriptive Statistics
N Minimum Maximum Mean Std. Deviation
jabatan 45 1.00 2.00 1.4222 .49949
Valid N (listwise) 45
141
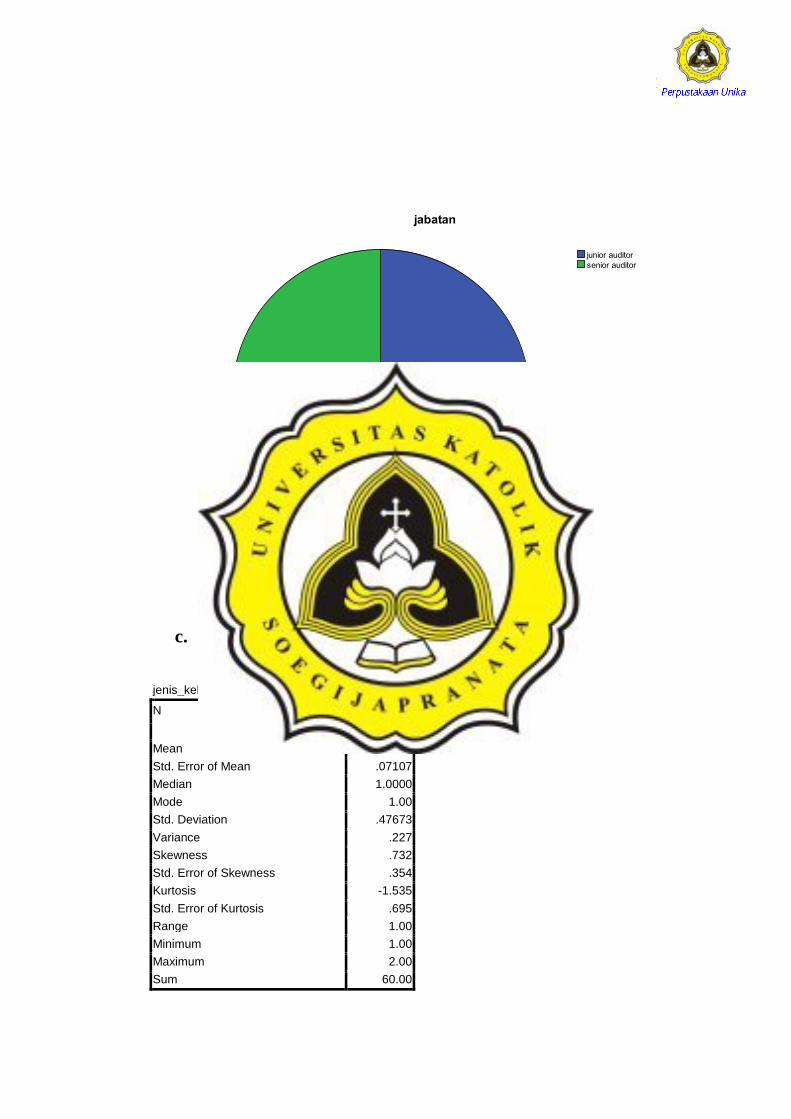
c. Jenis Kelamin
Statistics
jenis_kelamin
N Valid 45
Missing 0
Mean 1.3333
Std. Error of Mean .07107
Median 1.0000
Mode 1.00
Std. Deviation .47673
Variance .227
Skewness .732
Std. Error of Skewness .354
Kurtosis -1.535
Std. Error of Kurtosis .695
Range 1.00
Minimum 1.00
Maximum 2.00
Sum 60.00

142
jenis_kelamin
Frequency Percent Valid Percent
Cumulative Percent
Valid laki-laki 30 66.7 66.7 66.7
perempuan 15 33.3 33.3 100.0
Total 45 100.0 100.0
Descriptive Statistics
N Minimum Maximum Mean Std. Deviation
jenis_kelamin 45 1.00 2.00 1.3333 .47673
Valid N (listwise) 45
143
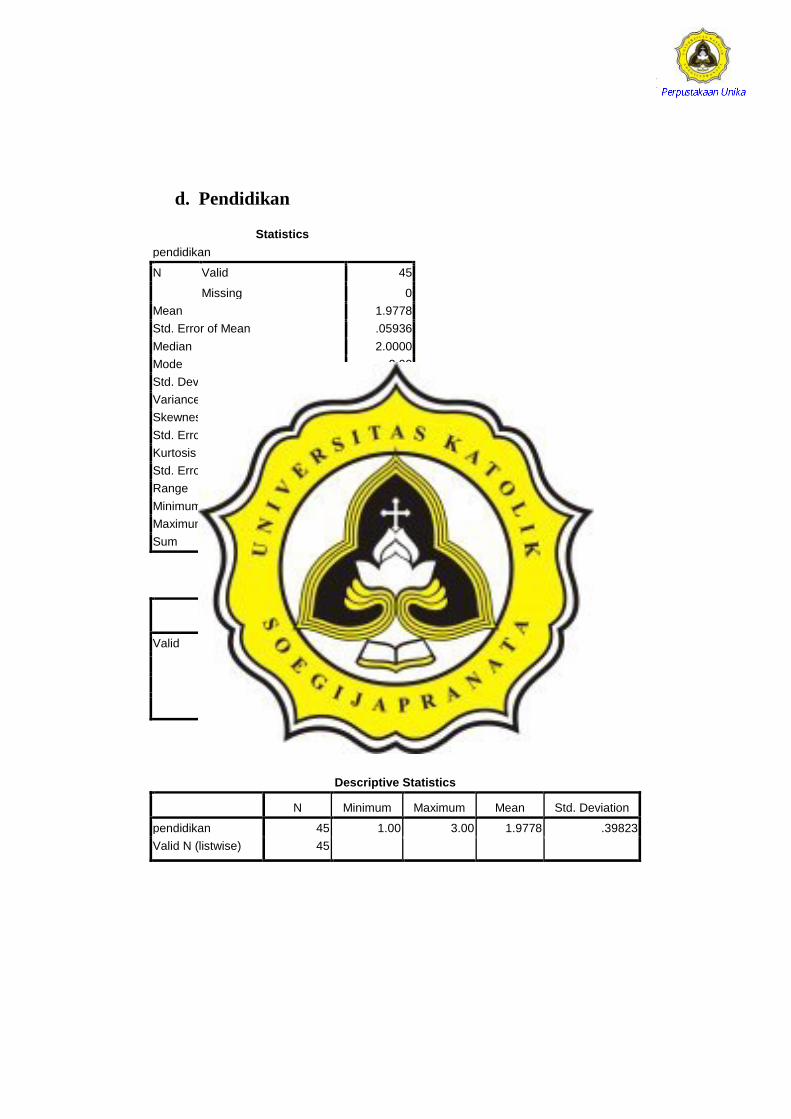
d. Pendidikan
Statistics
pendidikan
N Valid 45
Missing 0
Mean 1.9778
Std. Error of Mean .05936
Median 2.0000
Mode 2.00
Std. Deviation .39823
Variance .159
Skewness -.201
Std. Error of Skewness .354
Kurtosis 3.964
Std. Error of Kurtosis .695
Range 2.00
Minimum 1.00
Maximum 3.00
Sum 89.00
pendidikan
Frequency Percent Valid Percent
Cumulative Percent
Valid D3 4 8.9 8.9 8.9
S1 38 84.4 84.4 93.3
S2 3 6.7 6.7 100.0
Total 45 100.0 100.0
Descriptive Statistics
N Minimum Maximum Mean Std. Deviation
pendidikan 45 1.00 3.00 1.9778 .39823
Valid N (listwise) 45
144
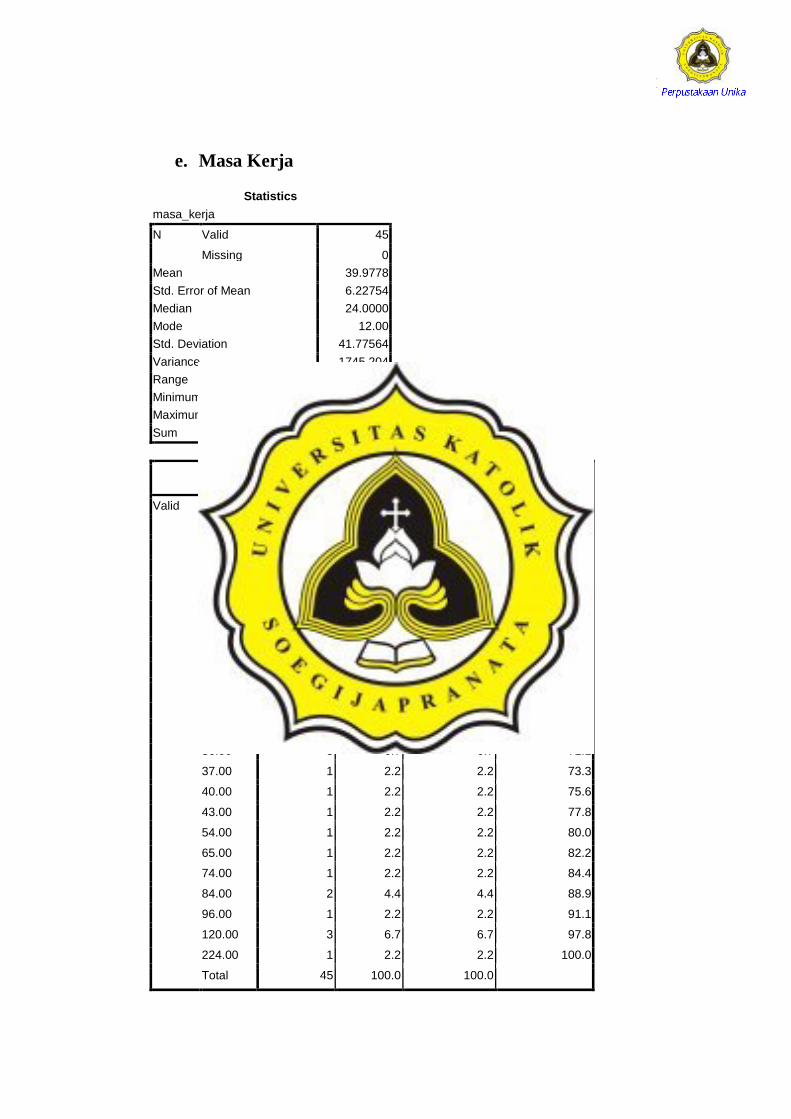
e. Masa Kerja
Statistics
masa_kerja
N Valid 45
Missing 0
Mean 39.9778
Std. Error of Mean 6.22754
Median 24.0000
Mode 12.00
Std. Deviation 41.77564
Variance 1745.204
Range 212.00
Minimum 12.00
Maximum 224.00
Sum 1799.00
masa_kerja
Frequency Percent Valid Percent
Cumulative Percent
Valid 12.00 10 22.2 22.2 22.2
14.00 1 2.2 2.2 24.4
15.00 1 2.2 2.2 26.7
17.00 1 2.2 2.2 28.9
18.00 3 6.7 6.7 35.6
19.00 1 2.2 2.2 37.8
20.00 3 6.7 6.7 44.4
24.00 5 11.1 11.1 55.6
25.00 1 2.2 2.2 57.8
26.00 1 2.2 2.2 60.0
27.00 1 2.2 2.2 62.2
33.00 1 2.2 2.2 64.4
36.00 3 6.7 6.7 71.1
37.00 1 2.2 2.2 73.3
40.00 1 2.2 2.2 75.6
43.00 1 2.2 2.2 77.8
54.00 1 2.2 2.2 80.0
65.00 1 2.2 2.2 82.2
74.00 1 2.2 2.2 84.4
84.00 2 4.4 4.4 88.9
96.00 1 2.2 2.2 91.1
120.00 3 6.7 6.7 97.8
224.00 1 2.2 2.2 100.0
Total 45 100.0 100.0
145
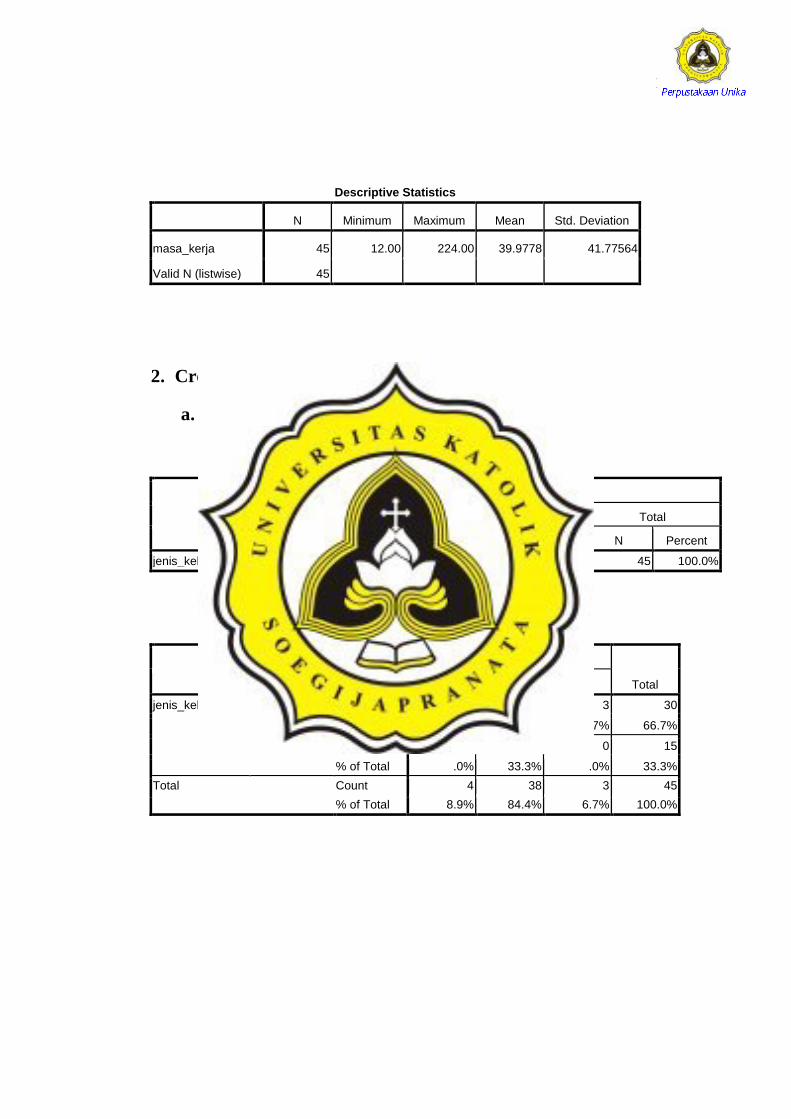
Descriptive Statistics
N Minimum Maximum Mean Std. Deviation
masa_kerja 45 12.00 224.00 39.9778 41.77564
Valid N (listwise) 45
2. Crosstab
a. Jenis kelamin dan Pendidikan
Case Processing Summary
Cases
Valid Missing Total
N Percent N Percent N Percent
jenis_kelamin * pendidikan 45 100.0% 0 .0% 45 100.0%
jenis_kelamin * pendidikan Crosstabulation
pendidikan
Total D3 S1 S2
jenis_kelamin laki-laki Count 4 23 3 30
% of Total 8.9% 51.1% 6.7% 66.7%
perempuan Count 0 15 0 15
% of Total .0% 33.3% .0% 33.3%
Total Count 4 38 3 45
% of Total 8.9% 84.4% 6.7% 100.0%
146
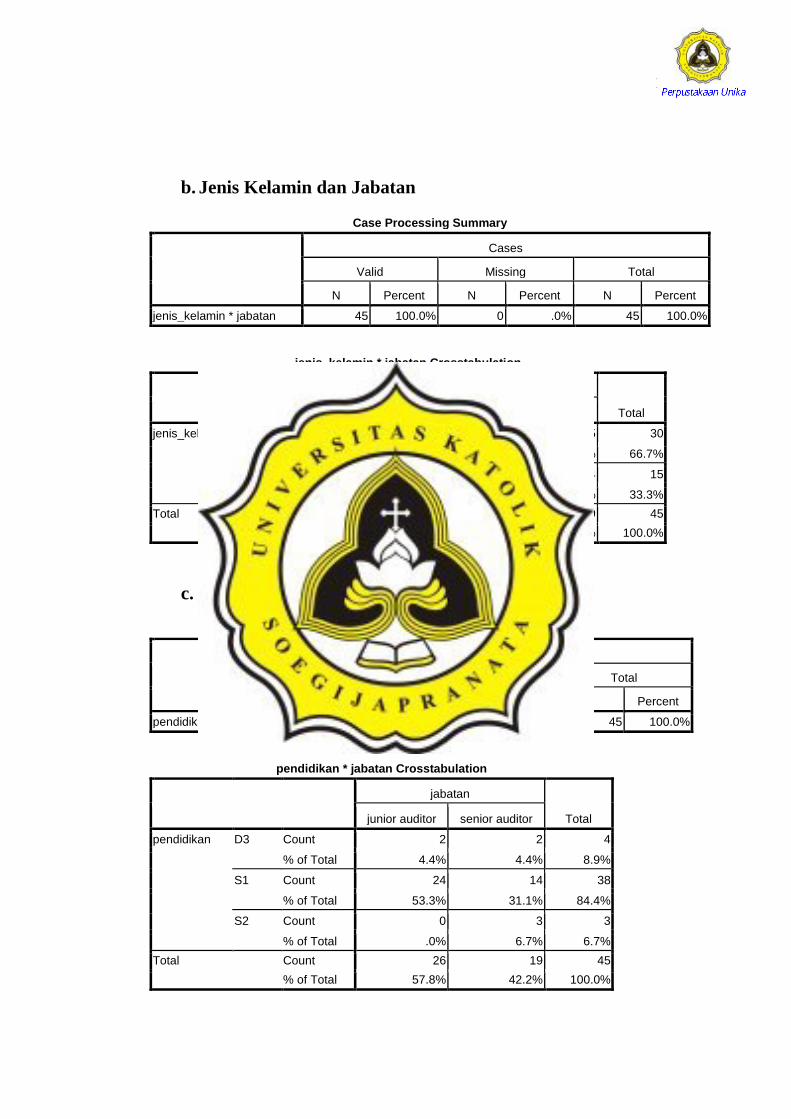
b. Jenis Kelamin dan Jabatan
Case Processing Summary
Cases
Valid Missing Total
N Percent N Percent N Percent
jenis_kelamin * jabatan 45 100.0% 0 .0% 45 100.0%
jenis_kelamin * jabatan Crosstabulation
jabatan
Total junior auditor senior auditor
jenis_kelamin laki-laki Count 15 15 30
% of Total 33.3% 33.3% 66.7%
perempuan Count 11 4 15
% of Total 24.4% 8.9% 33.3%
Total Count 26 19 45
% of Total 57.8% 42.2% 100.0%
c. Pendidikan dan Jabatan
Case Processing Summary
Cases
Valid Missing Total
N Percent N Percent N Percent
pendidikan * jabatan 45 100.0% 0 .0% 45 100.0%
pendidikan * jabatan Crosstabulation
jabatan
Total junior auditor senior auditor
pendidikan D3 Count 2 2 4
% of Total 4.4% 4.4% 8.9%
S1 Count 24 14 38
% of Total 53.3% 31.1% 84.4%
S2 Count 0 3 3
% of Total .0% 6.7% 6.7%
Total Count 26 19 45
% of Total 57.8% 42.2% 100.0%
147
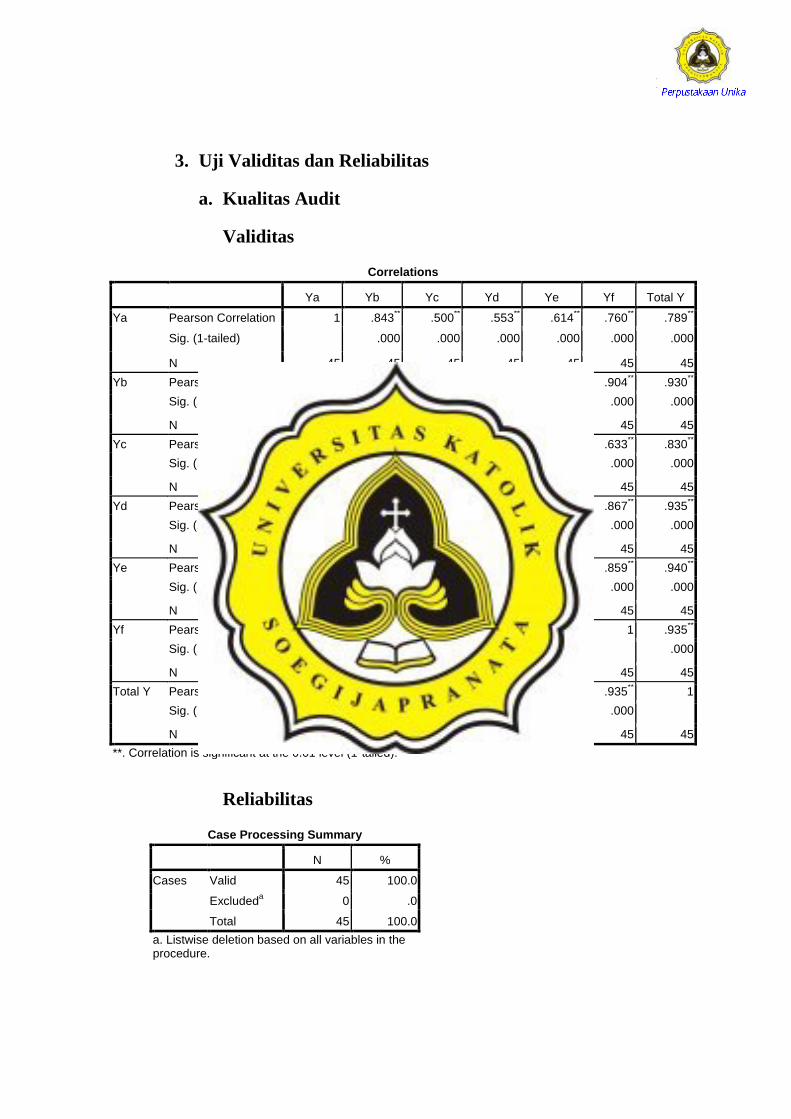
3. Uji Validitas dan Reliabilitas
a. Kualitas Audit
Validitas
Correlations
Ya Yb Yc Yd Ye Yf Total Y
Ya Pearson Correlation 1 .843** .500
** .553
** .614
** .760
** .789
**
Sig. (1-tailed) .000 .000 .000 .000 .000 .000
N 45 45 45 45 45 45 45
Yb Pearson Correlation .843** 1 .629
** .777
** .854
** .904
** .930
**
Sig. (1-tailed) .000 .000 .000 .000 .000 .000
N 45 45 45 45 45 45 45
Yc Pearson Correlation .500** .629
** 1 .871
** .782
** .633
** .830
**
Sig. (1-tailed) .000 .000 .000 .000 .000 .000
N 45 45 45 45 45 45 45
Yd Pearson Correlation .553** .777
** .871
** 1 .916
** .867
** .935
**
Sig. (1-tailed) .000 .000 .000 .000 .000 .000
N 45 45 45 45 45 45 45
Ye Pearson Correlation .614** .854
** .782
** .916
** 1 .859
** .940
**
Sig. (1-tailed) .000 .000 .000 .000 .000 .000
N 45 45 45 45 45 45 45
Yf Pearson Correlation .760** .904
** .633
** .867
** .859
** 1 .935
**
Sig. (1-tailed) .000 .000 .000 .000 .000 .000
N 45 45 45 45 45 45 45
Total Y Pearson Correlation .789** .930
** .830
** .935
** .940
** .935
** 1
Sig. (1-tailed) .000 .000 .000 .000 .000 .000
N 45 45 45 45 45 45 45
**. Correlation is significant at the 0.01 level (1-tailed).
Reliabilitas
Case Processing Summary
N %
Cases Valid 45 100.0
Excludeda 0 .0
Total 45 100.0
a. Listwise deletion based on all variables in the procedure.
148
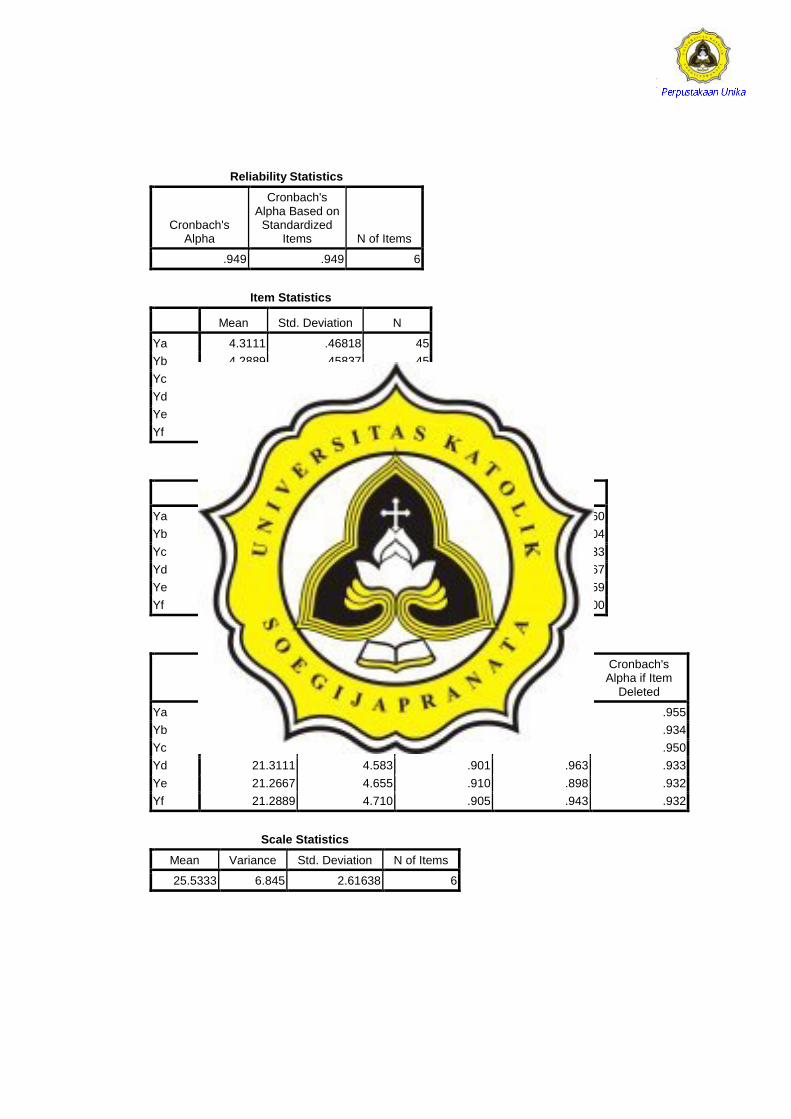
Reliability Statistics
Cronbach's Alpha
Cronbach's Alpha Based on
Standardized Items N of Items
.949 .949 6
Item Statistics
Mean Std. Deviation N
Ya 4.3111 .46818 45
Yb 4.2889 .45837 45
Yc 4.2000 .50452 45
Yd 4.2222 .51737 45
Ye 4.2667 .49543 45
Yf 4.2444 .48409 45
Inter-Item Correlation Matrix
Ya Yb Yc Yd Ye Yf
Ya 1.000 .843 .500 .553 .614 .760
Yb .843 1.000 .629 .777 .854 .904
Yc .500 .629 1.000 .871 .782 .633
Yd .553 .777 .871 1.000 .916 .867
Ye .614 .854 .782 .916 1.000 .859
Yf .760 .904 .633 .867 .859 1.000
Item-Total Statistics
Scale Mean if Item Deleted
Scale Variance if Item Deleted
Corrected Item-Total Correlation
Squared Multiple Correlation
Cronbach's Alpha if Item
Deleted
Ya 21.2222 5.131 .705 .824 .955
Yb 21.2444 4.825 .899 .912 .934
Yc 21.3333 4.909 .752 .884 .950
Yd 21.3111 4.583 .901 .963 .933
Ye 21.2667 4.655 .910 .898 .932
Yf 21.2889 4.710 .905 .943 .932
Scale Statistics
Mean Variance Std. Deviation N of Items
25.5333 6.845 2.61638 6
149
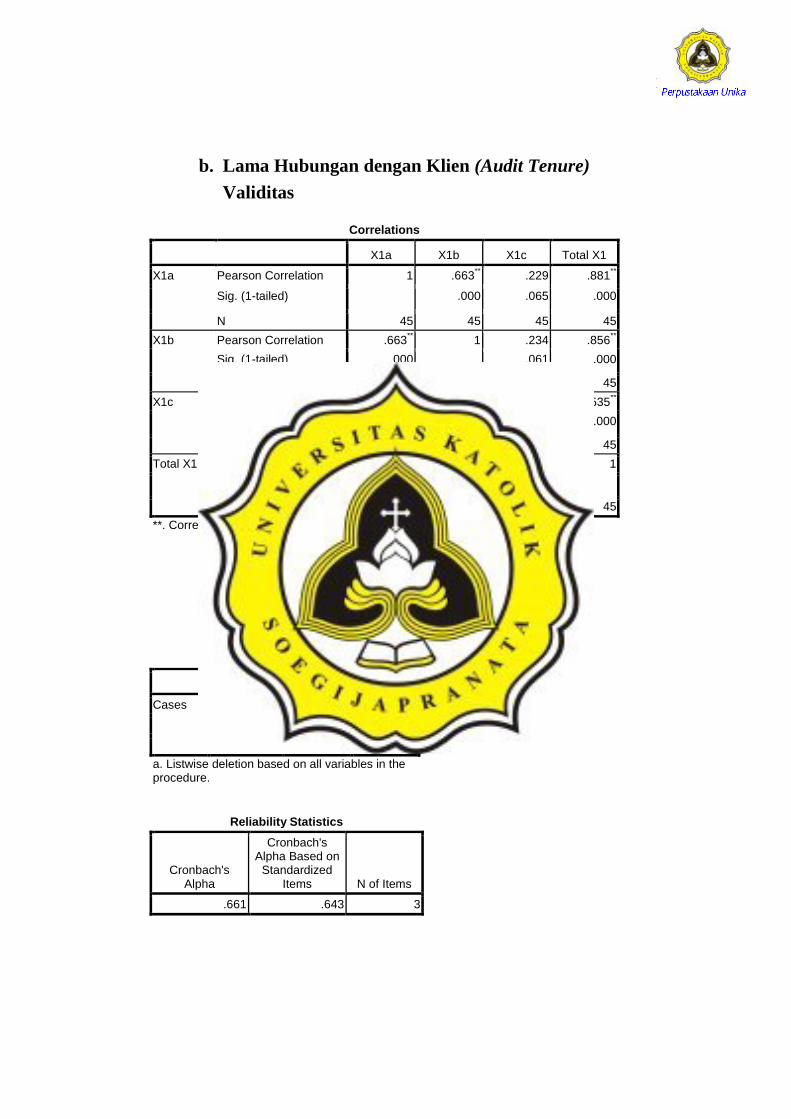
b. Lama Hubungan dengan Klien (Audit Tenure)
Validitas
Correlations
X1a X1b X1c Total X1
X1a Pearson Correlation 1 .663** .229 .881
**
Sig. (1-tailed) .000 .065 .000
N 45 45 45 45
X1b Pearson Correlation .663** 1 .234 .856
**
Sig. (1-tailed) .000 .061 .000
N 45 45 45 45
X1c Pearson Correlation .229 .234 1 .535**
Sig. (1-tailed) .065 .061 .000
N 45 45 45 45
Total X1 Pearson Correlation .881** .856
** .535
** 1
Sig. (1-tailed) .000 .000 .000
N 45 45 45 45
**. Correlation is significant at the 0.01 level (1-tailed).
Reliabilitas
Case Processing Summary
N %
Cases Valid 45 100.0
Excludeda 0 .0
Total 45 100.0
a. Listwise deletion based on all variables in the procedure.
Reliability Statistics
Cronbach's Alpha
Cronbach's Alpha Based on
Standardized Items N of Items
.661 .643 3
150
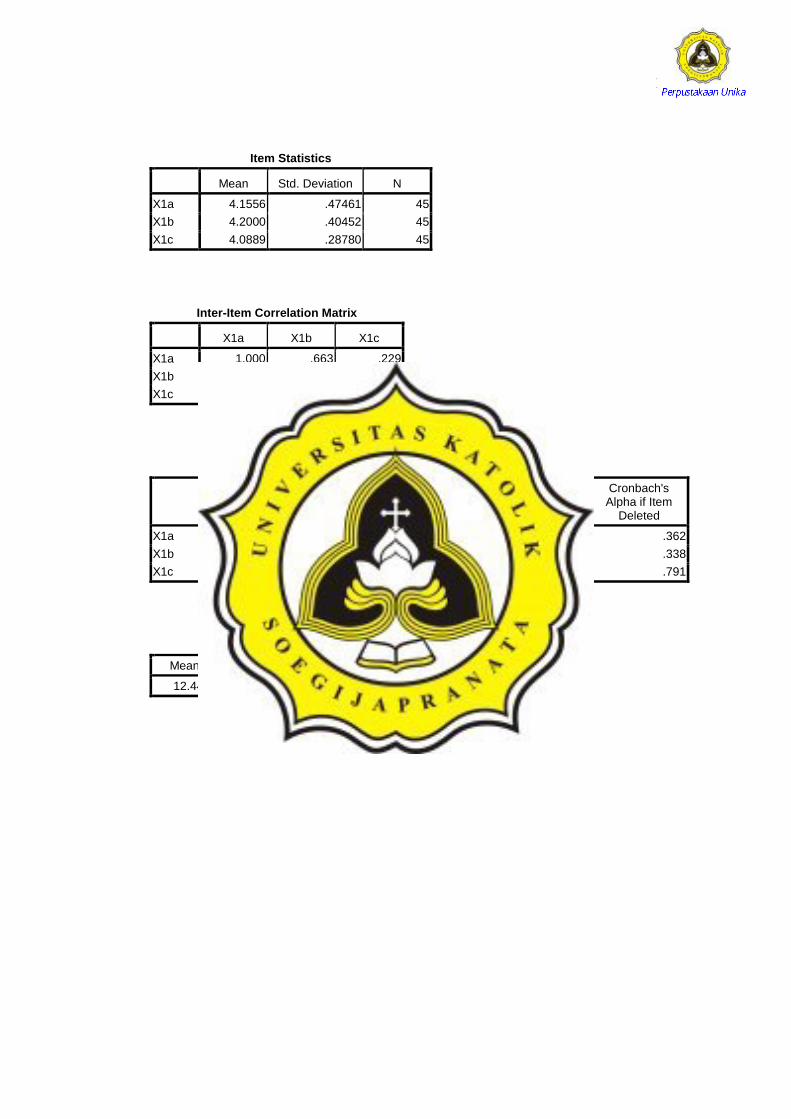
Item Statistics
Mean Std. Deviation N
X1a 4.1556 .47461 45
X1b 4.2000 .40452 45
X1c 4.0889 .28780 45
Inter-Item Correlation Matrix
X1a X1b X1c
X1a 1.000 .663 .229
X1b .663 1.000 .234
X1c .229 .234 1.000
Item-Total Statistics
Scale Mean if Item Deleted
Scale Variance if Item Deleted
Corrected Item-Total Correlation
Squared Multiple Correlation
Cronbach's Alpha if Item
Deleted
X1a 8.2889 .301 .609 .445 .362
X1b 8.2444 .371 .627 .447 .338
X1c 8.3556 .643 .254 .065 .791
Scale Statistics
Mean Variance Std. Deviation N of Items
12.4444 .843 .91839 3
151
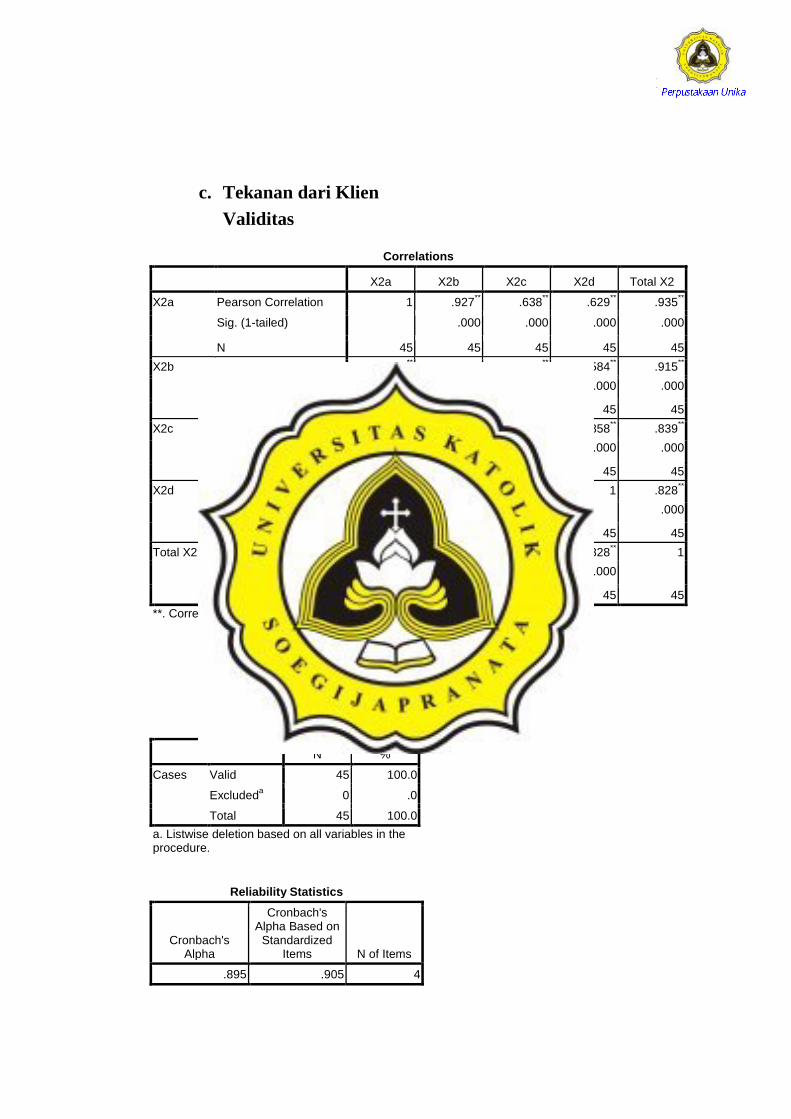
c. Tekanan dari Klien
Validitas
Correlations
X2a X2b X2c X2d Total X2
X2a Pearson Correlation 1 .927** .638
** .629
** .935
**
Sig. (1-tailed) .000 .000 .000 .000
N 45 45 45 45 45
X2b Pearson Correlation .927** 1 .596
** .584
** .915
**
Sig. (1-tailed) .000 .000 .000 .000
N 45 45 45 45 45
X2c Pearson Correlation .638** .596
** 1 .858
** .839
**
Sig. (1-tailed) .000 .000 .000 .000
N 45 45 45 45 45
X2d Pearson Correlation .629** .584
** .858
** 1 .828
**
Sig. (1-tailed) .000 .000 .000 .000
N 45 45 45 45 45
Total X2 Pearson Correlation .935** .915
** .839
** .828
** 1
Sig. (1-tailed) .000 .000 .000 .000
N 45 45 45 45 45
**. Correlation is significant at the 0.01 level (1-tailed).
Reliabilitas
Case Processing Summary
N %
Cases Valid 45 100.0
Excludeda 0 .0
Total 45 100.0
a. Listwise deletion based on all variables in the procedure.
Reliability Statistics
Cronbach's Alpha
Cronbach's Alpha Based on
Standardized Items N of Items
.895 .905 4
152
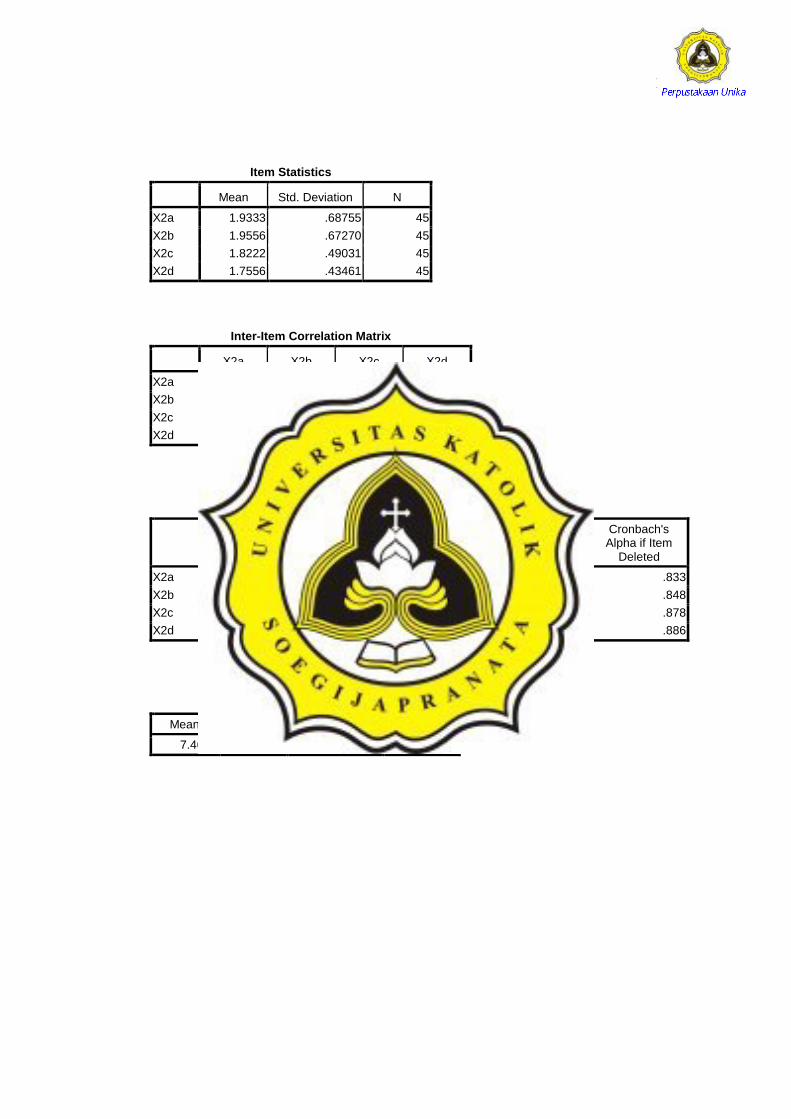
Item Statistics
Mean Std. Deviation N
X2a 1.9333 .68755 45
X2b 1.9556 .67270 45
X2c 1.8222 .49031 45
X2d 1.7556 .43461 45
Inter-Item Correlation Matrix
X2a X2b X2c X2d
X2a 1.000 .927 .638 .629
X2b .927 1.000 .596 .584
X2c .638 .596 1.000 .858
X2d .629 .584 .858 1.000
Item-Total Statistics
Scale Mean if Item Deleted
Scale Variance if Item Deleted
Corrected Item-Total Correlation
Squared Multiple Correlation
Cronbach's Alpha if Item
Deleted
X2a 5.5333 1.982 .859 .872 .833
X2b 5.5111 2.074 .822 .860 .848
X2c 5.6444 2.689 .739 .752 .878
X2d 5.7111 2.846 .738 .747 .886
Scale Statistics
Mean Variance Std. Deviation N of Items
7.4667 4.118 2.02933 4
153
d. Telaah dari Rekan Auditor (Peer Review)
Validitas
Correlations
X3a X3b X3c x3d Total X3
X3a Pearson Correlation 1 .008 .165 .208 .449**
Sig. (1-tailed) .480 .139 .086 .001
N 45 45 45 45 45
X3b Pearson Correlation .008 1 .726** .675
** .787
**
Sig. (1-tailed) .480 .000 .000 .000
N 45 45 45 45 45
X3c Pearson Correlation .165 .726** 1 .917
** .916
**
Sig. (1-tailed) .139 .000 .000 .000
N 45 45 45 45 45
x3d Pearson Correlation .208 .675** .917
** 1 .913
**
Sig. (1-tailed) .086 .000 .000 .000
N 45 45 45 45 45
Total X3 Pearson Correlation .449** .787
** .916
** .913
** 1
Sig. (1-tailed) .001 .000 .000 .000
N 45 45 45 45 45
**. Correlation is significant at the 0.01 level (1-tailed).
Reliabilitas
Case Processing Summary
N %
Cases Valid 45 100.0
Excludeda 0 .0
Total 45 100.0
a. Listwise deletion based on all variables in the procedure.
Reliability Statistics
Cronbach's Alpha
Cronbach's Alpha Based on
Standardized Items N of Items
.766 .766 4
154
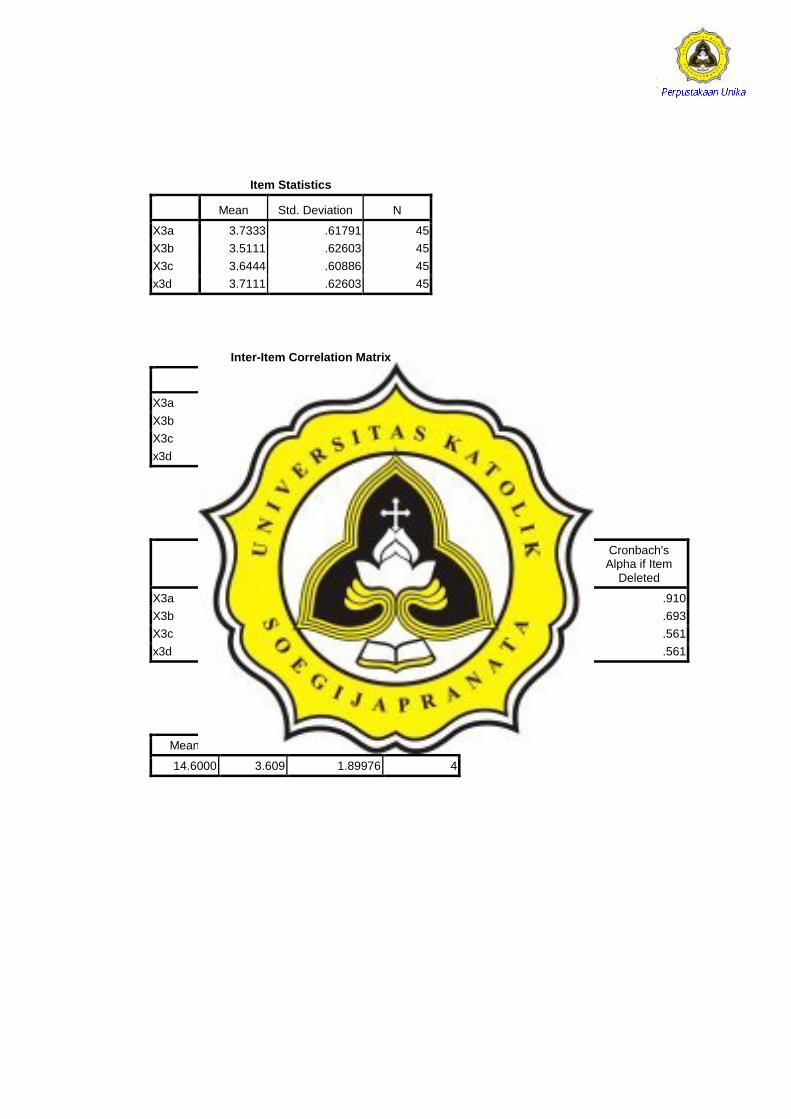
Item Statistics
Mean Std. Deviation N
X3a 3.7333 .61791 45
X3b 3.5111 .62603 45
X3c 3.6444 .60886 45
x3d 3.7111 .62603 45
Inter-Item Correlation Matrix
X3a X3b X3c x3d
X3a 1.000 .008 .165 .208
X3b .008 1.000 .726 .675
X3c .165 .726 1.000 .917
x3d .208 .675 .917 1.000
Item-Total Statistics
Scale Mean if Item Deleted
Scale Variance if Item Deleted
Corrected Item-Total Correlation
Squared Multiple Correlation
Cronbach's Alpha if Item
Deleted
X3a 10.8667 2.936 .137 .075 .910
X3b 11.0889 2.128 .596 .542 .693
X3c 10.9556 1.862 .829 .862 .561
x3d 10.8889 1.828 .820 .845 .561
Scale Statistics
Mean Variance Std. Deviation N of Items
14.6000 3.609 1.89976 4
155
e. Jasa Non Audit
Validitas
Correlations
X4a X4b x4c Total X4
X4a Pearson Correlation 1 .709** .656
** .885
**
Sig. (1-tailed) .000 .000 .000
N 45 45 45 45
X4b Pearson Correlation .709** 1 .750
** .912
**
Sig. (1-tailed) .000 .000 .000
N 45 45 45 45
x4c Pearson Correlation .656** .750
** 1 .893
**
Sig. (1-tailed) .000 .000 .000
N 45 45 45 45
Total X4 Pearson Correlation .885** .912
** .893
** 1
Sig. (1-tailed) .000 .000 .000
N 45 45 45 45
**. Correlation is significant at the 0.01 level (1-tailed).
Reliabilitas
Case Processing Summary
N %
Cases Valid 45 100.0
Excludeda 0 .0
Total 45 100.0
a. Listwise deletion based on all variables in the procedure.
Reliability Statistics
Cronbach's Alpha
Cronbach's Alpha Based on
Standardized Items N of Items
.877 .878 3
156
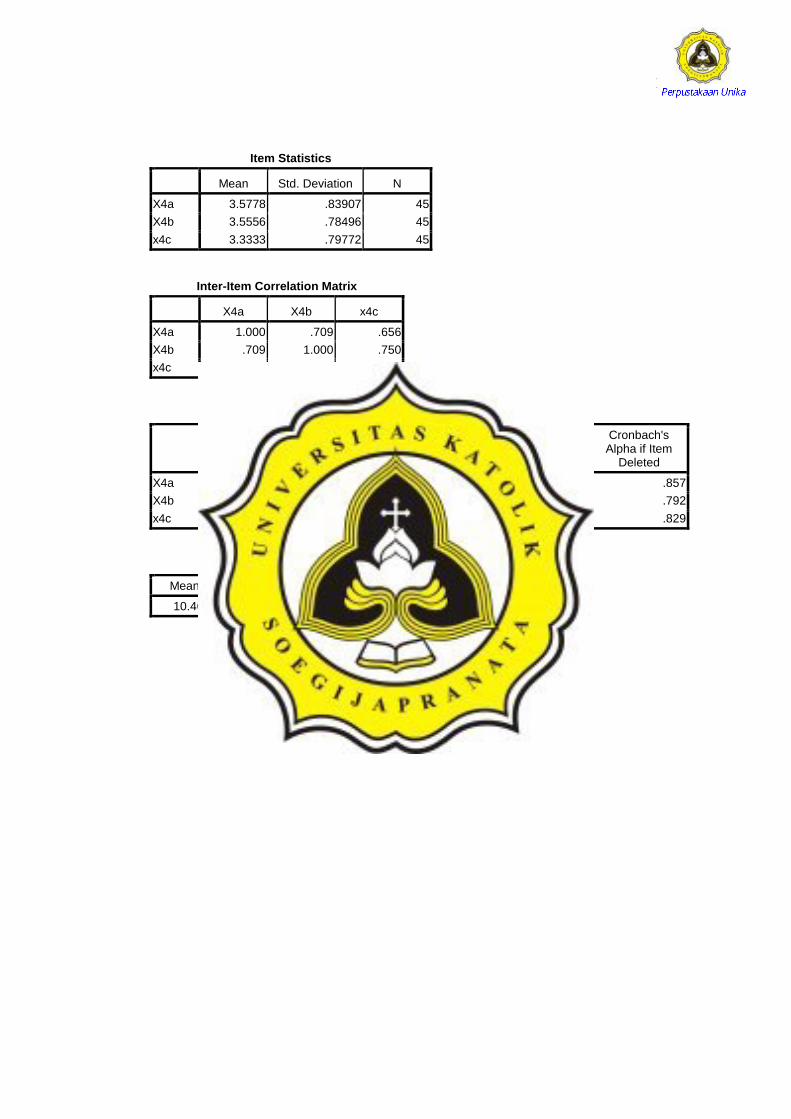
Item Statistics
Mean Std. Deviation N
X4a 3.5778 .83907 45
X4b 3.5556 .78496 45
x4c 3.3333 .79772 45
Inter-Item Correlation Matrix
X4a X4b x4c
X4a 1.000 .709 .656
X4b .709 1.000 .750
x4c .656 .750 1.000
Item-Total Statistics
Scale Mean if Item Deleted
Scale Variance if Item Deleted
Corrected Item-Total Correlation
Squared Multiple Correlation
Cronbach's Alpha if Item
Deleted
X4a 6.8889 2.192 .730 .538 .857
X4b 6.9111 2.219 .801 .645 .792
x4c 7.1333 2.255 .759 .594 .829
Scale Statistics
Mean Variance Std. Deviation N of Items
10.4667 4.709 2.17004 3
157
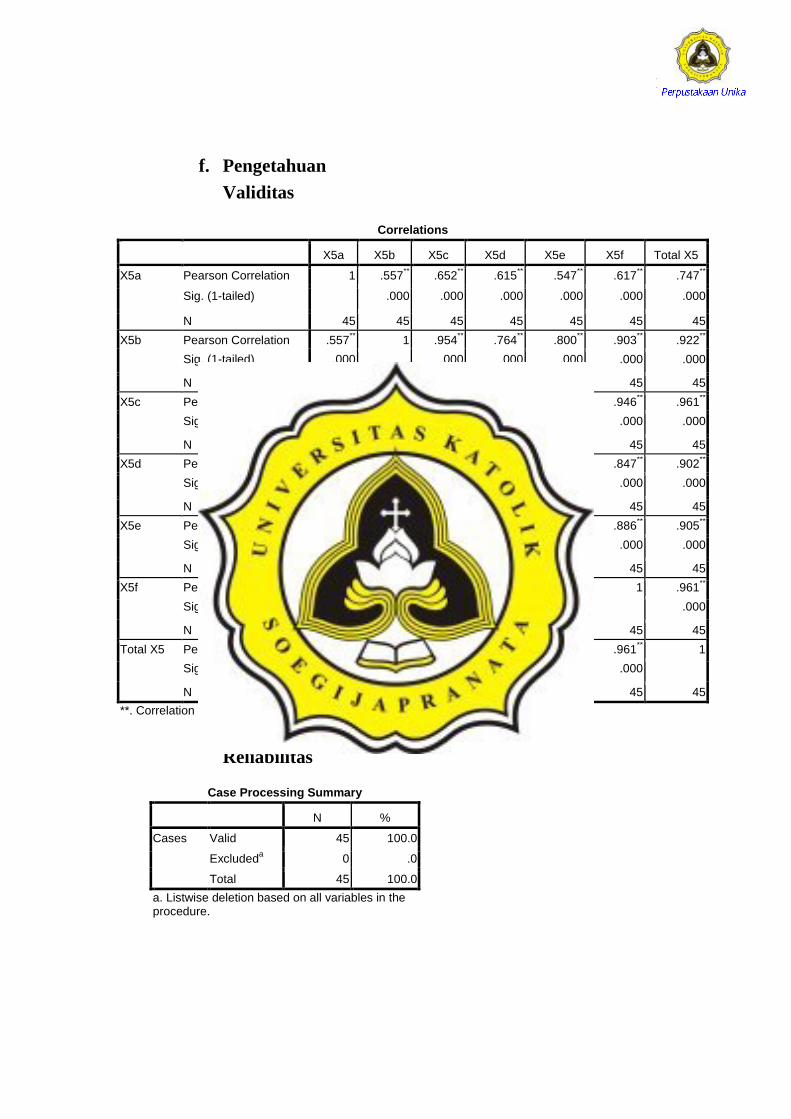
f. Pengetahuan
Validitas
Correlations
X5a X5b X5c X5d X5e X5f Total X5
X5a Pearson Correlation 1 .557** .652
** .615
** .547
** .617
** .747
**
Sig. (1-tailed) .000 .000 .000 .000 .000 .000
N 45 45 45 45 45 45 45
X5b Pearson Correlation .557** 1 .954
** .764
** .800
** .903
** .922
**
Sig. (1-tailed) .000 .000 .000 .000 .000 .000
N 45 45 45 45 45 45 45
X5c Pearson Correlation .652** .954
** 1 .801
** .839
** .946
** .961
**
Sig. (1-tailed) .000 .000 .000 .000 .000 .000
N 45 45 45 45 45 45 45
X5d Pearson Correlation .615** .764
** .801
** 1 .844
** .847
** .902
**
Sig. (1-tailed) .000 .000 .000 .000 .000 .000
N 45 45 45 45 45 45 45
X5e Pearson Correlation .547** .800
** .839
** .844
** 1 .886
** .905
**
Sig. (1-tailed) .000 .000 .000 .000 .000 .000
N 45 45 45 45 45 45 45
X5f Pearson Correlation .617** .903
** .946
** .847
** .886
** 1 .961
**
Sig. (1-tailed) .000 .000 .000 .000 .000 .000
N 45 45 45 45 45 45 45
Total X5 Pearson Correlation .747** .922
** .961
** .902
** .905
** .961
** 1
Sig. (1-tailed) .000 .000 .000 .000 .000 .000
N 45 45 45 45 45 45 45
**. Correlation is significant at the 0.01 level (1-tailed).
Reliabilitas
Case Processing Summary
N %
Cases Valid 45 100.0
Excludeda 0 .0
Total 45 100.0
a. Listwise deletion based on all variables in the procedure.
158
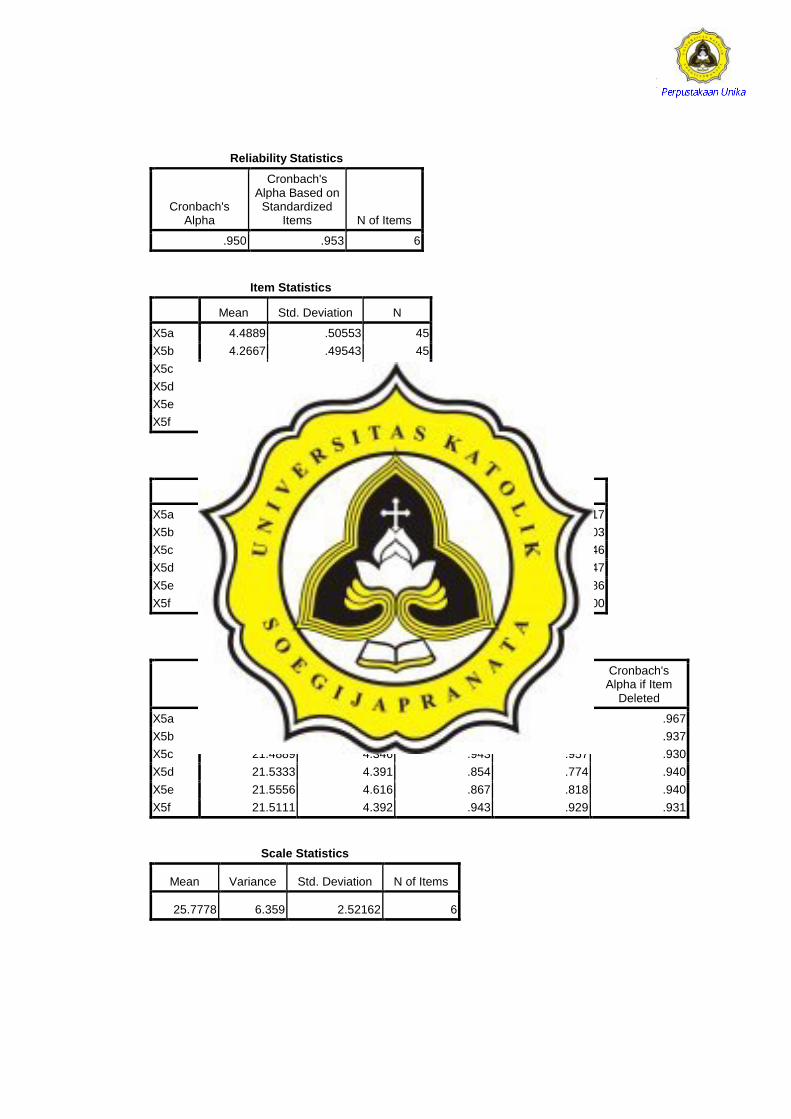
Reliability Statistics
Cronbach's Alpha
Cronbach's Alpha Based on
Standardized Items N of Items
.950 .953 6
Item Statistics
Mean Std. Deviation N
X5a 4.4889 .50553 45
X5b 4.2667 .49543 45
X5c 4.2889 .45837 45
X5d 4.2444 .48409 45
X5e 4.2222 .42044 45
X5f 4.2667 .44721 45
Inter-Item Correlation Matrix
X5a X5b X5c X5d X5e X5f
X5a 1.000 .557 .652 .615 .547 .617
X5b .557 1.000 .954 .764 .800 .903
X5c .652 .954 1.000 .801 .839 .946
X5d .615 .764 .801 1.000 .844 .847
X5e .547 .800 .839 .844 1.000 .886
X5f .617 .903 .946 .847 .886 1.000
Item-Total Statistics
Scale Mean if Item Deleted
Scale Variance if Item Deleted
Corrected Item-Total Correlation
Squared Multiple Correlation
Cronbach's Alpha if Item
Deleted
X5a 21.2889 4.710 .635 .508 .967
X5b 21.5111 4.301 .882 .918 .937
X5c 21.4889 4.346 .943 .957 .930
X5d 21.5333 4.391 .854 .774 .940
X5e 21.5556 4.616 .867 .818 .940
X5f 21.5111 4.392 .943 .929 .931
Scale Statistics
Mean Variance Std. Deviation N of Items
25.7778 6.359 2.52162 6
159
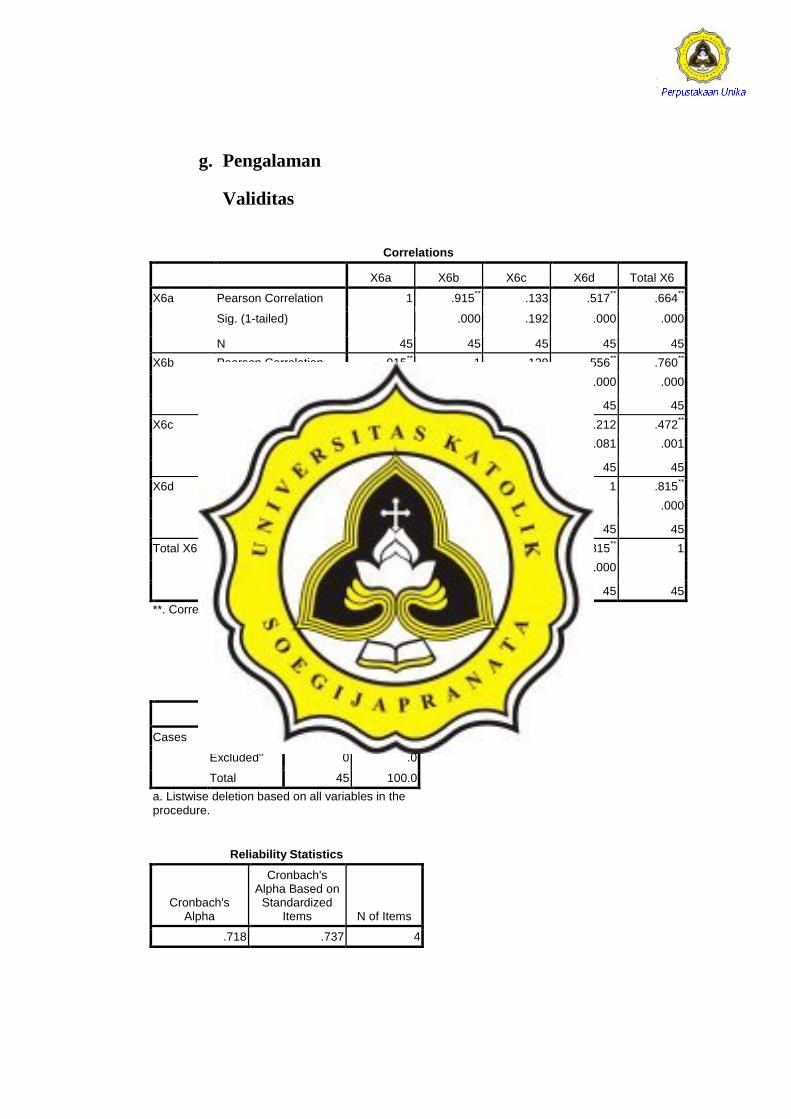
g. Pengalaman
Validitas
Correlations
X6a X6b X6c X6d Total X6
X6a Pearson Correlation 1 .915** .133 .517
** .664
**
Sig. (1-tailed) .000 .192 .000 .000
N 45 45 45 45 45
X6b Pearson Correlation .915** 1 .139 .556
** .760
**
Sig. (1-tailed) .000 .181 .000 .000
N 45 45 45 45 45
X6c Pearson Correlation .133 .139 1 .212 .472**
Sig. (1-tailed) .192 .181 .081 .001
N 45 45 45 45 45
X6d Pearson Correlation .517** .556
** .212 1 .815
**
Sig. (1-tailed) .000 .000 .081 .000
N 45 45 45 45 45
Total X6 Pearson Correlation .664** .760
** .472
** .815
** 1
Sig. (1-tailed) .000 .000 .001 .000
N 45 45 45 45 45
**. Correlation is significant at the 0.01 level (1-tailed).
Reliabilitas
Case Processing Summary
N %
Cases Valid 45 100.0
Excludeda 0 .0
Total 45 100.0
a. Listwise deletion based on all variables in the procedure.
Reliability Statistics
Cronbach's Alpha
Cronbach's Alpha Based on
Standardized Items N of Items
.718 .737 4
160
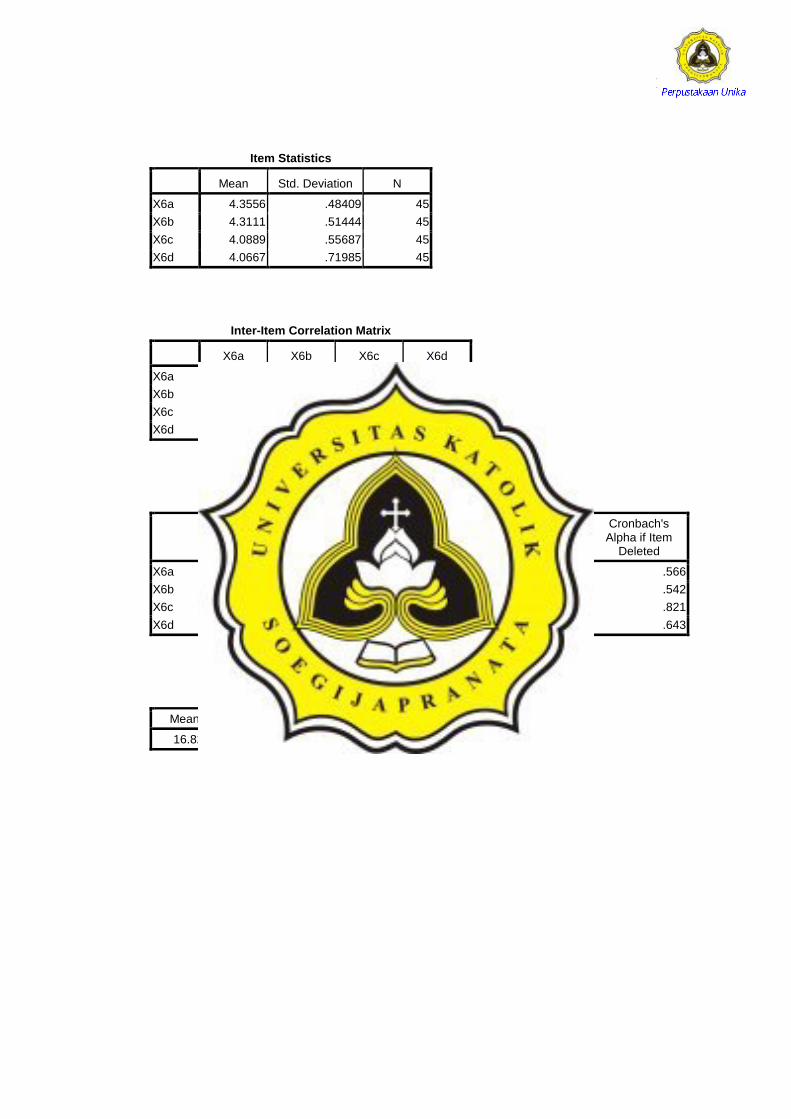
Item Statistics
Mean Std. Deviation N
X6a 4.3556 .48409 45
X6b 4.3111 .51444 45
X6c 4.0889 .55687 45
X6d 4.0667 .71985 45
Inter-Item Correlation Matrix
X6a X6b X6c X6d
X6a 1.000 .915 .133 .517
X6b .915 1.000 .139 .556
X6c .133 .139 1.000 .212
X6d .517 .556 .212 1.000
Item-Total Statistics
Scale Mean if Item Deleted
Scale Variance if Item Deleted
Corrected Item-Total Correlation
Squared Multiple Correlation
Cronbach's Alpha if Item
Deleted
X6a 12.4667 1.755 .692 .837 .566
X6b 12.5111 1.665 .714 .846 .542
X6c 12.7333 2.245 .192 .046 .821
X6d 12.7556 1.416 .550 .328 .643
Scale Statistics
Mean Variance Std. Deviation N of Items
16.8222 2.877 1.69610 4

161
h. Tekanan Anggaran Waktu
Validitas
Correlations
X7a X7b X7c X7d Total X7
X7a Pearson Correlation 1 .310* .105 .220 .613
**
Sig. (1-tailed) .019 .247 .073 .000
N 45 45 45 45 45
X7b Pearson Correlation .310* 1 .254
* .410
** .639
**
Sig. (1-tailed) .019 .046 .003 .000
N 45 45 45 45 45
X7c Pearson Correlation .105 .254* 1 .369
** .728
**
Sig. (1-tailed) .247 .046 .006 .000
N 45 45 45 45 45
X7d Pearson Correlation .220 .410** .369
** 1 .694
**
Sig. (1-tailed) .073 .003 .006 .000
N 45 45 45 45 45
Total X7 Pearson Correlation .613** .639
** .728
** .694
** 1
Sig. (1-tailed) .000 .000 .000 .000
N 45 45 45 45 45
*. Correlation is significant at the 0.05 level (1-tailed).
**. Correlation is significant at the 0.01 level (1-tailed).
Reliabilitas
Case Processing Summary
N %
Cases Valid 45 100.0
Excludeda 0 .0
Total 45 100.0
a. Listwise deletion based on all variables in the procedure.
Reliability Statistics
Cronbach's Alpha
Cronbach's Alpha Based on
Standardized Items N of Items
.550 .606 4
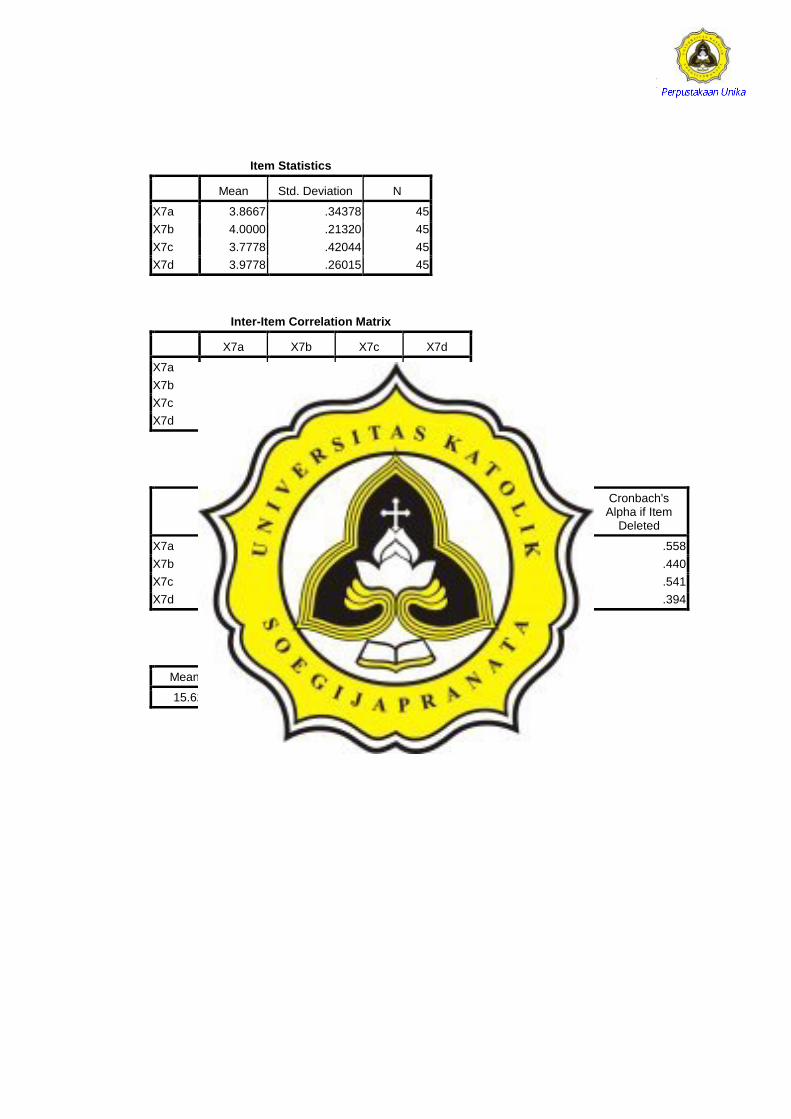
162
Item Statistics
Mean Std. Deviation N
X7a 3.8667 .34378 45
X7b 4.0000 .21320 45
X7c 3.7778 .42044 45
X7d 3.9778 .26015 45
Inter-Item Correlation Matrix
X7a X7b X7c X7d
X7a 1.000 .310 .105 .220
X7b .310 1.000 .254 .410
X7c .105 .254 1.000 .369
X7d .220 .410 .369 1.000
Item-Total Statistics
Scale Mean if Item Deleted
Scale Variance if Item Deleted
Corrected Item-Total Correlation
Squared Multiple Correlation
Cronbach's Alpha if Item
Deleted
X7a 11.7556 .462 .247 .107 .558
X7b 11.6222 .513 .446 .230 .440
X7c 11.8444 .362 .310 .149 .541
X7d 11.6444 .462 .469 .251 .394
Scale Statistics
Mean Variance Std. Deviation N of Items
15.6222 .695 .83364 4
163
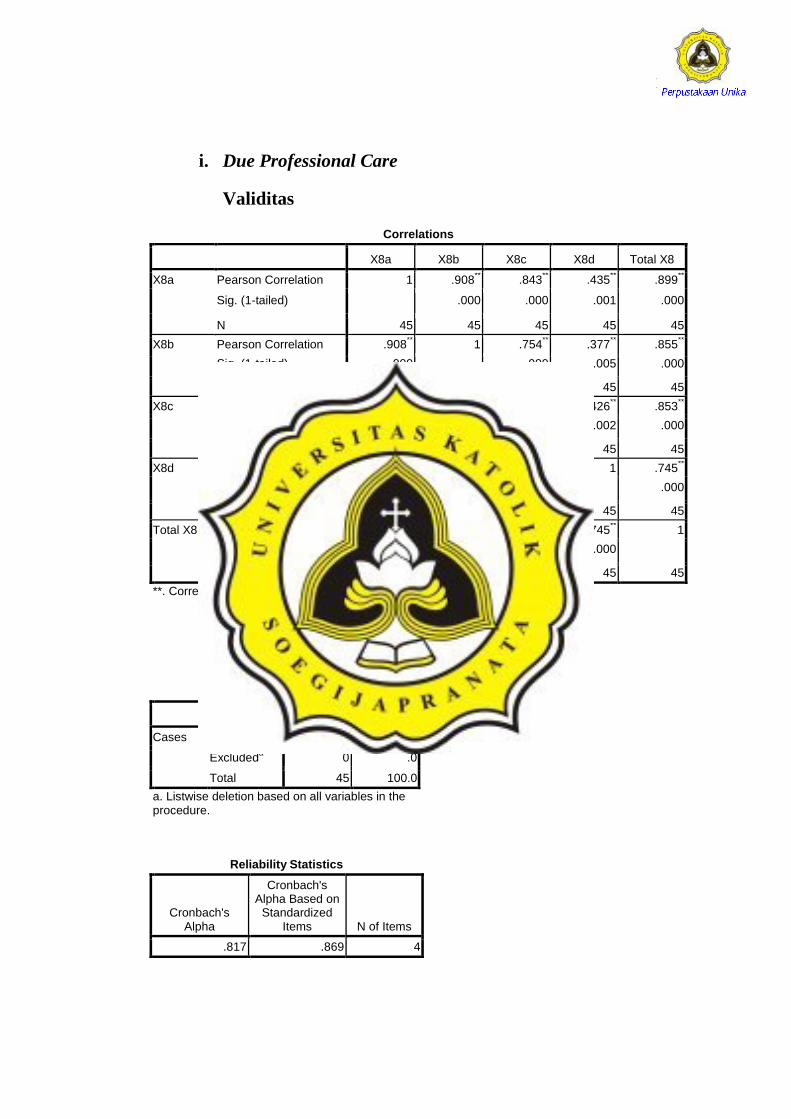
i. Due Professional Care
Validitas
Correlations
X8a X8b X8c X8d Total X8
X8a Pearson Correlation 1 .908** .843
** .435
** .899
**
Sig. (1-tailed) .000 .000 .001 .000
N 45 45 45 45 45
X8b Pearson Correlation .908** 1 .754
** .377
** .855
**
Sig. (1-tailed) .000 .000 .005 .000
N 45 45 45 45 45
X8c Pearson Correlation .843** .754
** 1 .426
** .853
**
Sig. (1-tailed) .000 .000 .002 .000
N 45 45 45 45 45
X8d Pearson Correlation .435** .377
** .426
** 1 .745
**
Sig. (1-tailed) .001 .005 .002 .000
N 45 45 45 45 45
Total X8 Pearson Correlation .899** .855
** .853
** .745
** 1
Sig. (1-tailed) .000 .000 .000 .000
N 45 45 45 45 45
**. Correlation is significant at the 0.01 level (1-tailed).
Reliabilitas
Case Processing Summary
N %
Cases Valid 45 100.0
Excludeda 0 .0
Total 45 100.0
a. Listwise deletion based on all variables in the procedure.
Reliability Statistics
Cronbach's Alpha
Cronbach's Alpha Based on
Standardized Items N of Items
.817 .869 4
164
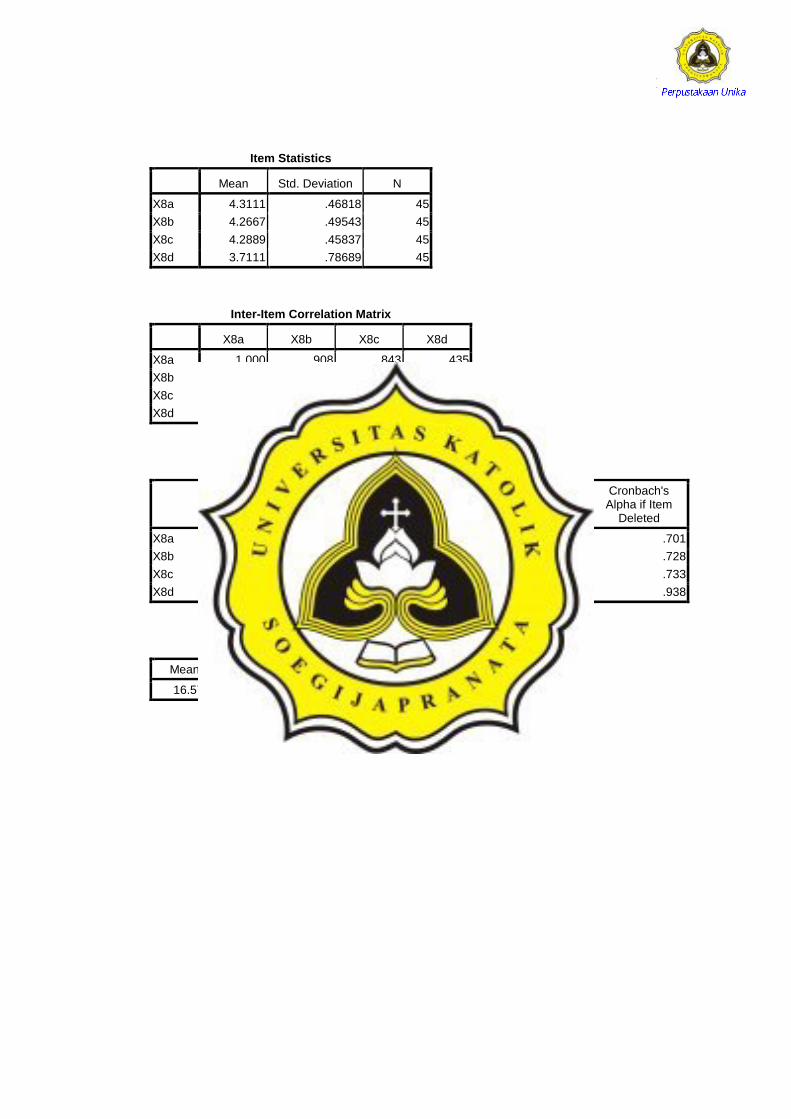
Item Statistics
Mean Std. Deviation N
X8a 4.3111 .46818 45
X8b 4.2667 .49543 45
X8c 4.2889 .45837 45
X8d 3.7111 .78689 45
Inter-Item Correlation Matrix
X8a X8b X8c X8d
X8a 1.000 .908 .843 .435
X8b .908 1.000 .754 .377
X8c .843 .754 1.000 .426
X8d .435 .377 .426 1.000
Item-Total Statistics
Scale Mean if Item Deleted
Scale Variance if Item Deleted
Corrected Item-Total Correlation
Squared Multiple Correlation
Cronbach's Alpha if Item
Deleted
X8a 12.2667 2.018 .829 .884 .701
X8b 12.3111 2.037 .748 .825 .728
X8c 12.2889 2.119 .758 .715 .733
X8d 12.8667 1.800 .436 .202 .938
Scale Statistics
Mean Variance Std. Deviation N of Items
16.5778 3.340 1.82768 4
165
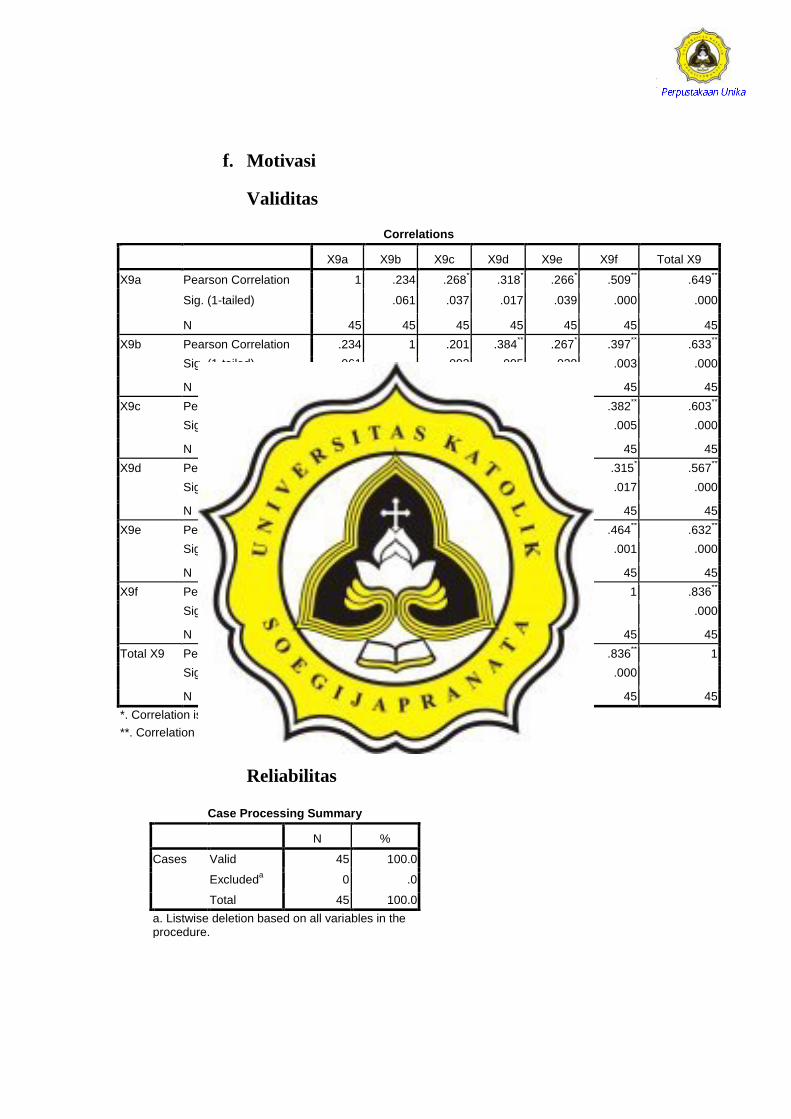
f. Motivasi
Validitas
Correlations
X9a X9b X9c X9d X9e X9f Total X9
X9a Pearson Correlation 1 .234 .268* .318
* .266
* .509
** .649
**
Sig. (1-tailed) .061 .037 .017 .039 .000 .000
N 45 45 45 45 45 45 45
X9b Pearson Correlation .234 1 .201 .384** .267
* .397
** .633
**
Sig. (1-tailed) .061 .093 .005 .038 .003 .000
N 45 45 45 45 45 45 45
X9c Pearson Correlation .268* .201 1 .249
* .420
** .382
** .603
**
Sig. (1-tailed) .037 .093 .050 .002 .005 .000
N 45 45 45 45 45 45 45
X9d Pearson Correlation .318* .384
** .249
* 1 .092 .315
* .567
**
Sig. (1-tailed) .017 .005 .050 .275 .017 .000
N 45 45 45 45 45 45 45
X9e Pearson Correlation .266* .267
* .420
** .092 1 .464
** .632
**
Sig. (1-tailed) .039 .038 .002 .275 .001 .000
N 45 45 45 45 45 45 45
X9f Pearson Correlation .509** .397
** .382
** .315
* .464
** 1 .836
**
Sig. (1-tailed) .000 .003 .005 .017 .001 .000
N 45 45 45 45 45 45 45
Total X9 Pearson Correlation .649** .633
** .603
** .567
** .632
** .836
** 1
Sig. (1-tailed) .000 .000 .000 .000 .000 .000
N 45 45 45 45 45 45 45
*. Correlation is significant at the 0.05 level (1-tailed).
**. Correlation is significant at the 0.01 level (1-tailed).
Reliabilitas
Case Processing Summary
N %
Cases Valid 45 100.0
Excludeda 0 .0
Total 45 100.0
a. Listwise deletion based on all variables in the procedure.
166
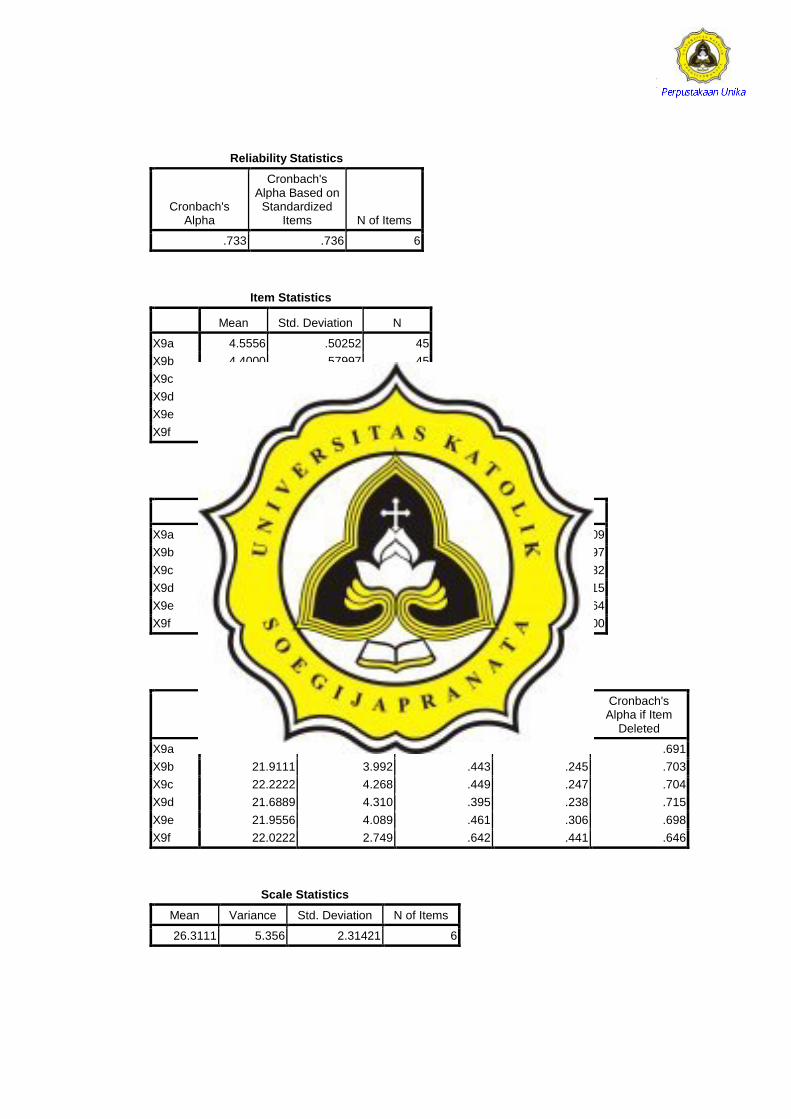
Reliability Statistics
Cronbach's Alpha
Cronbach's Alpha Based on
Standardized Items N of Items
.733 .736 6
Item Statistics
Mean Std. Deviation N
X9a 4.5556 .50252 45
X9b 4.4000 .57997 45
X9c 4.0889 .46818 45
X9d 4.6222 .49031 45
X9e 4.3556 .52896 45
X9f 4.2889 .86923 45
Inter-Item Correlation Matrix
X9a X9b X9c X9d X9e X9f
X9a 1.000 .234 .268 .318 .266 .509
X9b .234 1.000 .201 .384 .267 .397
X9c .268 .201 1.000 .249 .420 .382
X9d .318 .384 .249 1.000 .092 .315
X9e .266 .267 .420 .092 1.000 .464
X9f .509 .397 .382 .315 .464 1.000
Item-Total Statistics
Scale Mean if Item Deleted
Scale Variance if Item Deleted
Corrected Item-Total Correlation
Squared Multiple Correlation
Cronbach's Alpha if Item
Deleted
X9a 21.7556 4.098 .494 .291 .691
X9b 21.9111 3.992 .443 .245 .703
X9c 22.2222 4.268 .449 .247 .704
X9d 21.6889 4.310 .395 .238 .715
X9e 21.9556 4.089 .461 .306 .698
X9f 22.0222 2.749 .642 .441 .646
Scale Statistics
Mean Variance Std. Deviation N of Items
26.3111 5.356 2.31421 6
167
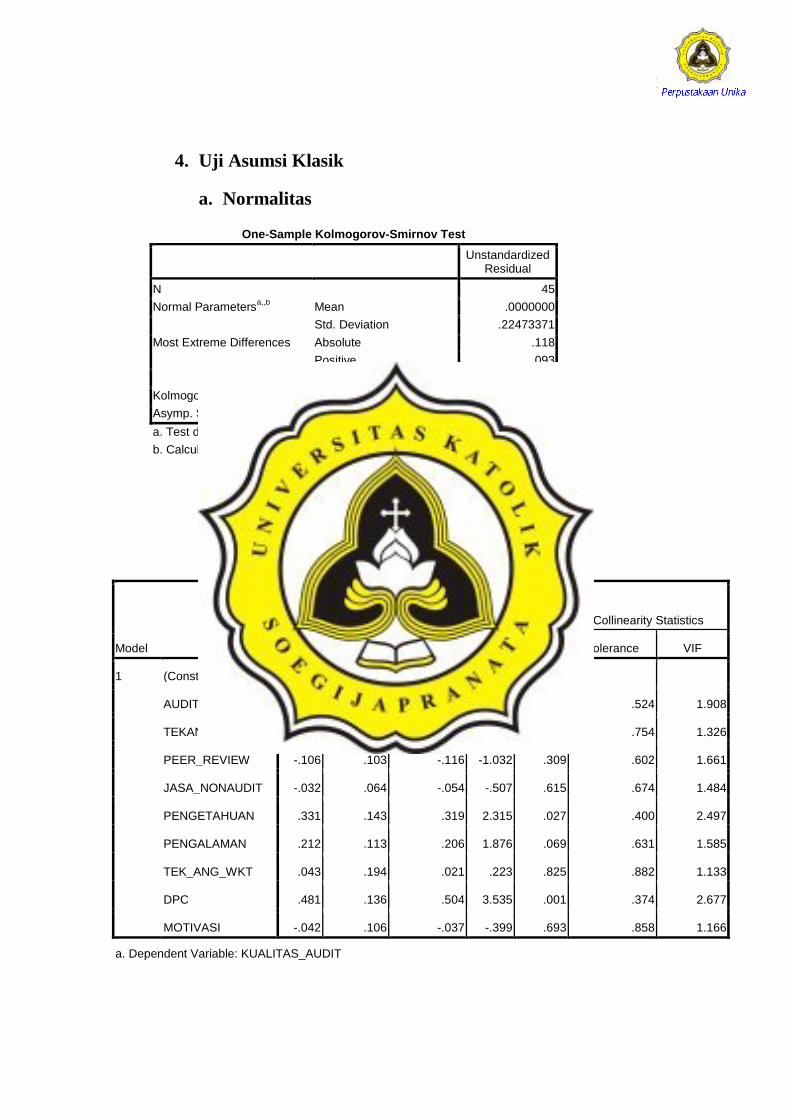
4. Uji Asumsi Klasik
a. Normalitas
One-Sample Kolmogorov-Smirnov Test
Unstandardized Residual
N 45
Normal Parametersa,,b
Mean .0000000
Std. Deviation .22473371
Most Extreme Differences Absolute .118
Positive .093
Negative -.118
Kolmogorov-Smirnov Z .789
Asymp. Sig. (2-tailed) .563
a. Test distribution is Normal.
b. Calculated from data.
b. Multikolinieritas
Coefficientsa
Model
Unstandardized
Coefficients
Standardized
Coefficients
t Sig.
Collinearity Statistics
B Std. Error Beta Tolerance VIF
1 (Constant) .294 1.361 .216 .831
AUDIT_TENURE .010 .171 .007 .058 .954 .524 1.908
TEKANAN .073 .086 .085 .849 .402 .754 1.326
PEER_REVIEW -.106 .103 -.116 -1.032 .309 .602 1.661
JASA_NONAUDIT -.032 .064 -.054 -.507 .615 .674 1.484
PENGETAHUAN .331 .143 .319 2.315 .027 .400 2.497
PENGALAMAN .212 .113 .206 1.876 .069 .631 1.585
TEK_ANG_WKT .043 .194 .021 .223 .825 .882 1.133
DPC .481 .136 .504 3.535 .001 .374 2.677
MOTIVASI -.042 .106 -.037 -.399 .693 .858 1.166
a. Dependent Variable: KUALITAS_AUDIT
168
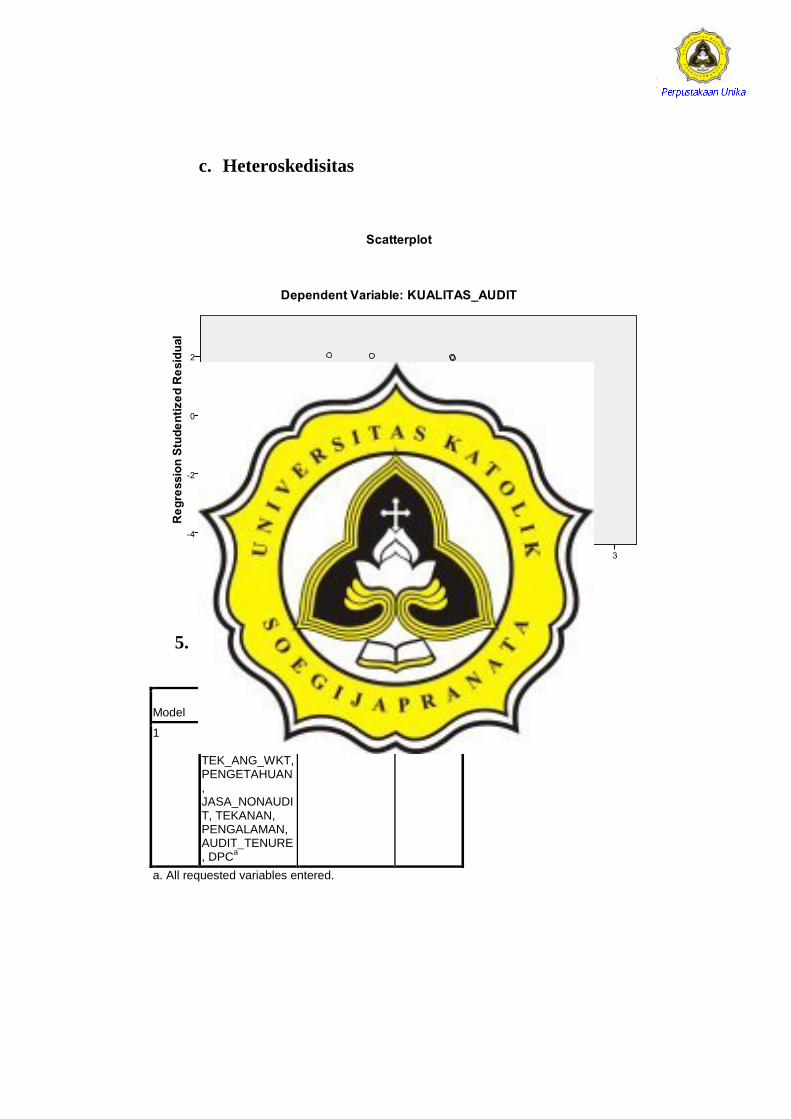
c. Heteroskedisitas
5. Uji Regresi
Variables Entered/Removed
Model Variables Entered
Variables Removed Method
1 MOTIVASI, PEER_REVIEW, TEK_ANG_WKT, PENGETAHUAN, JASA_NONAUDIT, TEKANAN, PENGALAMAN, AUDIT_TENURE, DPC
a
. Enter
a. All requested variables entered.
169
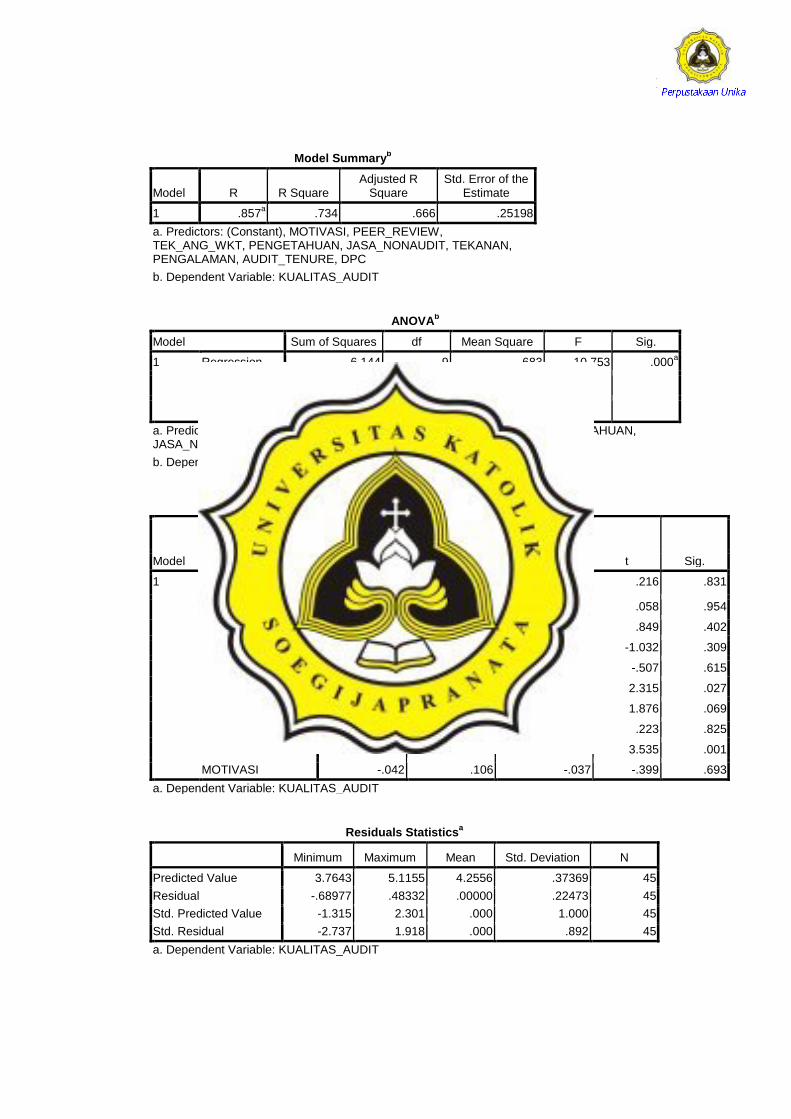
Model Summaryb
Model R R Square Adjusted R
Square Std. Error of the
Estimate
1 .857a .734 .666 .25198
a. Predictors: (Constant), MOTIVASI, PEER_REVIEW, TEK_ANG_WKT, PENGETAHUAN, JASA_NONAUDIT, TEKANAN, PENGALAMAN, AUDIT_TENURE, DPC
b. Dependent Variable: KUALITAS_AUDIT
ANOVA
b
Model Sum of Squares df Mean Square F Sig.
1 Regression 6.144 9 .683 10.753 .000a
Residual 2.222 35 .063
Total 8.367 44
a. Predictors: (Constant), MOTIVASI, PEER_REVIEW, TEK_ANG_WKT, PENGETAHUAN, JASA_NONAUDIT, TEKANAN, PENGALAMAN, AUDIT_TENURE, DPC
b. Dependent Variable: KUALITAS_AUDIT
Coefficients
a
Model
Unstandardized Coefficients Standardized Coefficients
t Sig. B Std. Error Beta
1 (Constant) .294 1.361 .216 .831
AUDIT_TENURE .010 .171 .007 .058 .954
TEKANAN .073 .086 .085 .849 .402
PEER_REVIEW -.106 .103 -.116 -1.032 .309
JASA_NONAUDIT -.032 .064 -.054 -.507 .615
PENGETAHUAN .331 .143 .319 2.315 .027
PENGALAMAN .212 .113 .206 1.876 .069
TEK_ANG_WKT .043 .194 .021 .223 .825
DPC .481 .136 .504 3.535 .001
MOTIVASI -.042 .106 -.037 -.399 .693
a. Dependent Variable: KUALITAS_AUDIT
Residuals Statistics
a
Minimum Maximum Mean Std. Deviation N
Predicted Value 3.7643 5.1155 4.2556 .37369 45
Residual -.68977 .48332 .00000 .22473 45
Std. Predicted Value -1.315 2.301 .000 1.000 45
Std. Residual -2.737 1.918 .000 .892 45
a. Dependent Variable: KUALITAS_AUDIT
170
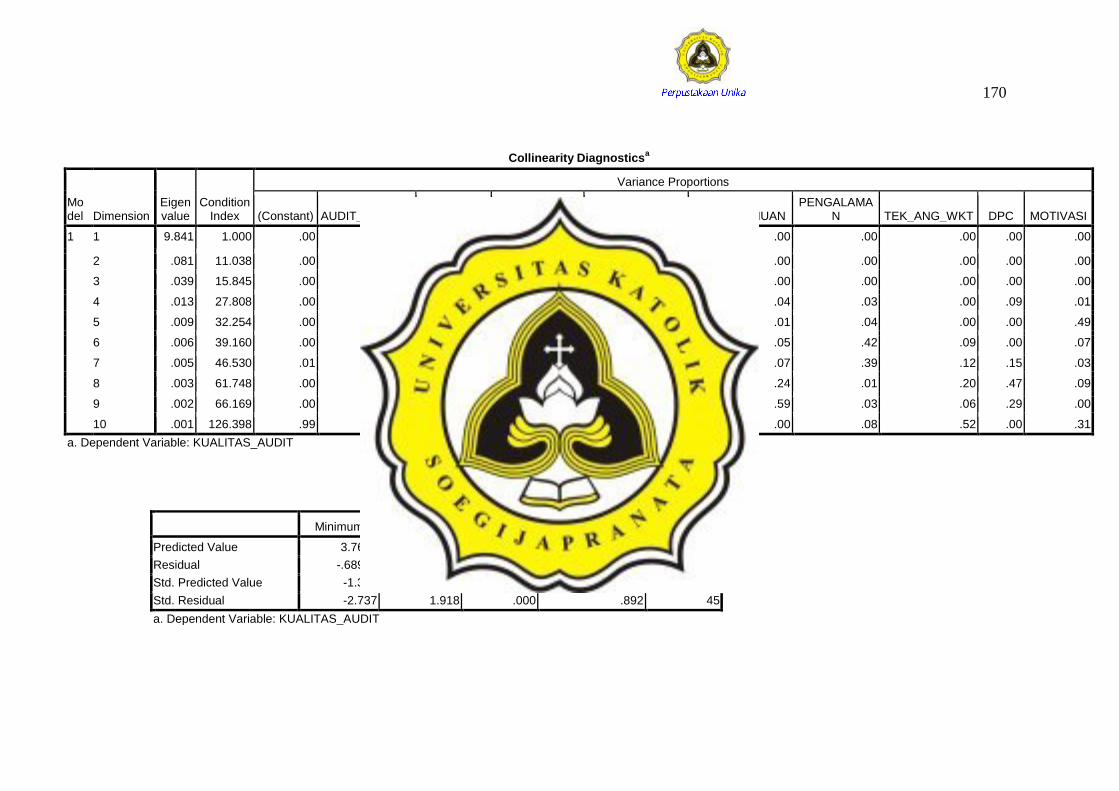
Residuals Statisticsa
Minimum Maximum Mean Std. Deviation N
Predicted Value 3.7643 5.1155 4.2556 .37369 45
Residual -.68977 .48332 .00000 .22473 45
Std. Predicted Value -1.315 2.301 .000 1.000 45
Std. Residual -2.737 1.918 .000 .892 45
a. Dependent Variable: KUALITAS_AUDIT
Collinearity Diagnosticsa
Model Dimension
Eigenvalue
Condition Index
Variance Proportions
(Constant) AUDIT_TENURE TEKANAN PEER_REVIEW JASA_NONAUDIT PENGETAHUAN PENGALAMA
N TEK_ANG_WKT DPC MOTIVASI
1 1 9.841 1.000 .00 .00 .00 .00 .00 .00 .00 .00 .00 .00
2 .081 11.038 .00 .00 .40 .01 .04 .00 .00 .00 .00 .00
3 .039 15.845 .00 .00 .30 .01 .49 .00 .00 .00 .00 .00
4 .013 27.808 .00 .00 .00 .38 .00 .04 .03 .00 .09 .01
5 .009 32.254 .00 .01 .12 .10 .04 .01 .04 .00 .00 .49
6 .006 39.160 .00 .04 .00 .06 .08 .05 .42 .09 .00 .07
7 .005 46.530 .01 .02 .06 .25 .17 .07 .39 .12 .15 .03
8 .003 61.748 .00 .29 .04 .10 .01 .24 .01 .20 .47 .09
9 .002 66.169 .00 .49 .03 .09 .09 .59 .03 .06 .29 .00
10 .001 126.398 .99 .15 .04 .00 .08 .00 .08 .52 .00 .31
a. Dependent Variable: KUALITAS_AUDIT

171
Recommended