PrometheusA Next Generation Monitoring System
Who am I?Brian Brazil:
● Core Prometheus Developer○ “If it didn’t exist I would have created it”
● Founder of Robust Perception○ World’s Leading Provider of Prometheus services
● Worked at Google as an SRE for 7 years○ Managed one of the largest monitoring setups in the company with billions of metrics○ Brought many monitoring systems back from the brink○ Defined corporate monitoring best practices○ Recognised expert on monitoring theory and practice
Why monitor?
● Know when things go wrong○ To call in a human to prevent a business-level issue, or prevent an issue in advance
● Be able to debug and gain insight● Trending to see changes over time, and drive technical/business decisions● To feed into other systems/processes (e.g. QA, security, automation)
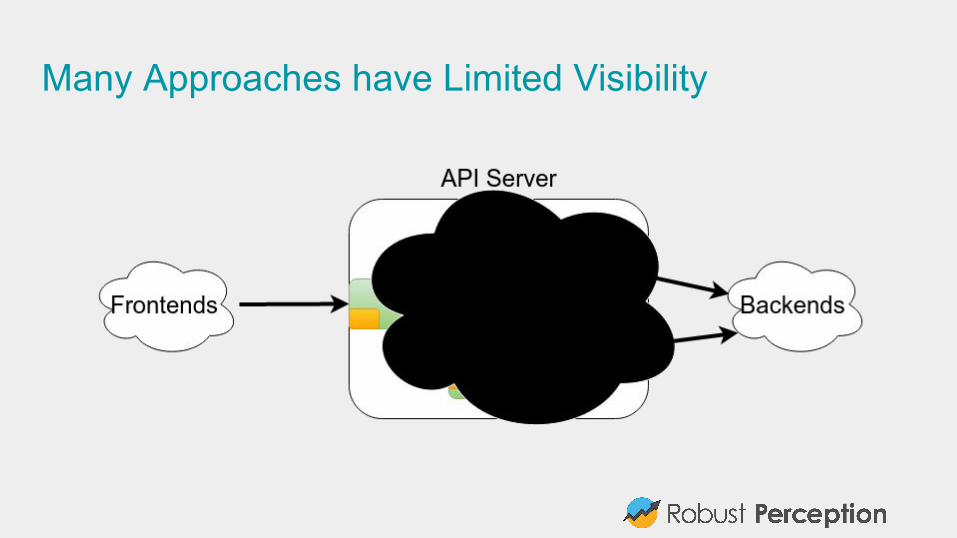
Many Approaches have Limited Visibility
Blackbox monitoring
Monitoring from the outside
No knowledge of how the application works internally
Examples: ping, HTTP request, inserting data and waiting for it to appear on dashboard
Where to use BlackboxBlackbox monitoring should be treated similarly to smoketests.
It’s good for finding when things have badly broken in an obvious way, and testing from outside your network.
Not so good for knowing what’s going on inside a system.
Nor should it be treated like regression testing and try to test every single feature.
Tend to be flaky, as they either pass or fail.
Whitebox MonitoringComplementary to blackbox monitoring.
Works with information from inside your systems.
Can be simple things like CPU usage, down to the number of requests triggering a particular obscure codepath.
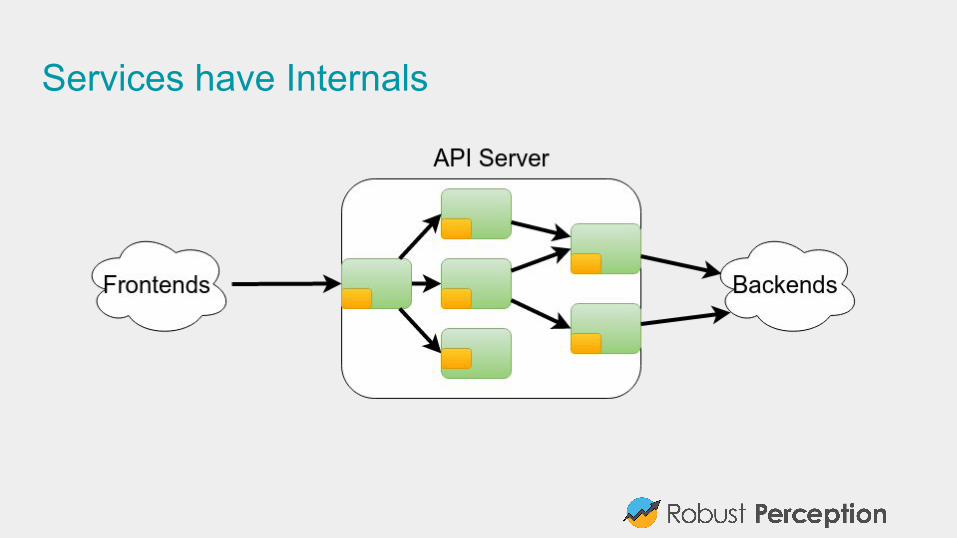
Services have Internals
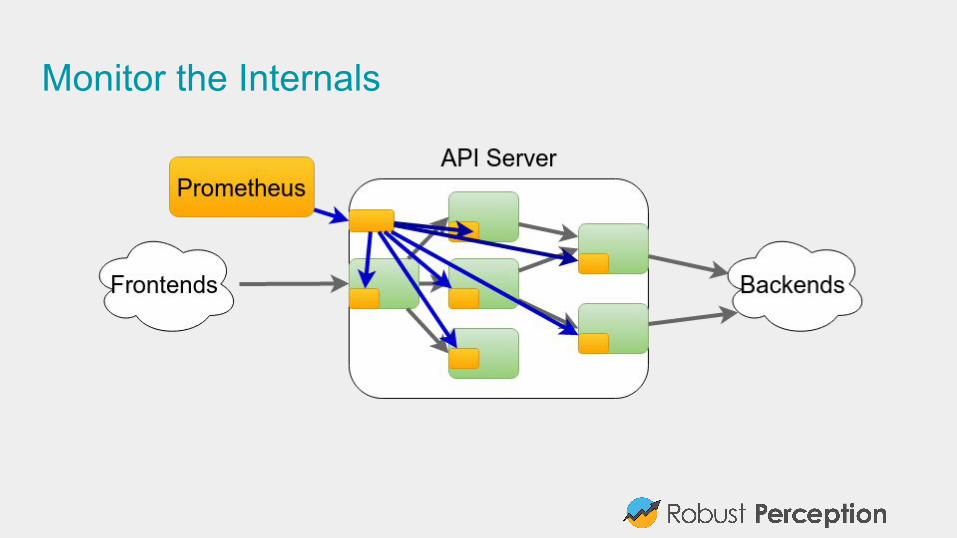
Monitor the Internals
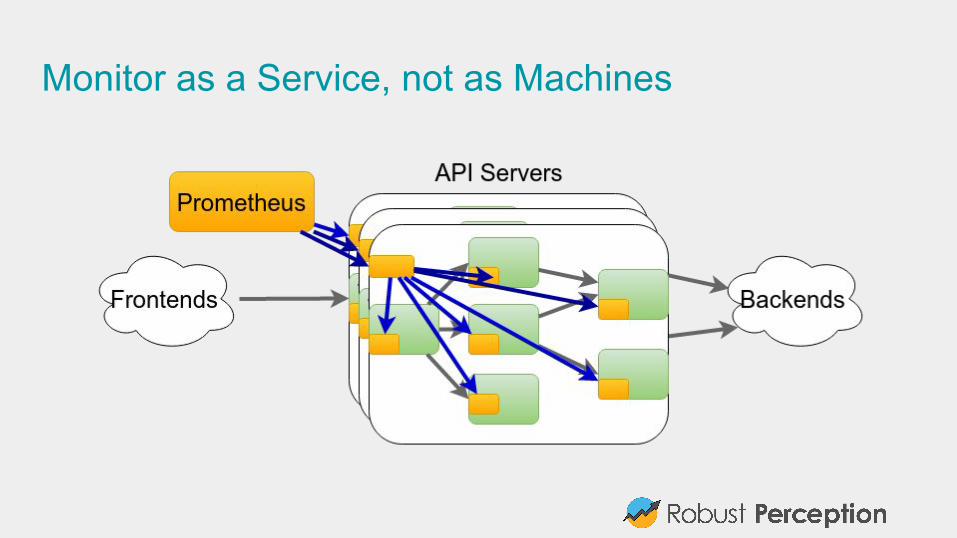
Monitor as a Service, not as Machines
PrometheusInspired by Google’s Borgmon monitoring system.
Started in 2012 by ex-Googlers working in Soundcloud as an open source project.
Mainly written in Go. Publically launched in early 2015.
100+ companies using it including Digital Ocean, Ericsson, Docker and CoreOS.
Community
The Prometheus community is an active ecosystem.
22 core repositories on Github, 250+ contributors.
Over 35 third-party integrations that we know of.
That’s 3 new integrations and 20 new contributors a month since public launch!
What does Prometheus offer?● Inclusive Monitoring● Powerful data model● Powerful query language● Manageable and Reliable● Efficient● Scalable● Easy to integrate with● Dashboards
Inclusive MonitoringDon’t monitor just at the edges:
● Instrument client libraries● Instrument server libraries (e.g. HTTP/RPC)● Instrument business logic
Library authors get information about usage.
Application developers get monitoring of common components for free.
Dashboards and alerting can be provided out of the box, customised for your organisation!
How to instrument your code?
Several common approaches:
● Custom endpoint/interface to dump stats (usually JSON or CSV)
● Use one mildly standard instrumentation system (e.g. JMX in Java)
● For libraries, have some type of hooks
● Don’t
This isn’t greatUsers run more than just your software project, with a variety of monitoring tools.
As a user you’re left with a choice: Have N monitoring systems, or run extra services to act as shims to translate.
As a monitoring project, we have to write code and/or configuration for every individual library/application.
This is a sub-optimal for everyone.
Open ecosystemPrometheus client libraries don’t tie you into Prometheus.
For example the Python and Java clients can output to Graphite, with no need to run any Prometheus components.
This means that you as a library author can instrument with Prometheus, and your users with just a few lines of code can output to whatever monitoring system they want. No need for users to worry about a new standard.
This can be done incrementally.
It goes the other way tooIt’s unlikely that everyone is going to switch to Prometheus all at once, so we’ve integrations that can take in data from other monitoring systems and make it useful.
Graphite, Collectd, Statsd, SNMP, JMX, Dropwizard, AWS Cloudwatch, New Relic, Rsyslog and Scollector (Bosun) are some examples.
Prometheus and its client libraries can act a clearinghouse to convert between monitoring systems.
For example Zalando’s Zmon uses the Python client to parse Prometheus metrics from directly instrumented binaries.
Instrumentation made easyPrometheus clients don’t just marshall data.
They take care of the nitty gritty details like concurrency and state tracking.
We take advantage of the strengths of each language.
In Python for example that means context managers and decorators.
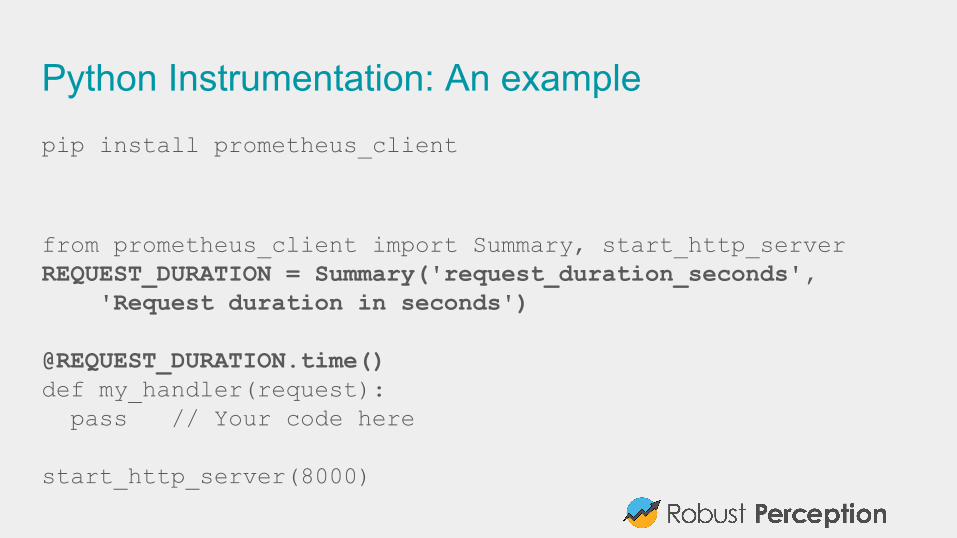
Python Instrumentation: An examplepip install prometheus_client
from prometheus_client import Summary, start_http_serverREQUEST_DURATION = Summary('request_duration_seconds', 'Request duration in seconds')
@REQUEST_DURATION.time()def my_handler(request): pass // Your code here
start_http_server(8000)
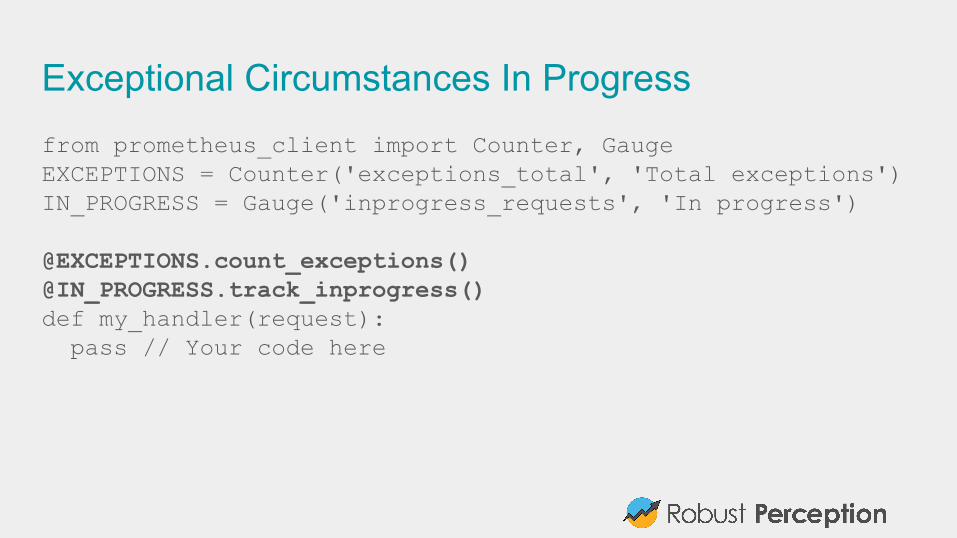
Exceptional Circumstances In Progressfrom prometheus_client import Counter, GaugeEXCEPTIONS = Counter('exceptions_total', 'Total exceptions')IN_PROGRESS = Gauge('inprogress_requests', 'In progress')
@EXCEPTIONS.count_exceptions()@IN_PROGRESS.track_inprogress()def my_handler(request): pass // Your code here
Data and Query Language: LabelsPrometheus doesn’t use dotted.strings like metric.microsoft.dublin.
Multi-dimensional labels instead like metric{company=”microsoft”,city=”dublin”}
Can aggregate, cut, and slice along them.
Can come from instrumentation, or be added based on the service you are monitoring.
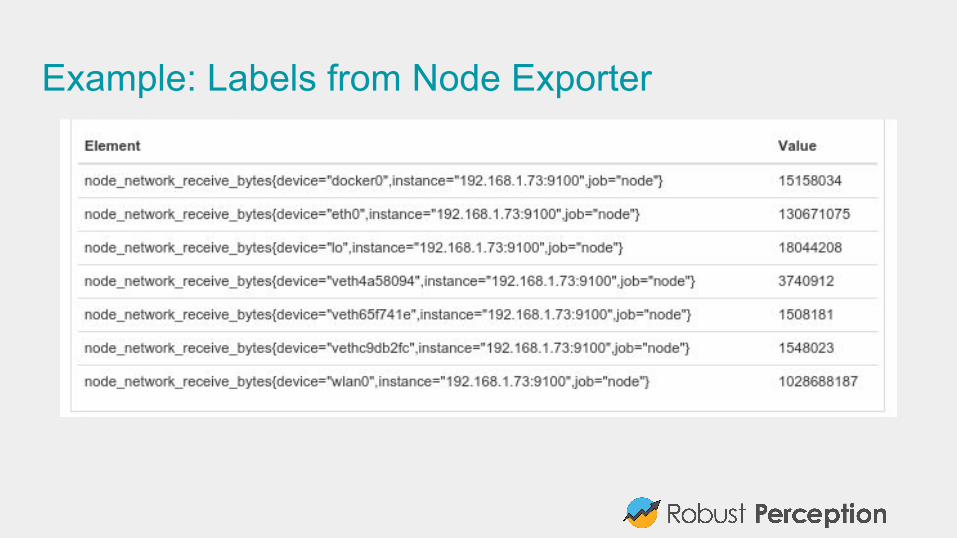
Example: Labels from Node Exporter
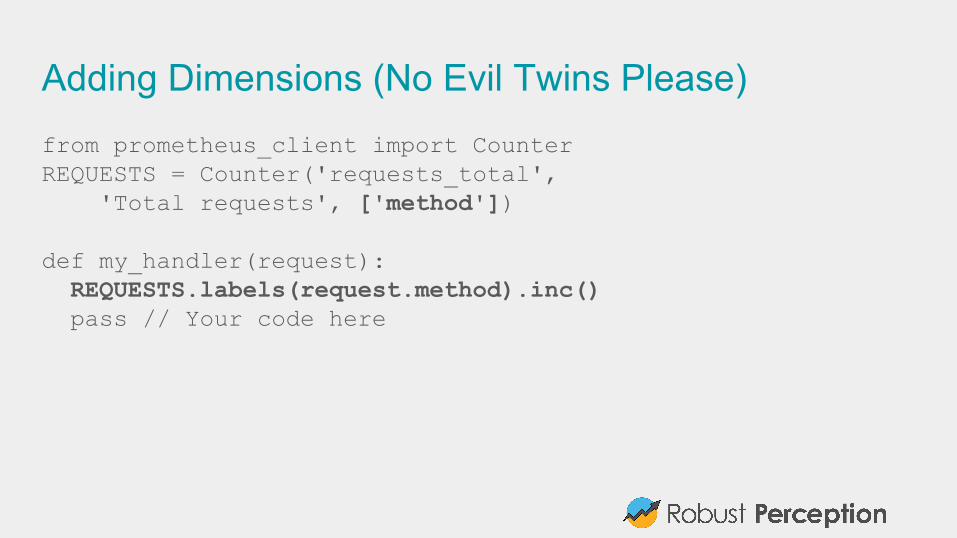
Adding Dimensions (No Evil Twins Please)from prometheus_client import CounterREQUESTS = Counter('requests_total', 'Total requests', ['method'])
def my_handler(request): REQUESTS.labels(request.method).inc() pass // Your code here
Powerful Query LanguageCan multiply, add, aggregate, join, predict, take quantiles across many metrics in the same query. Can evaluate right now, and graph back in time.
Answer questions like:
● What’s the 95th percentile latency in the European datacenter?● How full will the disks be in 4 hours?● Which services are the top 5 users of CPU?
Can alert based on any query.
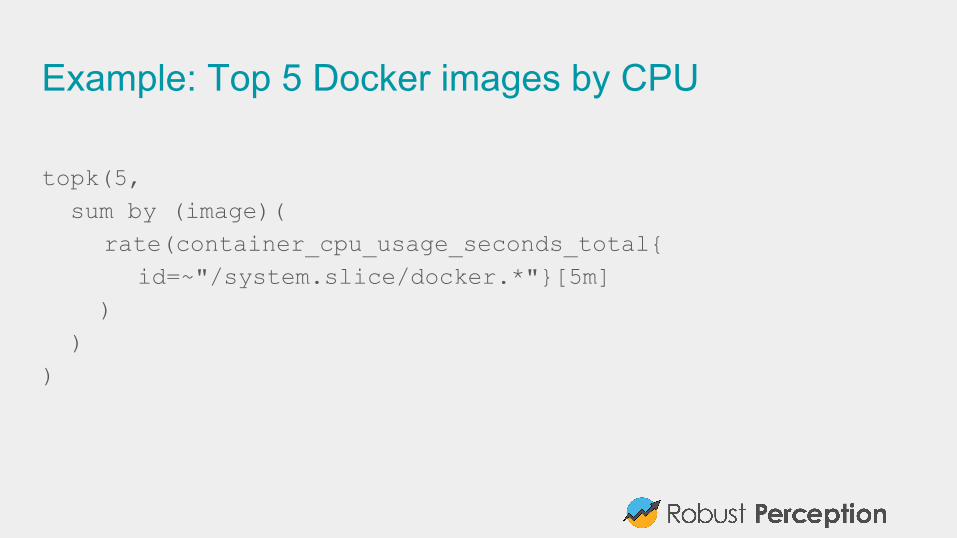
Example: Top 5 Docker images by CPU
topk(5, sum by (image)(
rate(container_cpu_usage_seconds_total{id=~"/system.slice/docker.*"}[5m]
) ))
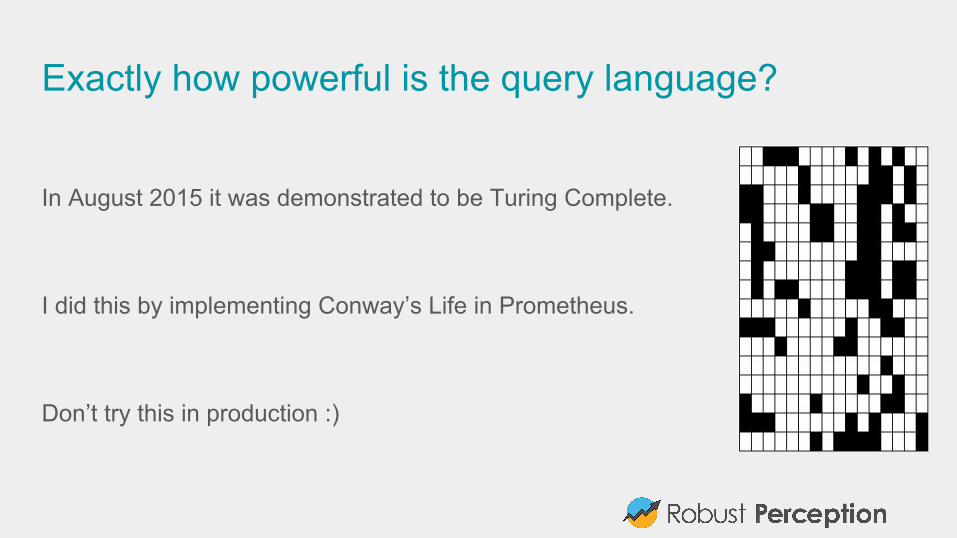
Exactly how powerful is the query language?
In August 2015 it was demonstrated to be Turing Complete.
I did this by implementing Conway’s Life in Prometheus.
Don’t try this in production :)
Manageable and ReliableCore Prometheus server is a single binary.
Doesn’t depend on Zookeeper, Consul, Cassandra, Hadoop or the Internet.
Only requires local disk (SSD recommended). No potential for cascading failure.
Pull based, so easy to on run a workstation for testing and rogue servers can’t push bad metrics.
Advanced service discovery finds what to monitor.
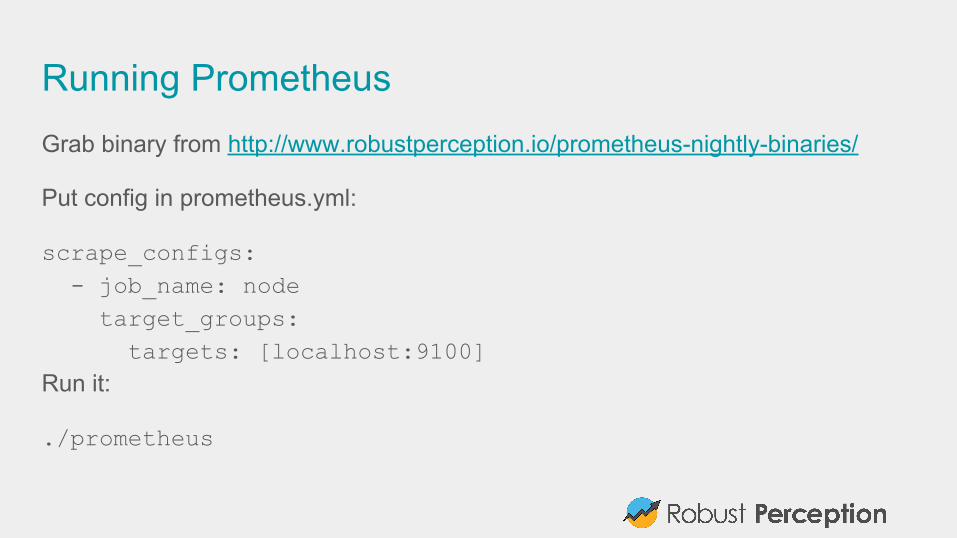
Running PrometheusGrab binary from http://www.robustperception.io/prometheus-nightly-binaries/
Put config in prometheus.yml:
scrape_configs: - job_name: node target_groups: targets: [localhost:9100]Run it:
./prometheus
EfficientInstrumenting everything means a lot of data.
Prometheus is best in class for storage efficiency, 4.5 bytes per sample.
A single server can handle:
● millions of metrics● hundreds of thousands of timeseries per second
ScalablePrometheus is easy to run, can give one to each team in each datacenter.
Federation allows pulling key metrics from other Prometheus servers.
When one job is too big for a single Prometheus server, can use sharding+federation to scale out. Needed with thousands of machines.
Easy to integrate withMany existing integrations: Java, JMX, Python, Go, Ruby, .Net, Machine, Cloudwatch, EC2, MySQL, PostgreSQL, Haskell, Bash, Node.js, SNMP, Consul, HAProxy, Mesos, Bind, CouchDB, Django, Mtail, Heka, Memcached, RabbitMQ, Redis, RethinkDB, Rsyslog, Meteor.js and Minecraft.
Graphite, Statsd, Collectd, Scollector, Munin, Nagios integrations aid transition.
It’s so easy, most of the above were written without the core team even knowing about them!
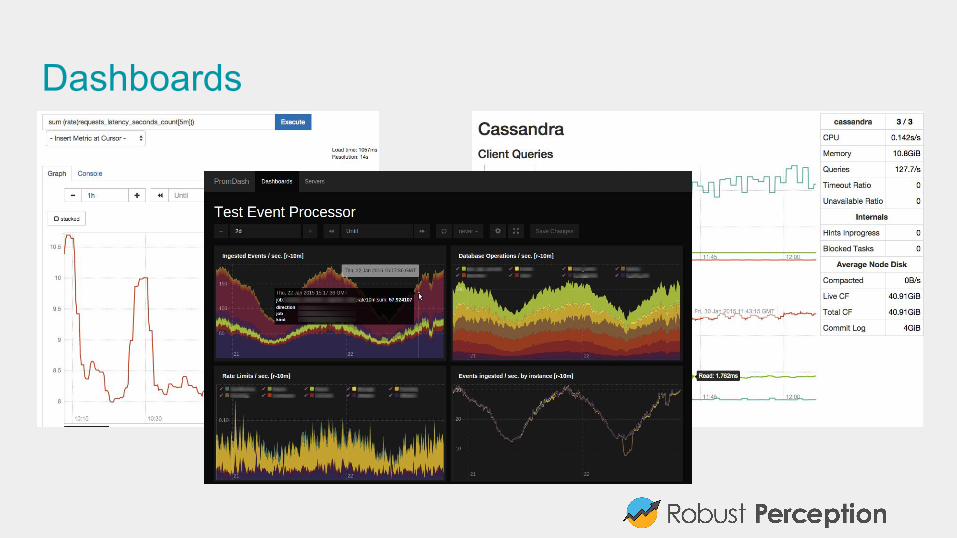
Dashboards

Grafana Demo

What does Prometheus offer?● Inclusive Monitoring● Powerful data model● Powerful query language● Manageable and Reliable● Efficient● Scalable● Easy to integrate with● Dashboards

Questions?
Project Website: prometheus.io
Demo: demo.robustperception.io
Company Website: www.robustperception.io
Recommended