Handouts: (Taken from Deped CI Policies and Procedure)
CI Process Overview
Each project should follow the Triple A 10 steps. Each step has an output, stated in
‘Minimum Documentation’. The CI Team can use the basic CI tools and techniques to help
them describe the step and arrive at the output.
Triple A Steps Basic Tools and Techniques Minimum Documentation
1. Get Organized Brainstrorming
Planning and Scheduling
Baseline Data Gathering
Team Project Charter
Project Work Plan in
Gantt Chart Format
2. Talk with Customers
Interviews
Focus Group Discussions
Surveys
Affinity Diagram
Data Validation
Use Triangulation Method)
VOC Affinity Diagram
3. Walk the Process SIPOC Chart Data Analysis
Process in SIPOC Chart
Activity Flow Chart
Data Analysis Chart
(as applicable)
4. Identify Priority Improvement
Arears
Data Analysis Data Analysis Chart (as applicable)
Focused Problem
Statement
5. Do Root Cause Analysis
Brainstorming
Cause and Effect Analysis
Diagram
Root Cause Validation
Pareto Diagram
Priorization Matrix
Fishbone or Why-why Diagram, identify Root
causes
Root Cause Validation
Table, showing valid and controlable causes
Prioritization Chart,
showing priority valid
causes to address
6. Develop Solutions Brainstrorming
Cost benefit Analysis
Solution Prioritization
Solution Description
Solution Prioritization
Matrix, showing
selected priority solution
7. Finalize
Improvement Plan Potential Problem Analysis
Table
Planning and Scheduling
Potential Problem
Analysis Table
CI Improvement Plan in a Gantt Chart for
Selected Solution
8. Pilot Your Solution Solution Testing
Data Analysis
Data Analysis Chart
(as applicable) on pilot

results
Adjusted CI
Improvement Plan in a Gantt Chart for
Selected Solution
Pilot Implementation Status Report
9. Roll out Your
Solution Data Analysis
Cost Benefit Analysis
Planning and Scheduling
Updated standards (as
applicable)
Data Analysis Charts
(as applicable) on pilot Results
Rollout CI
Improvement Plan in a Gantt Chart
Rollout
Implementation Status
Report
10. Check your
Progress Data Analysis
Cost Benefit Analysis
Planning and Scheduling
Data Analysis Charts
(ass applicable) on
rollout results
Adjusted Rollout CI Improvement Plan in a
Gantt Chart
Rollout
Implementtation Status Report
READY?
Step 1: Get Organized
Activity What you Need Tools to Use Outputs
1. Designing the
team charted
Initial Team Charter CI Team
Charter
Gantt
Chart
Final CI
Team
Charter
2. Get initial
information on
the process
List of people to
interview regarding the
process
List of questions to ask
List of data to gather
Documents such as
work instructions,
procedures, policies,
circulars, etc.
Final CI team charter
Copies of
existing
documentat
ion on the
process
3. Prepare the
data collection
plan
Final CI team charter Data
collection
Plan
Template
Data
collection
Plan
4. Set up Final CI team charter Gantt Data

monitoring and
evaluation for
the project
Chart Collection
Plan
SAMPLE: Pre-Meeting Checklist
CI Team Pre-Meeting Checklist
Title of Meeting:
Objective:
Initiating Group: Chair:
Date and Time: Venue:
Items Status
1. Agenda
2. Participants
3. Documents and background
materials
4. Venue and refreshments
5. AV equipment
6. Suppliess and materials
7. Others

CI PROJECT PROPOSAL
PROJECT TITLE PROJECT
CODE
PROPONENT
PROPOSAL
DATE
BACKGROUND AND
RATIONALE
(Describe the project situation or opportunity for improvement, and the potential contribution
to the achievement of specific school/learner activities)
OBJECTIVES (Must be SMART)
INDICATIVE
PROJECT
SCHEDULE
STAGE SCHEDULE RESOURCES
NEEDED
1. ASSESS
2. ANALYZE
3. ACT
TOTAL
FUNDING SOURCES SOURCE SCHEDULE AMOUNT
INTERNAL
OTHER
STAKEHOLDERS
TOTAL
REVIEW AND
APPROVAL
REMARKS
Prepared by:
School CI Facilitator
Endorsed by:
School Head
Reviewed and
Recommended by:
Division CI
Facilitator
Approved by:
Division
Superintendent
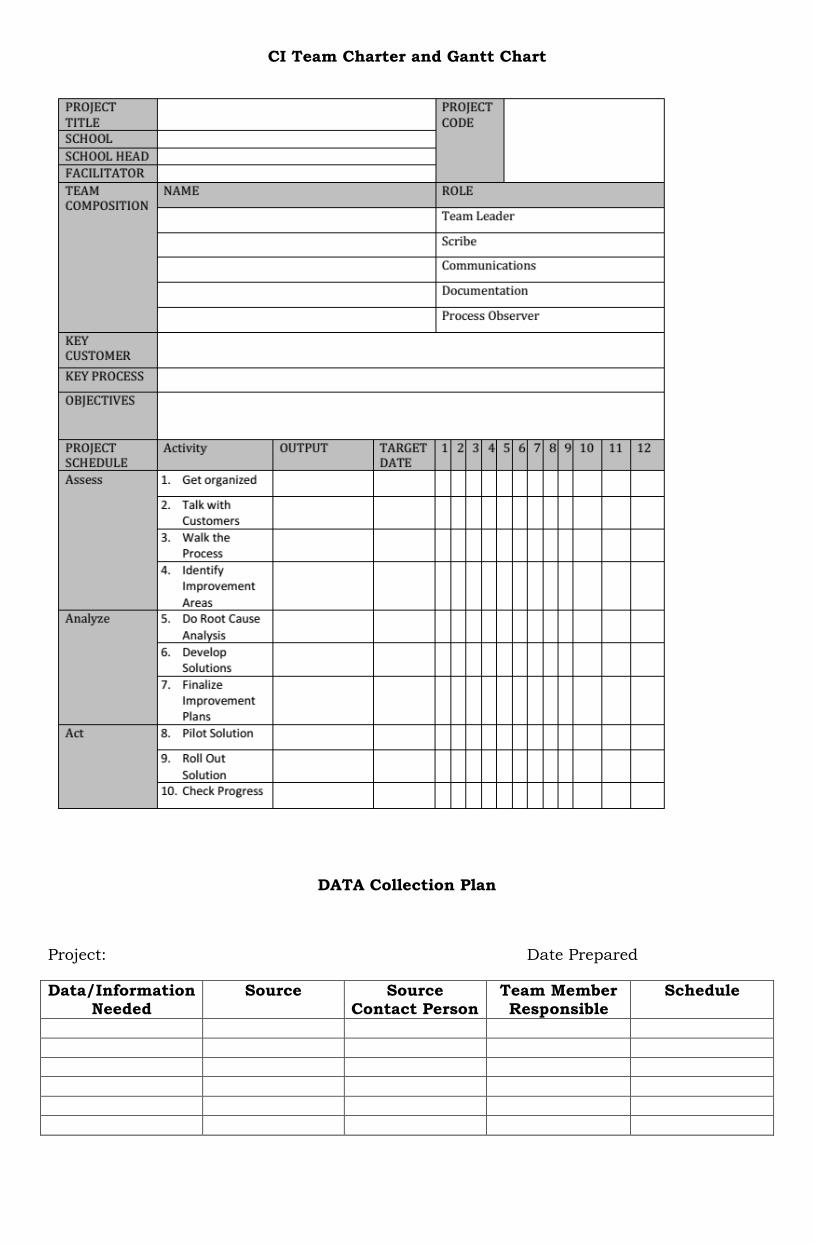
CI Team Charter and Gantt Chart
DATA Collection Plan
Project: Date Prepared
Data/Information Needed
Source Source Contact Person
Team Member Responsible
Schedule

Step 2: Talk with the Customers
Activity What You Need Tools to Use Outputs
1. Get customer
data
Team Charter
List of
customers/
stakeholders
Data collection
plan
Data collection
forms (e.g. check
sheets surveys)
VOC data
2. Analyze
customer data
VOC data Data Analysis
(e.g. Line Chart,
Bar Chart)
Affinity Diagram
Data analysis
charts (as
applicable)
Priority customer
requirements
(VOC affinity
diagram)
3. Evaluate
performance
versus
customer
requirement
Process
performance
measures
Data Analysis
(e.g. Line chart,
Bar Chart)
Data analysis
charts (as
applicable)
Improvement
areas relative to
priority customer
requirements
Updated Project
A3 Report

Methods for Gathering VOC data include the following:
Mode Method Remarks
Interview One-on-one Ideal for understanding complex
matters, personal issues, emotionally
charged topics; or a decision-making
process
Pair (Dyad), Triad Conducted when a one-on-one setting is
too intimidating for the respondent.
This is usually conducted among kids
and teenagers, with their
barkada/friends.
Focus Group Discussion
(FGD)
Ideal for brainstorming and exploring
broad concepts and directions
Observation Home visits
Classroom visits
Play area visits
Conducted to verify actual environment
and behaviors, or to understand the
relative ease or difficulty in performing
activities
Survey Survey Questionnaire Conducted to quantify and verify
customer needs and wants
Evaluating Performance vs Customer Requirement

Step 3: Walk the Process
Activity What You Need Tools to Use Outputs
1. Prepare a
macro
perspective
process
description
Priority customer
requirements
SIPOC Process SIPOC
Chart
2. Define the key
process steps
Process SIPOC
Chart
Activity
Flowchart
Process Activity
Chart
3. Gather data on
process
performance
Process Activity
Chart
Key performance
measures at
selected steps
Data Collection
Forms
Process
performance data
Updated project
A3 report
Supplier, Input, Process, Output, Customer (SIPOC) Chart
Supplier Input Process Output Customer
Example

Defining Key Process Steps
Process mapping is the technique of using flowcharts to illustrate the flow of a
process, from the most macro perspective to the level of detail required to identify
opportunities for improvement. Starting with the SIPOC, each step has to be mapped to
clarify key activities and provide information as to where issues might be occurring.
The CI Team maps the process for each step:
1. Brainstorm on the key activities.
2. Arrange key activities in sequence.
3. Check for missing activities or decision points.
4. Number each activity.
5. Prepare the Activity Flowchart
After the activity flowcharts have been prepared, the CI Team should “walk the
process” to verify the accuracy and completeness of the flowcharts, and to obtain additional
insights on improvement opportunities. This can be done by interviewing personnel
involved in the activities, or by observing the process in action.
Process Mapping Using Flowchart (Example)
How to Make an Activity Flowchart
1. Identify the process to be illustrated in a flowchart and give the chart an appropriate
tittle.
2. Determine the flowchart symbols that will be used to represent what is happening in
the process. The following are the different flowchart symbols:

3. Begin drawing the chart by first describing the event which initiates the process. The
first step is represented by an oval shape symbol.
4. Determine the next activity and connect it to the start of the process. The activity
should be described in as few words as possible, but ensure that the description is
not ambiguous or unclear. The second activity is represented by a rectangular
symbol.
5. Check for missing steps or decision points. When the next step of a flowchart has
multiple scenarios, this moment becomes a decision process that is represented by a
triangle symbol. The decision process illustrates the importance of choosing the most
beneficial alternative step to continue the process. In the sample case is when the
parent will arrive.
6. Continue describing each event, action, or decision as it occurs in sequence until the
process is concluded. The step that ends the process is represented by another oval
shaped symbol.
Process Mapping Using Flowchart (Example)

Step 4: Identify Priority Problem Area
Activity What You Need Tools to Use Outputs
1. Situate the
storm
clouds
Data Analysis
Charts
Process SIPOC
Chart
Process Activity
Flowchart
Problem Statement
(from CI Team
Charter)
Pareto Chart Storm clouds on
Process SIPOC
Chart and
Activity
Flowcharts
2. Gather Data Storm Clouds on
Process SIPOC
Chart and Activity
Flowchart
Data Collection
forms (e.g. check
sheets)
Validated storm
clouds
3. Analyze
process
Performance
Process SIPOC
Chart
Process Activity
Charts
Process
Performance data
Data Analysis Data Analysis
Charts (as
appropriate)
Priority
Improvement
Areas
4. Define the
problem
Priority
Improvement Areas
Focused Problem
Statement
Updated Project
A3 Report
showing the
process SIPOC
with storm
clouds and
focused problem
statement
Situating the Storm Clouds
Storm clouds are critical process issues related to the problem. Situating them in the
current process can help locate the specific steps or activities that contribute most to the
problem. Storm clouds should be:
Relevant to the background of the project
Specific
Observable
Measurable
To identify the storm clouds, one must:
1. Review the process maps relative to the background of the project (from Step 1)
and the results of the VOC (from Step 2).
2. Brainstorm and identify critical issues at each process step or activity.
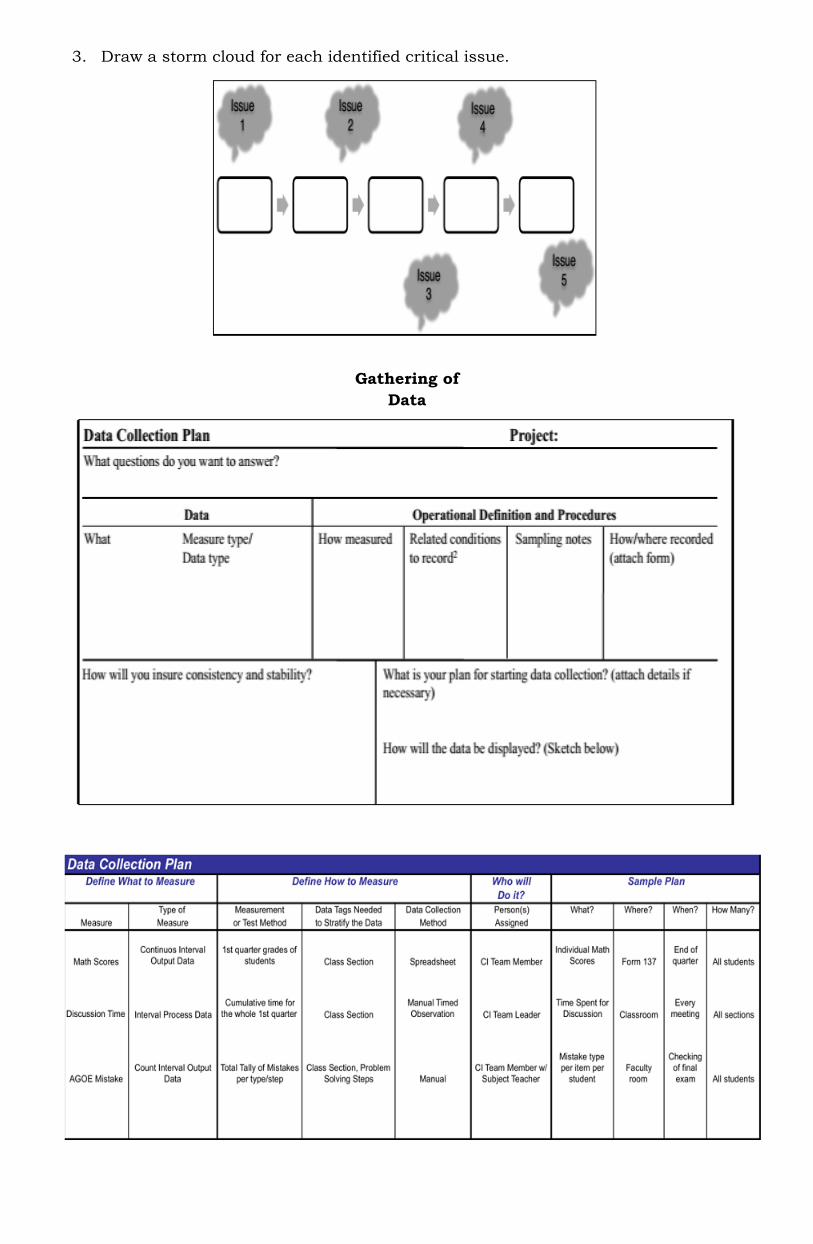
3. Draw a storm cloud for each identified critical issue.
Gathering of
Data

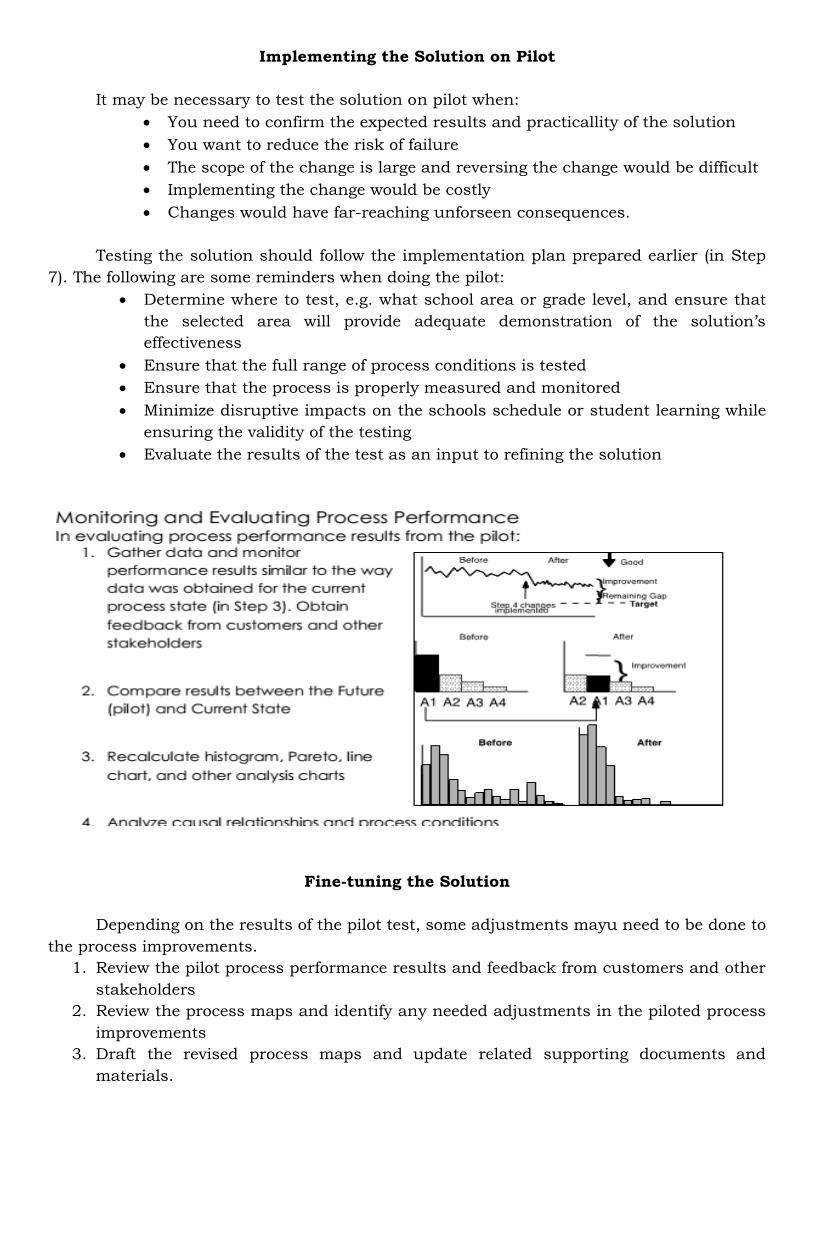
Analyzing Process Performance
Data gathered on process performance should be analyzed in order to:
Separate what we think from what is really happening; validate storm clouds.
Confirm or disprove preconceived ideas and theories.
Create a baseline of performance.
be able to see the pattern of the problem over time.
Measure the impact of subsequent changes on a process (provide a baseline).
Identify and understand relationships that might help explain variation.

Step 5: Do Root Cause Analysis
Activity What You Need Tools to Use Outputs
1. Brainstorm
on possible
causes
Data Analysis
Charts
Critical sub-
process or activity
Fishbone
diagram or
Why-why
diagram
Possible root
causes
2. Validate the
possible root
causes
Possible root
causes
Validation table Valid root causes
3. Prioritize the
valid root
causes
Valid root causes Decision matrix Priority valid root
causes

Brainstorming on Possible Root Causes
The root cause is the deepest underlying cause of problematic symptoms within any
process.
Causes may be classified as follows:
- a cause that directly results in an occurrence.
Example: Absenteeism Low Grade Contributing Cause: a cause that indirectly
results in an occurrence but by itself did not cause the occurrence. Example: Body
Mass Index (BMI) Student Grades
Cause- a cause that, if corrected, would prevent a particular recurrence and other
similar occurrences. Example: Use of unfamiliar words in Math problems (e.g. Combine)
Low Student Test Score
Root causes may be identified through cause-and-effect analysis:
1. State the problem (from Step 4).
2. Brainstorm on possible causes.
Exhaust all possible causes, drilling down per sub-cause by asking “Why?
3. Draw the cause-and effect diagram and arrange related causes together

Validating Root Causes
From the brainstorming, we may realize that not all root causes may be real
and within the control of the CI Team. Data needs to be obtained on the occurrence of the
root causes.
To validate the possible root causes:
1. Plan for data collection.
2. Obtain data for each possible root cause.
3. Evaluate the data to determine if the cause is real or not, as well as the level of its
contribution to the problem.
4. Assess the root cause for controllability.
5. Summarize or list down the valid and controllable root causes

Prioritizing the Valid Root Causes
There may be constraints in addressing the valid root causes, such as:
Limited financial and other resources
Limited time to develop and implement solutions
Some causes may be beyond the control of the CI Team
Valid controllable root causes that contribute the most to the problem should
be prioritized. Using the Pareto analysis may help.
Valid causes beyond the control of the CI Team should be noted and
communicated to the School Head and/ or School CI Facilitator for possible action
by other CI Teams.
Root Cause analysis drills down to the very heart of the problem. Now that we have
identified the main cause of the problem, we can develop appropriate solutions.
Step 6: Develop Solutions
Activity What You Need Tools to Use Outputs
1. Set
Improvement
objective
Problem Statement
Prioritized valid root
causes
Objective
statement
2. Subject Root
causes to
critical
analysis
Objective statement
Data analysis
Charts
Critical sub-process
or activity flowchart
Brainstorming Potential
improvements
3. Generate
alternative
solutions
Objective statement
Alternative
solutions
Solution selection
criteria
Brainstorming
Cost-benefit
analysis
Force field
analysis
Alternative
solutions
4. Select the
best solution
Objective Statement
Alternative
solutions
Solution selection
criteria
Decision Matrix Best Solution
5. Develop the
future process
maps
Best solution Process Mapping Future Process
Maps
Setting Improvement Objectives
An improvement objective should be set before solutions are generated. The
improvement objective proceeds from the focused problem statement.
An improvement objective should be SMART:
S-pecific
M-easurable
A-chievable
R-elevant
T-ime-bound
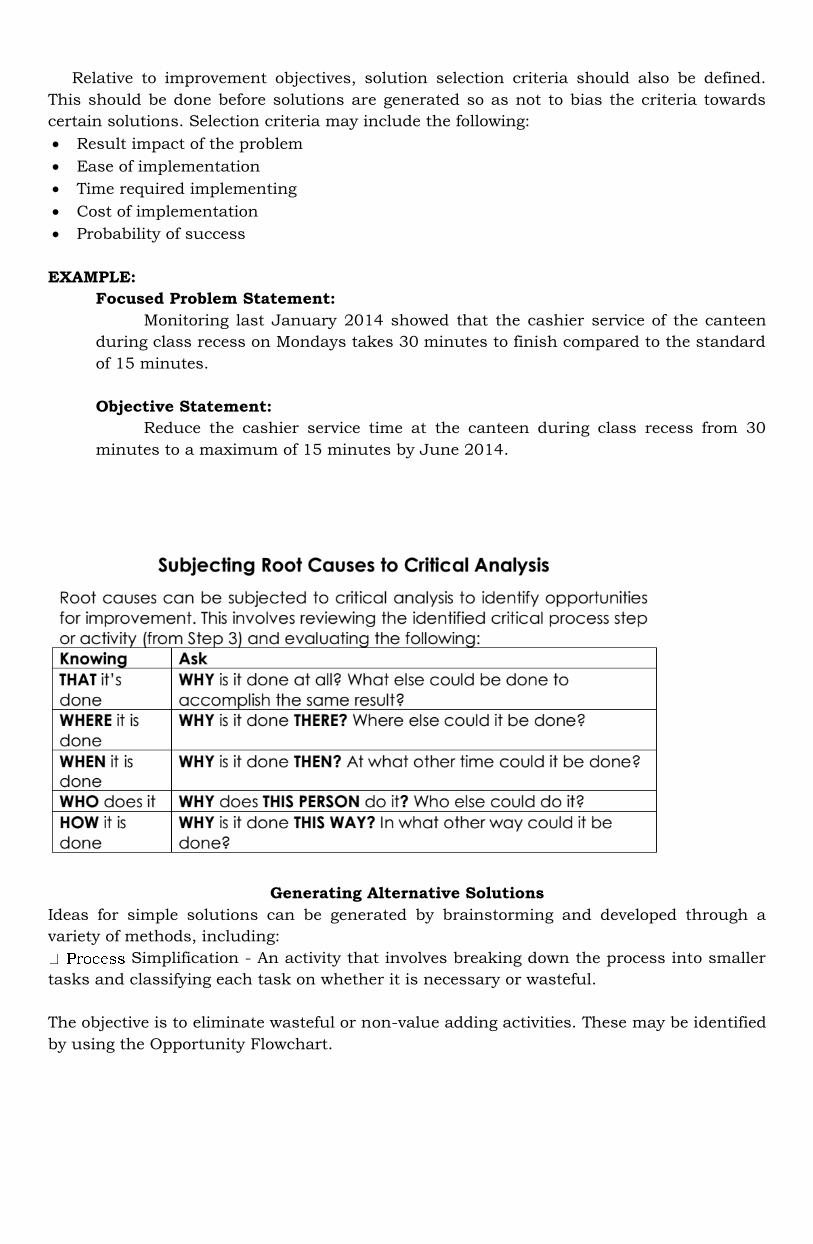
Relative to improvement objectives, solution selection criteria should also be defined.
This should be done before solutions are generated so as not to bias the criteria towards
certain solutions. Selection criteria may include the following:
Result impact of the problem
Ease of implementation
Time required implementing
Cost of implementation
Probability of success
EXAMPLE:
Focused Problem Statement:
Monitoring last January 2014 showed that the cashier service of the canteen
during class recess on Mondays takes 30 minutes to finish compared to the standard
of 15 minutes.
Objective Statement:
Reduce the cashier service time at the canteen during class recess from 30
minutes to a maximum of 15 minutes by June 2014.
Generating Alternative Solutions
Ideas for simple solutions can be generated by brainstorming and developed through a
variety of methods, including:
Simplification - An activity that involves breaking down the process into smaller
tasks and classifying each task on whether it is necessary or wasteful.
The objective is to eliminate wasteful or non-value adding activities. These may be identified
by using the Opportunity Flowchart.


Step 7: Finalize Improvement Plan
Activity What You Need Tools to Use Outputs
1. Identify
implementation
activities and
requirements
Objective Statement
Best alternative
solutions
How-how
diagram
Detailed
implementation
activities and
requirements
2. Prepare the
implementation
schedule and
budget
Objective Statement
Detailed
implementation
activities and
requirements
Stakeholder support
requirements
Communication
requirements
Gantt Chart Solution
implementation
schedule and
budget
Communication
plan
3. Conduct
potential
problem
analysis
Objective Statement
Best alternative
solutions
Solution
implementation
schedule and
budget
Communication
plan
Potential problem
Analysis Matrix
Preventive
actions


Step 8: Pilot your Solution
Activity What You Need Tools to Use Outputs
1. Implement the
improvements
Solution
implementation
schedule and
budget
Communication
plan
2. Monitor and
evaluate
process
performance
Solution
implementation
schedule and
budget
communication
plan
Data analysis
charts (as
applicable)
Process
performance
report
(comparison to
baseline)
3. Monitor and
evaluate
progress
against the
implementation
plan
Objective Statement
Solution
implementation
Schedule and
budget
Communication
plan
Gantt chart Project status
report
Budget variance
report
4. Fine-tune the
solutions
Objective Statement
Best alternative
solution
Solution
implementation
schedule and
budget
Process
performance report
(comparison to
baseline)
Project status report
Budget variance
report
Potential problem
Analysis Matrix
Updated solution
design (for
rollout) rollout
implementation
schedule
Rollout
communication
plan
Preventive
actions (for
rollout)
Implementing the Solution on Pilot
It may be necessary to test the solution on pilot when:
You need to confirm the expected results and practicallity of the solution
You want to reduce the risk of failure
The scope of the change is large and reversing the change would be difficult
Implementing the change would be costly
Changes would have far-reaching unforseen consequences.
Testing the solution should follow the implementation plan prepared earlier (in Step
7). The following are some reminders when doing the pilot:
Determine where to test, e.g. what school area or grade level, and ensure that
the selected area will provide adequate demonstration of the solution’s
effectiveness
Ensure that the full range of process conditions is tested
Ensure that the process is properly measured and monitored
Minimize disruptive impacts on the schools schedule or student learning while
ensuring the validity of the testing
Evaluate the results of the test as an input to refining the solution
Fine-tuning the Solution
Depending on the results of the pilot test, some adjustments mayu need to be done to
the process improvements.
1. Review the pilot process performance results and feedback from customers and other
stakeholders
2. Review the process maps and identify any needed adjustments in the piloted process
improvements
3. Draft the revised process maps and update related supporting documents and
materials.

Step 9: Roll Out Your Solutions
Activity What You Need Tools to Use Outputs
1. Standardize
the solution
Objective
statements
Best solution
rollout
Rollout
implementation
schedule and
budget
Rollout
communication
plan
Process
performance report
(comparison to
baseline)
Project status
report
Budget variance
report
Activity
flowchart
Potential
problem
analysis matrix
Updated solution
design for rollout
Updated process
documentation
(including
policies,
guidelines, and
performance
standards)
Standardization
schedule and
budget
Standardization
communication
plan
Preventive
actions for
standardization
2. Rollout the
improved
process
Rollout
implementation
plan schedule and
budget
Rollout
communication
plan
Implemented
improvements
3. Monitor and
evaluate
process
performance
Rollout
implementation
schedule and
budget
Rollout
communication
plan
Data analysis
charts (as
applicable)
Process
performance
report
(comparison to
baseline)
4. Monitor and
evaluate
progress
against the
rollout plan
Objective
statements
Rollout
implementation
schedule and
budget
Rollout
communication
plan
Gnat chart Project status
report
Budget variance
report

Step 10: Check Your Progress
Activity What You Need Tools to Use Outputs
1. Monitor and
evaluate
process
performance
(regular
process
monitoring)
Process
performance
measures and
standards
Data analysis
charts (as
applicable)
Process
performance
report
2. Monitor and
evaluate
process
compliance
Process
documentation,
including policies
and guidelines
Process
compliance
report (checked
against process
documentation)
3. Assess
achievement
of project
objectives
Objective statement Data analysis
charts (as
applicable)
Project
assessment
report
4. Close the
project
Process
performance report
Process compliance
report
Project assessment
report
Closure of project
report
Recommended