Embed Size (px)
Citation preview

平成28年6月分June, 2016
Indices of Production Capacity and Operating Ratio
製造工業生産能力指数・稼働率指数
Ministry of Economy, Trade and Industry
Research and Statistics DepartmentMinister’s Secretariat
平成28年8月15日August 15, 2016
経済産業省大臣官房調査統計グループ

1
平成28年6月の製造工業生産能力指数・稼働率指数の動向
Indices of Production Capacity and Operating Ratio for June, 2016
平 成 22 年 =100Index, 2010 =100
前月比(%) 前月比(%) 前年同月比(%)
項目 From Previous Month From Previous Year
稼働率Operating Ratio
95.6 1.5 ( ▲ 2.4 ) 100.0 9.9 ▲ 2.4
生産能力ProductionCapacity
94.6 0.0 ▲ 0.6
注 :▲は低下を示す。Note:▲ indicates a negative figure.
(前月における前月比(%))
From Previous Month
季 節 調 整 済 指 数 原 指 数
Seasonally Adjusted Index Original Index
Percent Change Percent Change
(1) 6月の製造工業稼働率指数は、95.6で前月比1.5%の上昇であった。
業種別にみると、はん用・生産用・業務用機械工業同3.6%、輸送機械工業同1.3%、
電気機械工業同3.7%等が上昇し、電子部品・デバイス工業同▲2.1%、情報通信機
械工業同▲3.4%、鉄鋼業同▲0.8%が低下した。
(2) 6月の製造工業生産能力指数は、94.6で前月比0.0%の横ばいであった。
業種別にみると、化学工業同0.2%が上昇し、はん用・生産用・業務用機械工業同
▲0.2%、繊維工業同▲0.1%が低下した。

2
前月(期)比%Change From
PreviousMonth(Quarter)
前年(同月期)比
%Change FromPrevious Year
前月(期)比%Change From
PreviousMonth(Quarter)
前年(同月期)比
%Change FromPrevious Year
平成 25 年 97.3 ▲ 0.5 97.1 ▲ 1.1 C.Y. 2013
26 101.3 4.1 95.3 ▲ 1.9 C.Y. 2014
27 98.7 ▲ 2.6 95.0 ▲ 0.3 C.Y. 2015
平成 25 年度 100.0 4.8 96.1 ▲ 1.8 F.Y. 2013
26 100.6 0.6 95.6 ▲ 0.5 F.Y. 2014
27 98.0 ▲ 2.6 94.8 ▲ 0.8 F.Y. 2015
平成27 年 Ⅱ期 98.0 ▲ 3.4 97.2 ▲ 3.2 95.2 ▲ 0.4 0.1 Q2 2015
Ⅲ期 97.6 ▲ 0.4 98.7 ▲ 2.2 94.9 ▲ 0.3 ▲ 0.2 Q3
Ⅳ期 97.9 0.3 97.8 ▲ 2.2 95.0 0.1 ▲ 0.3 Q4
平成28 年 Ⅰ期 97.3 ▲ 0.6 98.3 ▲ 2.9 94.8 ▲ 0.2 ▲ 0.8 Q1 2016
Ⅱ期 95.4 ▲ 2.0 94.6 ▲ 2.7 94.6 ▲ 0.2 ▲ 0.6 Q2
平成27 年 4月 99.3 ▲ 0.6 97.0 ▲ 2.6 95.4 ▲ 0.2 0.2 Apr. 2015
5月 96.8 ▲ 2.5 92.1 ▲ 6.7 95.5 0.1 0.2 May
6月 98.0 1.2 102.5 ▲ 0.5 95.2 ▲ 0.3 0.1 Jun.
7月 97.7 ▲ 0.3 105.2 ▲ 1.7 95.2 0.0 0.2 Jul.
8月 97.4 ▲ 0.3 89.2 ▲ 2.1 94.9 ▲ 0.3 ▲ 0.1 Aug.
9月 97.7 0.3 101.8 ▲ 2.7 94.9 0.0 ▲ 0.2 Sep.
10月 98.4 0.7 99.7 ▲ 3.2 95.1 0.2 ▲ 0.1 Oct.
11月 98.2 ▲ 0.2 97.2 0.0 95.1 0.0 ▲ 0.1 Nov.
12月 97.2 ▲ 1.0 96.4 ▲ 3.3 95.0 ▲ 0.1 ▲ 0.3 Dec.
平成28 年 1月 99.9 2.8 93.0 ▲ 5.3 94.8 ▲ 0.2 ▲ 0.8 Jan. 2016
2月 94.5 ▲ 5.4 95.9 ▲ 2.3 94.9 0.1 ▲ 0.7 Feb.
3月 97.5 3.2 106.1 ▲ 0.9 94.8 ▲ 0.1 ▲ 0.8 Mar.
4月 96.5 ▲ 1.0 92.8 ▲ 4.3 94.6 ▲ 0.2 ▲ 0.8 Apr.
5月 94.2 ▲ 2.4 91.0 ▲ 1.2 94.6 0.0 ▲ 0.9 May
6月 95.6 1.5 100.0 ▲ 2.4 94.6 0.0 ▲ 0.6 Jun.
稼働率 Operating Ratio
季節調整済指数Seasonally Adjusted Index
原指数Original Index
製造工業生産能力指数・稼働率指数の推移(グラフ) Historical Data (Graph) for Indices of Production Capacity and Operating Ratio
製造工業生産能力指数・稼働率指数の時系列表 Historical Data for Indices of Production Capacity and Operating Ratio
Year andMonth
生産能力(末) Production Capacity
原指数Original Index
平成22年 =100index,2010= 100
年 月
94
96
98
100
102
70
80
90
100
110
6 7 8 9 10 11 12 1 2 3 4 5 6 7 8 9 10 11 12 1 2 3 4 5 6 7 8 9 10 11 12 1 2 3 4 5 6 7 8 9 10 11 12 1 2 3 4 5 6 7 8 9 10 11 12 1 2 3 4 5 6
23年 24年 25年 26年 27年 28年
生産能力指数 稼働率指数
平成
(平成22年基準) (2010 average=100)
稼働率:季節調整済指数 (Operating Ratio) :Seasonally Adjusted Index
生産能力:原指数 (Production Capacity) :Original Index

3
〈1. 鉄鋼業 ; Iron and steel〉 〈2. 非鉄金属工業 ; Non-ferrous metals〉
前月(期)比%Change
FromPreviousMonth
(Quarter)
前年(同月期)比
%ChangeFrom
PreviousYear
前月(期)比%Change
FromPreviousMonth
(Quarter)
前年(同月期)比
%ChangeFrom
PreviousYear
前月(期)比%Change
FromPreviousMonth
(Quarter)
前年(同月期)比
%ChangeFrom
PreviousYear
前月(期)比%Change
FromPreviousMonth
(Quarter)
前年(同月期)比
%ChangeFrom
PreviousYear
平成 25 年 97.7 2.0 99.7 0.0 95.7 ▲ 1.1 99.4 ▲ 0.9 C.Y. 201326 年 98.9 1.2 98.9 ▲ 0.8 99.1 3.6 98.9 ▲ 0.5 201427 年 94.5 ▲ 4.4 97.5 ▲ 1.4 97.8 ▲ 1.3 97.8 ▲ 1.1 2015
平成 25 年度 98.5 2.9 99.6 ▲ 0.1 97.3 1.9 99.0 ▲ 1.3 F.Y. 201326 年度 98.1 ▲ 0.4 98.7 ▲ 0.9 99.0 1.7 99.0 0.0 201427 年度 93.9 ▲ 4.3 97.7 ▲ 1.0 98.1 ▲ 0.9 97.8 ▲ 1.2 2015
平成27 年 Ⅱ期 94.0 ▲ 2.3 93.4 ▲ 5.2 97.7 ▲ 1.0 ▲ 1.0 97.6 ▲ 2.4 98.0 ▲ 1.4 98.4 ▲ 0.6 ▲ 0.5 Q2 2015Ⅲ期 94.0 0.0 94.7 ▲ 5.3 97.7 0.0 ▲ 1.0 97.8 0.2 97.5 ▲ 0.5 98.1 ▲ 0.3 ▲ 0.8 Q3Ⅳ期 94.2 0.2 93.8 ▲ 3.9 97.5 ▲ 0.2 ▲ 1.4 95.8 ▲ 2.0 97.3 ▲ 2.8 97.8 ▲ 0.3 ▲ 1.1 Q4
平成28 年 Ⅰ期 92.6 ▲ 1.7 93.9 ▲ 2.5 97.7 0.2 ▲ 1.0 99.2 3.5 99.4 1.0 97.8 0.0 ▲ 1.2 Q1 2016Ⅱ期 96.0 3.7 95.4 2.1 95.6 ▲ 2.1 ▲ 2.1 98.1 ▲ 1.1 98.4 0.4 98.0 0.2 ▲ 0.4 Q2
平成27 年 4月 93.7 ▲ 1.8 90.5 ▲ 5.9 97.7 ▲ 1.0 ▲ 1.2 98.3 ▲ 0.8 98.2 ▲ 1.3 98.9 ▲ 0.1 0.0 Apr. 20155月 94.6 1.0 96.5 ▲ 4.6 97.7 0.0 ▲ 1.2 95.7 ▲ 2.6 92.8 ▲ 4.6 98.9 0.0 0.1 May6月 93.6 ▲ 1.1 93.1 ▲ 5.1 97.7 0.0 ▲ 1.0 98.9 3.3 102.9 1.6 98.4 ▲ 0.5 ▲ 0.5 Jun.7月 94.6 1.1 95.8 ▲ 4.6 97.7 0.0 ▲ 1.0 98.3 ▲ 0.6 104.3 0.0 98.3 ▲ 0.1 ▲ 0.6 Jul.8月 94.2 ▲ 0.4 94.9 ▲ 5.4 97.7 0.0 ▲ 1.0 97.5 ▲ 0.8 87.0 ▲ 0.8 98.3 0.0 ▲ 0.5 Aug.9月 93.3 ▲ 1.0 93.3 ▲ 5.9 97.7 0.0 ▲ 1.0 97.5 0.0 101.2 ▲ 0.8 98.1 ▲ 0.2 ▲ 0.8 Sep.10月 93.6 0.3 95.2 ▲ 5.9 97.6 ▲ 0.1 ▲ 1.3 95.4 ▲ 2.2 100.1 ▲ 4.6 97.8 ▲ 0.3 ▲ 1.2 Oct.11月 94.4 0.9 93.6 ▲ 3.5 97.6 0.0 ▲ 1.3 96.6 1.3 97.6 ▲ 0.4 97.8 0.0 ▲ 1.2 Nov.12月 94.6 0.2 92.6 ▲ 2.0 97.5 ▲ 0.1 ▲ 1.4 95.4 ▲ 1.2 94.3 ▲ 3.2 97.8 0.0 ▲ 1.1 Dec.
平成28 年 1月 93.5 ▲ 1.2 94.5 ▲ 3.6 97.7 0.2 ▲ 1.0 100.3 5.1 94.0 ▲ 2.0 97.8 0.0 ▲ 1.2 Jan. 20162月 93.1 ▲ 0.4 90.3 0.8 97.7 0.0 ▲ 1.0 97.9 ▲ 2.4 98.8 2.7 97.8 0.0 ▲ 1.2 Feb.3月 91.3 ▲ 1.9 96.8 ▲ 4.3 97.7 0.0 ▲ 1.0 99.5 1.6 105.4 2.2 97.8 0.0 ▲ 1.2 Mar.4月 96.0 5.1 92.5 2.2 95.6 ▲ 2.1 ▲ 2.1 99.1 ▲ 0.4 97.8 ▲ 0.4 98.0 0.2 ▲ 0.9 Apr.5月 96.4 0.4 98.5 2.1 95.6 0.0 ▲ 2.1 96.5 ▲ 2.6 94.7 2.0 98.0 0.0 ▲ 0.9 May6月 95.6 ▲ 0.8 95.1 2.1 95.6 0.0 ▲ 2.1 98.7 2.3 102.7 ▲ 0.2 98.0 0.0 ▲ 0.4 Jun.
〈3. 金属製品工業 ; Fabricated metals〉 〈4.はん用・生産用・業務用機械工業 ; 〉
前月(期)比%Change
FromPreviousMonth
(Quarter)
前年(同月期)比
%ChangeFrom
PreviousYear
前月(期)比%Change
FromPreviousMonth
(Quarter)
前年(同月期)比
%ChangeFrom
PreviousYear
前月(期)比%Change
FromPreviousMonth
(Quarter)
前年(同月期)比
%ChangeFrom
PreviousYear
前月(期)比%Change
FromPreviousMonth
(Quarter)
前年(同月期)比
%ChangeFrom
PreviousYear
平成 25 年 99.7 0.7 94.0 ▲ 1.3 109.8 ▲ 3.1 98.9 ▲ 3.6 C.Y. 201326 年 104.0 4.3 93.2 ▲ 0.9 125.2 14.0 100.3 1.4 201427 年 108.1 3.9 93.8 0.6 120.5 ▲ 3.8 99.5 ▲ 0.8 2015
平成 25 年度 101.7 3.1 94.4 ▲ 0.8 115.1 6.4 99.2 ▲ 2.9 F.Y. 201326 年度 105.1 3.3 93.5 ▲ 1.0 126.0 9.5 102.2 3.0 201427 年度 107.9 2.7 94.1 0.6 117.2 ▲ 7.0 99.8 ▲ 2.3 2015
平成27 年 Ⅱ期 106.5 ▲ 2.6 109.0 2.8 93.5 0.0 0.1 123.1 ▲ 3.2 121.4 ▲ 1.4 101.9 ▲ 0.3 2.8 Q2 2015Ⅲ期 107.9 1.3 112.0 4.7 93.5 0.0 0.0 116.5 ▲ 5.4 119.4 ▲ 7.2 100.2 ▲ 1.7 0.9 Q3Ⅳ期 108.5 0.6 105.6 3.9 93.8 0.3 0.6 115.5 ▲ 0.9 114.1 ▲ 8.8 99.5 ▲ 0.7 ▲ 0.8 Q4
平成28 年 Ⅰ期 107.1 ▲ 1.3 105.1 ▲ 0.5 94.1 0.3 0.6 112.5 ▲ 2.6 114.1 ▲ 10.2 99.8 0.3 ▲ 2.3 Q1 2016Ⅱ期 105.4 ▲ 1.6 107.9 ▲ 1.0 94.1 0.0 0.6 110.7 ▲ 1.6 109.2 ▲ 10.0 99.4 ▲ 0.4 ▲ 2.5 Q2
平成27 年 4月 108.6 0.5 110.1 4.8 93.5 0.0 ▲ 0.2 124.8 0.6 120.5 0.4 102.3 0.1 3.2 Apr. 20155月 105.9 ▲ 2.5 106.3 2.1 93.5 0.0 ▲ 0.2 121.7 ▲ 2.5 110.8 ▲ 6.0 102.3 0.0 3.2 May6月 105.0 ▲ 0.8 110.6 1.6 93.5 0.0 0.1 122.7 0.8 132.8 1.0 101.9 ▲ 0.4 2.8 Jun.7月 108.0 2.9 117.0 5.3 93.5 0.0 0.0 120.4 ▲ 1.9 130.5 ▲ 3.9 102.3 0.4 3.2 Jul.8月 107.2 ▲ 0.7 103.2 2.6 93.5 0.0 0.0 117.7 ▲ 2.2 107.3 ▲ 4.5 100.3 ▲ 2.0 1.0 Aug.9月 108.5 1.2 115.9 6.1 93.5 0.0 0.0 111.3 ▲ 5.4 120.3 ▲ 12.8 100.2 ▲ 0.1 0.9 Sep.10月 108.0 ▲ 0.5 107.9 1.9 93.7 0.2 0.4 116.2 4.4 117.9 ▲ 10.9 100.2 0.0 0.6 Oct.11月 109.2 1.1 106.2 6.2 93.7 0.0 0.4 115.2 ▲ 0.9 111.3 ▲ 6.4 99.7 ▲ 0.5 ▲ 0.4 Nov.12月 108.2 ▲ 0.9 102.7 3.8 93.8 0.1 0.6 115.0 ▲ 0.2 113.1 ▲ 8.9 99.5 ▲ 0.2 ▲ 0.8 Dec.
平成28 年 1月 109.5 1.2 97.2 0.6 94.2 0.4 1.2 116.9 1.7 103.8 ▲ 12.3 99.7 0.2 ▲ 2.2 Jan. 20162月 101.9 ▲ 6.9 97.0 ▲ 6.5 94.1 ▲ 0.1 1.0 111.2 ▲ 4.9 113.7 ▲ 8.6 99.6 ▲ 0.1 ▲ 2.4 Feb.3月 109.9 7.9 121.2 3.9 94.1 0.0 0.6 109.3 ▲ 1.7 124.7 ▲ 10.0 99.8 0.2 ▲ 2.3 Mar.4月 106.6 ▲ 3.0 107.2 ▲ 2.6 94.1 0.0 0.6 114.5 4.8 107.9 ▲ 10.5 99.6 ▲ 0.2 ▲ 2.6 Apr.5月 102.9 ▲ 3.5 104.1 ▲ 2.1 94.1 0.0 0.6 106.9 ▲ 6.6 99.7 ▲ 10.0 99.6 0.0 ▲ 2.6 May6月 106.7 3.7 112.4 1.6 94.1 0.0 0.6 110.8 3.6 119.9 ▲ 9.7 99.4 ▲ 0.2 ▲ 2.5 Jun.
原指数Original Index
生産能力(末)Production Capacity
季節調整済指数Seasonally Adjusted
Index
原指数Original Index
稼働率Operating Ratio
生産能力(末)Production Capacity
季節調整済指数Seasonally Adjusted
Index
稼働率Operating Ratio
稼働率Operating Ratio
原指数Original Index
原指数Original Index
General-purpose, production andbusiness oriented machinery
原指数Original Index
生産能力(末)Production Capacity
平成22年 =100index,2010= 100
原指数Original Index
生産能力(末)Production Capacity
季節調整済指数Seasonally Adjusted
Index
季節調整済指数Seasonally Adjusted
Index
稼働率Operating Ratio
原指数Original Index
原指数Original Index

4
〈5. 電子部品・デバイス工業 ; Electronic parts and devices〉 〈6. 電気機械工業 ; Electrical machinery〉
前月(期)比%Change
FromPreviousMonth
(Quarter)
前年(同月期)比
%ChangeFrom
PreviousYear
前月(期)比%Change
FromPreviousMonth
(Quarter)
前年(同月期)比
%ChangeFrom
PreviousYear
前月(期)比%Change
FromPreviousMonth
(Quarter)
前年(同月期)比
%ChangeFrom
PreviousYear
前月(期)比%Change
FromPreviousMonth
(Quarter)
前年(同月期)比
%ChangeFrom
PreviousYear
平成 25 年 88.7 3.3 104.0 0.5 98.6 2.5 97.1 0.6 C.Y. 201326 年 96.5 8.8 101.2 ▲ 2.7 101.7 3.1 98.6 1.5 201427 年 96.5 0.0 103.3 2.1 98.4 ▲ 3.2 102.2 3.7 2015
平成 25 年度 90.4 5.5 104.0 1.6 103.0 8.3 98.3 0.9 F.Y. 201326 年度 98.4 8.8 100.4 ▲ 3.5 98.5 ▲ 4.4 101.5 3.3 201427 年度 95.0 ▲ 3.5 103.1 2.7 100.0 1.5 102.4 0.9 2015
平成27 年 Ⅱ期 96.1 ▲ 4.9 97.6 0.6 100.8 0.4 0.8 98.7 1.2 113.8 ▲ 3.2 101.7 0.2 3.5 Q2 2015Ⅲ期 94.7 ▲ 1.5 99.5 ▲ 2.9 101.0 0.2 2.2 97.9 ▲ 0.8 96.2 2.2 101.7 0.0 3.2 Q3Ⅳ期 94.6 ▲ 0.1 92.6 ▲ 5.3 103.3 2.3 2.1 99.8 1.9 93.9 1.1 102.2 0.5 3.7 Q4
平成28 年 Ⅰ期 93.4 ▲ 1.3 90.3 ▲ 6.1 103.1 ▲ 0.2 2.7 102.4 2.6 96.0 7.3 102.4 0.2 0.9 Q1 2016Ⅱ期 91.2 ▲ 2.4 92.6 ▲ 5.1 102.9 ▲ 0.2 2.1 102.0 ▲ 0.4 117.6 3.3 102.5 0.1 0.8 Q2
平成27 年 4月 97.6 ▲ 0.9 94.8 3.0 99.9 ▲ 0.5 ▲ 0.3 99.8 5.5 110.8 ▲ 3.1 101.2 ▲ 0.3 3.1 Apr. 20155月 95.0 ▲ 2.7 96.9 ▲ 3.2 100.4 0.5 0.0 97.5 ▲ 2.3 105.0 ▲ 7.7 101.5 0.3 3.4 May6月 95.7 0.7 101.0 2.1 100.8 0.4 0.8 98.7 1.2 125.6 0.9 101.7 0.2 3.5 Jun.7月 94.6 ▲ 1.1 101.0 ▲ 1.6 101.0 0.2 2.6 96.5 ▲ 2.2 117.7 ▲ 0.5 101.7 0.0 3.5 Jul.8月 93.6 ▲ 1.1 94.7 ▲ 3.6 101.1 0.1 2.6 96.9 0.4 80.4 4.0 101.7 0.0 3.5 Aug.9月 95.8 2.4 102.7 ▲ 3.7 101.0 ▲ 0.1 2.2 100.3 3.5 90.6 4.4 101.7 0.0 3.2 Sep.10月 94.3 ▲ 1.6 94.2 ▲ 6.4 103.2 2.2 2.2 101.1 0.8 93.9 ▲ 2.6 102.1 0.4 3.5 Oct.11月 95.4 1.2 93.3 ▲ 3.2 103.4 0.2 2.5 99.8 ▲ 1.3 93.2 4.0 102.2 0.1 3.7 Nov.12月 94.2 ▲ 1.3 90.2 ▲ 6.4 103.3 ▲ 0.1 2.1 98.4 ▲ 1.4 94.5 1.8 102.2 0.0 3.7 Dec.
平成28 年 1月 93.4 ▲ 0.8 88.2 ▲ 11.4 103.2 ▲ 0.1 2.8 103.4 5.1 85.0 ▲ 0.4 102.1 ▲ 0.1 0.9 Jan. 20162月 92.6 ▲ 0.9 87.8 ▲ 3.1 103.1 ▲ 0.1 2.4 98.6 ▲ 4.6 93.8 8.3 102.9 0.8 1.4 Feb.3月 94.2 1.7 94.8 ▲ 3.7 103.1 0.0 2.7 105.1 6.6 109.1 12.8 102.4 ▲ 0.5 0.9 Mar.4月 93.6 ▲ 0.6 90.0 ▲ 5.1 102.5 ▲ 0.6 2.6 103.2 ▲ 1.8 112.0 1.1 102.6 0.2 1.4 Apr.5月 91.0 ▲ 2.8 93.8 ▲ 3.2 102.9 0.4 2.5 99.5 ▲ 3.6 109.6 4.4 102.5 ▲ 0.1 1.0 May6月 89.1 ▲ 2.1 94.0 ▲ 6.9 102.9 0.0 2.1 103.2 3.7 131.3 4.5 102.5 0.0 0.8 Jun.
〈7.情報通信機械工業 ; Information and communication electronics equipment〉 〈8. 輸送機械工業 ; Transport equipment〉
前月(期)比%Change
FromPreviousMonth
(Quarter)
前年(同月期)比
%ChangeFrom
PreviousYear
前月(期)比%Change
FromPreviousMonth
(Quarter)
前年(同月期)比
%ChangeFrom
PreviousYear
前月(期)比%Change
FromPreviousMonth
(Quarter)
前年(同月期)比
%ChangeFrom
PreviousYear
前月(期)比%Change
FromPreviousMonth
(Quarter)
前年(同月期)比
%ChangeFrom
PreviousYear
平成 25 年 81.2 ▲ 8.2 78.6 ▲ 5.2 99.7 ▲ 2.7 99.7 ▲ 0.6 C.Y. 201326 年 72.5 ▲ 10.7 74.9 ▲ 4.7 105.8 6.1 95.8 ▲ 3.9 201427 年 64.0 ▲ 11.7 71.2 ▲ 4.9 99.9 ▲ 5.6 96.3 0.5 2015
平成 25 年度 84.0 3.7 77.0 ▲ 4.8 103.8 5.6 95.6 ▲ 4.8 F.Y. 201326 年度 67.9 ▲ 19.2 73.2 ▲ 4.9 103.8 0.0 96.3 0.7 201427 年度 63.7 ▲ 6.2 70.5 ▲ 3.7 99.0 ▲ 4.6 96.0 ▲ 0.3 2015
平成27 年 Ⅱ期 65.0 ▲ 1.1 58.8 ▲ 12.5 71.3 ▲ 2.6 ▲ 5.9 97.9 ▲ 5.6 94.0 ▲ 9.4 96.2 ▲ 0.1 0.7 Q2 2015Ⅲ期 64.0 ▲ 1.5 63.7 ▲ 2.7 71.6 0.4 ▲ 5.4 97.4 ▲ 0.5 98.5 ▲ 4.9 96.2 0.0 0.5 Q3Ⅳ期 61.3 ▲ 4.2 61.0 ▲ 7.9 71.2 ▲ 0.6 ▲ 4.9 100.3 3.0 100.8 ▲ 0.6 96.3 0.1 0.5 Q4
平成28 年 Ⅰ期 65.1 6.2 71.0 ▲ 2.1 70.5 ▲ 1.0 ▲ 3.7 97.8 ▲ 2.5 102.6 ▲ 3.7 96.0 ▲ 0.3 ▲ 0.3 Q1 2016Ⅱ期 65.9 1.2 59.4 1.0 70.5 0.0 ▲ 1.1 94.1 ▲ 3.8 90.3 ▲ 3.9 96.0 0.0 ▲ 0.2 Q2
平成27 年 4月 63.7 ▲ 2.5 56.1 ▲ 21.2 73.2 0.0 ▲ 4.9 100.0 ▲ 2.4 92.9 ▲ 7.0 96.3 0.0 0.8 Apr. 20155月 63.8 0.2 51.6 ▲ 16.5 73.2 0.0 ▲ 4.9 96.5 ▲ 3.5 83.9 ▲ 16.4 96.2 ▲ 0.1 0.7 May6月 67.5 5.8 68.8 0.4 71.3 ▲ 2.6 ▲ 5.9 97.3 0.8 105.2 ▲ 5.1 96.2 0.0 0.7 Jun.7月 65.0 ▲ 3.7 67.2 1.2 71.3 0.0 ▲ 5.8 97.2 ▲ 0.1 109.5 ▲ 6.2 96.2 0.0 0.7 Jul.8月 64.4 ▲ 0.9 55.9 0.2 71.1 ▲ 0.3 ▲ 6.1 96.8 ▲ 0.4 78.7 ▲ 5.1 96.2 0.0 0.7 Aug.9月 62.7 ▲ 2.6 68.1 ▲ 8.3 71.6 0.7 ▲ 5.4 98.1 1.3 107.2 ▲ 3.6 96.2 0.0 0.5 Sep.10月 61.5 ▲ 1.9 60.7 ▲ 8.2 71.6 0.0 ▲ 4.4 101.8 3.8 104.8 ▲ 2.2 96.3 0.1 0.5 Oct.11月 61.7 0.3 57.9 ▲ 4.1 71.6 0.0 ▲ 4.4 100.4 ▲ 1.4 101.1 3.9 96.3 0.0 0.5 Nov.12月 60.8 ▲ 1.5 64.5 ▲ 10.7 71.2 ▲ 0.6 ▲ 4.9 98.6 ▲ 1.8 96.5 ▲ 3.2 96.3 0.0 0.5 Dec.
平成28 年 1月 65.7 8.1 60.8 ▲ 4.3 70.0 ▲ 1.7 ▲ 4.2 102.0 3.4 94.3 ▲ 6.0 96.0 ▲ 0.3 ▲ 0.3 Jan. 20162月 64.7 ▲ 1.5 67.1 ▲ 1.2 70.1 0.1 ▲ 4.2 91.6 ▲ 10.2 99.2 ▲ 6.4 96.0 0.0 ▲ 0.3 Feb.3月 65.0 0.5 85.2 ▲ 1.2 70.5 0.6 ▲ 3.7 99.7 8.8 114.3 1.0 96.0 0.0 ▲ 0.3 Mar.4月 65.9 1.4 57.1 1.8 70.5 0.0 ▲ 3.7 92.4 ▲ 7.3 83.1 ▲ 10.5 96.0 0.0 ▲ 0.3 Apr.5月 67.1 1.8 55.1 6.8 70.5 0.0 ▲ 3.7 94.3 2.1 84.7 1.0 96.0 0.0 ▲ 0.2 May6月 64.8 ▲ 3.4 66.1 ▲ 3.9 70.5 0.0 ▲ 1.1 95.5 1.3 103.2 ▲ 1.9 96.0 0.0 ▲ 0.2 Jun.
稼働率Operating Ratio
生産能力(末)Production Capacity
季節調整済指数Seasonally Adjusted
Index
原指数Original Index
原指数Original Index
原指数Original Index
稼働率Operating Ratio
稼働率Operating Ratio
生産能力(末)Production Capacity
季節調整済指数Seasonally Adjusted
Index
稼働率Operating Ratio
生産能力(末)Production Capacity
原指数Original Index
生産能力(末)Production Capacity
季節調整済指数Seasonally Adjusted
Index
原指数Original Index
原指数Original Index
季節調整済指数Seasonally Adjusted
Index
原指数Original Index
原指数Original Index
平成22年 =100index,2010= 100

5
〈9. 窯業・土石製品工業 ; Ceramics, stone and clay products〉 〈10. 化学工業 ; Chemicals〉
前月(期)比%Change
FromPreviousMonth
(Quarter)
前年(同月期)比
%ChangeFrom
PreviousYear
前月(期)比%Change
FromPreviousMonth
(Quarter)
前年(同月期)比
%ChangeFrom
PreviousYear
前月(期)比%Change
FromPreviousMonth
(Quarter)
前年(同月期)比
%ChangeFrom
PreviousYear
前月(期)比%Change
FromPreviousMonth
(Quarter)
前年(同月期)比
%ChangeFrom
PreviousYear
平成 25 年 98.6 3.2 93.9 ▲ 2.4 94.7 2.4 98.5 0.2 C.Y. 201326 年 101.1 2.5 94.0 0.1 91.8 ▲ 3.1 96.6 ▲ 1.9 201427 年 98.5 ▲ 2.6 93.1 ▲ 1.0 95.7 4.2 94.7 ▲ 2.0 2015
平成 25 年度 100.4 6.1 93.3 ▲ 2.5 95.3 3.1 98.4 0.1 F.Y. 201326 年度 100.6 0.2 93.7 0.4 91.6 ▲ 3.9 96.4 ▲ 2.0 201427 年度 98.4 ▲ 2.2 93.0 ▲ 0.7 96.3 5.1 93.8 ▲ 2.7 2015
平成27 年 Ⅱ期 97.1 ▲ 2.5 95.1 ▲ 5.8 93.9 0.2 ▲ 0.2 94.8 ▲ 0.1 92.1 6.4 95.6 ▲ 0.8 ▲ 2.0 Q2 2015Ⅲ期 97.8 0.7 98.5 ▲ 2.9 93.1 ▲ 0.9 ▲ 1.0 97.6 3.0 97.6 8.7 94.8 ▲ 0.8 ▲ 2.9 Q3Ⅳ期 99.7 1.9 103.1 0.5 93.1 0.0 ▲ 1.0 95.8 ▲ 1.8 98.5 3.5 94.7 ▲ 0.1 ▲ 2.0 Q4
平成28 年 Ⅰ期 97.9 ▲ 1.8 96.9 ▲ 0.4 93.0 ▲ 0.1 ▲ 0.7 95.2 ▲ 0.6 96.9 2.5 93.8 ▲ 1.0 ▲ 2.7 Q1 2016Ⅱ期 96.6 ▲ 1.3 94.6 ▲ 0.5 93.0 0.0 ▲ 1.0 93.2 ▲ 2.1 90.6 ▲ 1.6 94.2 0.4 ▲ 1.5 Q2
平成27 年 4月 96.9 ▲ 1.0 93.9 ▲ 7.6 93.9 0.2 0.6 96.0 ▲ 0.2 96.1 5.4 95.9 ▲ 0.5 ▲ 1.9 Apr. 20155月 97.6 0.7 92.2 ▲ 5.7 93.9 0.0 ▲ 0.4 93.9 ▲ 2.2 92.1 6.1 95.9 0.0 ▲ 1.8 May6月 96.9 ▲ 0.7 99.3 ▲ 4.1 93.9 0.0 ▲ 0.2 94.4 0.5 88.1 7.6 95.6 ▲ 0.3 ▲ 2.0 Jun.7月 98.4 1.5 103.9 ▲ 2.3 93.2 ▲ 0.7 ▲ 0.9 97.0 2.8 97.9 10.1 94.8 ▲ 0.8 ▲ 3.1 Jul.8月 97.2 ▲ 1.2 91.9 ▲ 3.2 93.1 ▲ 0.1 ▲ 1.0 95.5 ▲ 1.5 96.8 4.2 94.8 0.0 ▲ 3.1 Aug.9月 97.7 0.5 99.7 ▲ 3.3 93.1 0.0 ▲ 1.0 100.3 5.0 98.1 11.9 94.8 0.0 ▲ 2.9 Sep.10月 100.0 2.4 104.6 2.4 93.3 0.2 ▲ 0.7 96.8 ▲ 3.5 97.2 5.2 94.8 0.0 ▲ 1.9 Oct.11月 99.3 ▲ 0.7 102.8 ▲ 0.3 93.1 ▲ 0.2 ▲ 1.0 95.1 ▲ 1.8 96.6 3.0 94.7 ▲ 0.1 ▲ 2.0 Nov.12月 99.9 0.6 102.0 ▲ 0.7 93.1 0.0 ▲ 1.0 95.6 0.5 101.6 2.2 94.7 0.0 ▲ 2.0 Dec.
平成28 年 1月 96.8 ▲ 3.1 92.3 ▲ 4.7 93.0 ▲ 0.1 ▲ 1.1 95.6 0.0 99.3 1.5 94.5 ▲ 0.2 ▲ 2.2 Jan. 20162月 97.2 0.4 95.8 1.4 93.0 0.0 ▲ 0.9 93.6 ▲ 2.1 95.6 5.3 94.4 ▲ 0.1 ▲ 2.2 Feb.3月 99.6 2.5 102.5 2.1 93.0 0.0 ▲ 0.7 96.4 3.0 95.7 0.7 93.8 ▲ 0.6 ▲ 2.7 Mar.4月 97.5 ▲ 2.1 93.8 ▲ 0.1 93.0 0.0 ▲ 1.0 96.8 0.4 96.8 0.7 94.0 0.2 ▲ 2.0 Apr.5月 94.5 ▲ 3.1 89.9 ▲ 2.5 93.0 0.0 ▲ 1.0 91.2 ▲ 5.8 89.5 ▲ 2.8 94.0 0.0 ▲ 2.0 May6月 97.7 3.4 100.1 0.8 93.0 0.0 ▲ 1.0 91.6 0.4 85.5 ▲ 3.0 94.2 0.2 ▲ 1.5 Jun.
〈11. 石油・石炭製品工業 ; Petroleum and coal products〉
前月(期)比%Change
FromPreviousMonth
(Quarter)
前年(同月期)比
%ChangeFrom
PreviousYear
前月(期)比%Change
FromPreviousMonth
(Quarter)
前年(同月期)比
%ChangeFrom
PreviousYear
前月(期)比%Change
FromPreviousMonth
(Quarter)
前年(同月期)比
%ChangeFrom
PreviousYear
前月(期)比%Change
FromPreviousMonth
(Quarter)
前年(同月期)比
%ChangeFrom
PreviousYear
平成 25 年 101.3 2.8 92.5 ▲ 3.0 99.4 2.9 95.3 ▲ 0.1 C.Y. 201326 年 105.1 3.8 84.2 ▲ 9.0 101.2 1.8 94.6 ▲ 0.7 201427 年 106.6 1.4 83.5 ▲ 0.8 99.5 ▲ 1.7 95.2 0.6 2015
平成 25 年度 101.9 3.5 93.5 ▲ 1.9 101.4 5.2 94.2 ▲ 1.3 F.Y. 201326 年度 106.8 4.8 84.2 ▲ 9.9 100.2 ▲ 1.2 95.0 0.8 201427 年度 106.7 ▲ 0.1 83.5 ▲ 0.8 99.5 ▲ 0.7 95.3 0.3 2015
平成27 年 Ⅱ期 106.2 ▲ 1.9 99.1 1.6 83.5 ▲ 0.8 ▲ 0.8 99.2 ▲ 1.2 98.7 ▲ 2.0 95.1 0.1 0.8 Q2 2015Ⅲ期 105.4 ▲ 0.8 106.3 ▲ 0.7 83.5 0.0 ▲ 0.8 99.4 0.2 98.6 ▲ 0.4 95.1 0.0 0.6 Q3Ⅳ期 106.1 0.7 107.0 ▲ 1.3 83.5 0.0 ▲ 0.8 99.0 ▲ 0.4 101.2 ▲ 0.7 95.2 0.1 0.6 Q4
平成28 年 Ⅰ期 108.0 1.8 114.2 0.2 83.5 0.0 ▲ 0.8 99.8 0.8 99.5 0.1 95.3 0.1 0.3 Q1 2016Ⅱ期 115.4 6.9 107.5 8.5 81.5 ▲ 2.4 ▲ 2.4 99.9 0.1 99.4 0.7 94.9 ▲ 0.4 ▲ 0.2 Q2
平成27 年 4月 108.6 0.1 108.9 0.6 83.5 ▲ 0.8 ▲ 0.8 98.8 ▲ 2.0 101.0 ▲ 1.8 95.0 0.0 0.6 Apr. 20155月 107.3 ▲ 1.2 101.2 2.1 83.5 0.0 ▲ 0.8 98.8 0.0 97.4 ▲ 4.2 95.0 0.0 0.7 May6月 102.6 ▲ 4.4 87.2 2.5 83.5 0.0 ▲ 0.8 100.0 1.2 97.8 0.2 95.1 0.1 0.8 Jun.7月 107.7 5.0 107.1 2.7 83.5 0.0 ▲ 0.8 100.0 0.0 99.0 0.0 95.0 ▲ 0.1 0.5 Jul.8月 102.1 ▲ 5.2 107.1 ▲ 3.3 83.5 0.0 ▲ 0.8 97.9 ▲ 2.1 96.2 ▲ 1.7 95.1 0.1 0.4 Aug.9月 106.3 4.1 104.7 ▲ 1.6 83.5 0.0 ▲ 0.8 100.4 2.6 100.5 0.5 95.1 0.0 0.6 Sep.10月 108.1 1.7 102.6 1.8 83.5 0.0 ▲ 0.8 99.5 ▲ 0.9 104.5 1.3 95.2 0.1 0.6 Oct.11月 104.8 ▲ 3.1 103.9 ▲ 2.8 83.5 0.0 ▲ 0.8 99.5 0.0 100.2 0.1 95.2 0.0 0.6 Nov.12月 105.5 0.7 114.6 ▲ 2.4 83.5 0.0 ▲ 0.8 98.1 ▲ 1.4 98.9 ▲ 3.3 95.2 0.0 0.6 Dec.
平成28 年 1月 105.6 0.1 117.3 ▲ 1.6 83.5 0.0 ▲ 0.8 100.7 2.7 95.4 0.2 95.2 0.0 0.5 Jan. 20162月 108.4 2.7 109.3 0.2 83.5 0.0 ▲ 0.8 99.2 ▲ 1.5 96.9 1.3 95.2 0.0 0.5 Feb.3月 110.0 1.5 116.0 2.0 83.5 0.0 ▲ 0.8 99.6 0.4 106.1 ▲ 1.0 95.3 0.1 0.3 Mar.4月 113.4 3.1 114.3 5.0 81.5 ▲ 2.4 ▲ 2.4 98.8 ▲ 0.8 100.5 ▲ 0.5 94.9 ▲ 0.4 ▲ 0.1 Apr.5月 115.5 1.9 108.4 7.1 81.5 0.0 ▲ 2.4 98.8 0.0 97.9 0.5 94.9 0.0 ▲ 0.1 May6月 117.4 1.6 99.8 14.4 81.5 0.0 ▲ 2.4 102.2 3.4 99.9 2.1 94.9 0.0 ▲ 0.2 Jun.
〈12. パルプ・紙・紙加工品工業 ; Pulp, paper and paper products〉
稼働率Operating Ratio
季節調整済指数Seasonally Adjusted
Index
原指数Original Index
稼働率Operating Ratio
生産能力(末)Production Capacity
原指数Original Index
生産能力(末)Production Capacity
季節調整済指数Seasonally Adjusted
Index
原指数Original Index
原指数Original Index
季節調整済指数Seasonally Adjusted
Index
原指数Original Index
原指数Original Index
平成22年 =100index,2010= 100
生産能力(末)Production Capacity
季節調整済指数Seasonally Adjusted
Index
原指数Original Index
原指数Original Index
生産能力(末)Production Capacity
稼働率Operating Ratio
稼働率Operating Ratio

6
〈13. 繊維工業 ; Textiles〉 〈14. その他工業 ; Other manufacturing〉
前月(期)比%Change
FromPreviousMonth
(Quarter)
前年(同月期)比
%ChangeFrom
PreviousYear
前月(期)比%Change
FromPreviousMonth
(Quarter)
前年(同月期)比
%ChangeFrom
PreviousYear
前月(期)比%Change
FromPreviousMonth
(Quarter)
前年(同月期)比
%ChangeFrom
PreviousYear
前月(期)比%Change
FromPreviousMonth
(Quarter)
前年(同月期)比
%ChangeFrom
PreviousYear
平成 25 年 102.0 1.0 90.4 ▲ 3.6 98.4 ▲ 2.2 97.1 1.0 C.Y. 201326 年 105.1 3.0 88.3 ▲ 2.3 98.2 ▲ 0.2 97.4 0.3 201427 年 103.4 ▲ 1.6 85.7 ▲ 2.9 94.4 ▲ 3.9 97.3 ▲ 0.1 2015
平成 25 年度 103.5 2.9 88.9 ▲ 4.4 98.8 0.8 97.3 0.4 F.Y. 201326 年度 104.4 0.9 87.6 ▲ 1.5 97.9 ▲ 0.9 97.4 0.1 201427 年度 103.4 ▲ 1.0 85.0 ▲ 3.0 93.0 ▲ 5.0 97.4 0.0 2015
平成27 年 Ⅱ期 102.9 ▲ 0.5 103.4 ▲ 2.6 86.3 ▲ 1.5 ▲ 2.8 93.7 ▲ 4.6 94.5 ▲ 4.4 97.4 0.0 0.1 Q2 2015Ⅲ期 103.7 0.8 104.2 ▲ 1.0 86.2 ▲ 0.1 ▲ 2.7 92.0 ▲ 1.8 91.9 ▲ 6.2 97.3 ▲ 0.1 ▲ 0.1 Q3Ⅳ期 103.5 ▲ 0.2 103.3 0.0 85.7 ▲ 0.6 ▲ 2.9 93.5 1.6 95.1 ▲ 3.6 97.3 0.0 ▲ 0.1 Q4
平成28 年 Ⅰ期 103.5 0.0 102.6 0.0 85.0 ▲ 0.8 ▲ 3.0 90.5 ▲ 3.2 90.7 ▲ 5.5 97.4 0.1 0.0 Q1 2016Ⅱ期 101.8 ▲ 1.6 102.2 ▲ 1.2 84.7 ▲ 0.4 ▲ 1.9 90.3 ▲ 0.2 91.0 ▲ 3.7 97.4 0.0 0.0 Q2
平成27 年 4月 102.9 ▲ 0.5 103.8 ▲ 3.0 87.5 ▲ 0.1 ▲ 1.5 95.0 ▲ 3.7 98.6 ▲ 3.0 97.4 0.0 0.1 Apr. 20155月 102.7 ▲ 0.2 102.5 ▲ 3.6 87.5 0.0 ▲ 1.5 92.9 ▲ 2.2 87.6 ▲ 5.4 97.4 0.0 0.1 May6月 103.2 0.5 103.8 ▲ 1.3 86.3 ▲ 1.4 ▲ 2.8 93.2 0.3 97.2 ▲ 4.9 97.4 0.0 0.1 Jun.7月 104.0 0.8 106.5 ▲ 1.6 86.2 ▲ 0.1 ▲ 2.9 91.6 ▲ 1.7 97.1 ▲ 7.7 97.3 ▲ 0.1 ▲ 0.1 Jul.8月 102.9 ▲ 1.1 101.8 0.4 86.2 0.0 ▲ 2.8 94.2 2.8 82.8 ▲ 3.5 97.3 0.0 ▲ 0.1 Aug.9月 104.3 1.4 104.3 ▲ 2.0 86.2 0.0 ▲ 2.7 90.3 ▲ 4.1 95.8 ▲ 7.1 97.3 0.0 ▲ 0.1 Sep.10月 103.7 ▲ 0.6 104.7 ▲ 1.0 85.8 ▲ 0.5 ▲ 3.2 93.9 4.0 101.8 ▲ 4.6 97.4 0.1 0.0 Oct.11月 104.2 0.5 104.3 1.9 85.8 0.0 ▲ 3.1 94.1 0.2 97.5 ▲ 3.0 97.3 ▲ 0.1 ▲ 0.1 Nov.12月 102.7 ▲ 1.4 100.9 ▲ 0.9 85.7 ▲ 0.1 ▲ 2.9 92.5 ▲ 1.7 86.0 ▲ 3.3 97.3 0.0 ▲ 0.1 Dec.
平成28 年 1月 102.3 ▲ 0.4 99.9 ▲ 1.9 85.1 ▲ 0.7 ▲ 3.4 91.7 ▲ 0.9 81.4 ▲ 6.4 97.4 0.1 0.0 Jan. 20162月 103.7 1.4 101.7 0.9 85.0 ▲ 0.1 ▲ 3.1 89.1 ▲ 2.8 91.9 ▲ 3.9 97.4 0.0 0.0 Feb.3月 104.6 0.9 106.2 0.9 85.0 0.0 ▲ 3.0 90.7 1.8 98.7 ▲ 6.3 97.4 0.0 0.0 Mar.4月 102.2 ▲ 2.3 102.8 ▲ 1.0 84.8 ▲ 0.2 ▲ 3.1 90.9 0.2 94.0 ▲ 4.7 97.4 0.0 0.0 Apr.5月 101.0 ▲ 1.2 101.0 ▲ 1.5 84.8 0.0 ▲ 3.1 89.2 ▲ 1.9 84.4 ▲ 3.7 97.4 0.0 0.0 May6月 102.2 1.2 102.8 ▲ 1.0 84.7 ▲ 0.1 ▲ 1.9 90.8 1.8 94.7 ▲ 2.6 97.4 0.0 0.0 Jun.
〈製造工業(除.機械工業) ; Manufacturing (excl. Machinery)〉 〈機械工業 ; Machinery industry〉
前月(期)比%Change
FromPreviousMonth
(Quarter)
前年(同月期)比
%ChangeFrom
PreviousYear
前月(期)比%Change
FromPreviousMonth
(Quarter)
前年(同月期)比
%ChangeFrom
PreviousYear
前月(期)比%Change
FromPreviousMonth
(Quarter)
前年(同月期)比
%ChangeFrom
PreviousYear
前月(期)比%Change
FromPreviousMonth
(Quarter)
前年(同月期)比
%ChangeFrom
PreviousYear
平成 25 年 97.6 1.6 96.4 ▲ 0.8 97.1 ▲ 1.7 97.5 ▲ 1.4 C.Y. 201326 年 98.4 0.8 94.8 ▲ 1.7 103.4 6.5 95.6 ▲ 1.9 201427 年 98.5 0.1 93.7 ▲ 1.2 98.9 ▲ 4.4 95.9 0.3 2015
平成 25 年度 98.7 3.2 96.2 ▲ 0.9 100.8 5.8 96.0 ▲ 2.5 F.Y. 201326 年度 98.2 ▲ 0.5 94.7 ▲ 1.6 102.3 1.5 96.2 0.2 201427 年度 98.5 0.3 93.4 ▲ 1.4 97.7 ▲ 4.5 95.8 ▲ 0.4 2015
平成27 年 Ⅱ期 97.4 ▲ 1.9 96.3 ▲ 0.1 94.1 ▲ 0.6 ▲ 1.2 98.5 ▲ 4.3 97.7 ▲ 5.2 95.9 ▲ 0.3 0.8 Q2 2015Ⅲ期 98.8 1.4 99.1 1.1 93.8 ▲ 0.3 ▲ 1.4 96.6 ▲ 1.9 98.5 ▲ 4.3 95.7 ▲ 0.2 0.7 Q3Ⅳ期 98.6 ▲ 0.2 99.7 0.2 93.7 ▲ 0.1 ▲ 1.2 97.5 0.9 96.5 ▲ 3.8 95.9 0.2 0.3 Q4
平成28 年 Ⅰ期 97.9 ▲ 0.7 98.8 0.0 93.4 ▲ 0.3 ▲ 1.4 96.8 ▲ 0.7 98.0 ▲ 4.7 95.8 ▲ 0.1 ▲ 0.4 Q1 2016Ⅱ期 97.5 ▲ 0.4 96.5 0.2 93.0 ▲ 0.4 ▲ 1.2 94.1 ▲ 2.8 93.3 ▲ 4.5 95.7 ▲ 0.1 ▲ 0.2 Q2
平成27 年 4月 98.4 ▲ 1.0 98.5 ▲ 0.4 94.4 ▲ 0.3 ▲ 0.8 100.1 ▲ 0.5 96.0 ▲ 4.0 96.1 ▲ 0.1 0.8 Apr. 20155月 97.1 ▲ 1.3 95.2 ▲ 0.6 94.4 0.0 ▲ 0.8 97.0 ▲ 3.1 89.9 ▲ 10.6 96.2 0.1 0.9 May6月 96.6 ▲ 0.5 95.3 0.8 94.1 ▲ 0.3 ▲ 1.2 98.4 1.4 107.3 ▲ 1.4 95.9 ▲ 0.3 0.8 Jun.7月 98.9 2.4 101.5 1.8 93.8 ▲ 0.3 ▲ 1.5 97.1 ▲ 1.3 107.7 ▲ 3.8 96.1 0.2 1.4 Jul.8月 98.2 ▲ 0.7 95.6 ▲ 0.2 93.8 0.0 ▲ 1.5 96.1 ▲ 1.0 84.8 ▲ 3.6 95.6 ▲ 0.5 0.7 Aug.9月 99.2 1.0 100.1 1.7 93.8 0.0 ▲ 1.4 96.6 0.5 102.9 ▲ 5.4 95.7 0.1 0.7 Sep.10月 99.0 ▲ 0.2 100.6 0.4 93.7 ▲ 0.1 ▲ 1.3 98.1 1.6 99.2 ▲ 5.4 96.1 0.4 0.7 Oct.11月 98.5 ▲ 0.5 99.1 0.6 93.7 0.0 ▲ 1.3 98.0 ▲ 0.1 95.9 ▲ 0.4 96.0 ▲ 0.1 0.5 Nov.12月 98.2 ▲ 0.3 99.3 ▲ 0.4 93.7 0.0 ▲ 1.2 96.5 ▲ 1.5 94.5 ▲ 5.3 95.9 ▲ 0.1 0.3 Dec.
平成28 年 1月 98.6 0.4 97.1 ▲ 1.2 93.6 ▲ 0.1 ▲ 1.3 100.3 3.9 90.2 ▲ 8.0 95.7 ▲ 0.2 ▲ 0.4 Jan. 20162月 96.5 ▲ 2.1 96.7 1.4 93.5 ▲ 0.1 ▲ 1.3 93.0 ▲ 7.3 95.4 ▲ 4.8 95.8 0.1 ▲ 0.4 Feb.3月 98.7 2.3 102.6 0.0 93.4 ▲ 0.1 ▲ 1.4 97.0 4.3 108.4 ▲ 1.5 95.8 0.0 ▲ 0.4 Mar.4月 99.0 0.3 98.8 0.3 93.0 ▲ 0.4 ▲ 1.5 94.8 ▲ 2.3 88.8 ▲ 7.5 95.7 ▲ 0.1 ▲ 0.4 Apr.5月 96.4 ▲ 2.6 94.8 ▲ 0.4 93.0 0.0 ▲ 1.5 93.2 ▲ 1.7 88.4 ▲ 1.7 95.7 0.0 ▲ 0.5 May6月 97.2 0.8 95.9 0.6 93.0 0.0 ▲ 1.2 94.3 1.2 102.8 ▲ 4.2 95.7 0.0 ▲ 0.2 Jun.
原指数Original Index
稼働率Operating Ratio
生産能力(末)Production Capacity
生産能力(末)Production Capacity
稼働率Operating Ratio
稼働率Operating Ratio
季節調整済指数Seasonally Adjusted
Index
原指数Original Index
季節調整済指数Seasonally Adjusted
Index
原指数Original Index
生産能力(末)Production Capacity
原指数Original Index
季節調整済指数Seasonally Adjusted
Index
原指数Original Index
原指数Original Index
原指数Original Index
生産能力(末)Production Capacity
稼働率Operating Ratio
原指数Original Index
平成22年 =100index,2010= 100
季節調整済指数Seasonally Adjusted
Index

7
鉱工業指数(製造工業稼働率指数)におけるX-12-ARIMA のスペックファイル等について
The Spec files, etc. adopted in the seasonal adjustment of the Indices of Industrial Production (Indices of Production Capacity and Operating Ratio) using the X-12-ARIMA method (1) 手法 ( Method ) 鉱工業指数(製造工業稼働率指数)における季節調整済指数系列は、季節要因に加え、曜日・祝祭日要因、う
るう年要因によっても調整されている。
具体的には以下のとおり。
季節調整済指数 = 原指数 ÷ (季節・曜日・祝祭日・うるう年指数)
Not only seasonal but also ‘trading-day and holiday’ and ‘leap-year’ effects are adjusted as follows: Seasonally adjusted index = Original Index / (Seasonal, ‘Trading-day and holiday’ and ‘Leap-year’ indices)
(2) スペックファイル ( Spec File ) 使用しているスペックファイルの見本は以下のとおり。なお、平成27年年間補正において検出、処理を行った
異常値の種別、年月は、LS 2011年 3月、AO 2011年4月であった。 The spec files of X-12-ARIMA for seasonal adjustment are as follows. And, in the 2015 Annual revision, outlier–
detected type of outliers and period of outliers are LS March, 2011, AO April, 2011. series { start = 2008.1 span = (2008.1,2015.12) decimals = 1 } transform { function = log } arima { model = (0 1 2)(0 1 1) } regression { variables = (td1nolpyear lpyear ls2011.3 ao2011.4 )
save = (td hol) user = (jap-hol)
usertype = holiday start = 2008.1 file = "xxxxxxxxxxxxxxxxxxxx" } forecast { maxlead = 12 } estimate { save = ( mdl ) maxiter = 500 } x11 { print = (none + d10 + d11 + d16) save = (d10 d11 d16) seasonalma=x11default } (3) 季節指数等の運用 ( Employment of seasonal index, ‘trading-day and holiday’ and ‘leap-year’ indices ) 平成28年1月以降の季節指数は、暫定季節調整方式を採用している。具体的には、平成27年の季節指数を適
用している。
これに対し、曜日・祝祭日・うるう年指数は、暫定方式を採らず、上記(2)で推計されたパラメータとカレンダーか
ら計算して利用している。
The method of temporary seasonal adjustment is adopted for the seasonal index after January 2016. Concretely to say, the monthly seasonal index in 2015 is adopted as those in 2016. As for ‘trading-day and holiday’ and ‘leap-year’ indices, this method is not adopted, and ‘trading-day and holiday’ and ‘leap-year’ indices are calculated from estimated parameters in (2) and calendar.

8
平成22年基準 製造工業生産能力指数・稼働率指数 ウェイト表
稼働率 能力
製造工業 10000.0 10000.0
鉄鋼業 507.8 508.3
非鉄金属工業 390.0 358.1
非鉄金属地金 87.6 78.5
非鉄金属加工品 302.4 279.6
金属製品工業 280.6 299.3
はん用・生産用・業務用機械工業 1052.0 1317.8
はん用機械工業 399.4 383.0
生産用機械工業 589.9 820.9
業務用機械工業 62.7 113.9
電子部品・デバイス工業 1260.5 1033.1
電気機械工業 555.4 671.8
情報通信機械工業 630.8 705.2
(特掲:家庭用電気製品) 655.7 671.5
輸送機械工業 2467.9 2225.3
(特掲:乗用車・バス・トラック) 2320.8 2024.0
窯業・土石製品工業 337.5 384.7
化学工業 1235.8 1225.7
化学肥料 12.3 13.6
ソーダ工業製品 27.6 28.6
無機薬品・顔料 38.4 35.3
高圧ガス 17.6 17.6
石油系芳香族 145.9 155.5
環式中間物 131.4 109.8
有機薬品 216.1 187.6
プラスチック 281.4 264.3
合成ゴム 96.9 87.8
写真感光材料 21.4 18.1
石けん・合成洗剤 87.3 104.6
塗料・印刷インキ 159.5 202.9
(特掲:石油化学製品) 738.6 680.9
石油・石炭製品工業 306.8 283.7
パルプ・紙・紙加工品工業 304.7 263.1
繊維工業 314.0 396.6
その他工業 356.2 327.3
製造工業(除. 機械工業) 4017.0 4027.6
機械工業 5983.0 5972.4
電気機械工業(旧分類) 2446.7 2410.1
分 類

- 124 -
Ⅳ.生産能力統計 Productive capacity statistics (28年6月) (Jun. 2016)
1.月間生産能力及び稼働率 Monthly productive capacity and operating ratio月間生産能力 稼働率(%)
Monthlyproductive capacity
Operating ratio
銑鉄 7,392,644 …
Pig iron
高炉 x …
Blast furnaces
その他の炉 x …
Other furnaces
粗鋼 10,805,941 …
Crude steel
転炉 7,718,428 …
LD converters
電気炉 3,087,513 …Electric furnaces
熱間圧延鋼材 9,779,284 …
Hot rolled steel
冷延広幅帯鋼 2,372,584 …
Cold-rolled wide strips
電気金 16,100 65.0Electrolytic gold
電気銀 233,000 77.0Electrolytic silver
粗銅 166,200 97.0Blister copper
電気銅 146,183 89.7Electrolytic copper
粗鉛 22,750 76.4Lead bullion
電気鉛 20,650 80.6Electrolytic lead
亜鉛 * 1 54,660 85.9Zinc
伸銅品 91,775 74.7Elongated copper product
アルミニウム圧延製品 (はくを除く) 211,794 82.8Aluminum mill products (except foils)
板、円板、条 124,970 87.4Plates and sheets, circles, strips
管、棒・線、形材 86,824 76.1
アルミニウムはく 12,705 77.0Aluminum foils
銅裸線 導体t metal core t 66,738 57.4Bare copper wires
銅絶縁電線 導体t metal core t 85,465 58.6Copper insulated wires
アルミニウム線 導体t metal core t 14,051 17.6Aluminum wires
通信用ケーブル光ファイバ製品 kmコア km core 1,504,296 62.3Optical fiber products for telecommunication cables
缶体 27,785 …Can bodies
缶ふた 10,722 …Can lids
* 1 亜鉛の能力には精留亜鉛の能力を含んでいます。Notes1) Productive capacity of zinc includes productive capacity of reflux refined zinc.
飲料用缶
Can
s fo
r beve
rage
s
単 位
Commodity
t
t
t
Pipes and tubes, rods and bars, wires, shapes and profiles
業 種
Classification byindustry
kg
kg
t
t
Unit
品 目
非鉄金属
Non-fe
rrous
meta
ls
t
t
Iron a
nd s
teel
t
t
鉄鋼
t
t
t
t
t
t
t
t
t
t
t

- 125 -
(28年6月) (Jun. 2016)
月間生産能力 稼働率(%)
Monthlyproductive capacity
Operating ratio
素板ガラス 換算箱 blocks 3,545,000 54.8Material flat glass
(素板ガラス生産量) 換算箱 blocks 1,943,265 …(Production of material flat glass)
安全ガラス 5,358,992 69.4Safety glass
ガラス短繊維 21,072 80.0Glass fiber wool products
(原繊維生産量) 16,847 …(Production of basic fiber)
ガラス長繊維 19,320 74.8Glass fiber continuous textiles
(原繊維生産量) 14,446 …(Production of basic fiber)
光学用ガラス素地 1,106 57.5Optical glass blanks
(引き出し量) 636 …(Draw)
容器類 195,956 72.6Glass containers
(引き出し量) 142,257 …(Draw)
無アルカリガラス基板 x xNonalkali glass substrates
セメント(クリンカ) 5,029,253 77.2Cement (clinker)
遠心力鉄筋コンクリート製品 (ポール・パイル) 338,445 51.8Centrifugal reinforcedconcrete products (poles and piles)
気泡コンクリート製品 (ALC製品) 258,966 52.0Autoclaved light weight concrete products
耐火れんが 54,283 40.6Refractory bricks
トンネル炉 44,354 40.8Tunnel furnace
(トンネル炉生産量) 18,107 …(Production)
その他の炉 9,929 39.7Other furnace
(その他の炉生産量) 3,944 …(Production)
タイル 3,434,731 48.0Tiles
トンネルキルン 2,518,700 …Tunnel kiln
ローラーハースキルン 916,031 …Roller hearth kiln
その他の炉 - …Other kiln
炭素繊維 2,192,600 …Carbon fiber
パルプ 基数 number 235 …Pulp 1,049,397 67.8
クラフトパルプ・さらし連続式 基数 number 34 …Bleached kraft pulp; Continuous type 695,523 …
クラフトパルプ・さらしバッチ式 基数 number 12 …Bleached kraft pulp; Batch type 18,848 …
クラフトパルプ・未ざらし連続式 基数 number 7 …Unbleached kraft pulp; Continuous type 125,787 …
クラフトパルプ・未ざらしバッチ式 基数 number 15 …Unbleached kraft pulp; Batch type 16,916 …
その他パルプ 基数 number 5 …Other pulp 6,680 …
リファイナー・砕木機 基数 number 162 …
Refiner and grinder 185,643 …
単 位
t
m2
1.月間生産能力及び稼働率(続き)
t
m2
t
t
t
t
Classification byindustry
窯業・土石
(建材
)製品 C
era
mic
s an
d b
uild
ing
mat
erial
s
t
m2
Unit
Monthly productive capacity and operating ratio(continued)
t
1000 m2
t
t
m3
t
品 目
ガラス製品
Commodity
m2
t
t
Pulp
, pap
er
and p
aper
pro
ducts t
t
t
t
m2
t
Dig
est
er
and o
smosi
s equip
ment
kg
t
パルプ・紙・紙加工品
Gla
ss p
roducts
蒸解釜 ・浸透装置
t
t
t
業 種
セメント製品
セメント・
Cem
ent
and c
em
ent
pro
ducts

- 126 -
(28年6月) (Jun. 2016)
月間生産能力 稼働率(%)
Monthlyproductive capacity
Operating ratio
紙 * 2 587 …Paper
1,384,030 86.7
長網式 102 …Fourdrinier type
207,567 …
ツインワイヤー式 47 …Twin wire type
543,586 …
オントップ式 53 …On-top type
468,250 …
その他 385 …Other types
164,627 …
板紙 132 …Paperboard
1,067,115 91.6
まる網式 42 …Cylinder type
68,251 …
オントップ式 21 …On-top type
371,986 …
コンビネーション式 27 …Combination type
200,761 …
その他 42 …Other types
426,117 …
段ボールシート 281 …Corrugated board sheets
1,019,629 103.2
紙おむつ 2,698,730 72.0
Disposable diaper
アンモニア (NH3 100% 換算) ☆ t/年 t/year 1,062,539 …
88,545 64.9
硝酸 (98% 換算) t/年 t/year 746,880 …Nitric acid (conv. to 98%) 62,240 27.3
か性ソーダ t/年 t/year 4,965,165 …Sodium hydroxide 413,764 64.4
液体塩素 t/年 t/year 1,308,636 …Chlorine, liquid 109,053 29.6
合成塩酸 (35%換算) (塩酸ガスを含む) t/年 t/year 1,631,370 …Synthetic hydrochloric acid (conv.to 35%) 135,948 45.3 (including hydrochloric acid, gas)
ふっ化水素酸 (50% 換算値) 10,660 30.9Hydrofluoric acid (conv. to 50%)
りん酸 18,090 35.7Phosphoric acid
水酸化カリウム 19,292 39.3Potassium hydroxide
酸化亜鉛 7,676 68.1Zinc oxide
酸化第二鉄 18,114 61.6Ferric oxide
アゾ顔料 1,357 64.6Azo pigment
Notes2)
Chem
ical
fert
ilize
rs, lim
e a
nd indust
rial
sodiu
mchem
ical
s
抄紙機台数
t
t化学工業
t
t
t
t
t
t
コルゲータ台数
Number of corrugators
Number of paper machine
抄紙機台数
Number of paper machine
t
抄紙機台数
単 位
Unit
1000 m2
抄紙機台数
t
抄紙機台数
t
抄紙機台数
Number of paper machine
抄紙機台数
t
t
t
Commodity
抄紙機台数
t
Number of paper machine
t
抄紙機台数
Number of paper machine
Number of paper machine
Number of paper machine
Number of paper machine
Monthly productive capacity and operating ratio(continued)
t
Actual results of paper are the following totals.①Regarding base paper for processing, "other shipments" are excluded from production.②Figures of items other than the above-mentioned ones are those of production.
t
* 2 紙の生産実績は、次の合計とする。 ①加工原紙は生産からその他出荷を除く。 ②上記以外の品目は生産数量。
無機薬品・火薬類
t
t
Number of paper machine
品 目
Classification byindustry
Number of paper machine
t
1.月間生産能力及び稼働率(続き)業 種
Indust
rial
inorg
anic
chem
ical
s an
d g
unpow
ders
Chem
ical
indust
ry
Ammonia (NH3 conv. to 100%)
化学肥料・石灰及びソー
ダ工業製品
Pulp
, pap
er
and p
aper
pro
ducts
(continued)パ
ルプ・紙・紙加工品
(続き
)
抄紙機台数
千枚
1000 sheets

- 127 -
(28年6月) (Jun. 2016)
月間生産能力 稼働率(%)
Monthlyproductive capacity
Operating ratio
酸化チタン 25,570 63.1Titanium oxide
カーボンブラック 64,212 75.2Carbon black
活性炭 9,025 48.3Activated carbons
硫酸アルミニウム (14%固形換算値) 120,628 40.3Aluminum sulfates (conv. to 14%)
よう素 885 90.7Iodine
けい酸ナトリウム 97,659 31.2Sodium silicate
過酸化水素 (100% 重量換算値) 22,052 46.6Hydrogen peroxide (amount conv. to 100%)
硫酸 707,067 78.4Sulfuric acid
酸素ガス (空気分留法) 1,438,668 69.3Oxygen, gas
液化酸素 (空気分留法) 109,742 59.6Oxygen, liquid
溶解アセチレン 3,230 24.5Dissolved acetylene
ポリエチレン (低密度) * 3 199,055 64.9Polyethylene (PE) (low-density)
ポリエチレン (高密度) 92,823 61.9Polyethylene (PE) (high-density)
ポリスチレン 147,983 58.2Polystyrene (PS)
ポリプロピレン 265,453 49.9Polypropylene (PP)
石油樹脂 11,698 68.3Petroleum resin
合成ゴム 173,655 74.6Synthetic Rubber
スチレンモノマー 180,781 85.9Styrene monomer
フェノール 60,140 52.5Phenol
ビスフェノールA 40,934 53.5Bisphenol A
無水フタル酸 (石油系) x x
Phthalic anhydride (petroleum base)
テレフタル酸 (高純度のもの) x x
Terephthalic acid (pure)
純ベンゼン (非石油系を含む) 547,809 52.3Benzene, pure (including non-petroleum base)
純トルエン (非石油系を含む) 259,848 53.8Toluene, pure (including non-petroleum base)
キシレン (非石油系を含む) 966,304 51.8Xylenes (including non-petroleum base)
オルソキシレン 20,933 46.5Ortho-xylene
パラキシレン 323,067 76.0Para-xylene
エチレン 568,446 78.5Ethylene
酸化エチレン 78,606 56.5Ethylene oxide
エチレングリコール 68,147 26.8Ethylene glycol
エチレングリコールエーテル 10,700 54.7Ethylene glycol ethers
* 3 ポリエチレン(低密度)は、エチレン・酢酸ビニルコポリマーを含む。
Notes3) Polyethylene (low-density) includes ethylene-vinyl acetate copolymers.
t
t
t
t
t
t
t
t
t
t
t
t
t
t
t
t
t
t
t
t
t
t
t
Unit
単 位
103 m
3
t
t
t
t
t
Petr
ochem
ical
pro
ducts
Commodity
Indust
rial
inorg
anic
chem
ical
s an
d g
unpow
ders
(continued)
t
Monthly productive capacity and operating ratio(continued)
103 m
3
品 目
Classification byindustry
Hig
h p
ress
ure
gas
無機薬品・火薬類
(続き
)
1.月間生産能力及び稼働率(続き)
石油化学製品
高圧ガス
業 種
化学工業
(続き
)
Chem
ical
indust
ry(continued)

- 128 -
(28年6月) (Jun. 2016)
月間生産能力 稼働率(%)
Monthlyproductive capacity
Operating ratio
アセトアルデヒド 24,670 28.8Acetaldehyde
酢酸 (99% 換算) x x
Acetic acid (conv. to 99%)
酢酸エチル x x
Ethyl acetate
エチルアルコール x x
Ethyl alcohol (petroleum base)
二塩化エチ レ ン 333,132 56.7Ethylene dichloride
酸化プロピレン 32,750 40.9Propylene oxide
プロピレングリコール x xPropylene glycol
ポリプロピレングリコール 29,680 73.1Polypropylene glycol
エピクロルヒドリン 12,720 69.4Epichlorohydrin
イソプロピルアルコール 19,800 88.5Isopropyl alcohol
合成アセトン 43,237 52.0Acetone, synthetic
メチルイソブチルケトン 5,430 82.9Methyl isobutyl ketone
アクリロニトリル 47,819 83.0Acrylonitrile
アクリル酸エステル 32,440 49.5Acrylic esters
合成オクタノール 31,430 58.8Octanol, synthetic
合成ブタノール 52,250 36.6Butanol, synthetic
メチルエチルケトン 27,466 31.6Methyl ethyl ketone
ブタジエン 91,366 73.8Butadiene
シクロヘキサン 47,103 37.7Cyclohexane
無水フタル酸 18,817 74.2Phthalic anhydride
無水フタル酸 (非石油系) x x
Phthalic anhydride (non-petroleum base)
無水フタル酸 (石油系) x x
Phthalic anhydride (petroleum base)
有機ゴム薬品 3,797 37.9Rubber chemicals, organic
エチルアルコール 50,429 64.4Ethyl alcohol
発酵エチルアルコール x x
Ethyl alcohol (non-petroleum base)
エチルアルコール x x
Ethyl alcohol (petroleum base)
ホルマリン 133,090 54.4Formalin
フタル酸系可塑剤 39,514 32.0Phthalate plasticizers
写真フィルム x xPhoto film
t
t
kl
t
t
t
t
t
t
103 m
2
t
t
t
kl
t
kl
t
t
t
t
t
t
t
t
t
t
t
t
kl
単 位
Unit
品 目
及び合成染料
コー
ルター
ル製品・環式中間物
Petr
ochem
ical
pro
ducts
(continued)
石油化学製品
(続き
)
CommodityClassification by
industry
Indust
rial
org
anic
chem
ical
s an
d s
ensi
tive
mat
erial
s fo
r photo
grap
hy
化学工業
(続き
)
Aro
mat
ic h
ydro
car
bons,
coal
tar
pro
ducts
, cyc
licchem
ical
s an
d
synth
etic d
yes
1.月間生産能力及び稼働率(続き)
Chem
ical
indust
ry (
continued)
業 種
有機薬品及び写真感光材料
Monthly productive capacity and operating ratio(continued)

- 129 -
(28年6月) (Jun. 2016)
月間生産能力 稼働率(%)
Monthlyproductive capacity
Operating ratio
フェノール樹脂 41,358 61.1Phenolformaldehyde resins (PF)
ユリア樹脂 28,568 21.0Urea-formaldehyde resins (UF)
メラミン樹脂 24,091 30.5Melamine-formaldehyde resins (MF)
不飽和ポリエステル樹脂 16,316 52.3Unsaturated polyester resins (UP)
アルキド樹脂 14,356 36.1Alkyd resins
エポキシ樹脂 17,145 57.1Epoxy resins (EP)
メタクリル酸エステル (モノマー) 47,430 54.8Methacrylate (monomer)
メタクリル樹脂 20,602 36.9Methacrylic resins
酢酸ビニル (モノマー) 54,600 79.1Vinyl acetate (monomer)
ポリビニルアルコール 23,950 54.4Polyvinyl alcohol (PVAL)
塩化ビニル (モノマー) 229,615 73.2Vinyl chlorides (monomer)
塩化ビニル樹脂 168,863 74.1Polyvinyl chloride (PVC)
カプロラクタム 32,065 47.4Caprolactam
ポリカーボネート 34,046 76.5Polycarbonate
ポリアセタール 13,027 78.6Polyacetal
脂肪酸 * 4 27,920 34.2Fatty acids
精製グリセリン 4,020 88.1Refined glycerol
石けん 29,397 39.2Soap
合成洗剤 147,433 62.3Synthetic detergents
塗料 190,352 55.6Paints
印刷インキ 45,142 65.4Printing inks
自動車用タイヤ (特殊車両用を除く)14,378 87.9
Rubber tires for automobiles(except tires for special motor vehicles)
化学繊維 120,393 62.0Chemical fibers
再生・半合成繊維 16,449 69.7Regenerated and semi-synthetic fibers
長繊維 2,327 74.4Filament fibers
短繊維 14,122 69.0Staple fibers
合成繊維 103,944 60.8Synthetic fibers
長繊維 55,285 61.8Filament fibers
短繊維 48,659 59.6Staple fibers
ナイロン 長繊維 13,067 55.7Nylon filament fibers
アクリル 短繊維 17,075 69.5Acrylic staple fibers
* 4 脂肪酸は、直分脂肪酸のみの数値である。
Notes4) Fatty acids is the numerical value of only Split fatty acid.
t
1000 pieces
t
t
品 目
t
t
t
千本
t
t
t
t
t
t
単 位
t
t
t
t
t
t
t
t
t
Unit
t
t
t
t
t
t
t
t
プラスチ
ック
Classification byindustry
Pla
stic
(m
aterial
s)P
aints
and p
rinting
inks
及び界面活性剤
油脂製品
、石けん・合成洗剤等
印刷インキ
塗料及び
Chem
ical
indust
ry (
continued)
Oil
and f
at p
roducts
, so
ap, sy
nth
etic
dete
rgents
, an
d s
urf
ace-ac
tive
age
nts
繊維工業
Rubber
pro
ducts
業 種
化学工業
(続き
)
Commodity
t
1.月間生産能力及び稼働率(続き) Monthly productive capacity and operating ratio(continued)
ゴム製品
Text
iles
- 130 -
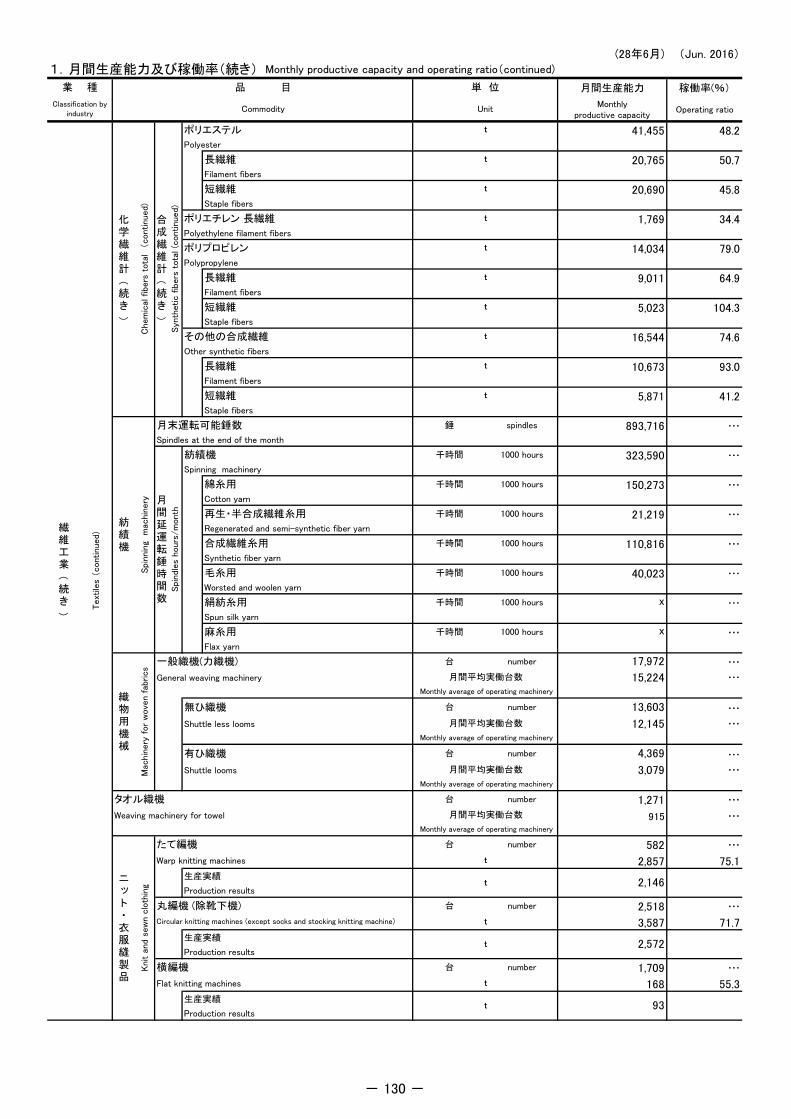
(28年6月) (Jun. 2016)
月間生産能力 稼働率(%)
Monthlyproductive capacity
Operating ratio
ポリエステル 41,455 48.2Polyester
長繊維 20,765 50.7Filament fibers
短繊維 20,690 45.8Staple fibers
ポリエチレン 長繊維 1,769 34.4Polyethylene filament fibers
ポリプロピレン 14,034 79.0Polypropylene
長繊維 9,011 64.9Filament fibers
短繊維 5,023 104.3Staple fibers
その他の合成繊維 16,544 74.6Other synthetic fibers
長繊維 10,673 93.0Filament fibers
短繊維 5,871 41.2Staple fibers
月末運転可能錘数 錘 spindles 893,716 …Spindles at the end of the month
紡績機 千時間 1000 hours 323,590 …Spinning machinery
綿糸用 千時間 1000 hours 150,273 …Cotton yarn
再生・半合成繊維糸用 千時間 1000 hours 21,219 …Regenerated and semi-synthetic fiber yarn
合成繊維糸用 千時間 1000 hours 110,816 …Synthetic fiber yarn
毛糸用 千時間 1000 hours 40,023 …Worsted and woolen yarn
絹紡糸用 千時間 1000 hours x …Spun silk yarn
麻糸用 千時間 1000 hours x …Flax yarn
一般織機(力織機) 台 number 17,972 …General weaving machinery 15,224 …
無ひ織機 台 number 13,603 …Shuttle less looms 12,145 …
有ひ織機 台 number 4,369 …Shuttle looms 3,079 …
タオル織機 台 number 1,271 …Weaving machinery for towel 915 …
たて編機 台 number 582 …Warp knitting machines 2,857 75.1
丸編機 (除靴下機) 台 number 2,518 …
3,587 71.7
横編機 台 number 1,709 …Flat knitting machines 168 55.3
Unit
単 位
月間平均実働台数
t
月間平均実働台数
月間平均実働台数
月間平均実働台数
Monthly average of operating machinery
Monthly average of operating machinery
Monthly average of operating machinery
Production resultst
t
Spin
dle
s hours
/m
onth
月間延運転錘時間数
Spin
nin
g m
achin
ery
Syn
thetic f
ibers
tota
l (c
ontinued)
合成繊維計
(続き
)
t
Mac
hin
ery
for
wove
n f
abrics
Chem
ical
fib
ers
tota
l (continued)
t
Circular knitting machines (except socks and stocking knitting machine)
Monthly productive capacity and operating ratio(continued)
t
t
t
t
Monthly average of operating machinery
紡績機
業 種
t
化学繊維計
(
続き
)
t
t
t
t
生産実績
Commodity
Text
iles
(continued)
品 目
織物用機械
1.月間生産能力及び稼働率(続き)
Classification byindustry
繊維工業
(続き
)
Production results
93Production results
t
生産実績t
生産実績
ニ
ット・衣服縫製品
2,572
Knit a
nd s
ew
n c
loth
ing 2,146

- 131 -
(28年6月) (Jun. 2016)
月間生産能力 稼働率(%)
Monthlyproductive capacity
Operating ratio
フルファッション セクション section x …Full-fashioned machines x x
靴下用丸編機 台 number 8,189 …Circular knitting machines for socks and stocking 28,932 57.5
工業用動力ミシン 台 number 59,533 …Industrial sewing machines 23,074 62.1
タフティングマシン 6,534 …Tufting machines
プレスフェルト用ハーダ (動力) 616 …For press felt
ケミカルボンド式 2,484 …Chemical bond
サーマルボンド式 4,971 …Thermal bond
8,697 …Needle punch (including needle felt)
スパンボンド・メルトブロー式 10,964 …Spun bond, melt blown
スパンレース式 4,321 …Spun lace
その他の乾式 2,660 …Other dry laid
湿 式 5,189 …Wet laid
ふとん 千枚 1000 sheets 277 …Futon
金属製事務用机 個 n 286,317 …Metal office desks
金属製回転式いす 個 n 296,055 …Metal swivel chairs
ボールペン (インキング・マシン) 千本 1000 n 140,791 …Ballpoint pens (inking machine)
(中芯月間生産実績) 千本 1000 n 78,030 …(Monthly production results of refills)
コークス 乾量 t dry t 3,920,492 67.8
Coal coke
注 稼働率の算式について
稼働率=(月間生産量/月間生産能力)*100 で表示した。
ただし、次の品目については、以下のとおり。
1 素板ガラス=(素板ガラス月間生産量/素板ガラス月間生産能力)*100
2 ガラス短繊維=(原繊維生産量/原繊維月間生産能力)*100
3 ガラス長繊維=(原繊維生産量/原繊維月間生産能力)*100
4 セメント=(クリンカの月間生産量/クリンカ月間生産能力)*100
5 耐火れんが(トンネル炉)=(トンネル炉月間生産量/トンネル炉月間生産能力)*100
6 耐火れんが(その他の炉)=(その他炉月間生産量/その他炉月間生産能力)*100
7 ガラス製品(光学用ガラス素地)=(光学用ガラス素地月間引き出し量/光学用ガラス素地月間生産能力)*100
8 ガラス製品(容器類)=(容器類月間引き出し量/容器類月間生産能力)*100
9 紙計=((紙生産数量計-加工原紙その他出荷)/紙計月間生産能力)*100
10 自動車用タイヤ=(自動車用タイヤ月間生産本数/自動車用タイヤ月間生産能力)*100
t
t
t
t
千点 1000 n
Unit
単 位
t
石炭製品
鉱業・石油・ M
inin
g, p
etr
ole
um
and c
oal
pro
ducts
その他の工業 O
ther
pro
ducts
Knit a
nd s
ew
n c
loth
ing(
continued)
ニ
ット・衣服縫製品
(続き
)
Production results
16,631Production results
生産実績
千点 1000 n
千点 1000 n
生産実績
Production results
t
t
t
1000 m2
t
14,318
t x
千点 1000 n
Monthly productive capacity and operating ratio(continued)
Text
iles(
continued)
繊維工業
(続き
)
Classification byindustry
Commodity
生産実績
乾式
Dry
lai
d
ニードルパンチ式 (ニードルフェルトを含む)
Tuft
ed c
arpet, f
elt a
nd n
on-w
ove
n f
abrics
タフテ
ッドカー
ペ
ット・フ
ェルト・不織布
1.月間生産能力及び稼働率(続き)業 種 品 目

- 132 -
2. 機械統計生産能力指数 (平成22年 = 100) Indices of machinery production capacity (2010 = 100)
平成28年5月 平成28年6月
May 2016 Jun. 2016
はん用機械工業 内燃機関 96.4 96.4General-purpose machinery Internal combustion engines
ポンプ 100.2 100.2Pumps
油圧ポンプ 89.0 89.0Oil-hydraulic pumps
空気圧シリンダ 145.8 145.8Pneumatic cylinders
空気圧バルブ 133.4 133.4Pneumatic valves
パッケージ型エアコン 103.5 103.5Packaged type air conditioners
冷凍・冷蔵ショーケース 95.7 95.7Refrigerating display cabinets
軸受 98.8 98.8Bearings
生産用機械工業 ブルドーザ X XProduction machinery Bulldozers
建設用クレーン 126.2 126.2Construction cranes
ショベル系掘削機械 108.7 108.7Shovel type excavators
ショベルトラック 71.9 71.9Shovel trucks
装輪式トラクタ 88.6 88.6Wheel tractors
動力耕うん機 85.8 85.8Power tillers
コンバイン 92.8 92.8Combines
金属工作機械 116.6 115.6Metal cutting machinery
繊維機械 98.4 98.4Textile machinery
工業用ミシン 97.0 97.0Industrial sewing machines
電動工具 89.0 89.0Electric tools
射出成形機 99.1 99.1Injection molding machines
業務用機械工業 ガスメータ 86.2 86.2Business oriented machinery Gas-meters
デジタル・フルカラー複写機 37.9 37.9Digital and full color copying machines
飲料用自動販売機 92.0 92.0Beverage vending machines
電子部品・デバイス工業 固定コンデンサ 111.2 111.2Electronic parts and devices Fixed capacitors
リジッドプリント配線板 80.9 80.9Rigid printed wiring boards
磁気テープ 66.8 66.8Magnetic tapes
アクティブ型液晶素子 118.6 118.6Active matrix LCDs
パッシブ型液晶素子 69.4 69.4Passive matrix LCDs
トランジスタ 52.5 52.5Transistors
太陽電池セル 167.8 167.8Solar battery cells
モス型半導体集積回路(ウエハ) 105.1 105.1Metal oxide semiconductor ICs (wafer)
電気機械工業 標準三相誘導電動機 97.7 97.7Electrical machinery Three phase induction motors for general use
非標準三相誘導電動機 99.7 99.7Three phase induction motors for individual purpose
標準変圧器 121.9 121.9Power distribution transformers
資料出所 「鉱工業指数確報」(調査統計グループ 経済解析室)
Data source: Indices of Industrial Production (Revised Report)(Economic Analysis Office, Research and Statistics Department)
業 種 品 目
Classification by industry Commodity

- 133 -
2. 機械統計生産能力指数(続き) (平成22年 = 100)
Indices of machinery production capacity (continued) (2010 = 100) 平成28年5月 平成28年6月
May 2016 Jun. 2016
電気機械工業(続き) 非標準変圧器 70.5 70.5Power transformers
セパレート形エアコン 105.1 105.1Separate type air conditioners
食器洗い乾燥機 106.7 106.7Automatic dish washers and driers
電気冷蔵庫 103.8 103.8Electric refrigerators
クッキングヒーター 98.7 98.7Electric cooktops
電気温水器 95.7 95.7Electric storage tank water heaters
自然冷媒ヒートポンプ式給湯機 94.8 94.8Natural coolant heat pump formula hot-water supply machines
電気掃除機 99.9 99.9Electric vacuum cleaners
電子レンジ 46.8 46.8Microwave ovens
蛍光ランプ(液晶パネル用バックライトを含む) 39.0 39.0Fluorescent lamps
電力量計 328.8 328.8Watt-hour meters
工業用計測制御機器 90.1 90.1Industrial measuring equipment instruments
鉛蓄電池 90.9 90.9Lead acid (storage) batteries
アルカリ蓄電池 101.1 101.1Alkaline storage batteries
リチウムイオン蓄電池 150.3 150.3Small sized sealed lithium ion rechargeable batteries
情報通信機械工業 電話機 38.7 38.7Information and communication Telephone sets
electronics equipment ボタン電話装置 94.3 94.3Key system telephone equipment
電子交換機 90.2 90.2Electronic switching system
搬送装置 95.1 95.1Carrier transmission equipment
薄型テレビ 47.8 47.8Flat panel television
ビデオカメラ 10.6 10.6Video camera
デジタルカメラ 27.6 27.6Digital still camera
カーナビゲーションシステム 67.9 67.9Car navigation system
パーソナルコンピュータ 91.4 91.4Personal computers
システム式金銭登録機 X XSystem use cash registers
輸送機械工業 乗用車 97.8 97.8Transport equipment Passenger cars
普通トラック・けん引車・バス 96.6 96.6Large trucks, tractor trucks and buses
軽・小型トラック 78.6 78.6Midget and small trucks
輸送機械用エアコン 100.0 100.0Air conditioners for transportation machines
二輪自動車 94.8 94.8Motorcycles
フォークリフトトラック 78.4 78.4Forklift trucks
金属製品工業 超硬チップ 101.2 101.2Fabricated metal Cenented carbide tips
その他工業 時計 97.7 97.7Other manufacturing Watches and clocks
Electrical machinery
(continued)
業 種 品 目
Classification by industry Commodity

- 134 -
2. 機械統計生産能力指数(続き) 2月号より追加掲載分 (平成22年 = 100)
Indices of machinery production capacity (continued) The following eight commodities is added. (2010 = 100)
平成28年5月 平成28年6月
May 2016 Jun. 2016
鉄骨・橋りょう 86.7 86.7
Structural steel frames and steel bridges
100.1 100.1
Wire springs
ダイカスト 98.3 98.3
Die castings
電子部品・デバイス工業 シリコンウエハ X X
Silicon wafers
資料出所 「鉱工業指数確報」(調査統計グループ 経済解析室)
Data source: Indices of Industrial Production (Revised Report)(Economic Analysis Office, Research and Statistics Department)
かさね板ばね 98.6 98.6
Leaf springs
電気機械工業 電気洗濯機 58.4 58.4
Electric washing machines
HIDランプ 155.7 155.7
High intensity discharge lamps
電子部品・デバイス工業 バイポーラ型半導体集積回路(ウエハ) 63.2 61.2
Electronic parts and devices Semiconductor integrated circuit bipolar ICs(wafer)
線ばね
Fabricated metal
Classification by industry Commodity
業 種 品 目
金属製品工業
Electrical machinery
Fabricated metal
Electronic parts and devices
金属製品工業