Embed Size (px)
Citation preview
Income Inequality under
Economic Globalisation
Lawrence J. Lau 刘遵义 Ralph and Claire Landau Professor of Economics, The Chinese University of Hong Kong
and Kwoh-Ting Li Professor in Economic Development, Emeritus, Stanford University
Yu Chi-Chung Cultural and Educational Foundation
Taipei, 14th April 2015
Tel: +852 3943 1611; Fax: +852 2603 5230 Email: [email protected]; WebPages: www.igef.cuhk.edu.hk/ljl
*All opinions expressed herein are the author’s own and do not necessarily reflect the views of any of the
organisations with which the author is affiliated.
2
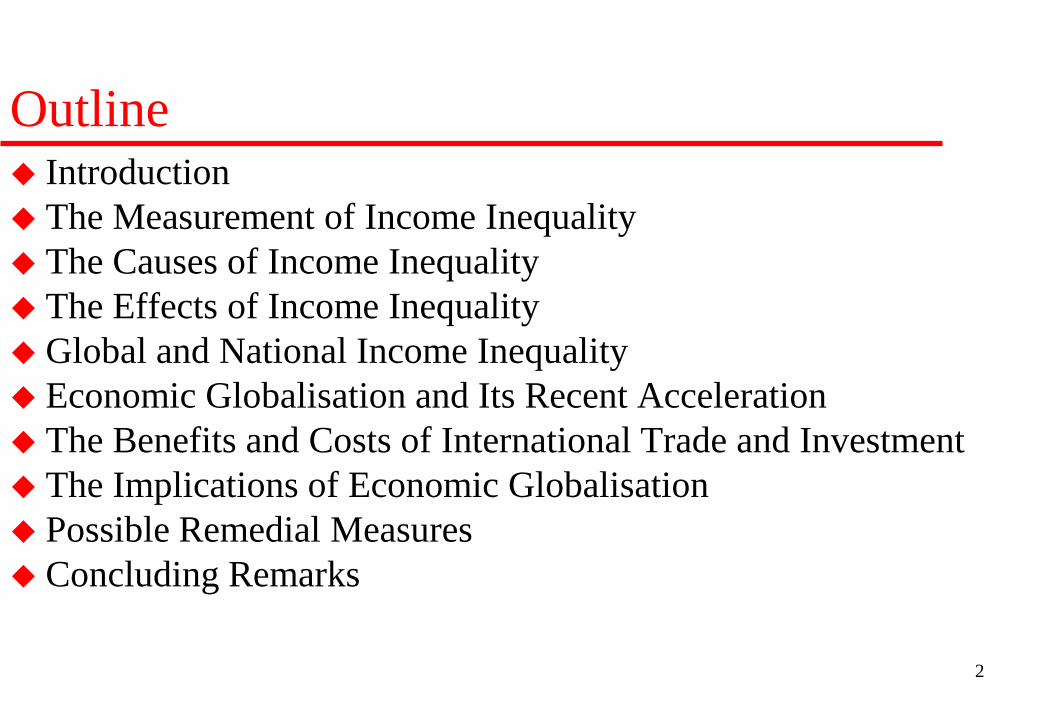
Outline Introduction The Measurement of Income Inequality The Causes of Income Inequality The Effects of Income Inequality Global and National Income Inequality Economic Globalisation and Its Recent Acceleration The Benefits and Costs of International Trade and Investment The Implications of Economic Globalisation Possible Remedial Measures Concluding Remarks
3
Introduction Both Joseph Stiglitz (2012) and Thomas Piketty (2013) in their
respective books, The Price of Inequality: How Today's Divided Society Endangers Our Future and Capital in the Twenty-First Century, have documented rising national income inequality around the World.
However, it is important to note that even in the absence of economic globalisation, there will be some degree of income inequality in every economy, not the least because of the existing unequal distribution of wealth, both human and non-human.
4
Introduction Nevertheless, economic globalisation is partially responsible for
increasing national income disparity around the World, especially in the developed economies, as manufacturing and other jobs move from high-wage economies to lower-wage economies.
Economic globalisation is also one important cause of the decline of the bargaining power of labour unions in many developed economies over the past several decades. A strike may lead to more imports as substitutes or a more rapid shift of production facilities abroad. The decline in union power is major cause of the sluggishness in the growth of real wages and salaries.
But economic globalisation is also partially responsible for raising the income per capita in many developing economies in the World, such as Hong Kong, Singapore, South Korea, Taiwan and more recently Mainland China.
5
Introduction However, the information and communication technology (ICT)
revolution is also partially responsible for the rising income disparity around the World, by enabling the significant expansion of the span of monitoring and control of executives. This has resulted in much “flatter” organisations in which much of the middle management has become redundant. For example, in commercial banks, the positions of many vice-presidents have been eliminated.
The ICT revolution has also enabled the elimination or reduction of many jobs, for example, routine clerical and secretarial jobs, and jobs such as the draftsmen, the proof-readers, the night watchmen or parking meter monitors and the replacement of many jobs with non-local out-sourcing.
6
Introduction The ICT revolution and the rise of the internet have also created
new business models that have supplanted the existing ones, leading to what Joseph Schumpeter called “creative destruction”, e.g., Amazon.com has virtually replaced most brick-and-mortar bookstores in the U.S. Technological obsolescence, whether domestic or imported, can cause major disruptions in industries and job markets.
The ICT revolution and the rise of the internet have also created demands for new skill requirements and spurred innovation. They have increased the rates of return to investment in intangible capital such as human capital and R&D capital, and in so doing have also increased the degree of income disparity between the educated and the uneducated, between the skilled and the unskilled.
7
Introduction There has been rising concentration in many industries
worldwide, facilitated by the ICT revolution and abetted by economic globalisation. For example, the Big Eight accounting firms have now become the Big Four, the Big Three in the U.S. automobile industry are now effectively the Big Two (with Chrysler being taken over by Fiat), and the Seven Sisters of the Oil Industry have had mergers among themselves (the same phenomenon has occurred in the banking industry). Increasing concentration and cartelisation is the rule rather than the exception, especially at the national level. These developments have resulted in higher profit margins for many firms and increased capital’s share in output at the expense of labour’s share.
8
Introduction In the developed economies of the U.S., Europe and Japan, the
“Quantitative Easing (QE)” policies adopted by their respective central banks after the global financial crisis of 2008 have not helped to improve the degree of equality of their income distributions. The artificially low interest rates have favoured those with the ability to borrow (mostly high-income and high-wealth individuals) at the expense of those who are net savers and retirees. These low interest rates have also vastly increased the asset prices and fueled price bubbles in these economies. The net effect is to redistribute income and wealth (through capital gains) from the poor to the wealthy, causing the degree of income inequality to rise. It also sets into motion a spiral, making the rich richer and the poor poorer.
9
Introduction In fact, because of the freedom of capital flows into and out of
many economies around the World, the “QE” policies of the developed economies have also similarly affected many developing economies and increased income disparity there as well.
10
Introduction Moreover, income equality in and of itself cannot and should not
be the only goal of economic policy makers around the World. The top priority goal of economic policy makers should and must be the enhancement of the general economic welfare of the population. The degree of inequality of the income distribution can only be a secondary concern.
The Mainland Chinese economy before its economic reform in 1978 provides a good demonstration of how an artificially imposed egalitarian income distribution can result in an unnecessarily low level of general economic welfare as well as a low rate of economic growth.
11
Introduction In addition, given that individual abilities vary greatly across a
population, an identical tax rate for all may not provide sufficient incentive for the high-ability individual to produce up to his or her full potential. (A high-ability individual should be taxed at a higher rate than a low-ability individual so as to elicit more effort, resulting in higher output.) But individual-specific tax rates are not possible because the individual abilities are not perfectly known. The aggregate output and hence general welfare of an economy can nevertheless be enhanced by an appropriately chosen progressive rate of taxation (see the optimal taxation literature). However, the income distribution resulting from the aggregate welfare- or output-maximising tax schedule is unlikely to be a perfectly egalitarian one.
12
Introduction During the past half century, economic globalisation has helped to lift
many people around the World, especially in East Asia, out of (absolute) poverty by providing them with opportunities in the export sector. These opportunities have in turn enabled the respective domestic economies to grow rapidly.
For example, the per capita GDP of Taiwan has increased from less than US$2,000 in 1965 to approximately US$24,000 in 2014 (in 2014 prices).
For another example, an estimated 500 million people have been lifted out of poverty in Mainland China alone as a result of its economic reform and opening to the World in 1978. Many more people in the developing economies in Southeast and South Asia and in Africa are expected to benefit from continuing economic globalisation in the future.
13
Introduction However, the degree of income inequality has also been rising in
many countries, including some in which the reduction of poverty has been the most successful. The problem lies in part in the internal mechanisms for the distribution and redistribution of income within the countries themselves.
14
The Measurement of Income Inequality: The Gini Coefficient The Gini Coefficient, proposed by Corrado Gini (1912), is
commonly used as a measure of the degree of inequality of income, with a value of zero indicating perfect equality and a value of one indicating perfect inequality (that is, with all income going to a single individual).
A lower value of the Gini Coefficient indicates a greater degree of equality than a higher value of the Gini Coefficient.
15
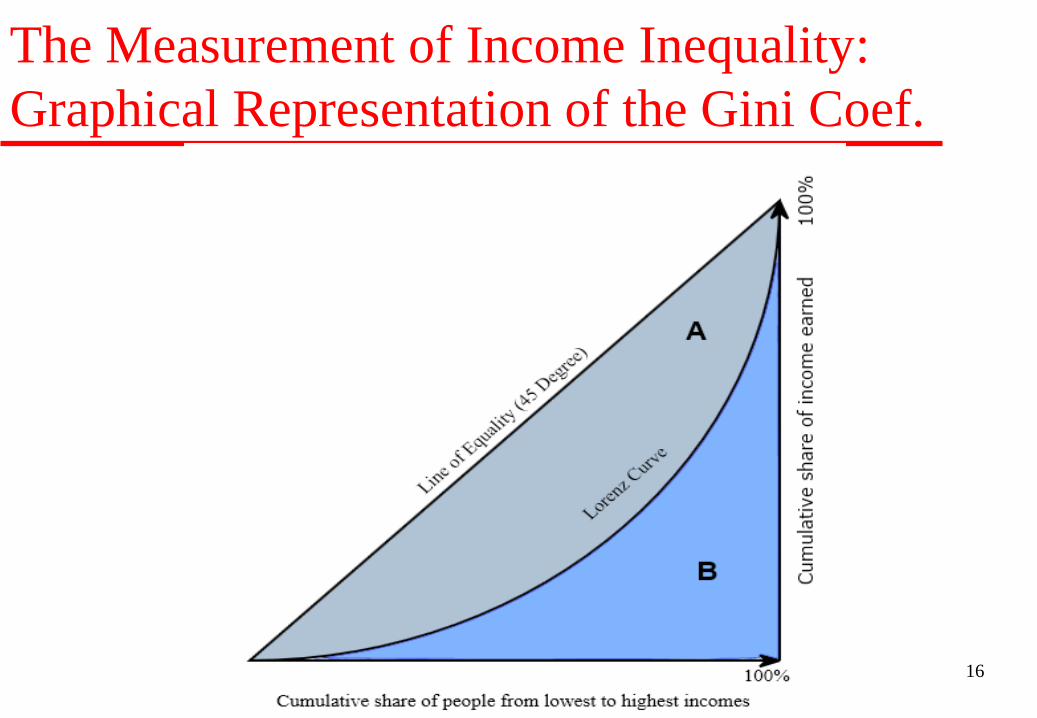
The Measurement of Income Inequality: Graphical Representation of the Gini Coef. In the following chart, the “Lorenz curve” (taken from Wikipedia) is
presented. On the horizontal axis is the “cumulative share of population from the lowest to the highest incomes” and on the vertical axis is the “cumulative share of income”.
The curve relating the cumulative share of income to the cumulative share of population is known as the “Lorenz curve”. The more equal the distribution of income, the higher is the area under the Lorenz curve, B.
The area between the Lorenz curve and the 45-degree line is defined as A.
The Gini Coefficient can then be measured as A/(A+B), but since A+B=0.5 by definition, the Gini Coefficient can also be measured as 2 x A.
In the case of perfect income equality, so that the lowest x percent of the population always earns x percent of the total income, for all possible values of x, then the “Lorenz curve” coincides with the 45-degree line, and the Gini Coefficient takes the value zero.
16
The Measurement of Income Inequality: Graphical Representation of the Gini Coef.
17
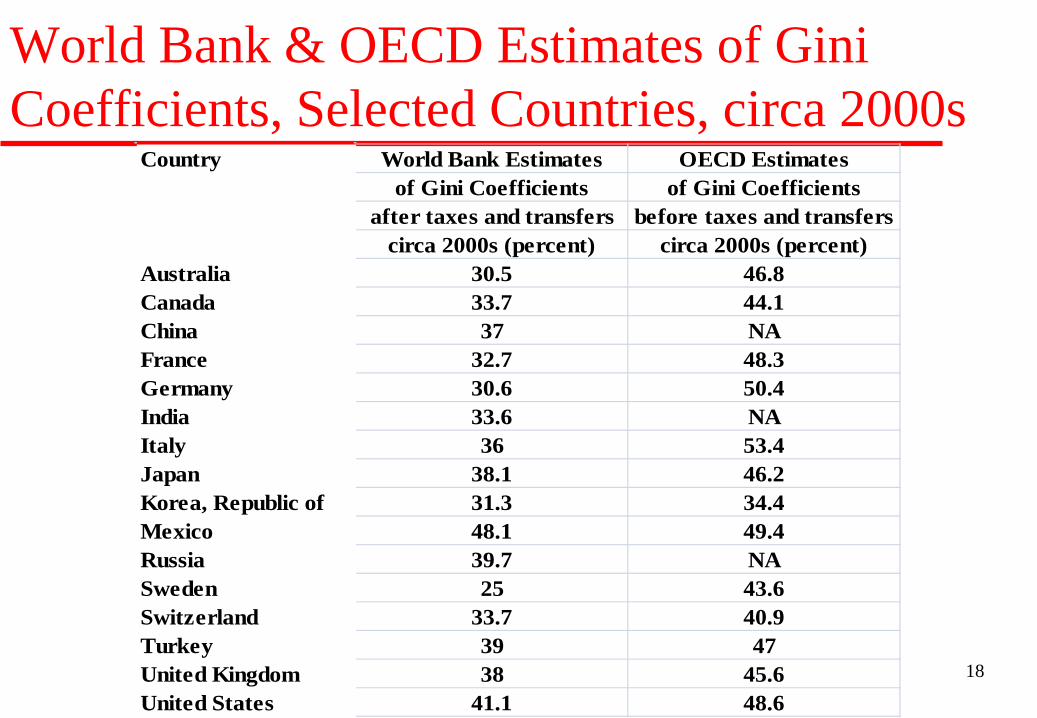
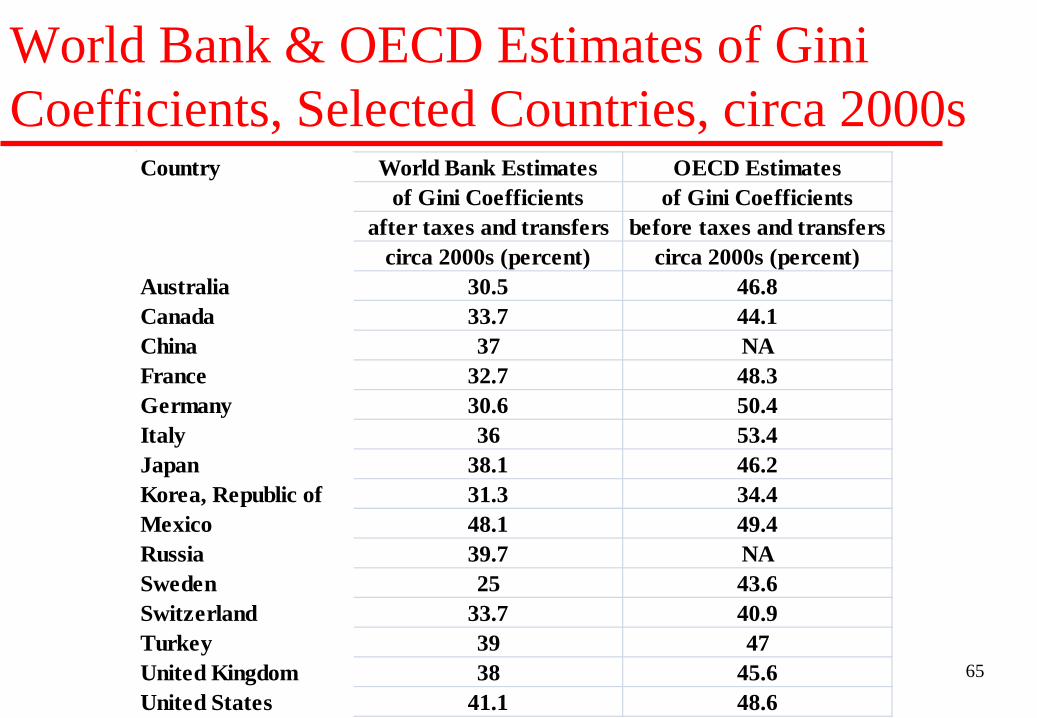
The Measurement of Income Inequality In the following chart we present the estimated Gini coefficients
for selected major economies, both before and after taxes and transfers.
Among these economies, Sweden has the most equal income distribution after taxes and transfers, with a Gini coefficient of 0.25 and Mexico has the most unequal income distribution, with a Gini coefficient of 0.48.
The Gini coefficients of Russia (0.397) and China (0.37), countries believed to have high degrees of income inequality, do not compare unfavourably with those of Japan (0.381), the U.K. (0.38) and the U.S. (0.411), which show that their tax and transfer policies have probably been working, even though there is still room for improvement.
18
World Bank & OECD Estimates of Gini Coefficients, Selected Countries, circa 2000s
Country World Bank Estimates OECD Estimatesof Gini Coefficients of Gini Coefficients
after taxes and transfers before taxes and transferscirca 2000s (percent) circa 2000s (percent)
Australia 30.5 46.8Canada 33.7 44.1China 37 NAFrance 32.7 48.3Germany 30.6 50.4India 33.6 NAItaly 36 53.4Japan 38.1 46.2Korea, Republic of 31.3 34.4Mexico 48.1 49.4Russia 39.7 NASweden 25 43.6Switzerland 33.7 40.9Turkey 39 47United Kingdom 38 45.6United States 41.1 48.6
19
The Causes of Income Inequality First, the distribution of income depends on the distribution of
wealth, which includes both tangible wealth and intangible wealth such as human capital. Thus, if the distribution of wealth is highly unequal, the distribution of income is likely to be highly unequal as well, unless there are effective tax and transfer policies. The distribution of human capital can also be modified over time through appropriate investment in education.
Second, the distribution of disposable income depends on both the distribution of income before taxes and transfers and the tax and transfer policies, including the social safety net, themselves. We shall see that the degree of income inequality can differ significantly before and after taxes and transfers.
20
The Causes of Income Inequality Third, the distribution of income also depends on the distribution
of ability among individuals, which is difficult to identify a priori and impossible to equalise.
Finally, the distribution of income also depends on luck or chance. For example, a person may have a high income by being a lottery ticket winner. Luck cannot be equalised either but the expectation is that over a long period of time, differences in luck will average out (whereas differences in ability will not). However, it is possible to provide social insurance against bad states of nature, for example, unemployment insurance, catastrophic health insurance, and welfare to alleviate the negative effects of bad luck.
21
The Effects of Income Inequality On the one hand, a higher degree of income inequality can lead to
a higher national saving rate, which in turn may lead to a higher investment rate, hence a more rapid capital accumulation and a higher rate of economic growth. On the other hand, a lower degree of income inequality can lower the saving rate and raise the consumption rate and hence the aggregate demand in the economy. Thus, whether a higher degree of income inequality is good or bad for economic growth depends on among other things whether the economy is supply-constrained or demand-constrained.
22
The Effects of Income Inequality A market economy which allows a higher degree of inequality is
likely to end up with a greater aggregate output because of the incentives that it provides on the margin to motivate individuals with the ability to increase their outputs.
However, a high degree of income inequality may create social unrest, especially if the income inequality is caused not by differences in ability but by ill-begotten gains from corruption or fraud.
23
The Effects of Income Inequality A high degree of income inequality may also result in the
concentration of political power in a few individuals through an alliance between power and wealth.
Rising income inequality in itself is not necessarily bad, depending on the circumstances accompanying it. For example, if the rising income inequality is accompanied by rising real incomes for every income group from the lowest to the highest, it is much more acceptable than if it is accompanied by falling real incomes for some of the lower income groups.
24
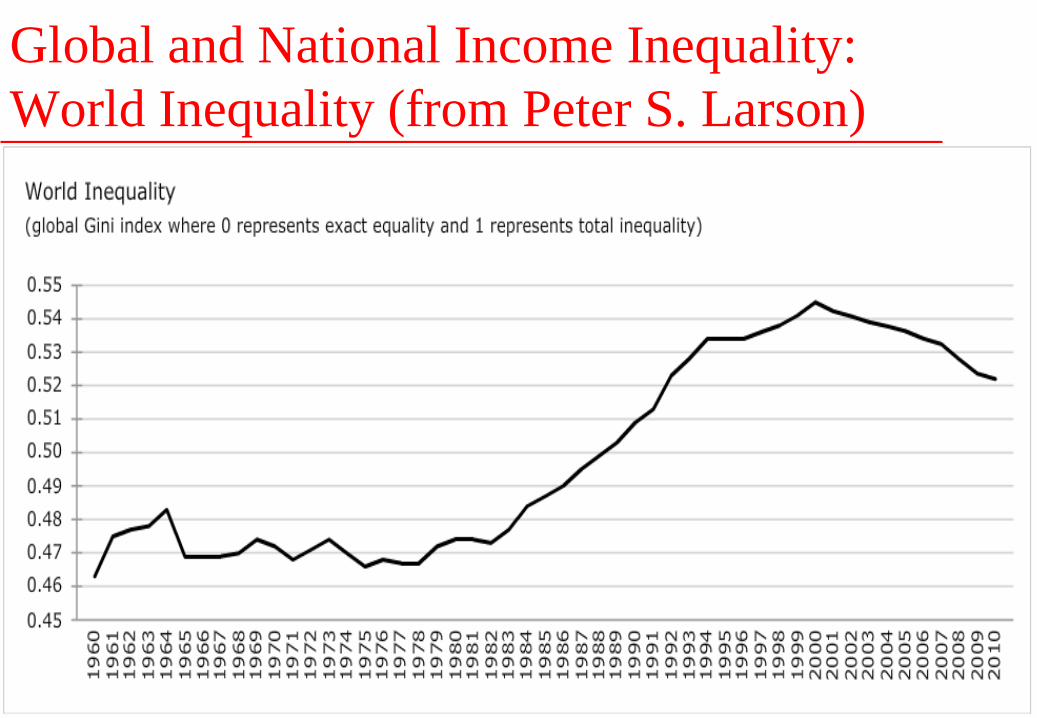
Global and National Income Inequality In the following chart we present the estimated Gini coefficients
for the World economy as a whole (before taxes and transfers) from 1960 to 2010.
This chart shows that the degree of World income inequality was quite stable until the early 1980s. Then it started to rise, more or less continuously, and reached a peak around the turn of the Century. It has been declining since even though it still remains at a relatively high level by recent historical standards.
The recently falling degree of income inequality may seem to be a paradox as anecdotal evidence suggests that the degree of income inequality has been rising almost everywhere in recent years, especially since the 2008 global financial crisis.
25
Global and National Income Inequality: World Inequality (from Peter S. Larson)
26
Global and National Income Inequality However, we shall show by way of a two-country example that it
is possible for the degree of global income inequality to improve while the degrees of national income inequality of both countries deteriorate.
It is also possible for the degree of global income inequality to deteriorate while more people are lifted out of poverty (i.e., achieve incomes above a certain level defined as the poverty line).
In the following chart we present the hypothetical populations, incomes and their distributions of two economies in Period One, as well as the “World” distribution of income.
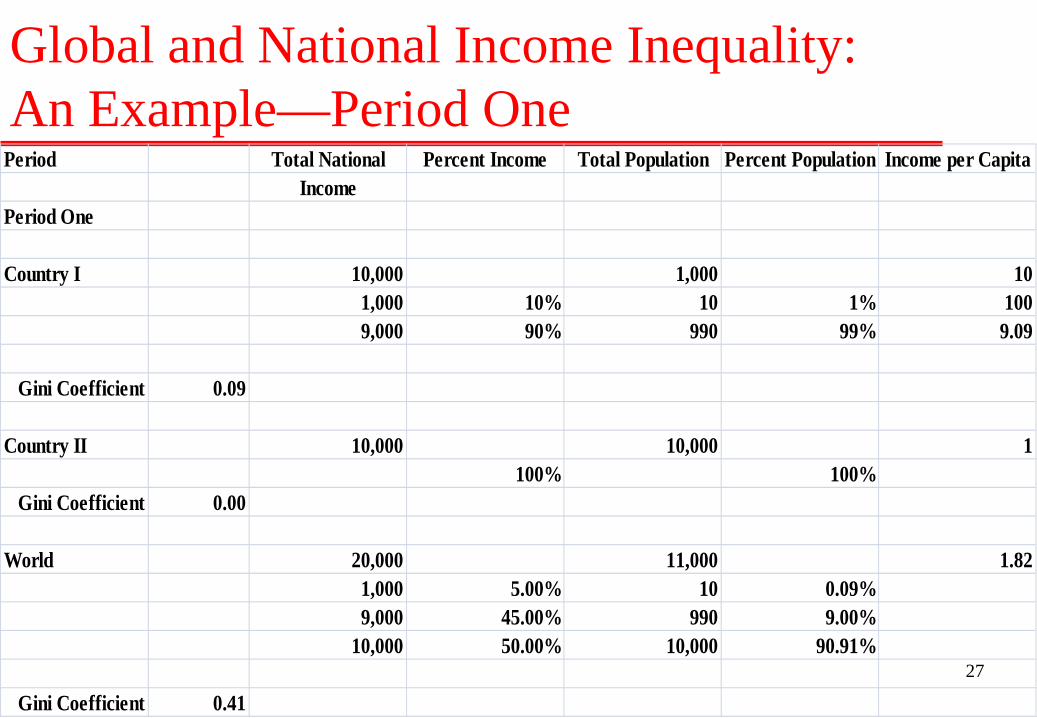
27
Global and National Income Inequality: An Example—Period One
Period Total National Percent Income Total Population Percent Population Income per CapitaIncome
Period One
Country I 10,000 1,000 101,000 10% 10 1% 1009,000 90% 990 99% 9.09
Gini Coefficient 0.09
Country II 10,000 10,000 1100% 100%
Gini Coefficient 0.00
World 20,000 11,000 1.821,000 5.00% 10 0.09%9,000 45.00% 990 9.00%
10,000 50.00% 10,000 90.91%
Gini Coefficient 0.41
28
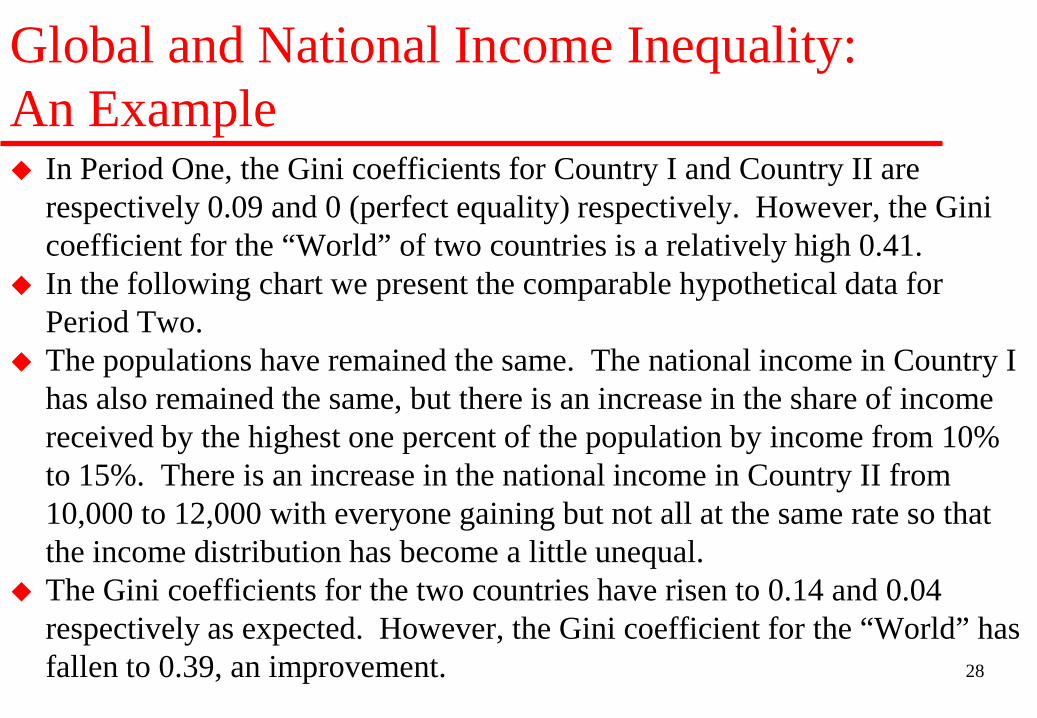
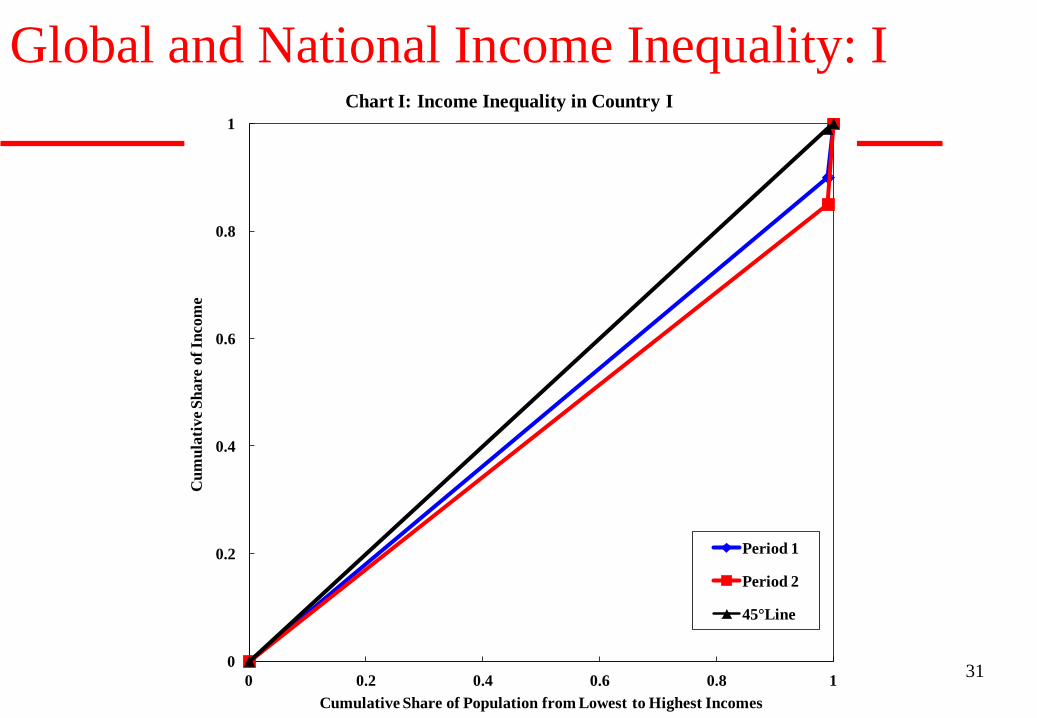
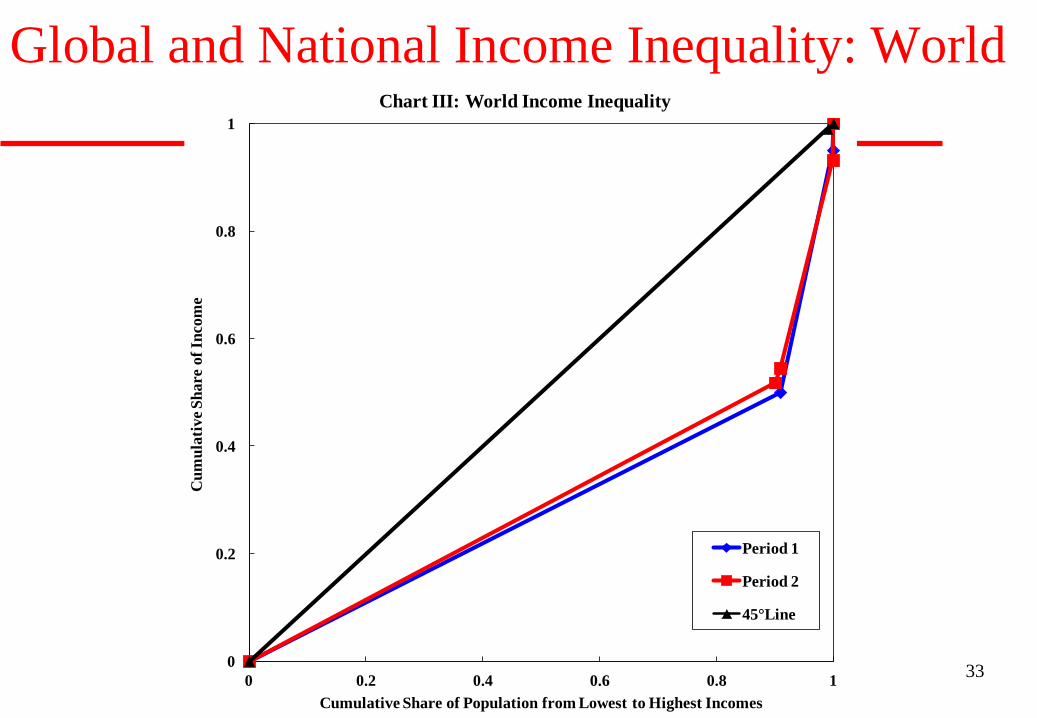
Global and National Income Inequality: An Example In Period One, the Gini coefficients for Country I and Country II are
respectively 0.09 and 0 (perfect equality) respectively. However, the Gini coefficient for the “World” of two countries is a relatively high 0.41.
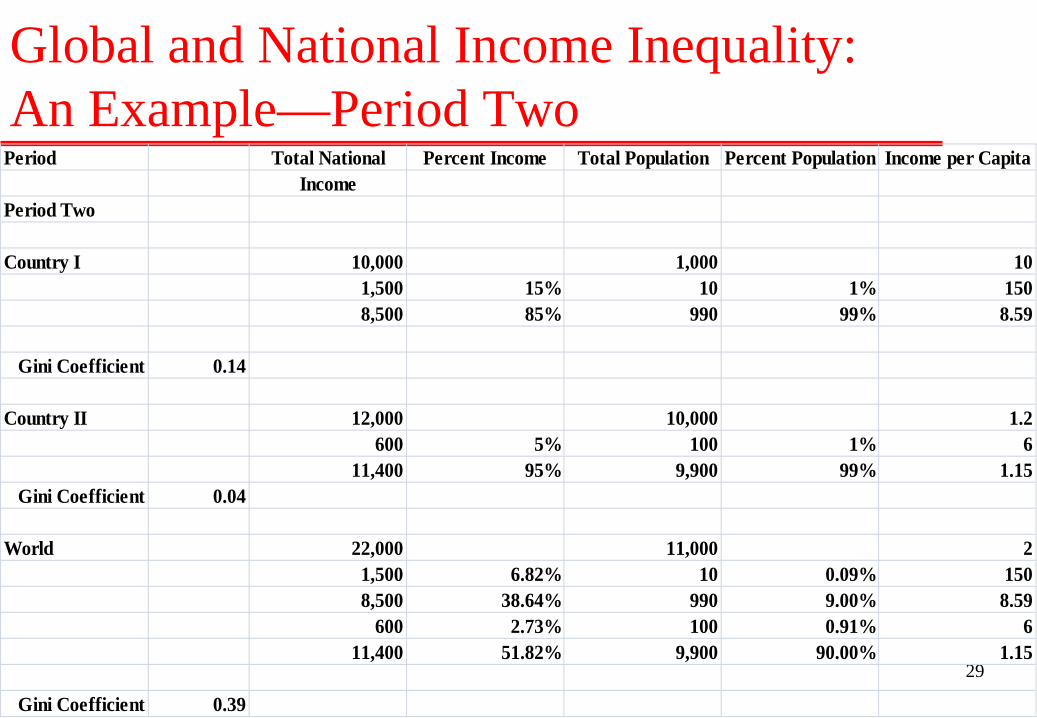
In the following chart we present the comparable hypothetical data for Period Two.
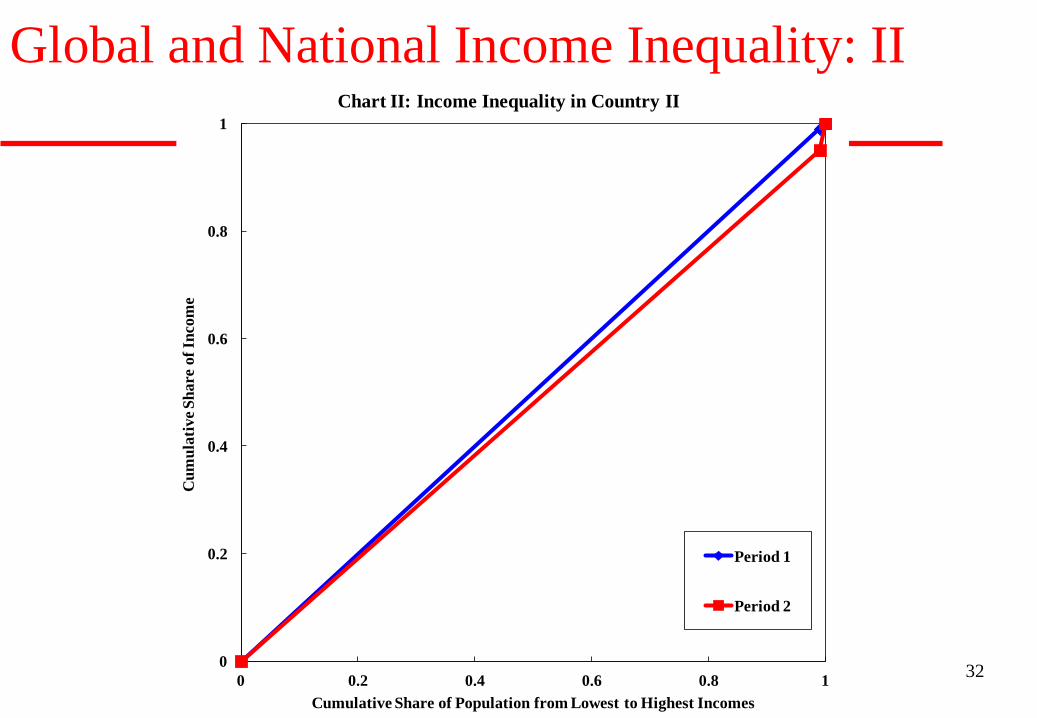
The populations have remained the same. The national income in Country I has also remained the same, but there is an increase in the share of income received by the highest one percent of the population by income from 10% to 15%. There is an increase in the national income in Country II from 10,000 to 12,000 with everyone gaining but not all at the same rate so that the income distribution has become a little unequal.
The Gini coefficients for the two countries have risen to 0.14 and 0.04 respectively as expected. However, the Gini coefficient for the “World” has fallen to 0.39, an improvement.
29
Global and National Income Inequality: An Example—Period Two
Period Total National Percent Income Total Population Percent Population Income per CapitaIncome
Period Two
Country I 10,000 1,000 101,500 15% 10 1% 1508,500 85% 990 99% 8.59
Gini Coefficient 0.14
Country II 12,000 10,000 1.2600 5% 100 1% 6
11,400 95% 9,900 99% 1.15Gini Coefficient 0.04
World 22,000 11,000 21,500 6.82% 10 0.09% 1508,500 38.64% 990 9.00% 8.59
600 2.73% 100 0.91% 611,400 51.82% 9,900 90.00% 1.15
Gini Coefficient 0.39
30
Global and National Income Inequality: An Example It is also possible to demonstrate our example graphically, in the
following charts. It is clear that for both Country I and Country II, the area between the Lorenz curve and the 45-degree line has expanded between Period One and Period Two, but for the “World”, this area has shrunk between Period One and Period Two.
31
Global and National Income Inequality: I
0
0.2
0.4
0.6
0.8
1
0 0.2 0.4 0.6 0.8 1
Cum
ulat
ive S
hare
of I
ncom
e
Cumulative Share of Population from Lowest to Highest Incomes
Chart I: Income Inequality in Country I
Period 1
Period 2
45°Line
32
Global and National Income Inequality: II
0
0.2
0.4
0.6
0.8
1
0 0.2 0.4 0.6 0.8 1
Cum
ulat
ive S
hare
of I
ncom
e
Cumulative Share of Population from Lowest to Highest Incomes
Chart II: Income Inequality in Country II
Period 1
Period 2
33
Global and National Income Inequality: World
0
0.2
0.4
0.6
0.8
1
0 0.2 0.4 0.6 0.8 1
Cum
ulat
ive S
hare
of I
ncom
e
Cumulative Share of Population from Lowest to Highest Incomes
Chart III: World Income Inequality
Period 1
Period 2
45°Line
34
Global and National Income Inequality Thus, it is possible for the degree of global income inequality to
improve while the degrees of national income inequality deteriorate.
It is also possible for the degree of global income inequality to deteriorate while more people are lifted out of poverty (i.e., achieve incomes above a certain level defined as the poverty line).
It is also possible for the income of every group in a country to improve and for the degree of national income inequality in that country to deteriorate. For example, the incomes of both groups in Country II have improved in Period Two even as the income distribution in Country II becomes more unequal.
35
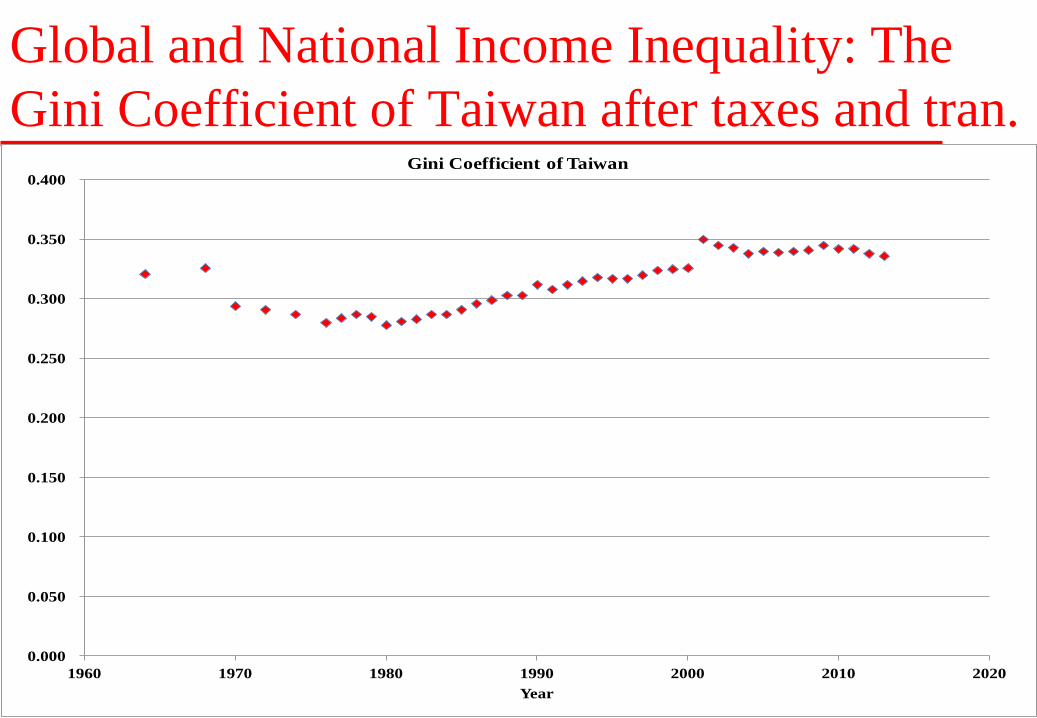
Global and National Income Inequality: The Gini Coefficient of Taiwan The Gini Coefficient of Taiwan, shown in the following chart,
which has been consistently below 0.35 actually compares quite favourably with the other developed economies.
Moreover, the Gini Coefficient of Taiwan actually declined during the period of its fastest economic growth—from the mid-1960s to the early 1980s to below 0.3.
This was attributable to the poverty alleviation policy of the then Taiwan Government, which was based not only on taxes and transfers but also on significant public investment in basic education, in effect, a redistribution of human capital.
36
Global and National Income Inequality: The Gini Coefficient of Taiwan after taxes and tran.
0.000
0.050
0.100
0.150
0.200
0.250
0.300
0.350
0.400
1960 1970 1980 1990 2000 2010 2020Year
Gini Coefficient of Taiwan
37
Economic Globalisation and Its Recent Acceleration We next consider the causes of the recent acceleration of the rate of
globalisation. Economic globalisation is not new—The Silk Road in China (established during the Western Han Dynasty in the 2nd Century B.C.), Zheng He’s seven voyages (1405-1432), Christopher Columbus’s discovery of the Americas (1492), the Dutch (1602) and the English (1600, later British) East India Companies, and the China Clippers (mid-19th Century).
However, economic globalisation has intensified and accelerated during the past several decades. As Thomas Friedman (2005), New York Times journalist, observed: “The World is Flat!”. Economic globalisation now reaches every corner of the Earth.
There has been unprecedented growth in international trade and investment flows during the past quarter of a century, notwithstanding the East Asian currency crisis of 1997-1998 and the global financial crisis of 2008 and the European sovereign debt crisis of 2010.
38
Economic Globalisation and Its Recent Acceleration The total value of World trade has been growing at an average annual
rate of 7.5 percent per annum from 1990 to 2013 (8.4 percent per annum from 1990 to 2008, the beginning of the global financial crisis). At this rate, World trade doubles every ten years. The rate of growth of World trade is between 2.5 and 3 times higher than the rate of growth of World GDP, estimated at 2.7 percent per annum (3% pr annum from 1990 to 2008). (It is important to distinguish between gross output and value-added. The gross value of exports is frequently much higher than the value-added in the exporting country.)
World foreign direct investment has also grown significantly. Annual global net foreign direct investment inflow may be estimated at around half a trillion U.S. Dollars in 2013, compared to a World GDP estimated to be on the order of US$100 trillion in 2013.
China was the World’s leading recipient of FDI in 2013 and the U.S. was the second largest recipient.
39
Economic Globalisation and Its Recent Acceleration The recent acceleration of economic globalisation has been greatly
facilitated by the falling costs of both communication and transportation worldwide.
The falling cost of communication results from the information and communication technology (ICT) revolution, and in particular, from the rise of the internet. There have been large reductions in the costs of information transmission, analysis, storage and retrieval. Information can now be available and transmitted accurately and securely in real time and at relatively low cost.
This has in turn facilitated greatly inter-firm and intra-firm co-ordination and division of labour by reducing the costs of communication, monitoring, and control (geographical distance is no longer a barrier), and thereby lowering the explicit and implicit transactions costs of out-sourcing. It has made possible the “fragmentation” of production, that is, the division and sub-division of a manufacturing process for a single final product among different and geographically dispersed contractors and sub-contractors, allowing the use of the best and lowest cost alternatives.
40
Economic Globalisation and Its Recent Acceleration There has also been rapidly rising volume of trade in services
such as tourism, financial services and professional services as well as previously non-tradable services (software-outsourcing, data processing, call centers, back offices) now made tradable through the internet and/or optical fibre networks, for example, the export of software services to the rest of the World by Indian software firms such as Infosys. Educational and medical services can also be delivered at long distance and across borders through the internet.
The cost of shipping by air and sea, including logistics, has also declined.
Finally, the worldwide use of English as the medium of business communication has also facilitated economic globalisation.
41
Economic Globalisation and Its Recent Acceleration The entry of new players into the global marketplace—such as
China, India, Russia and the other countries of the Commonwealth of Independent States (the former Soviet Union), the formerly socialist countries of Eastern Europe—as both suppliers of exports and the demander of imports, has also increased significantly the value and volume of World trade.
The formation of economic communities, unions and the conclusion of free trade agreements such as those pertaining to the World Trade Organization (WTO), the North American Free Trade Agreement (NAFTA), and the ASEAN (Association of Southeast Asian Nations) Free Trade Agreement (AFTA) have also facilitated economic globalisation through the reduction of tariffs and other barriers to international trade in goods and services.
42
Economic Globalisation and Its Recent Acceleration With the conclusion of these free trade agreements, there is also a
tendency for the consolidation of dispersed production facilities at a single location, e.g., within the European Union, thus increasing World trade flows.
Economic globalisation is also facilitated by the necessity of physical hedging of the risks of supply interruption. When earthquakes occurred in Japan and Taiwan, the customers of Japanese and Taiwanese firms realised that they must require their suppliers to diversify their operations in geographically separate regions so as to reduce the risks of supply interruption.
43
Economic Globalisation and Its Recent Acceleration Foreign direct investment flows has also grown because of falling
barriers and incentives provided by many countries eager for foreign direct investment inflows. National treatment for foreign direct investment is increasingly becoming the standard under the World Trade Organisation (WTO) and similar agreements.
Foreign direct investments (FDI) often follow trade—e.g., to secure long-term supply of raw materials and natural resources; and trade often follows foreign direct investments—e.g., production by captive subsidiaries for sale in the home country. A large proportion of World trade consists of intra-industry and intra-firm trade.
Foreign direct investments may also be motivated by the desire to provide cross-border services by leveraging a brand name and existing expertise and knowhow, e.g. AIG, McDonald, FedEx.
44
The Benefits and Costs of International Trade and Investment What have been the benefits and costs of economic globalisation?
Economic globalisation has resulted in significant growth of international trade and investment.
Economic theory tells us that voluntary international trade always benefits both trading partners. The truth of this statement is intuitively obvious if one country is more efficient in the production of one good (in terms of requiring less resources per unit of output) and the other country is more efficient in the production of the other. Specialization and trade can then make both countries better off.
45
The Benefits and Costs of International Trade and Investment But even if one country is more efficient than another country in
the production of every good, both countries still gain from trading with each other. This is because they have different comparative advantages.
An easy way to see this is the following: since the trade is voluntary, if there are no gains to either one of the trading partner countries, there will be no trade. In any trade, both partner countries must gain. And the gains should be sufficient to compensate the potential losers in each trading partner country.
46
The Benefits and Costs of International Trade and Investment When a new economy decides to participate in the World economy,
international trade can only increase, and not decrease. Thus, whenever a new economy joins the World economy, aggregate economic welfare of the World should increase. Moreover, the aggregate economic welfare of each country should also increase or at least not decrease.
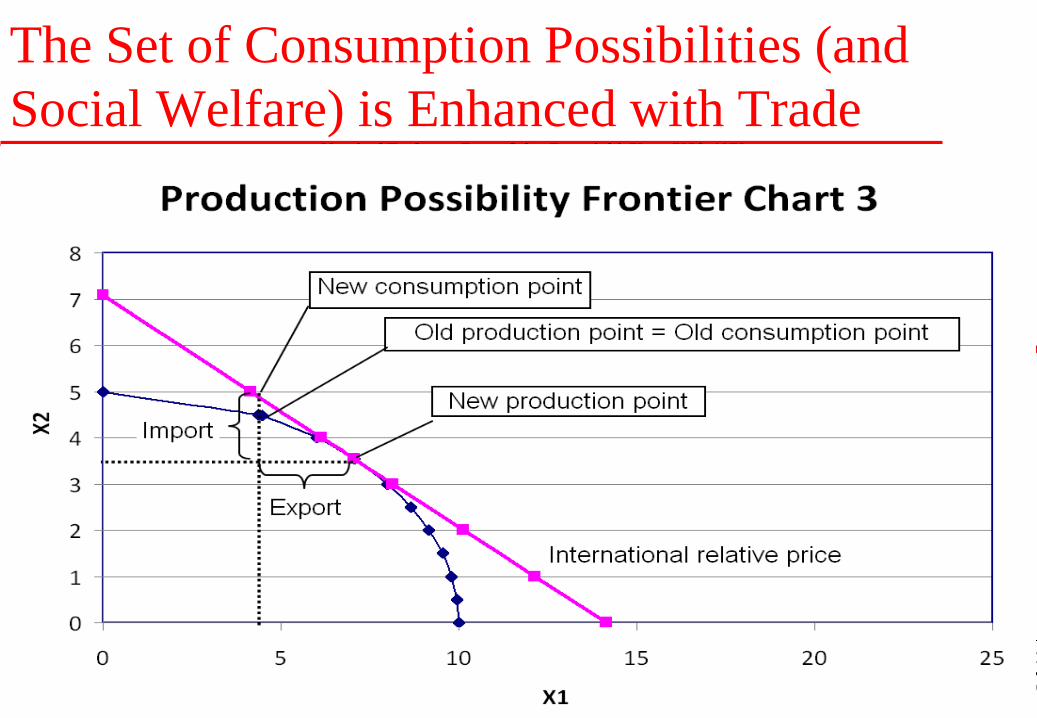
In the following chart, we show how participation in the World economy can always expand the set of consumption possibilities for a previously closed economy. The blue curve is the production possibilities frontier of the economy. In the absence of trade, it is also the frontier of the set of consumption possibilities for the economy. With trade, the set of consumption possibilities becomes the set bounded by the pink international relative price line and the two axes. It is clear that with trade, the set of consumption possibilities is greatly expanded, and the general economic welfare of the economy must therefore be higher.
47
The Set of Consumption Possibilities (and Social Welfare) is Enhanced with Trade
0
1
2
3
4
5
6
7
8
9
10
Jan-
78Ju
l-78
Jan-
79Ju
l-79
Jan-
80Ju
l-80
Jan-
81Ju
l-81
Jan-
82Ju
l-82
Jan-
83Ju
l-83
Jan-
84Ju
l-84
Jan-
85Ju
l-85
Jan-
86Ju
l-86
Jan-
87Ju
l-87
Jan-
88Ju
l-88
Jan-
89Ju
l-89
Jan-
90Ju
l-90
Jan-
91Ju
l-91
Jan-
92Ju
l-92
Jan-
93Ju
l-93
Jan-
94Ju
l- 94
Jan-
95Ju
l-95
Jan-
96Ju
l-96
Jan-
97Ju
l-97
Jan-
98Ju
l -98
Jan-
99Ju
l-99
Jan-
00Ju
l-00
Jan-
01Ju
l-01
Jan-
02Ju
l-02
Jan-
03Ju
l-03
Jan-
04Ju
l-04
Jan-
05Ju
l-05
Jan-
06Ju
l-06
Jan-
07Ju
l-07
Jan-
08Ju
l-08
Jan-
09Ju
l-09
Jan-
10Ju
l-10
Jan-
11Ju
l-11
Jan -
12Ju
l-12
Jan-
13Ju
l-13
Jan-
14J
l14
Nominal Exchange Rate of the Renminbi, Yuan/US$, 1978-present
48
The Benefits and Costs of International Trade and Investment However, while voluntary international trade always brings gains
to all trading partner countries, the distribution of gains from trade, or the terms of trade, is not uniquely determined by the principles of comparative advantage alone but depends on the relative bargaining power of the trading partner countries.

49
The Benefits and Costs of International Trade and Investment Moreover, the introduction of new international trade transactions
will necessitate adjustments in each of the trading partner countries, as some industries will expand while other industries will contract, in each of them.
In the case of our graphical example, as the economy moves from the old production point to the new production point, industry 2 will contract as industry 1 expands. The shareholders and the workers of industry 2 may be worse off. There will therefore be both winners and losers within the economy. Since the economy with trade can attain a consumption point that is previously unattainable, it is obviously strictly better off than before, and there should be sufficient gains for the winners to compensate the losers for their losses.
50
The Benefits and Costs of International Trade and Investment But the exporters of good 1 are not the only winners. The
consumers of good 2 are also winners because they will be able to pay a lower price for good 2. The consumers of good 1 may also lose because they may have to pay a higher price for good 1.
In practice, compensating the losers requires specific policy measures. Are there some feasible schemes to transfer part of the gains from the winners to compensate the losers? There are such feasible schemes which will be discussed below.
51
The Benefits and Costs of International Trade and Investment International trade also enlarges the market and permits greater
specialization and the exploitation and realization of economies of scale and learning-by-doing by individual firms. And with the growth of markets, their integration as well as segmentation become possible.
International trade enables specialization in tasks rather than products by firms—firms find their own niches in the global supply chain that maximise their value-added based on their “core competence”; higher-value-added parts of the supply chain also have much less competition (Apple, Intel, Microsoft, TSMC).
It is more efficient and profitable for firms to expand horizontally (to supply multiple customers around the globe) rather than to integrate vertically.
52
The Benefits and Costs of International Trade and Investment The rate of return to intangible capital (investment in innovation, R&D
capital, intellectual property and brand names) rises more than proportionally as the size of market expands. This is because the creation of intangible capital (e.g., a patented product or process) often requires a high fixed cost, but the expanded application of such intangible capital, once created, has low marginal cost (e.g., Coca-Cola expanding into a new market; introduction of existing drugs into a new market) and hence high marginal revenue and profit.
International trade and foreign direct investment permit the leveraging of intangible capital (patents, technology, knowhow, goodwill, brand name, reputation, business methods) over a much larger market.
Intangible capital is much more industry-specific than location-specific. It is much easier for an existing firm to enter a different geographical market than to enter a different industry in the same geographical market.
53
The Benefits and Costs of International Trade and Investment The adequate protection of intellectual property rights is essential
for innovation and technology transfer. Without such protection, there will be little incentive to try to innovate, and also little incentive for cross-border direct investment or technology licensing.
The protection of the intangible capital in a new market often requires direct supervision, management and control and hence direct investment. Franchising without active monitoring does not work well in many economies.
Economic globalisation also facilitates the exchange and transfer of new concepts and ideas, new business models and methods, and new technology, and promotes cultural exchange, improves international understanding and reduces the possibility of potential conflicts.
54
The Benefits and Costs of International Trade and Investment Economic theory also tells us that voluntary long-term capital flows in
the form of direct investment or long-term portfolio investment benefit both the investor and the investee countries. However, there is no theory to support the hypothesis that short-term capital flows are beneficial to either the economy of origin or the economy of destination.
International trade flows are relatively stable. Foreign direct investment flows, both inbound and outbound, are basically long-term in nature and hence also relatively stable on the whole. The same is true of long-term portfolio investment flows.
However, short-term cross-currency international capital flows are susceptible to abrupt changes in magnitude and direction (e.g., hot money) that can greatly destabilise the financial markets of a country, including its foreign exchange market, credit market and capital market, impacting the real economy negatively.
55
The Benefits and Costs of International Trade and Investment But the most compelling argument against such short-term cross-
currency international capital flows is that, with the exception of short-term trade-related financing, they are not socially productive.
Short-term cross-currency capital inflows cannot be usefully deployed in the destination country. When they are used to finance long-term investments in the destination country, they invariably lead to trouble because of the maturity mismatch, and further exacerbated by the currency mismatch. The 1997-1998 East Asian currency crisis is basically the outcome of massive maturity and currency mis-match in the loans taken out by enterprises in the East Asian economies.
56
The Benefits and Costs of International Trade and Investment Moreover, as short-term capital flows in and out of the
destination country, they cause the exchange rate and/or the interest rates of the destination country to become excessively volatile, inhibiting not only the flows of its international trade and long-term investment but also the development of the domestic real economy.
Excessive volatility of the exchange rate can also worsen the income distribution as the poor people are the least able to hedge against exchange rate changes or to benefit from it.
57
The Implications of Economic Globalisation The globalisation of markets for goods, services and factors
(tangible and intangible capital and skilled labour) and natural resources (e.g., oil, iron ore, rubber) implies the intensification of competition on all fronts. But it also encourages cross-border mergers and acquisitions and the resulting increase in industrial concentration.
Thus, the comparative advantages of an economy have to be continually created, maintained, preserved and renewed. The East Asian economic development experience provides an example of created as opposed to natural comparative advantage (human capital and R&D capital can substitute for natural resources).
58
The Implications of Economic Globalisation Economic globalisation also implies that external competition
and economic disturbances can cause temporary as well as permanent disruptions in the economic growth and employment within a country. There is increased unpredictability resulting from footlooseness of suppliers, customers and investors as well as external shocks, coupled with decreased ability for risk diversification. For smaller economies, there is greater vulnerability to the effects of external disturbances. The social safety net must be strengthened.
There is a renewed rise of protectionism and isolationism as a reaction to economic globalisation.
59
The Implications of Economic Globalisation The market for labour is increasingly globalised. Foreign labour
is very common in many countries, e.g., in Taiwan, Hong Kong, Germany and the Middle East. And human capital in the form of skilled labour and professionals has become very mobile. There is now a World market in professionals such as accountants, engineers, scientists and managers.
However, any job that can be moved away to a lower-cost location either has been or will be moved away. Tourism is one of the few non-tradable services left because of its location specificity.
The social costs of job displacements and disruptions can be high and an adequate social safety net is essential.
60
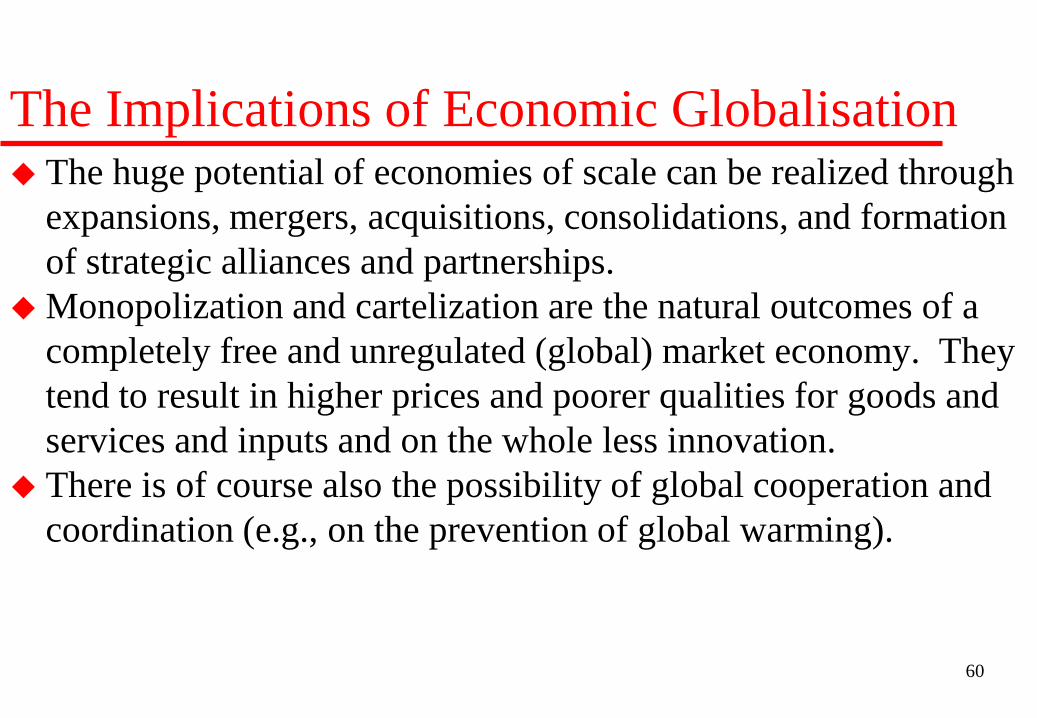
The Implications of Economic Globalisation The huge potential of economies of scale can be realized through
expansions, mergers, acquisitions, consolidations, and formation of strategic alliances and partnerships.
Monopolization and cartelization are the natural outcomes of a completely free and unregulated (global) market economy. They tend to result in higher prices and poorer qualities for goods and services and inputs and on the whole less innovation.
There is of course also the possibility of global cooperation and coordination (e.g., on the prevention of global warming).
61
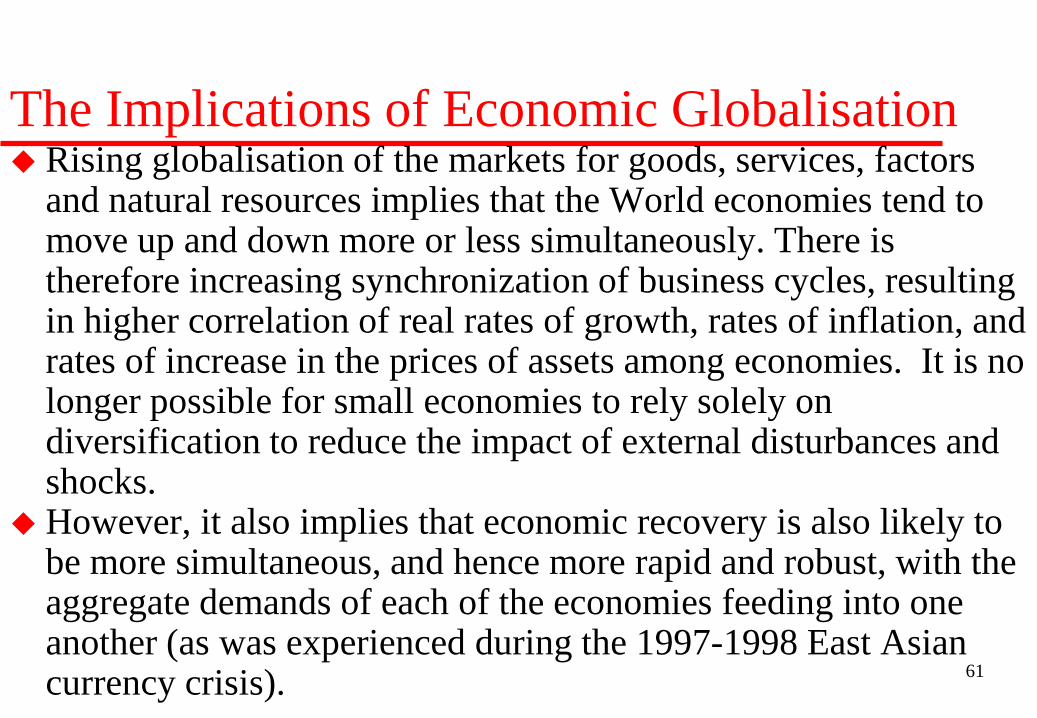
The Implications of Economic Globalisation Rising globalisation of the markets for goods, services, factors
and natural resources implies that the World economies tend to move up and down more or less simultaneously. There is therefore increasing synchronization of business cycles, resulting in higher correlation of real rates of growth, rates of inflation, and rates of increase in the prices of assets among economies. It is no longer possible for small economies to rely solely on diversification to reduce the impact of external disturbances and shocks.
However, it also implies that economic recovery is also likely to be more simultaneous, and hence more rapid and robust, with the aggregate demands of each of the economies feeding into one another (as was experienced during the 1997-1998 East Asian currency crisis).
62
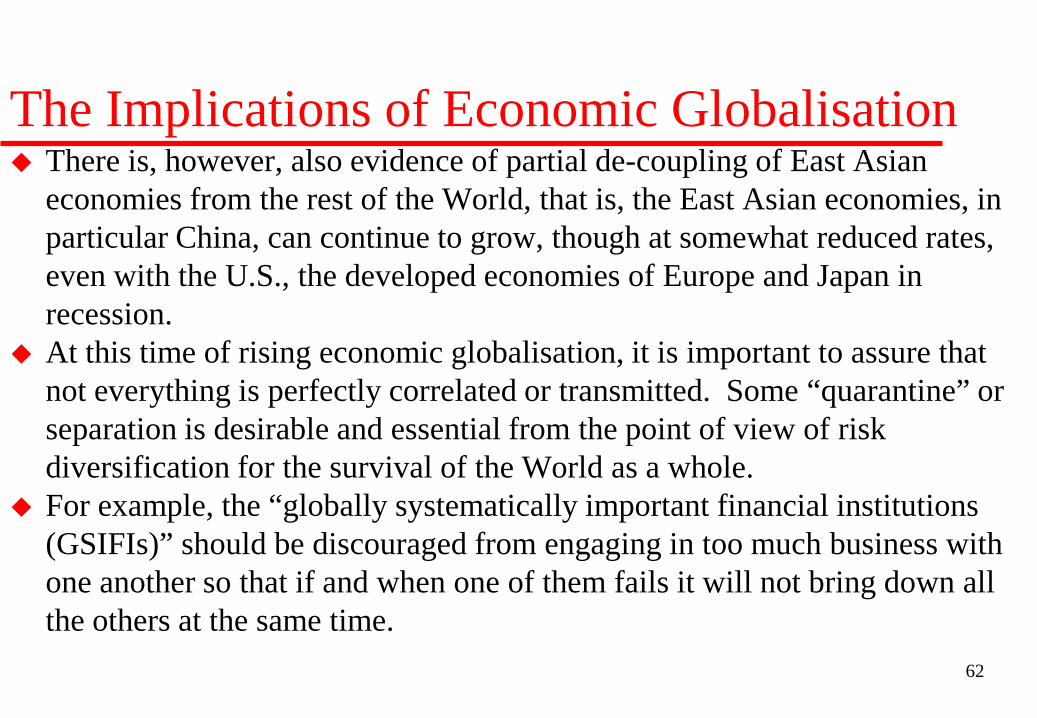
The Implications of Economic Globalisation There is, however, also evidence of partial de-coupling of East Asian
economies from the rest of the World, that is, the East Asian economies, in particular China, can continue to grow, though at somewhat reduced rates, even with the U.S., the developed economies of Europe and Japan in recession.
At this time of rising economic globalisation, it is important to assure that not everything is perfectly correlated or transmitted. Some “quarantine” or separation is desirable and essential from the point of view of risk diversification for the survival of the World as a whole.
For example, the “globally systematically important financial institutions (GSIFIs)” should be discouraged from engaging in too much business with one another so that if and when one of them fails it will not bring down all the others at the same time.
63
Possible Remedial Measures I What are some possible remedial measures for preventing the
income distribution from becoming more unequal? First, a redistribution of wealth (as distinct from the direct
redistribution of income) to make its distribution more equal can certainly improve the income distribution. However, it should be done in such a way that the aggregate output of the economy is not negatively impacted. If aggregate output falls as a result, the general economic welfare is unlikely to have improved.
64
Possible Remedial Measures II Second, a country can use its tax and transfer policy to modify the
actual distribution of disposable income. Returning to a chart that we have presented before, we can see large differences between the degrees of national income inequality before (in the third column) and after taxes and transfers (in the second column) for some of the major economies.
For example, Germany, which has a high degree of income inequality before taxes and transfers (0.50) winds up with one of the lowest degree of income inequality among OECD countries after taxes and transfers (0.31).
On the other extreme, there is also Mexico, which does not seem to have done any real redistribution with its tax and transfer policy at all (0.49 before taxes and transfers versus 0.48 after taxes and transfers).
Transfer payment programmes such as unemployment insurance and re-training grants and subsidies can help a worker displaced by imports or by cross-border out-sourcing to find gainful employment again. A strong social safety net helps.
65
World Bank & OECD Estimates of Gini Coefficients, Selected Countries, circa 2000s
Country World Bank Estimates OECD Estimatesof Gini Coefficients of Gini Coefficients
after taxes and transfers before taxes and transferscirca 2000s (percent) circa 2000s (percent)
Australia 30.5 46.8Canada 33.7 44.1China 37 NAFrance 32.7 48.3Germany 30.6 50.4Italy 36 53.4Japan 38.1 46.2Korea, Republic of 31.3 34.4Mexico 48.1 49.4Russia 39.7 NASweden 25 43.6Switzerland 33.7 40.9Turkey 39 47United Kingdom 38 45.6United States 41.1 48.6
66
Possible Remedial Measures III Third, a country can choose to impose a minimum wage and raise
it from time to time, which should raise the levels of incomes of the lowest income groups if it does not increase unemployment in the process. However, the minimum wage is an instrument that should be used only sparingly, as it runs the risk of increasing unemployment and possibly inflation, and in so doing worsen the income distribution and perhaps even lead to social unrest. The appropriate time to raise the minimum wage is when the unemployment rate is very low, not when it is already very high.
67
Possible Remedial Measures IV Fourth, a country can choose to be isolated from the rest of the
World, by not participating in international trade and not permitting investment inflows and outflows, that is, by adopting a policy of economic autarky. This will certainly minimise the effects of economic globalisation. But economic autarky will invariably result in a significantly lower general economic welfare and standard of living for the population. Examples are China before its reform and opening in 1978, South Africa and Myanmar during their respective sanction periods, and present-day Cuba and North Korea. Moreover, economic autarky does not necessarily result in a more egalitarian national distribution of income. In any case, it can be said that the cure may be much worse than the disease.
68
Possible Remedial Measures V Fifth, there are feasible targeted approaches to alleviate the
negative effects of economic globalisation. In principle, the gains from trade will exceed the losses, so that it should be possible for the winners to compensate the losers within the country. In practice, compensating the losers requires specific policy measures.
69
Possible Remedial Measures V First of all, continuing on our previous example, as industry 1
expands while industry 2 contracts, in principle, the displaced workers from industry 2 can be re-employed in industry 1. Of course, transitional assistance, such as unemployment benefits and re-training grants and subsidies, may be required. Unemployment benefits should be financed from the social safety net whereas re-training grants and subsidies should probably be financed through some kind of taxes on the “winners”.
Secondly, industry 1 will now have higher profits, both from its expansion of output due to increased exports and the higher price of good 1 that it produces, and will therefore pay higher taxes on its profits. It is reasonable to levy an additional transitional surtax on its profits due to the increased exports.
70
Possible Remedial Measures V This surtax can be imposed on the profits of industry 1 attributable to
the increase in exports of good 1. It can be estimated as (value of additional exports of good 1)/(value of total sales, domestic and export combined, of good 1) x (total profits from good 1) x t, where t is a fraction between 0 and 1. It is probably reasonable to set t to be somewhere between 0.1 and 0.25. This surtax applies only for the current year. In the subsequent year, if there is no increase in exports of good 1, then there is no surtax liability, as additional exports is zero. The virtue of this formula is that it can be easily applied at the firm level and it stops applying automatically when steady state, that is, no additional annual increase in exports, is reached.
In practice, the surtax rate t should be set so that together with other additional surtaxes, they can cover the cost of transitional assistance needed by workers in industry 2.
71
Possible Remedial Measures V Thirdly, industry 2 will now have lower profits, both from its
contraction of output due to increased imports and the lower price of good 2 that it produces, and will therefore pay lower taxes on its decreased profits. In addition, it may also need to lay off workers. As mentioned above, the displaced workers in industry 2 will need transitional assistance from the government.
The “winners” are, however, the consumers of good 2, who now enjoy a lower price. A transitional surtax should be imposed per unit of imported good 2 to raise additional revenue to compensate the “losers”. The tax rate can be set equal to the (value of additional imports of good 2 if greater than zero)/(value of total imports of good 2) x [(average price of domestically produced good 2)/(average price of imported good 2, c.i.f.)-1] x (sales of domestically produced good 2)/(total sales of good 2, domestic and imports combined) x t, where t is a fraction between 0 and 1.
72
Possible Remedial Measures V It is probably reasonable to set t to be somewhere between 0.1
and 0.25. In practice, the rates of both the surtaxes on the additional profits of the producers of good 1 and on imports of good 2 can be calibrated to cover the cost of the transitional assistance needed for the displaced workers in industry 2.
Note that the pure substitution of imports from one economy with imports from another will not lead to the imposition of the surtax.
One may argue that these surtaxes violate World Trade Organisation (WTO) rules. However, since they are transitional and not permanent, they are not dissimilar in nature to the surge tax or the anti-dumping tax imposed on selected imports by some economies. Moreover, they only apply to the additional exports and imports over the previous year and only for the current year. They can and should be made acceptable under WTO rules.
73
Possible Remedial Measures V Fourthly, the country facing an increase in imports that substitute
for its domestic production can consider the open auctioning of import permits for that good. This serves three purposes: first, it allows the quantities of imports to increase gradually by phasing in the import quotas to be auctioned each year; second, the cost of the import quotas will ultimately be borne by the purchasers of the imported good, which is what it should be because they are direct beneficiaries of the lower price of the good; and third, it allows the government to collect revenue to finance the transitional assistance for the workers displaced by the imports, including the costs of their re-training and re-employment.
However, it is possible that import quotas and their auctioning may violate existing WTO rules. But they are definitely better than “voluntary” quotas.
74
Possible Remedial Measures V Fifthly, a firm may sometimes move its production operations
overseas to take advantage of lower costs and then import the goods produced overseas back home to supply its old home markets. These imports should be subject to the same import surtax as described above. Moreover, in order to not provide an additional tax incentive for such a firm to move its production operations abroad, it should be required to file consolidated tax returns for all of its home and overseas operations so that it will be required to pay taxes on profits earned from its overseas operations regardless of whether these profits are repatriated or not.
Thus, for example, a company such as Apple cannot park its profits in an Irish subsidiary untaxed by the U.S. as long as the profits are not repatriated.
75
Possible Remedial Measures VI Sixth, ensuring full employment is probably one of the most
effective policies to raise the income of the low-income groups and to improve the income distribution.
Given economic globalisation, any job that can be moved to a lower-cost region has been or will be moved. Thus, the government should encourage and promote the creation of jobs that cannot be moved away.
76
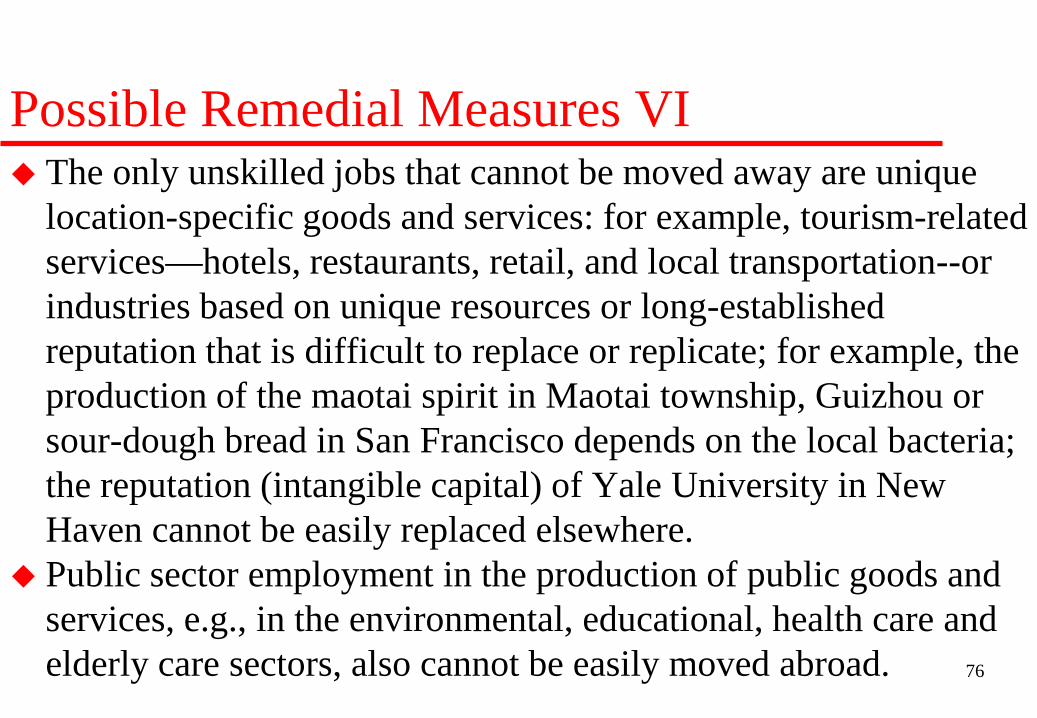
Possible Remedial Measures VI The only unskilled jobs that cannot be moved away are unique
location-specific goods and services: for example, tourism-related services—hotels, restaurants, retail, and local transportation--or industries based on unique resources or long-established reputation that is difficult to replace or replicate; for example, the production of the maotai spirit in Maotai township, Guizhou or sour-dough bread in San Francisco depends on the local bacteria; the reputation (intangible capital) of Yale University in New Haven cannot be easily replaced elsewhere.
Public sector employment in the production of public goods and services, e.g., in the environmental, educational, health care and elderly care sectors, also cannot be easily moved abroad.
77
Possible Remedial Measures VII Seventh, the Tobin tax, originally proposed by the late Prof. James
Tobin, Nobel Laureate in Economic Sciences, can be an effective means of differentiating between short-term, mostly speculative, capital flows and long-term capital flows such as direct investment and long-term portfolio investment and their repatriation.
A Tobin tax of say 0.5% on inflows and outflows of capital account transactions can be used to discourage short-term purely speculative round-trip excursions from a foreign currency into the domestic currency or vice versa. A one-month round-trip excursion will face an interest cost of 12% per annum, whereas for a five-year-long investment a Tobin tax will amount to only 0.4% per annum.
The imposition of a Tobin tax can greatly reduce short-term capital inflows and outflows and hence the volatility of the exchange rate, which is beneficial to international trade and cross-border direct and long-term portfolio investment.
78
Possible Remedial Measures VIII Eighth, in the longer term, investment in human capital is
essential. Education can be a most effective income equaliser. Investment in education enables citizens, including displaced workers, to earn a decent income and support themselves eventually by enhancing their employability and re-trainability in the long run. Identifying and creating opportunities for those with ability—providing open paths of advancement for all not only increases aggregate GDP but also promotes social harmony.
79
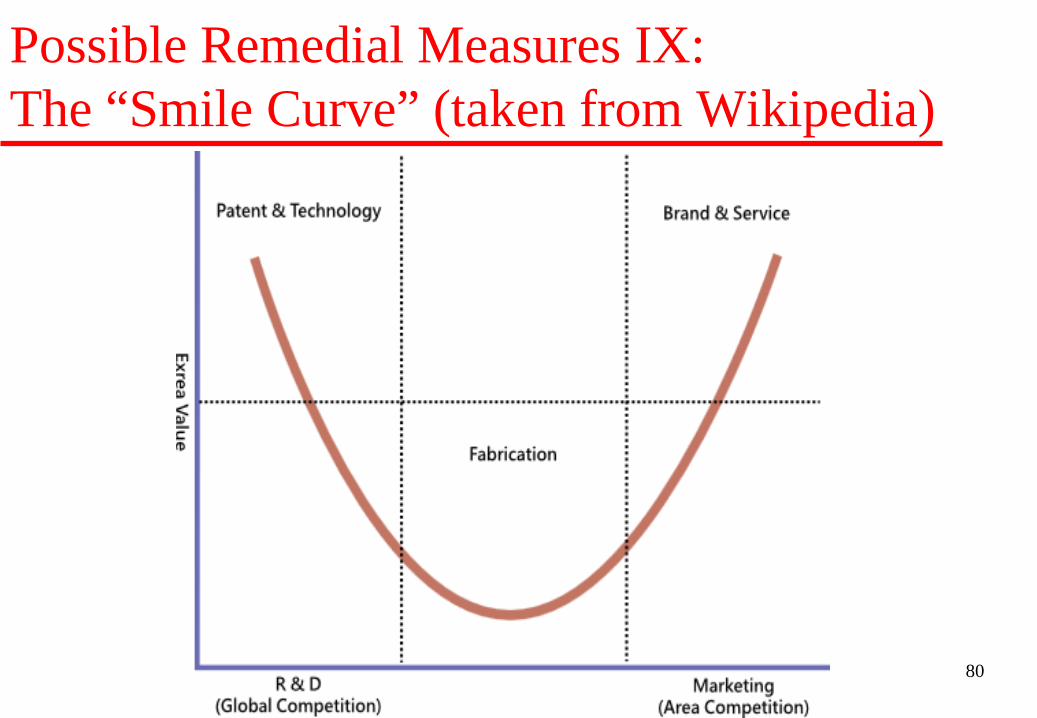
Possible Remedial Measures IX Ninth, the government should also encourage and promote investment in other
forms of intangible capital, such as R&D capital and goodwill (brand-building). The so-called “Smile Curve”, due to Mr. Stan SHIH, basically captures the empirical fact tat most of the profits from a product accrue to either the discoverer/innovator/inventor (at the beginning of the supply chain) or the marketer/distributor (at the end of the supply chain) and very little to the actual manufacturer/fabricator (in the middle of the supply chain). (See the following chart.)
The discoverer/innovator/inventor owns the patents, knowhow and designs, and profits from the royalties and license fees. The marketer/distributor owns the brand name and the distribution organization and profits from the brand recognition and distribution margins. The profit margin of the manufacturer is usually very thin, especially if they are simply contracted “original equipment manufacturers (OEMs)”. “Original Development and Manufacturing (ODM)” is slightly better. But ultimately, patents and brand names are the real sources of profits. The success of firms such as Apple and Nike provides excellent examples.
80
Possible Remedial Measures IX: The “Smile Curve” (taken from Wikipedia)
81
Possible Remedial Measures IX: The Case of Taiwan Taiwan used to be a large exporter of bananas, pineapples as well as cane
sugar, but no more. Banana and pineapple and sugar cane farmers have all since moved on to other occupations and professions and are better off than before. No one wishes to go back to growing bananas or pineapples or sugar canes.
The economic success of Taiwan is due to the expansion of the non-agricultural sector and the transfer of the labour force from agriculture to non-agriculture.
Taiwan also used to be the World’s largest exporter of shoes, but no more. Taiwan continues to prosper through the expansion of its high-technology industries.
Comparative advantage can be changed and enhanced through investment in human capital and in Research and Development (R&D). Taiwan’s most successful corporations make huge investments in R&D to maintain their competitive and comparative advantage. Taiwan has in recent years become a major producer of international patents.
82
Possible Remedial Measures X Tenth, in addition to direct redistribution through taxes and
transfers, investment in public infrastructural projects and public goods is also a form of redistribution. For example, a mass transit system and roads and bridges financed from taxes on gasoline; public schools, parks, hospitals, wifi towers and other public facilities built with general revenue with free or low-cost access to all; cleaner air, water and soil that can be enjoyed by every citizen, regardless of income and wealth, all enhance the general economic welfare. The provision of public goods can be a great and effective de facto equaliser of an unequal real income distribution.
83
Concluding Remarks Economic globalisation has the potential of bringing benefits to the poorest
people in the World and has actually done so (e.g., in Mainland China). The potential aggregate global benefits from international trade and long-
term investment are always positive, provided that the markets are competitive, that is, not monopolized by one buyer or monopsonised by one seller, and the transactions are voluntary and subsidy-free.
The principal problem is one of internal distribution of the gains from economic globalisation, whether the “winners” can be made to compensate the “losers”.
It is the government’s responsibility to provide transitional support to the displaced workers during the adjustment period, to provide re-training and re-employment assistance, and to create and facilitate alternative employment opportunities and to try to redistribute part of the gains from the winners to the losers.
84
Concluding Remarks The level and the rate of growth of real GDP affects and is in turn
affected by the degree of inequality of the income distribution. An absolutely egalitarian distribution of income does not result in
the highest level of aggregate real GDP or per capita real GDP. That is not to say that the existing income distribution is optimal,
or is the best possible. One should consider the “optimal taxation” literature pioneered by Professor Sir James Mirrlees (1971).
The government can always use tax and transfer policies to redistribute income explicitly and also a public goods policy to redistribute income in kind and hence to modify the real income distribution.
85
Concluding Remarks The rate of return to capital has been declining in all the developed
economies. Some would say that this is exactly what Karl Marx predicted. However, the low rate of return to capital is actually quite artificial—it has been caused by the central banks of developed economies maintaining a rate of interest of almost zero. When the capital markets are flooded with zero-interest-rate liquidity, it should not be surprising that the return on real investment will also be driven to almost zero.
However, the rate of return to investment in tangible capital is or can be high in developing economies such as India or African countries. Inputs complementary to capital such as labour are more abundant in the developing economies. If there is adequate public infrastructural capital, the rate of return to private capital can be quite high in these economies.
Thus economic globalisation can play a positive role in preventing the rate of return to capital from approaching zero and helping the developing economies to grow at the same time.
86
References Thomas L. Friedman (2005), The World Is Flat: A Brief History of the
Twenty-First Century, New York: Farrar, Straus and Giroux. Corrado Gini (1912), Variabilita e mutabilita (Variability and
Mutability), Bologna: C. Cuppini. James A. Mirrlees (1971), “An Exploration in the Theory of Optimum
Income Taxation,” The Review of Economic Studies, Vol. 38, No. 2, (Apr.), pp. 175-208.
Thomas Piketty (2013), Capital in the Twenty-First Century, English edition translated from French by Arthur Goldhammer, Cambridge, MA: Harvard University Press, 2014.
Joseph E. Stiglitz (2002), Globalisation and Its Discontents, New York: W.W. Norton & Company.
Joseph E. Stiglitz (2012), The Price of Inequality: How Today's Divided Society Endangers Our Future, New York: W.W. Norton & Company.


![Globalisation Tasksheets [ 43pp]](https://img.pdfslide.tips/doc/110x75/577cc48c1a28aba71199ad7d/globalisation-tasksheets-43pp.jpg)