Embed Size (px)
Citation preview

R:152
G:216
B:218
R:80
G:179
B:207
R:216
G:181
B:163
R:177
G:181
B:121
R:119
G:119
B:119
R:217
G:217
B:217
R:160
G:160
B:160
R:208
G:240
B:232
| Apresentação do Roadshow
1
Conference Call
2Q13

R:152
G:216
B:218
R:80
G:179
B:207
R:216
G:181
B:163
R:177
G:181
B:121
R:119
G:119
B:119
R:217
G:217
B:217
R:160
G:160
B:160
R:208
G:240
B:232 Disclaimer
Information contained in this document may include forward-looking statements and reflect Management’s current view
and estimates of the evolution of the macroeconomic environment, industry conditions, Company’s performance and
financial results. Any statements, expectations, capabilities, plans and assumptions contained in this document, which do
not describe historical facts, such as information about declaration of dividend payment, future direction of operations,
implementation of relevant operating and financial strategies, investment program and factors or trends affecting the
financial condition, liquidity or results of operations, are forward-looking statements, as set forth in the “U.S. Private
Securities Litigation Reform Act of 1995”, and involve several risks and uncertainties. There is no guarantee that these
results will occur. Forward-looking statements are based on several factors and expectations, including economic and
market conditions, industry competitiveness and operational factors. Any changes in such expectations and factors may
cause actual results to differ from current expectations.
The Company’s consolidated financial statements presented herein are in accordance with the International Financial
Reporting Standards - IFRS, issued by the International Accounting Standards Board - IASB, based on the audited
financial statements. Non-financial information and other operating information have not been subject to an audit by
independent auditors.
2
R:152
G:216
B:218
R:80
G:179
B:207
R:216
G:181
B:163
R:177
G:181
B:121
R:119
G:119
B:119
R:217
G:217
B:217
R:160
G:160
B:160
R:208
G:240
B:232
3
Net Revenue
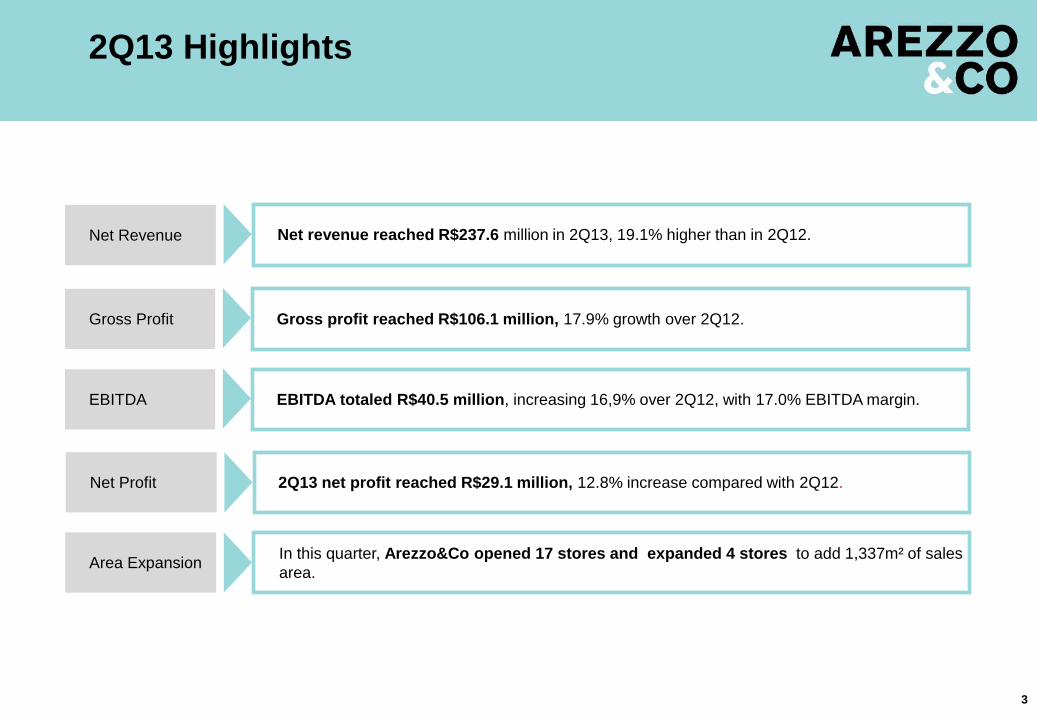
2Q13 net profit reached R$29.1 million, 12.8% increase compared with 2Q12. Net Profit
Gross profit reached R$106.1 million, 17.9% growth over 2Q12. Gross Profit
EBITDA totaled R$40.5 million, increasing 16,9% over 2Q12, with 17.0% EBITDA margin. EBITDA
2Q13 Highlights
Net revenue reached R$237.6 million in 2Q13, 19.1% higher than in 2Q12.
Area Expansion In this quarter, Arezzo&Co opened 17 stores and expanded 4 stores to add 1,337m² of sales
area.
R:152
G:216
B:218
R:80
G:179
B:207
R:216
G:181
B:163
R:177
G:181
B:121
R:119
G:119
B:119
R:217
G:217
B:217
R:160
G:160
B:160
R:208
G:240
B:232 Company Growth
4
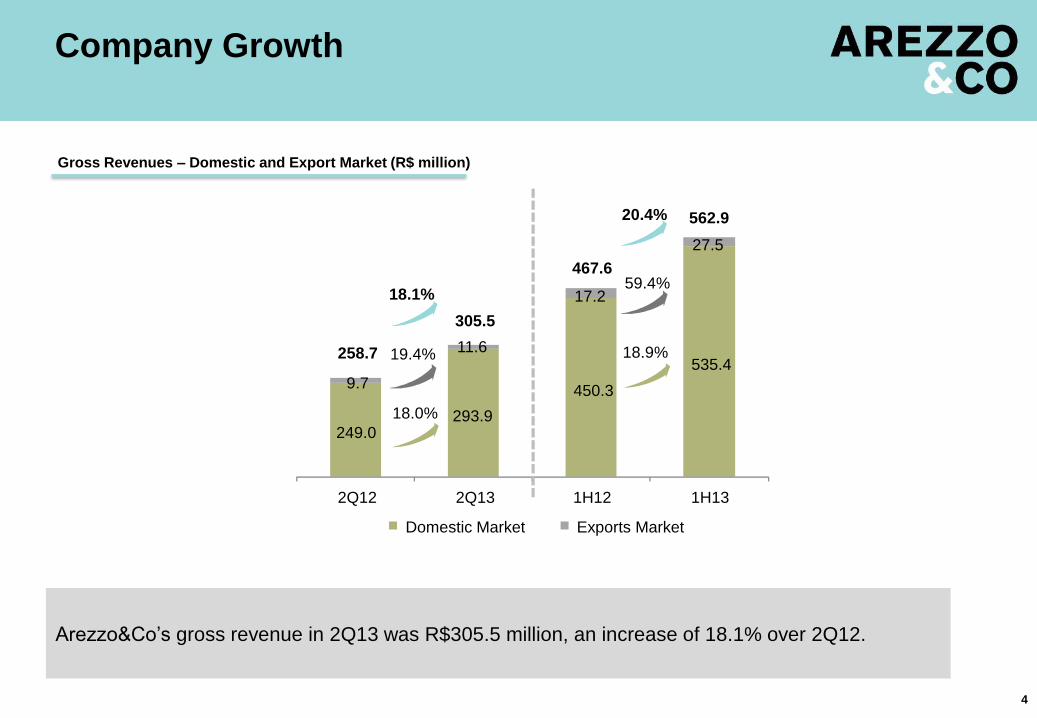
249.0 293.9
450.3
535.4 9.7
11.6
17.2
27.5
2Q12 2Q13 1H12 1H13
Domestic Market Exports Market
258.7
305.5
467.6
562.9
Arezzo&Co’s gross revenue in 2Q13 was R$305.5 million, an increase of 18.1% over 2Q12.
Gross Revenues – Domestic and Export Market (R$ million)
19.4%
18.1%
18.0%
20.4%
18.9%
59.4%
R:152
G:216
B:218
R:80
G:179
B:207
R:216
G:181
B:163
R:177
G:181
B:121
R:119
G:119
B:119
R:217
G:217
B:217
R:160
G:160
B:160
R:208
G:240
B:232
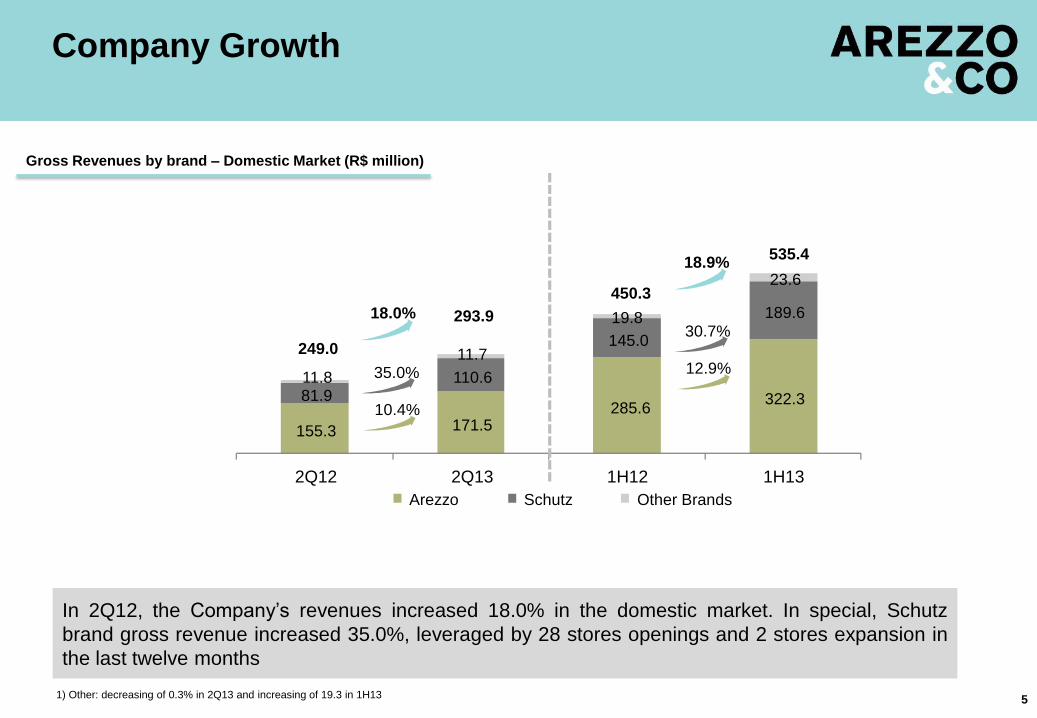
In 2Q12, the Company’s revenues increased 18.0% in the domestic market. In special, Schutz
brand gross revenue increased 35.0%, leveraged by 28 stores openings and 2 stores expansion in
the last twelve months
Company Growth
5
Gross Revenues by brand – Domestic Market (R$ million)
1) Other: decreasing of 0.3% in 2Q13 and increasing of 19.3 in 1H13
155.3 171.5 285.6
322.3 81.9 110.6
145.0
189.6
11.8
11.7
19.8
23.6
2Q12 2Q13 1H12 1H13
Arezzo Schutz Other Brands
35.0%
10.4%
18.0%
450.3
535.4
249.0
293.9
18.9%
30.7%
12.9%
R:152
G:216
B:218
R:80
G:179
B:207
R:216
G:181
B:163
R:177
G:181
B:121
R:119
G:119
B:119
R:217
G:217
B:217
R:160
G:160
B:160
R:208
G:240
B:232
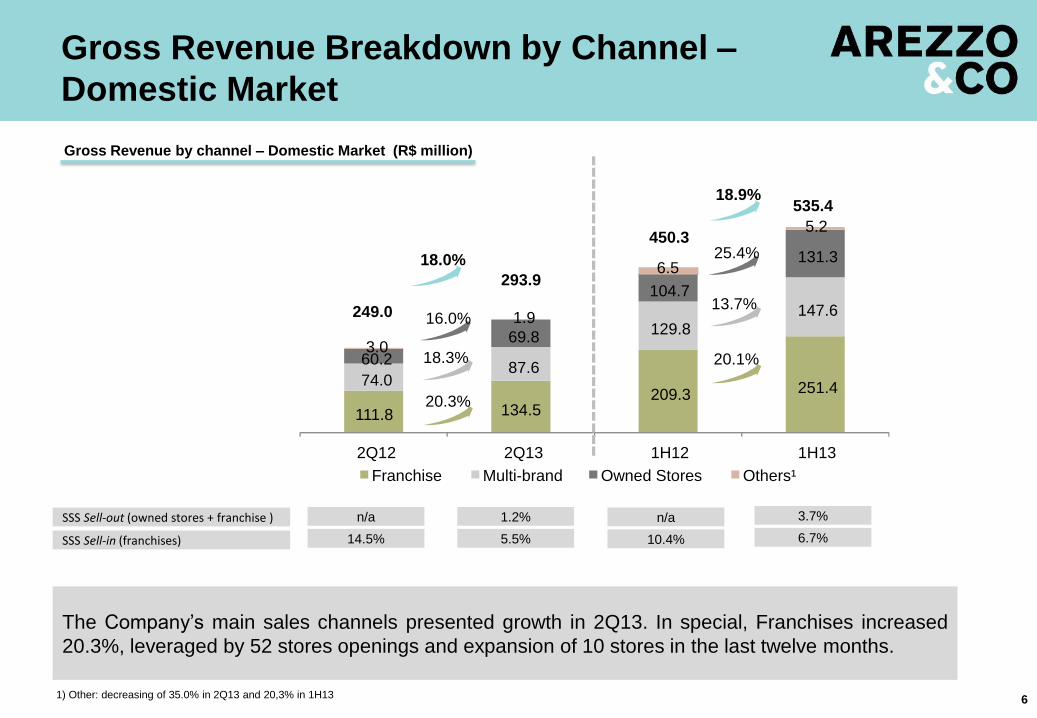
111.8 134.5 209.3 251.4
74.0 87.6
129.8 147.6
60.2
69.8
104.7
131.3
3.0
1.9
6.5
5.2
2Q12 2Q13 1H12 1H13
20.3%
16.0%
450.3
18.0%
535.4
18.3% 20.1%
25.4%
18.9%
13.7% 249.0
293.9
The Company’s main sales channels presented growth in 2Q13. In special, Franchises increased
20.3%, leveraged by 52 stores openings and expansion of 10 stores in the last twelve months.
6
Gross Revenue Breakdown by Channel –
Domestic Market
Gross Revenue by channel – Domestic Market (R$ million)
Franchise Multi-brand Owned Stores Others¹
SSS Sell-out (owned stores + franchise )
SSS Sell-in (franchises)
1) Other: decreasing of 35.0% in 2Q13 and 20,3% in 1H13
1.2%
5.5%
3.7%
6.7%
n/a
10.4%
n/a
14.5%

R:152
G:216
B:218
R:80
G:179
B:207
R:216
G:181
B:163
R:177
G:181
B:121
R:119
G:119
B:119
R:217
G:217
B:217
R:160
G:160
B:160
R:208
G:240
B:232
255 276 309 361
25 31
50
56 16.3
18.4
23.1
28.0
2Q10 2Q11 2Q12 2Q13
+58 359
417
280 307 +52
+27
21.1%
13.3%
25.6%
Sales area increased by 21.1% in this quarter compared to the same period of last year, due to 58 stores openings and expansion of other 13 stores in the last twelve months.
7
Distribution Channel Expansion
Owned Stores and Franchises Expansion
Franchises Owned Stores Total sq m
1,509 Multi Brands ²
Owned Stores ¹ 17
Franchises 332
994
Franchises
Owned Stores ¹
29
28
2
8
Multi Brands ²
Owned Stores
858
Multi Brands ² 7
Owned Stores
Multi Brands ²
Note: area given in thousand square meter
1) Includes 5 outlets with total area of 1,227 sq m
2) Domestic Market

R:152
G:216
B:218
R:80
G:179
B:207
R:216
G:181
B:163
R:177
G:181
B:121
R:119
G:119
B:119
R:217
G:217
B:217
R:160
G:160
B:160
R:208
G:240
B:232
Gross margin in 2Q13 was 44.6%, due to a lower relevance of owned stores in the sales channels
mix. EBITDA reached R$40.5 million, increasing 16.9% over 2Q12.
8
Gross Profit and EBITDA
Gross Profit (R$ million) EBITDA (R$ million)
89.9
106.1
157.1
195.5
45.1% 44.6%
43.5% 44.6%
2Q12 2Q13 1H12 1H13
Gross profit Gross margin
17.9%
24.4%
8.0
57.3 16.9% 20.6%
34.6 40.5
49.3
69.1
17.4% 17.0%
15.9% 15.8%
2Q12 2Q13 1H12 1H13
EBITDA EBITDA margin
R:152
G:216
B:218
R:80
G:179
B:207
R:216
G:181
B:163
R:177
G:181
B:121
R:119
G:119
B:119
R:217
G:217
B:217
R:160
G:160
B:160
R:208
G:240
B:232
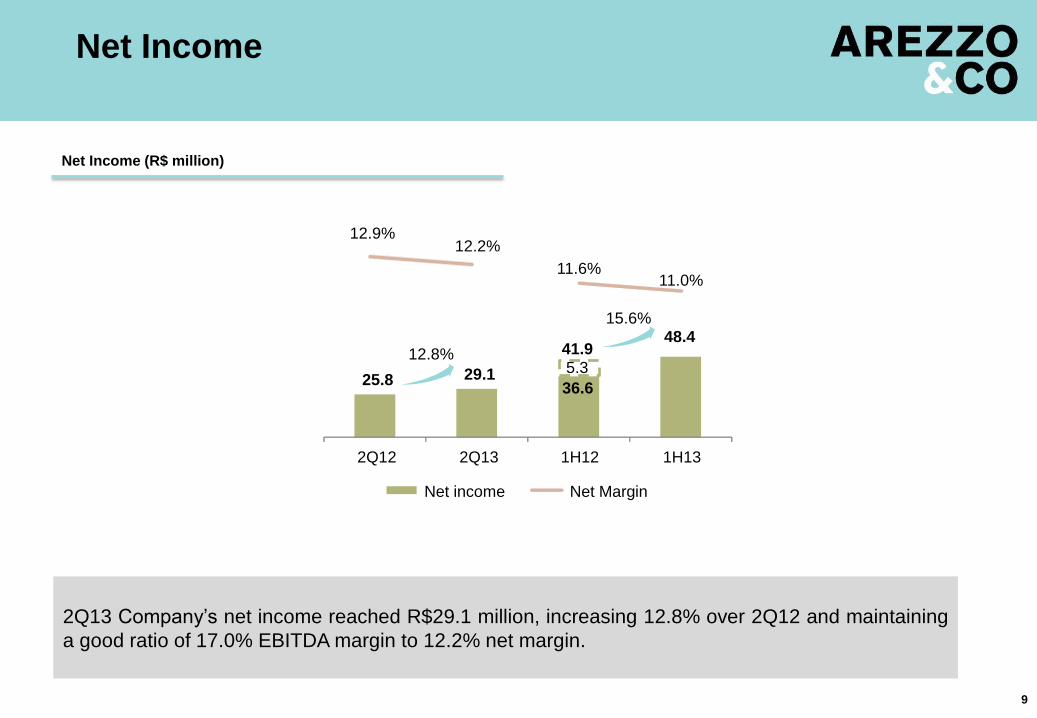
2Q13 Company’s net income reached R$29.1 million, increasing 12.8% over 2Q12 and maintaining
a good ratio of 17.0% EBITDA margin to 12.2% net margin.
9
Net Income
Net Income (R$ million)
15.6%
12.8%
25.8 29.1 36.6
48.4
12.9% 12.2%
11.6% 11.0%
2Q12 2Q13 1H12 1H13
Net income Net Margin
5.3 41.9

R:152
G:216
B:218
R:80
G:179
B:207
R:216
G:181
B:163
R:177
G:181
B:121
R:119
G:119
B:119
R:217
G:217
B:217
R:160
G:160
B:160
R:208
G:240
B:232
10
Arezzo&Co generated R$12.4 million of net cash flow in the 2Q13, mainly due to a better operating
cash flow in this quarter and a relative anticipation in the Company’s cash cycle.
Cash Generation
Operating Cash Generation (R$ thousand)
Income before income tax and social contribution 33,695 38,759 15.0% 49,331 66,850 35.5%
Depreciation and amortization 1,749 2,385 36.4% 3,166 4,970 57.0%
Other (1,518) 4,754 n/a (5,647) 3,936 n/a
Decrease (increase) in current assets / liabilities 15,616 (19,522) n/a 24,891 (11,285) n/a
Trade accounts receivables 22,801 11,471 -49.7% 28,795 9,097 -68.4%
Inventories (108) (2,716) 2414.8% (8,687) (14,190) 63.3%
Suppliers (12,798) (25,464) 99.0% 6,042 8,049 33.2%
5,721 (2,813) n/a (1,259) (14,241) 1031.1%
Payment of income tax and social contribution (11,652) (13,935) 19.6% (11,652) (17,598) 51.0%
Net cash flow generated by operational activities 37,890 12,441 -67.2% 60,089 46,873 -22.0%
Change in other noncurrent assets and liabilities
1H13 2Q13 Var. (%) Operating Cash Flow 2Q12 Var. (%) 1H12

R:152
G:216
B:218
R:80
G:179
B:207
R:216
G:181
B:163
R:177
G:181
B:121
R:119
G:119
B:119
R:217
G:217
B:217
R:160
G:160
B:160
R:208
G:240
B:232
In 1Q13, the Company invested R$8.9 million, of which R$4.2 million were used for stores openings
and refurbishments, and R$4.0 million in corporate investments. Company’s indebtedness level
remained conservative
11
Indebtedness (R$ million)
Capital Expenditure (CAPEX) and
Indebtedness
1) Other: Increase of 200.4% in 2Q13 and 239.7% and 1H13
CAPEX (R$ million)
Stores Corporate Others¹
7.4 4.2
21.0
6.5
6.8
4.0
10.3
12.0
0.3
0.5
1.6
2Q12 2Q13 1H12 1H13
0.8
31.8
-44.0%
-41.3%
-36.6%
20.2
14.5
-68.9%
16.2%
8.9
-38.2%
2Q12 1Q13 2Q13
Cash 205,819 213,306 214,411
Total debt 51,117 87,880 107,862
Short term 25,548 41,226 60,763
% total debt 50.0% 46.9% 56.3%
Long-term 25,569 46,654 47,099
% total debt 50.0% 53.1% 43.7%
Net debt (154,702) (125,426) (106,549)
Cash position and
Indebtedness
EBITDA LTM 118.007 149.731 155.575
Net debt/EBITDA LTM -1,3x -0,8x -0,7x
R:152
G:216
B:218
R:80
G:179
B:207
R:216
G:181
B:163
R:177
G:181
B:121
R:119
G:119
B:119
R:217
G:217
B:217
R:160
G:160
B:160
R:208
G:240
B:232 Contacts
Thiago Borges
Leonardo Pontes dos Reis, CFA
Phone: +55 11 2132-4300
www.arezzoco.com.br
CFO and Investor Relations Officer
IR Manager