Embed Size (px)
Citation preview

Technology Industry /Finnish Economic Outlook
May 2016
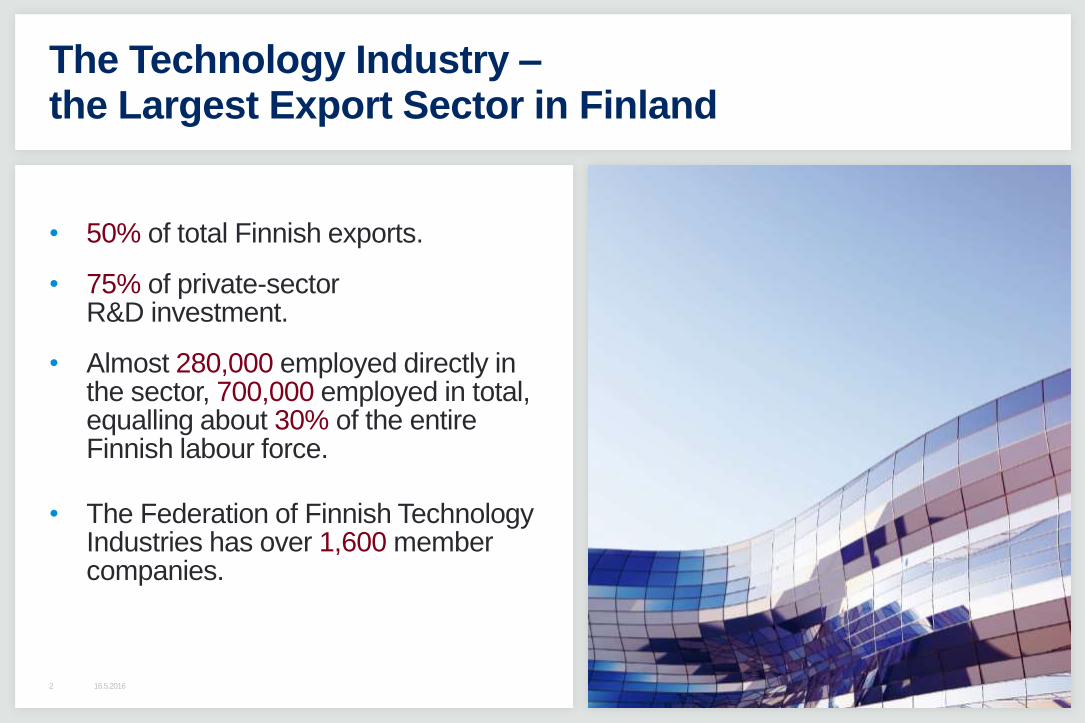
• 50% of total Finnish exports.
• 75% of private-sector R&D investment.
• Almost 280,000 employed directly in the sector, 700,000 employed in total, equalling about 30% of the entire Finnish labour force.
• The Federation of Finnish Technology Industries has over 1,600 member companies.
2
The Technology Industry –the Largest Export Sector in Finland
16.5.2016
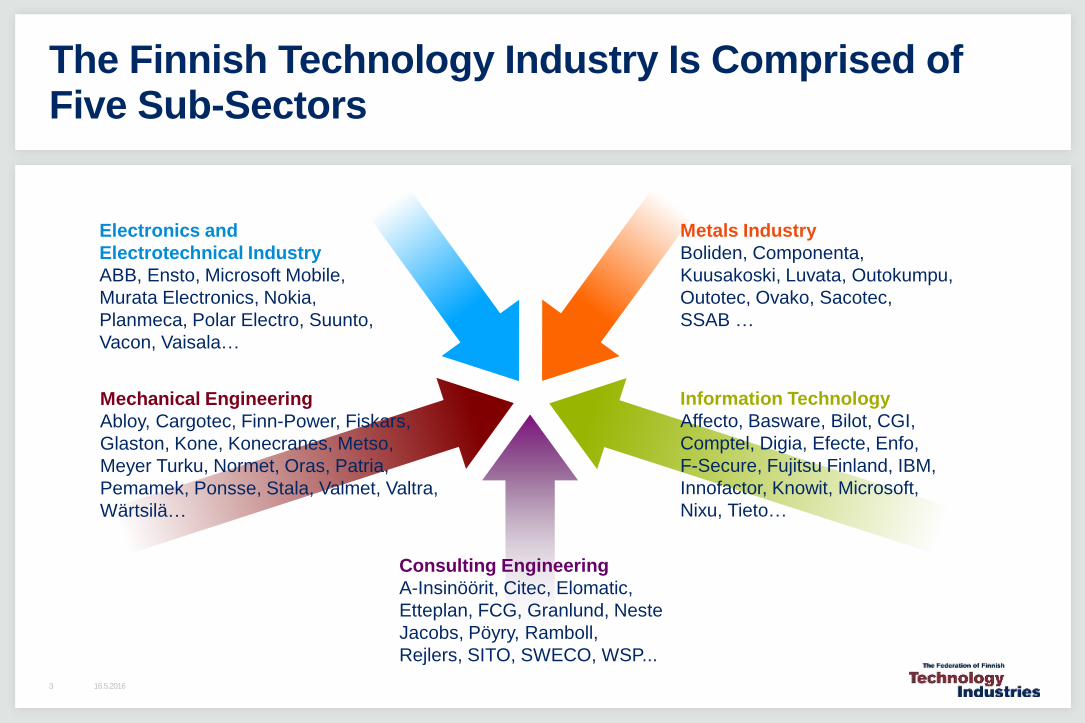
Mechanical Engineering
Abloy, Cargotec, Finn-Power, Fiskars,
Glaston, Kone, Konecranes, Metso,
Meyer Turku, Normet, Oras, Patria,
Pemamek, Ponsse, Stala, Valmet, Valtra,
Wärtsilä…
Electronics and
Electrotechnical Industry
ABB, Ensto, Microsoft Mobile,
Murata Electronics, Nokia,
Planmeca, Polar Electro, Suunto,
Vacon, Vaisala…
Information Technology
Affecto, Basware, Bilot, CGI,
Comptel, Digia, Efecte, Enfo,
F-Secure, Fujitsu Finland, IBM,
Innofactor, Knowit, Microsoft,
Nixu, Tieto…
Metals Industry
Boliden, Componenta,
Kuusakoski, Luvata, Outokumpu,
Outotec, Ovako, Sacotec,
SSAB …
Consulting Engineering
A-Insinöörit, Citec, Elomatic,
Etteplan, FCG, Granlund, Neste
Jacobs, Pöyry, Ramboll,
Rejlers, SITO, SWECO, WSP...
The Finnish Technology Industry Is Comprised of Five Sub-Sectors
16.5.20163
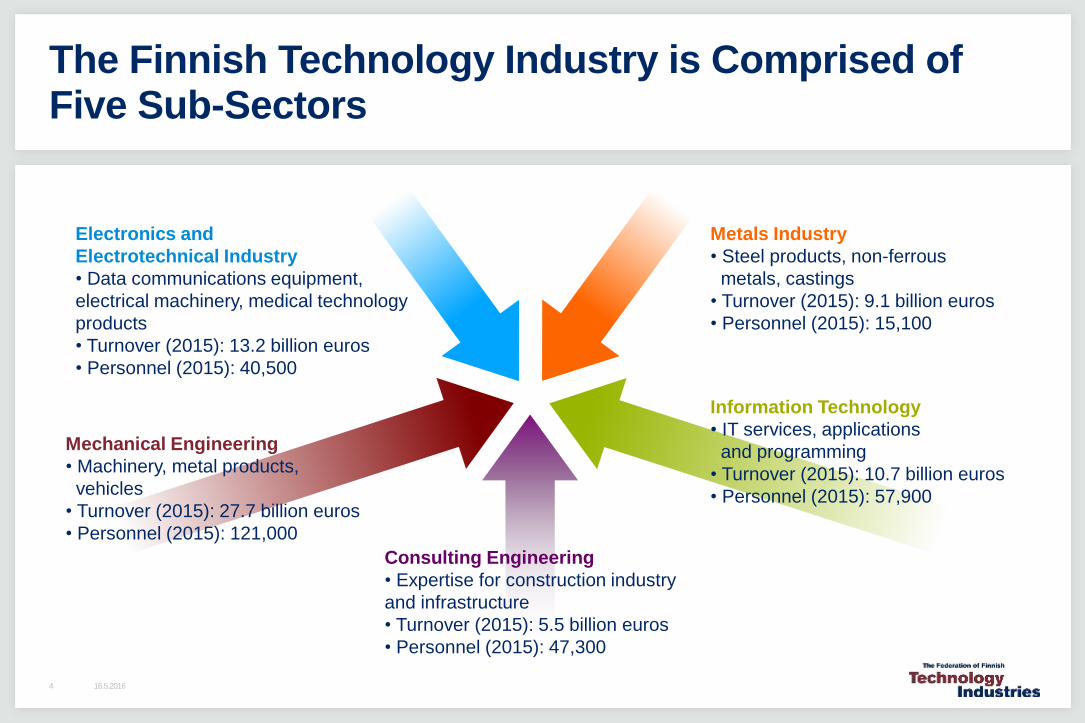
The Finnish Technology Industry is Comprised of Five Sub-Sectors
Electronics and
Electrotechnical Industry
• Data communications equipment,
electrical machinery, medical technology
products
• Turnover (2015): 13.2 billion euros
• Personnel (2015): 40,500
Metals Industry
• Steel products, non-ferrous
metals, castings
• Turnover (2015): 9.1 billion euros
• Personnel (2015): 15,100
Mechanical Engineering
• Machinery, metal products,
vehicles
• Turnover (2015): 27.7 billion euros
• Personnel (2015): 121,000
Consulting Engineering
• Expertise for construction industry
and infrastructure
• Turnover (2015): 5.5 billion euros
• Personnel (2015): 47,300
Information Technology
• IT services, applications
and programming
• Turnover (2015): 10.7 billion euros
• Personnel (2015): 57,900
16.5.20164
16.5.20165
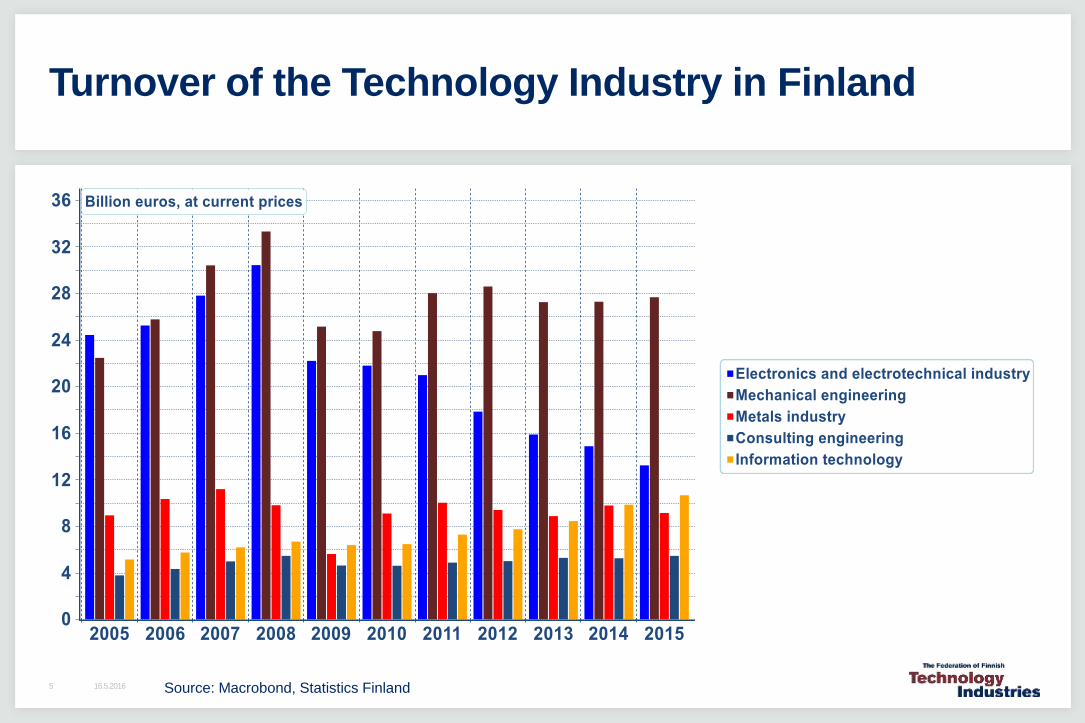
Turnover of the Technology Industry in Finland
Source: Macrobond, Statistics Finland
16.5.20166
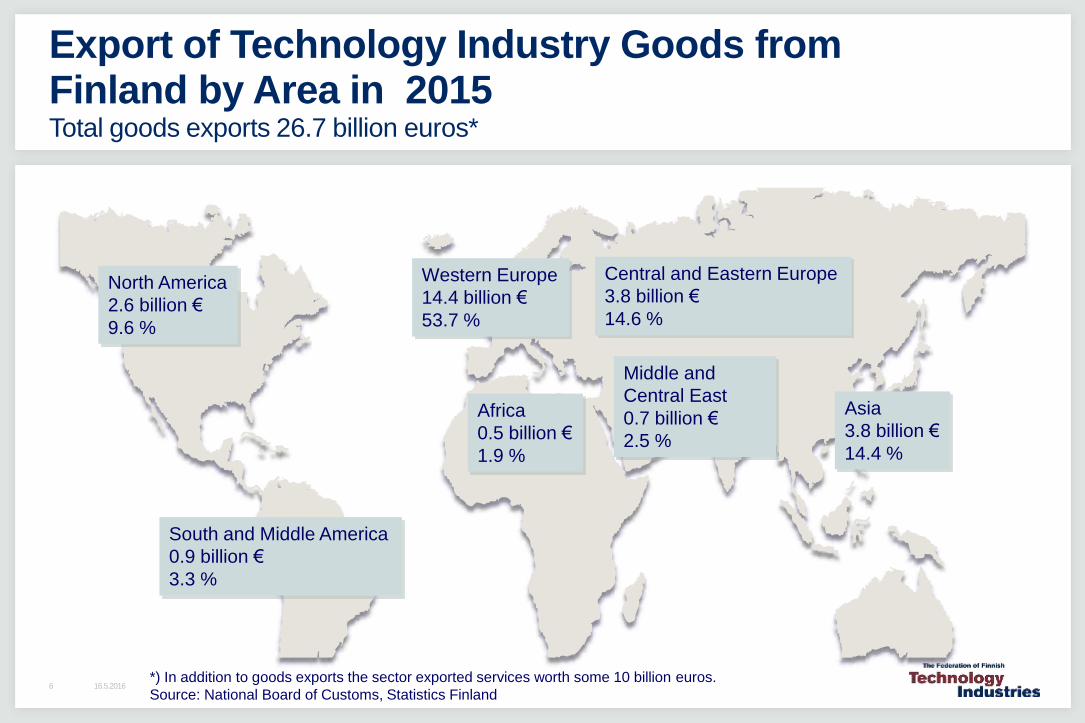
Export of Technology Industry Goods fromFinland by Area in 2015Total goods exports 26.7 billion euros*
North America
2.6 billion €
9.6 %
Western Europe
14.4 billion €
53.7 %
Middle and
Central East
0.7 billion €
2.5 %
Asia
3.8 billion €
14.4 %
Africa
0.5 billion €
1.9 %
South and Middle America
0.9 billion €
3.3 %
Central and Eastern Europe
3.8 billion €
14.6 %
*) In addition to goods exports the sector exported services worth some 10 billion euros.
Source: National Board of Customs, Statistics Finland
16.5.20167
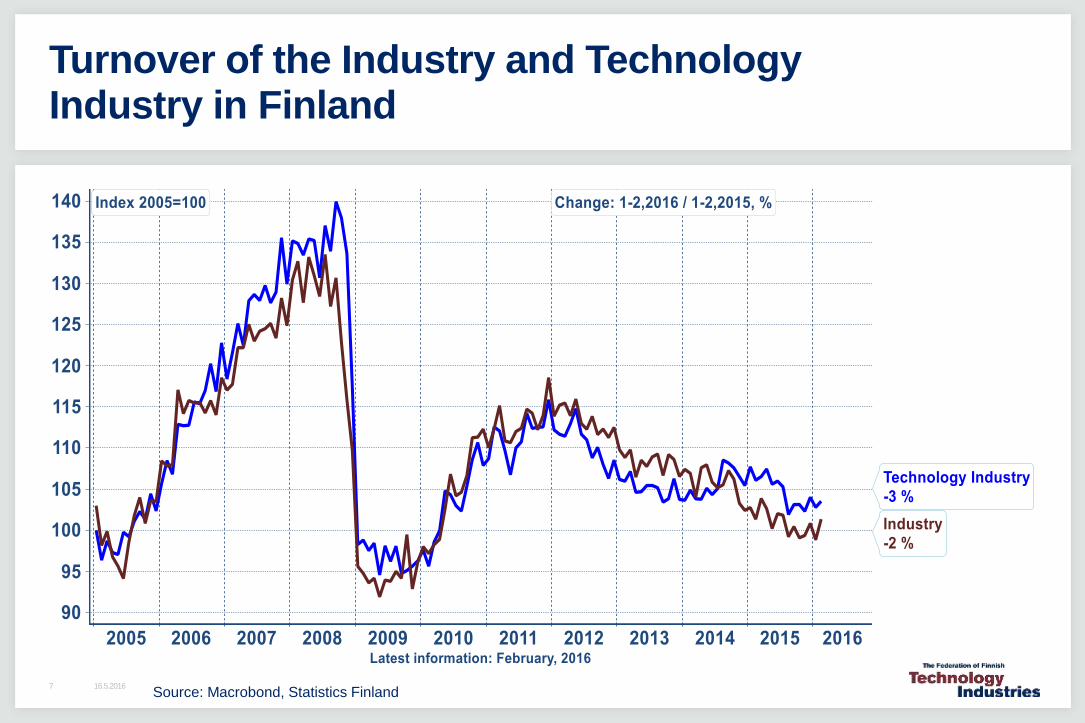
Turnover of the Industry and Technology Industry in Finland
Source: Macrobond, Statistics Finland
16.5.20168
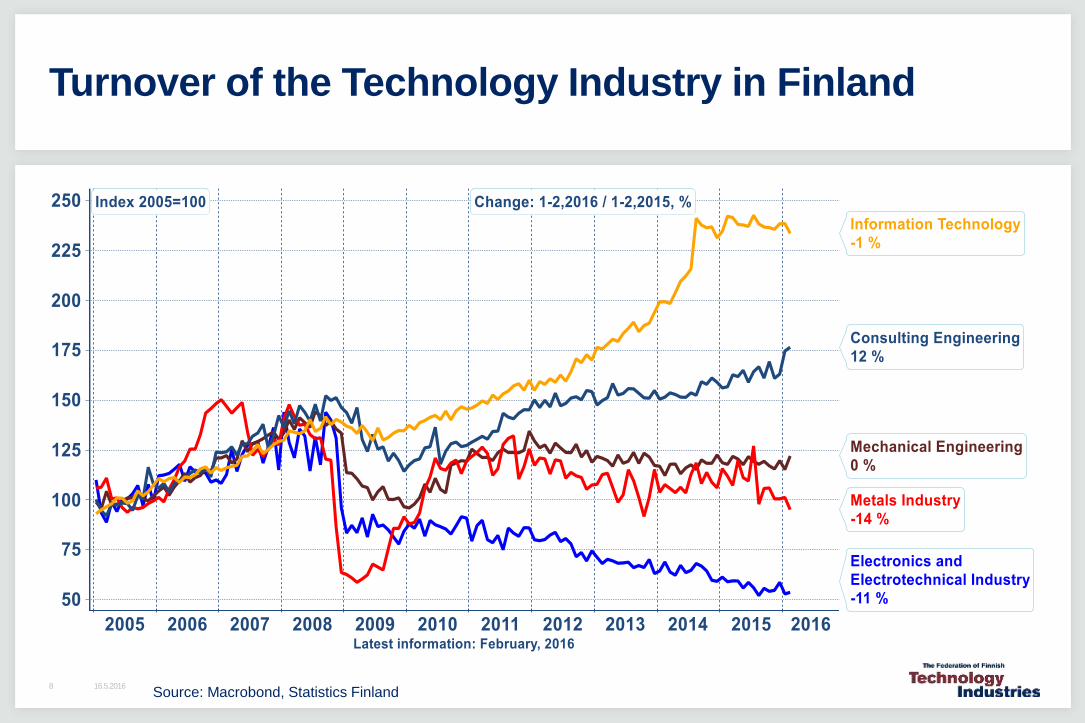
Turnover of the Technology Industry in Finland
Source: Macrobond, Statistics Finland
8.6.20159
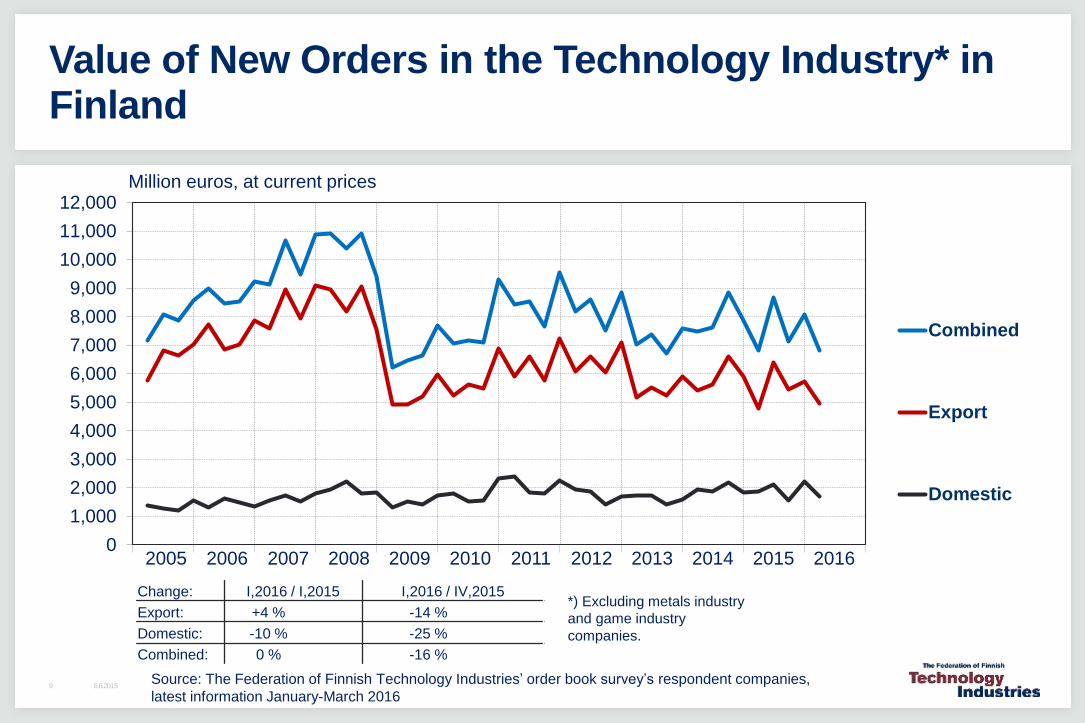
Value of New Orders in the Technology Industry* in Finland
0
1,000
2,000
3,000
4,000
5,000
6,000
7,000
8,000
9,000
10,000
11,000
12,000
Combined
Export
Domestic
Million euros, at current prices
Source: The Federation of Finnish Technology Industries’ order book survey’s respondent companies,
latest information January-March 2016
*) Excluding metals industry
and game industry
companies.
Change: I,2016 / I,2015 I,2016 / IV,2015
Export: +4 % -14 %
Domestic: -10 % -25 %
Combined: 0 % -16 %
2005 2006 2007 2008 2009 2010 2011 2012 2013 2014 2015 2016
8.6.201510
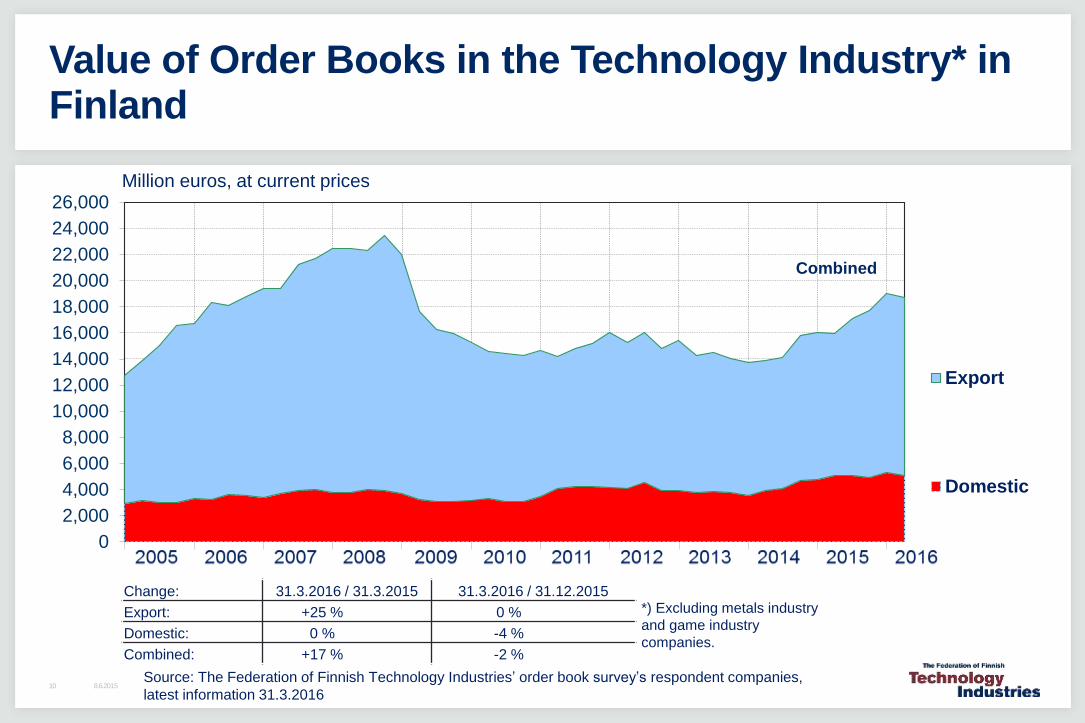
Value of Order Books in the Technology Industry* in Finland
0
2,000
4,000
6,000
8,000
10,000
12,000
14,000
16,000
18,000
20,000
22,000
24,000
26,000
Export
Domestic
Million euros, at current prices
Source: The Federation of Finnish Technology Industries’ order book survey’s respondent companies,
latest information 31.3.2016
*) Excluding metals industry
and game industry
companies.
Combined
Change: 31.3.2016 / 31.3.2015 31.3.2016 / 31.12.2015
Export: +25 % 0 %
Domestic: 0 % -4 %
Combined: +17 % -2 %
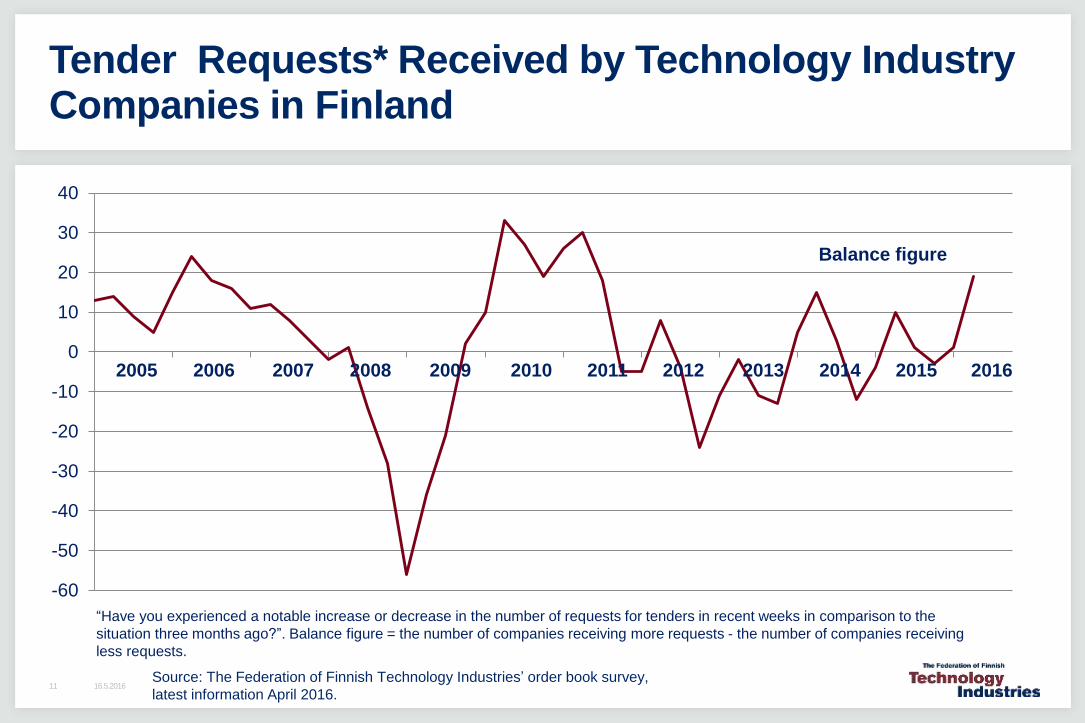
Source: The Federation of Finnish Technology Industries’ order book survey,
latest information April 2016.
“Have you experienced a notable increase or decrease in the number of requests for tenders in recent weeks in comparison to the
situation three months ago?”. Balance figure = the number of companies receiving more requests - the number of companies receiving
less requests.
-60
-50
-40
-30
-20
-10
0
10
20
30
40
Balance figure
16.5.201611
Tender Requests* Received by Technology Industry Companies in Finland
2005 2006 2007 2008 2009 2010 2011 2012 2013 2014 2015 2016
8.6.201512
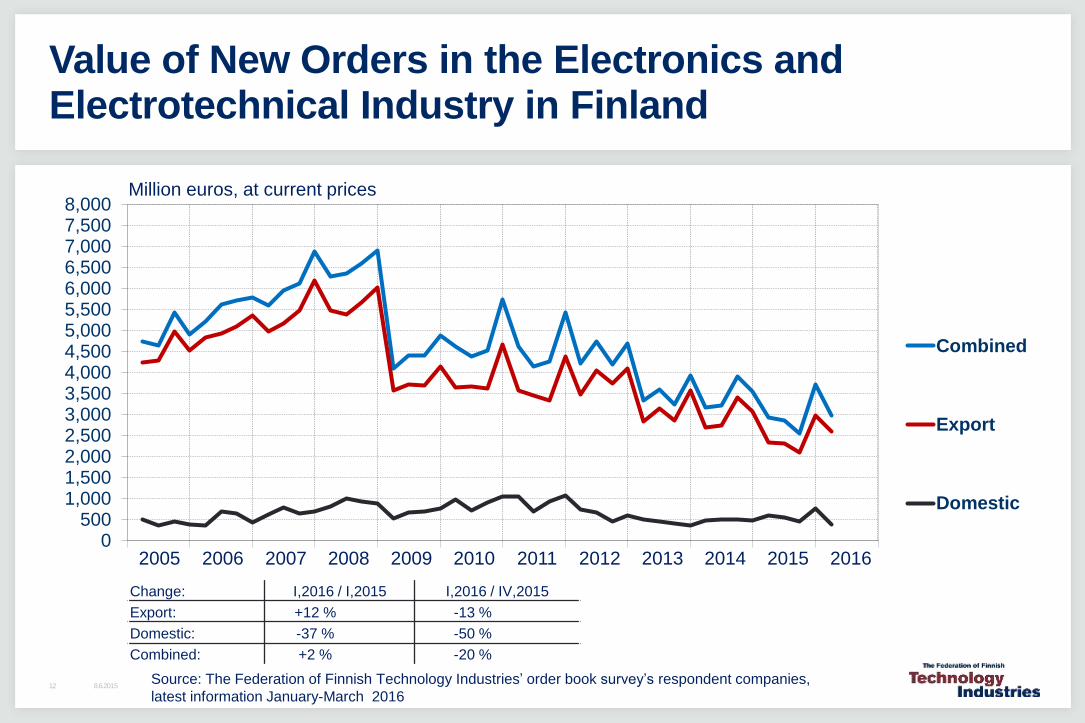
Value of New Orders in the Electronics and Electrotechnical Industry in Finland
0500
1,0001,5002,0002,5003,0003,5004,0004,5005,0005,5006,0006,5007,0007,5008,000
Combined
Export
Domestic
Million euros, at current prices
2005 2006 2007 2008 2009 2010 2011 2012 2013 2014 2015 2016
Change: I,2016 / I,2015 I,2016 / IV,2015
Export: +12 % -13 %
Domestic: -37 % -50 %
Combined: +2 % -20 %
Source: The Federation of Finnish Technology Industries’ order book survey’s respondent companies,
latest information January-March 2016
8.6.201513
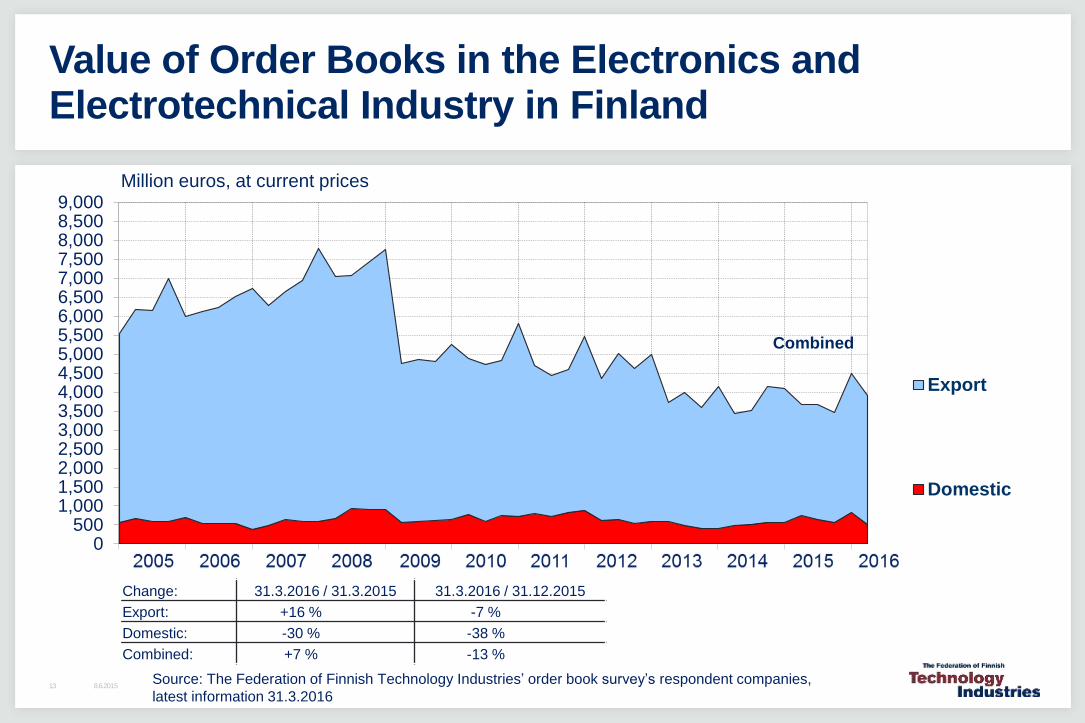
Value of Order Books in the Electronics and Electrotechnical Industry in Finland
0500
1,0001,5002,0002,5003,0003,5004,0004,5005,0005,5006,0006,5007,0007,5008,0008,5009,000
Export
Domestic
Combined
Million euros, at current prices
Change: 31.3.2016 / 31.3.2015 31.3.2016 / 31.12.2015
Export: +16 % -7 %
Domestic: -30 % -38 %
Combined: +7 % -13 %
Source: The Federation of Finnish Technology Industries’ order book survey’s respondent companies,
latest information 31.3.2016
8.6.201514
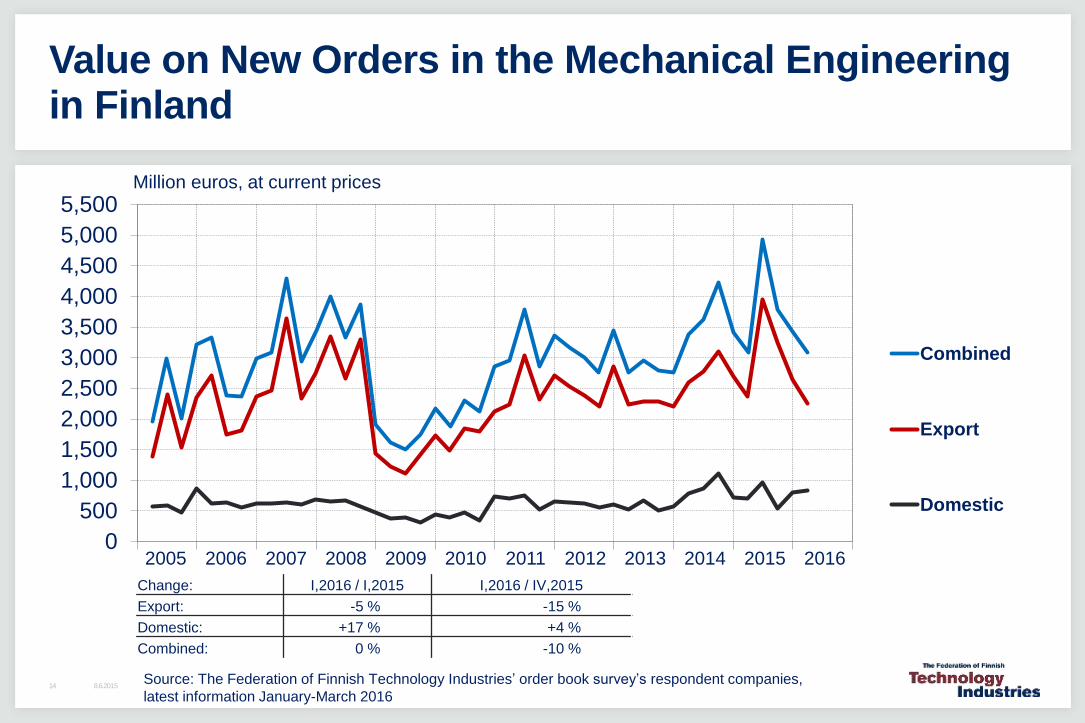
Value on New Orders in the Mechanical Engineering in Finland
0
500
1,000
1,500
2,000
2,500
3,000
3,500
4,000
4,500
5,000
5,500
Combined
Export
Domestic
Million euros, at current prices
Change: I,2016 / I,2015 I,2016 / IV,2015
Export: -5 % -15 %
Domestic: +17 % +4 %
Combined: 0 % -10 %
Source: The Federation of Finnish Technology Industries’ order book survey’s respondent companies,
latest information January-March 2016
2005 2006 2007 2008 2009 2010 2011 2012 2013 2014 2015 2016
8.6.201515
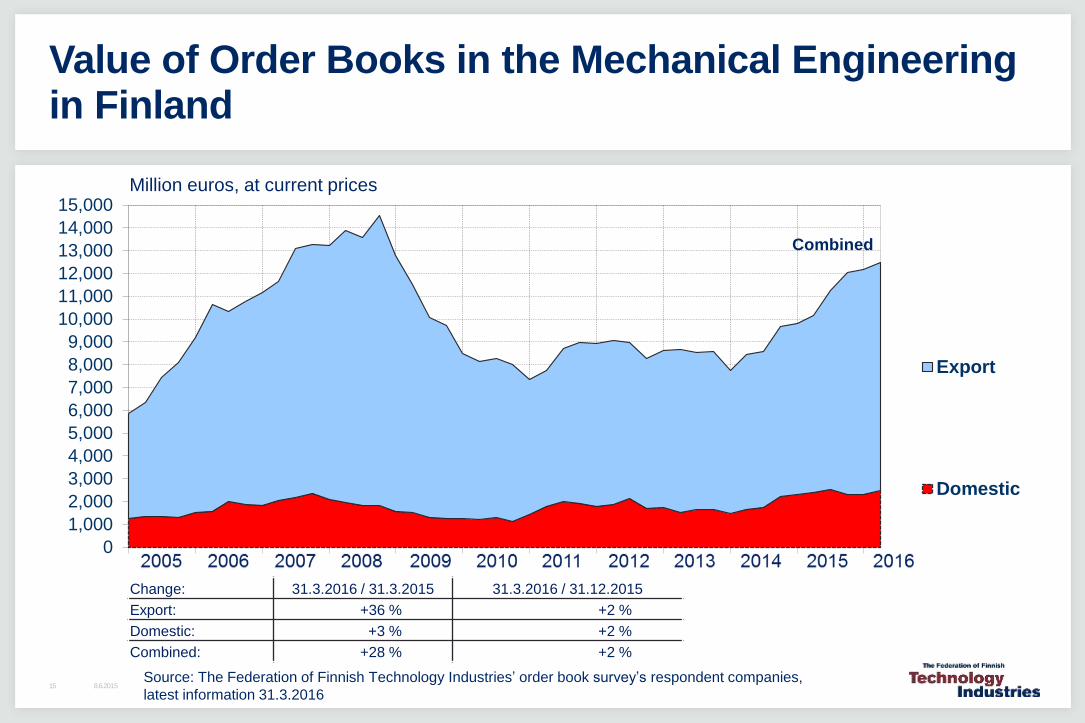
Value of Order Books in the Mechanical Engineering in Finland
0
1,000
2,000
3,000
4,000
5,000
6,000
7,000
8,000
9,000
10,000
11,000
12,000
13,000
14,000
15,000
Export
Domestic
Combined
Million euros, at current prices
Change: 31.3.2016 / 31.3.2015 31.3.2016 / 31.12.2015
Export: +36 % +2 %
Domestic: +3 % +2 %
Combined: +28 % +2 %
Source: The Federation of Finnish Technology Industries’ order book survey’s respondent companies,
latest information 31.3.2016
8.6.201516
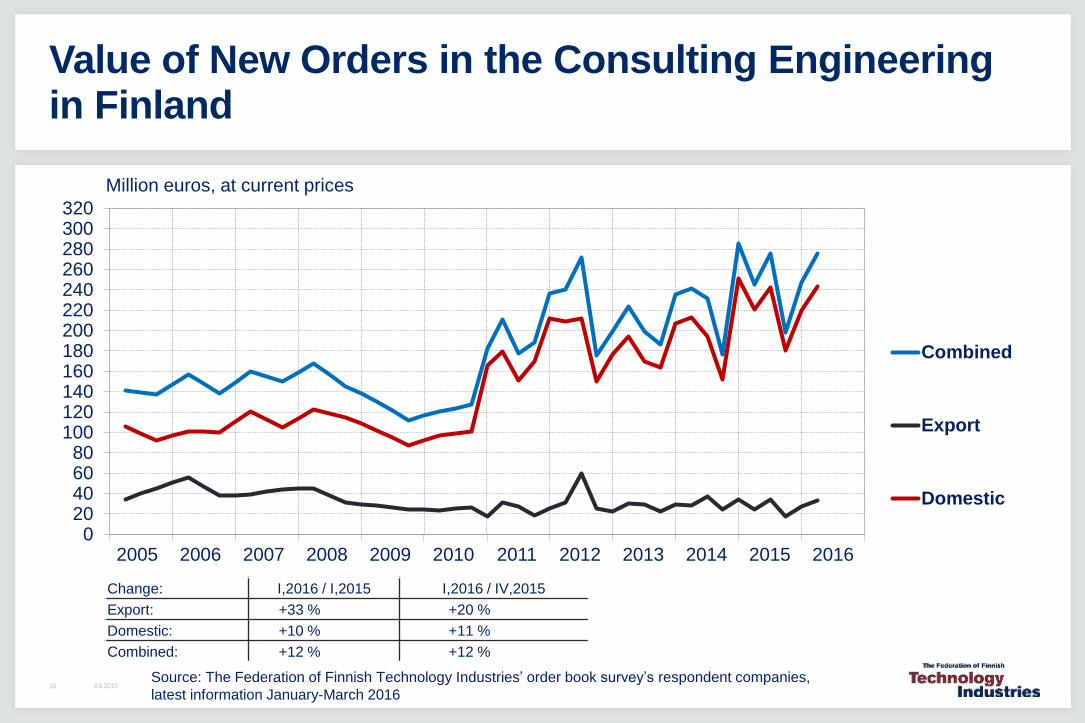
Value of New Orders in the Consulting Engineering in Finland
020406080
100120140160180200220240260280300320
Combined
Export
Domestic
Million euros, at current prices
2005 2006 2007 2008 2009 2010 2011 2012 2013 2014 2015 2016
Change: I,2016 / I,2015 I,2016 / IV,2015
Export: +33 % +20 %
Domestic: +10 % +11 %
Combined: +12 % +12 %
Source: The Federation of Finnish Technology Industries’ order book survey’s respondent companies,
latest information January-March 2016
8.6.201517
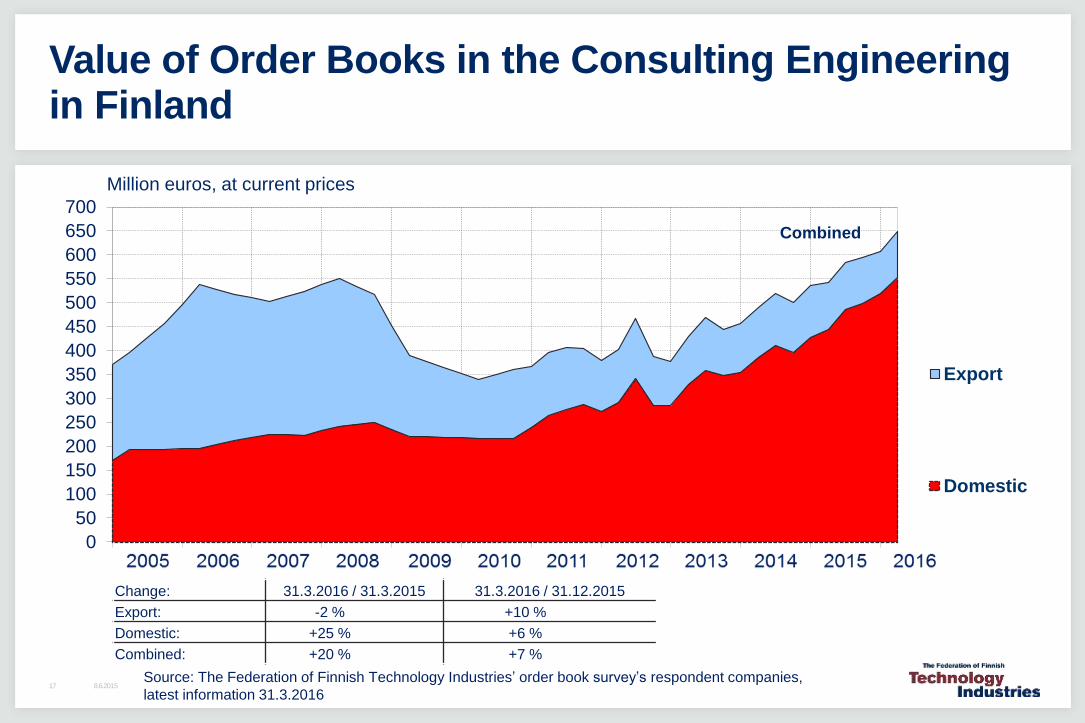
Value of Order Books in the Consulting Engineering in Finland
0
50
100
150
200
250
300
350
400
450
500
550
600
650
700
Export
Domestic
Combined
Million euros, at current prices
Source: The Federation of Finnish Technology Industries’ order book survey’s respondent companies,
latest information 31.3.2016
Change: 31.3.2016 / 31.3.2015 31.3.2016 / 31.12.2015
Export: -2 % +10 %
Domestic: +25 % +6 %
Combined: +20 % +7 %
8.6.201518
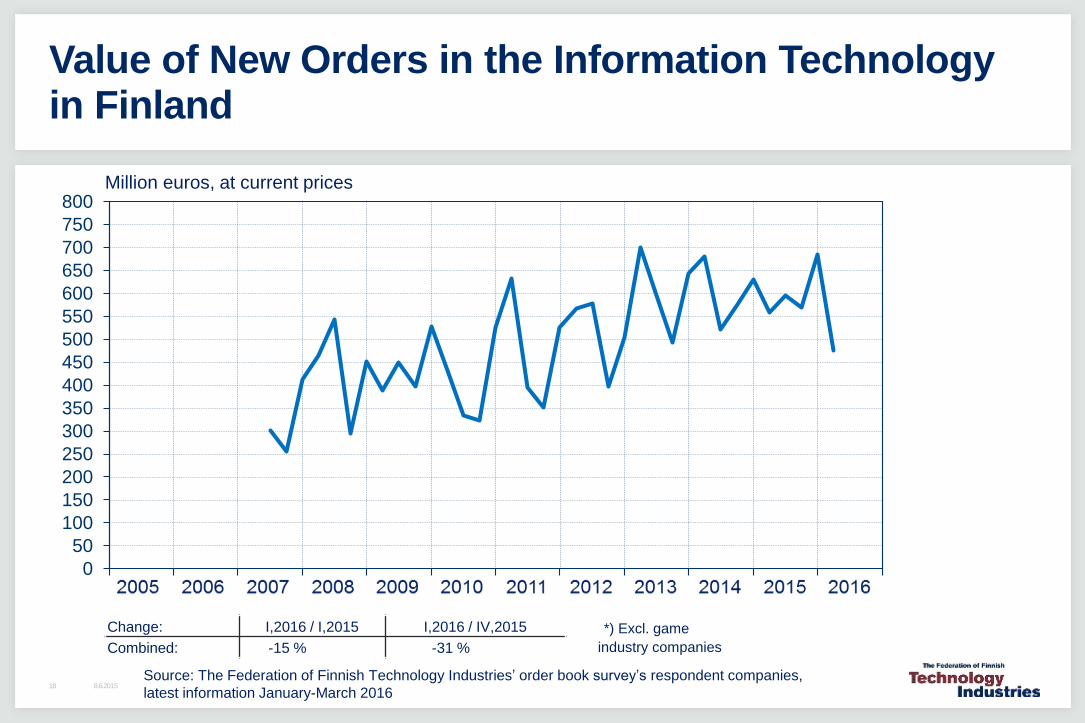
Value of New Orders in the Information Technology in Finland
0
50
100
150
200
250
300
350
400
450
500
550
600
650
700
750
800Million euros, at current prices
Change: I,2016 / I,2015 I,2016 / IV,2015
Combined: -15 % -31 %
Source: The Federation of Finnish Technology Industries’ order book survey’s respondent companies,
latest information January-March 2016
*) Excl. game
industry companies
8.6.201519
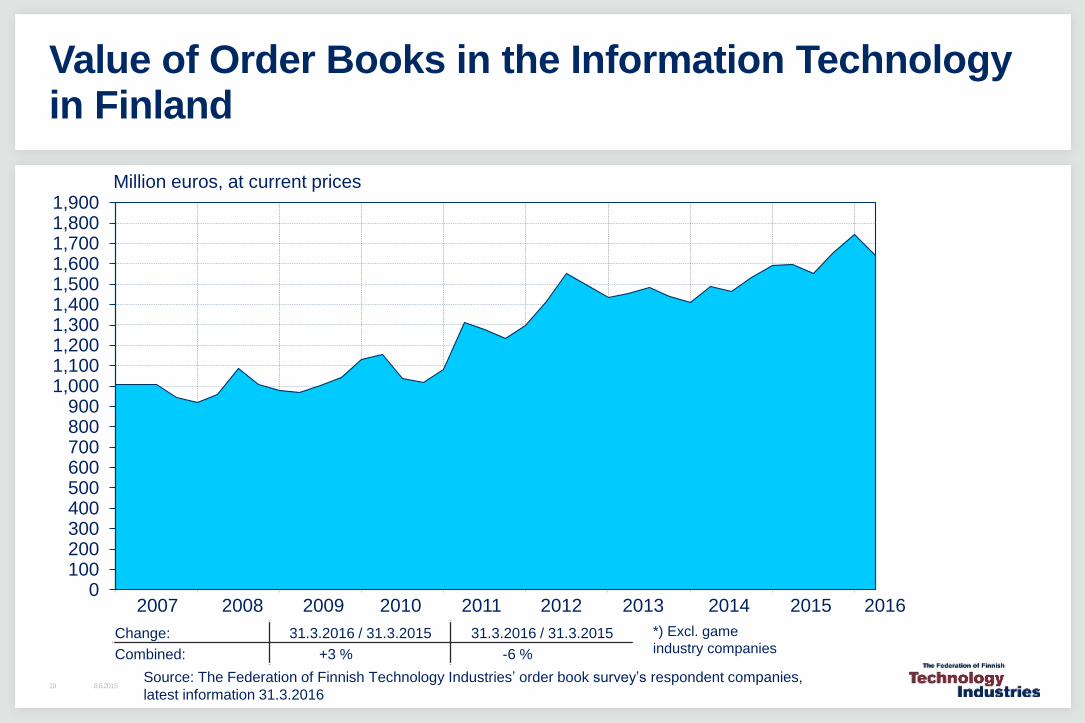
Value of Order Books in the Information Technology in Finland
0100200300400500600700800900
1,0001,1001,2001,3001,4001,5001,6001,7001,8001,900
Million euros, at current prices
Change: 31.3.2016 / 31.3.2015 31.3.2016 / 31.3.2015
Combined: +3 % -6 %
Source: The Federation of Finnish Technology Industries’ order book survey’s respondent companies,
latest information 31.3.2016
*) Excl. game
industry companies
2007 2008 2009 2010 2011 2012 2013 2014 2015 2016
30.7.201520
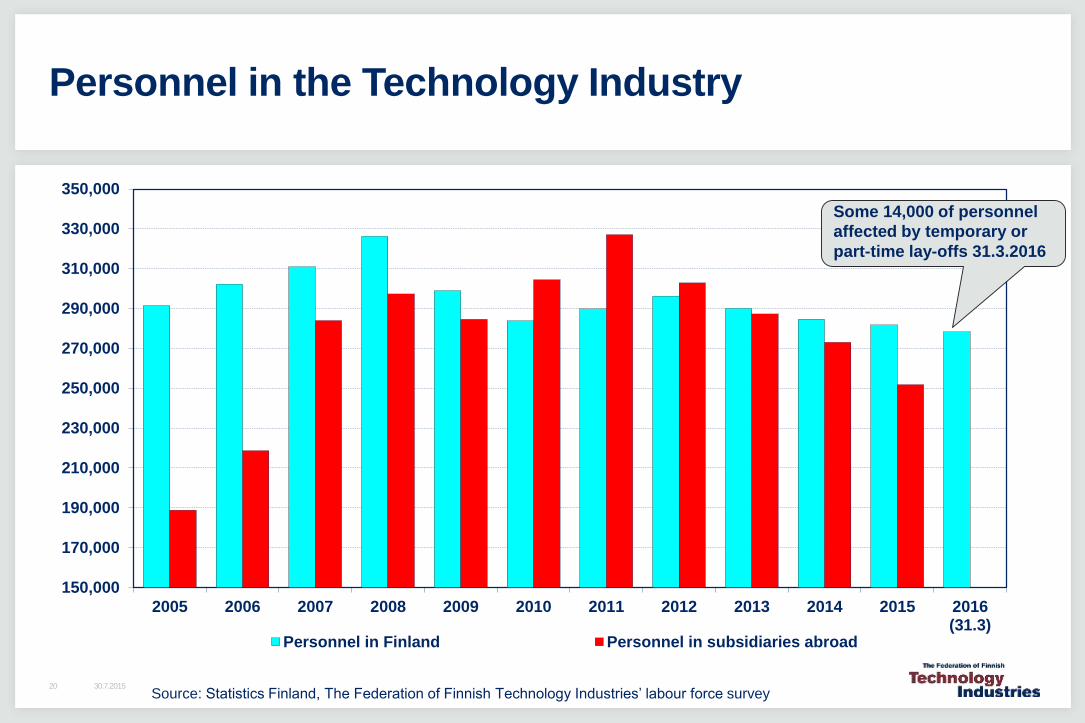
Personnel in the Technology Industry
150,000
170,000
190,000
210,000
230,000
250,000
270,000
290,000
310,000
330,000
350,000
2005 2006 2007 2008 2009 2010 2011 2012 2013 2014 2015 2016(31.3)
Personnel in Finland Personnel in subsidiaries abroad
Source: Statistics Finland, The Federation of Finnish Technology Industries’ labour force survey
Some 14,000 of personnel
affected by temporary or
part-time lay-offs 31.3.2016
7.5.201521
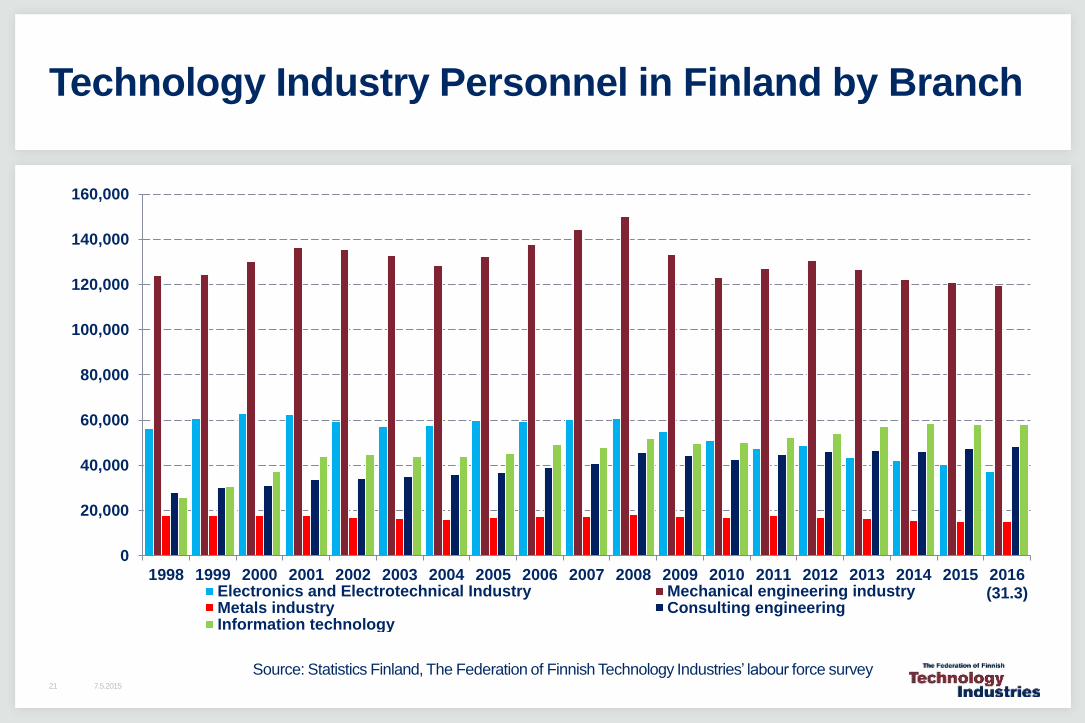
Technology Industry Personnel in Finland by Branch
0
20,000
40,000
60,000
80,000
100,000
120,000
140,000
160,000
1998 1999 2000 2001 2002 2003 2004 2005 2006 2007 2008 2009 2010 2011 2012 2013 2014 2015 2016(31.3)Electronics and Electrotechnical Industry Mechanical engineering industry
Metals industry Consulting engineeringInformation technology
Source: Statistics Finland, The Federation of Finnish Technology Industries’ labour force survey
7.5.201522
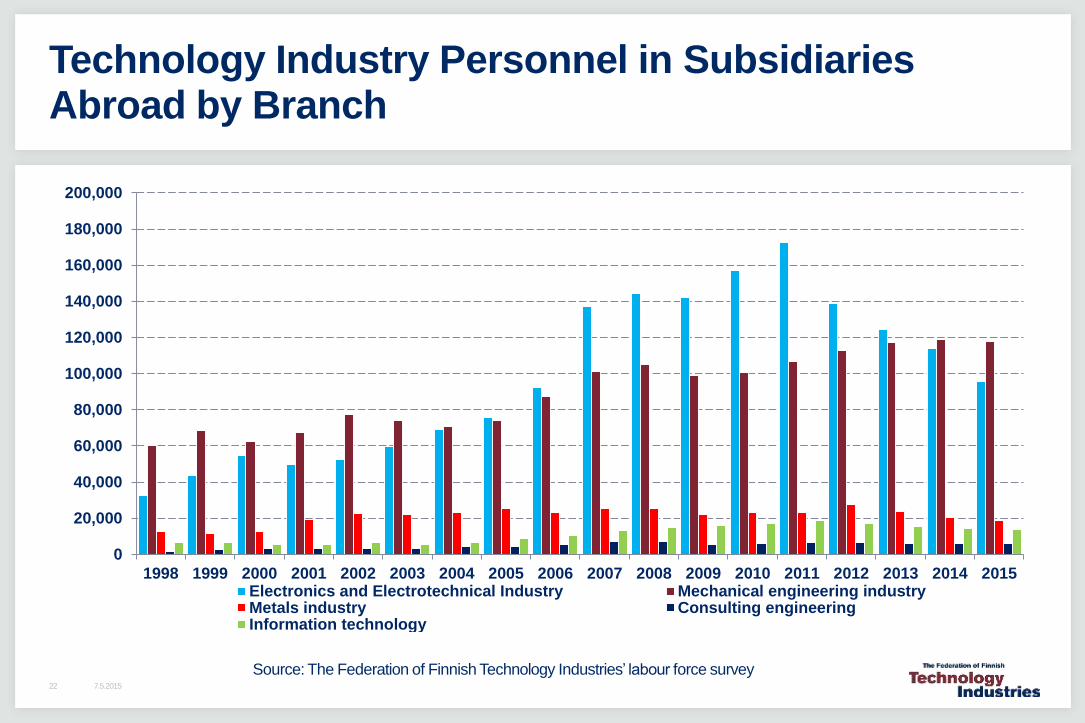
Technology Industry Personnel in SubsidiariesAbroad by Branch
0
20,000
40,000
60,000
80,000
100,000
120,000
140,000
160,000
180,000
200,000
1998 1999 2000 2001 2002 2003 2004 2005 2006 2007 2008 2009 2010 2011 2012 2013 2014 2015Electronics and Electrotechnical Industry Mechanical engineering industryMetals industry Consulting engineeringInformation technology
Source: The Federation of Finnish Technology Industries’ labour force survey
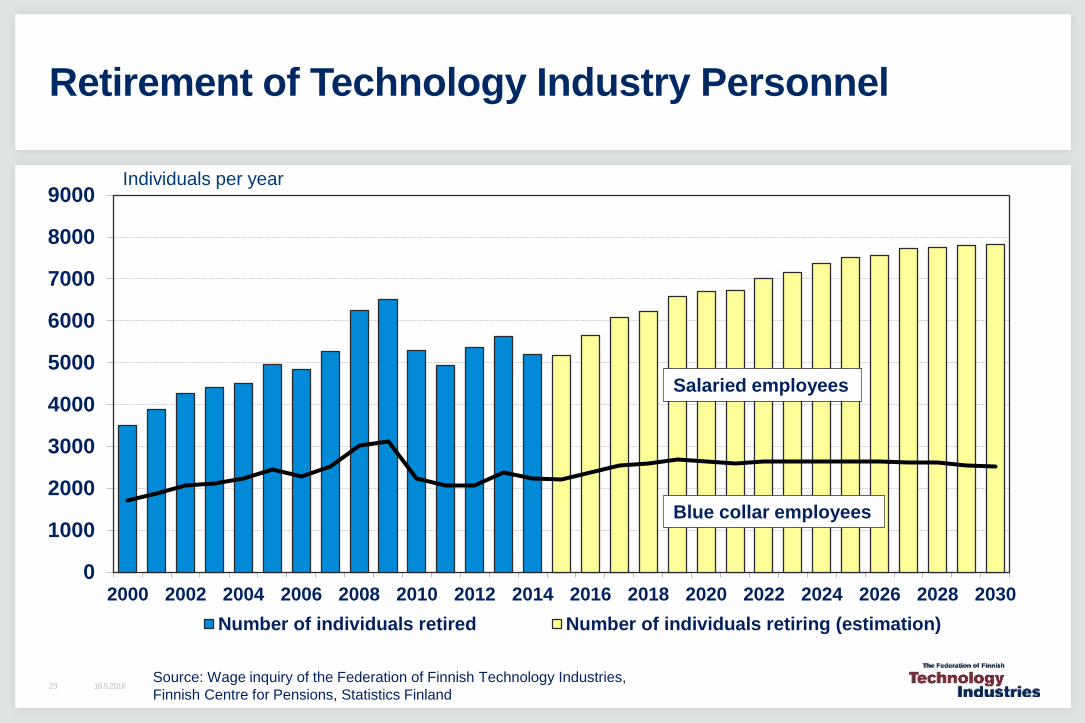
Retirement of Technology Industry Personnel
0
1000
2000
3000
4000
5000
6000
7000
8000
9000
2000 2002 2004 2006 2008 2010 2012 2014 2016 2018 2020 2022 2024 2026 2028 2030
Number of individuals retired Number of individuals retiring (estimation)
Source: Wage inquiry of the Federation of Finnish Technology Industries,
Finnish Centre for Pensions, Statistics Finland
Individuals per year
Salaried employees
Blue collar employees
16.5.201623
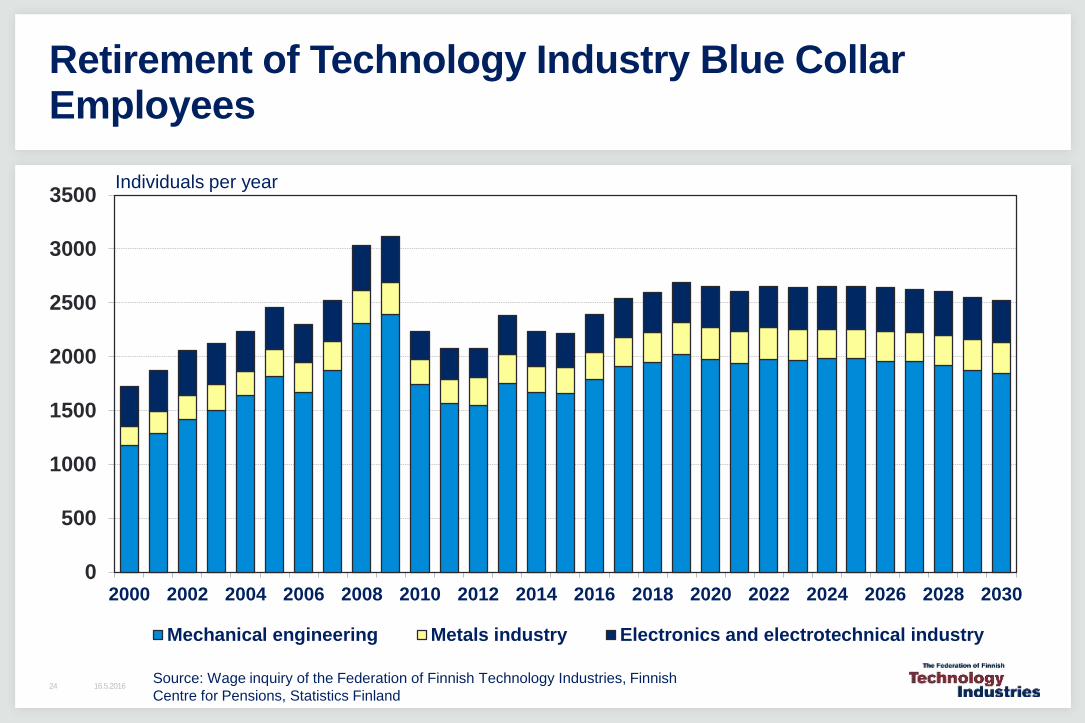
Retirement of Technology Industry Blue Collar Employees
0
500
1000
1500
2000
2500
3000
3500
2000 2002 2004 2006 2008 2010 2012 2014 2016 2018 2020 2022 2024 2026 2028 2030
Mechanical engineering Metals industry Electronics and electrotechnical industry
Source: Wage inquiry of the Federation of Finnish Technology Industries, Finnish
Centre for Pensions, Statistics Finland
Individuals per year
16.5.201624
- Finland is in the grip of structural change. Development remains uneven between
companies.
- Turnover in Finland lowered slihtly in 2015 compared to the year 2014. Turnover totalled
EUR 66 billion. In the pre-crisis year 2008 it was EUR 86 billion.
- The monetary value of new orders reported between January-March 2016 was at the
same level than in the corresponding period in 2015, but 16 % lower than in the preceding
quarter.
- At the end of March, the value of order books was 17 % higher year-on-year, but 2 %
lower the value reported at the end of December.
- The turnover of technology industry companies in the spring of 2016 is expected to
remain at the same level or a slightly lower level as in the corresponding period last year.
- Since 2008, personnel numbers in Finland have shrunk by 48,000 employees, totalling
on average 278,000 at the end of March 2016.
Economic Outlook in the Technology Industry
16.5.201625

Outlook in the Global Economy is Uncertain
16.5.201626
16.5.201627
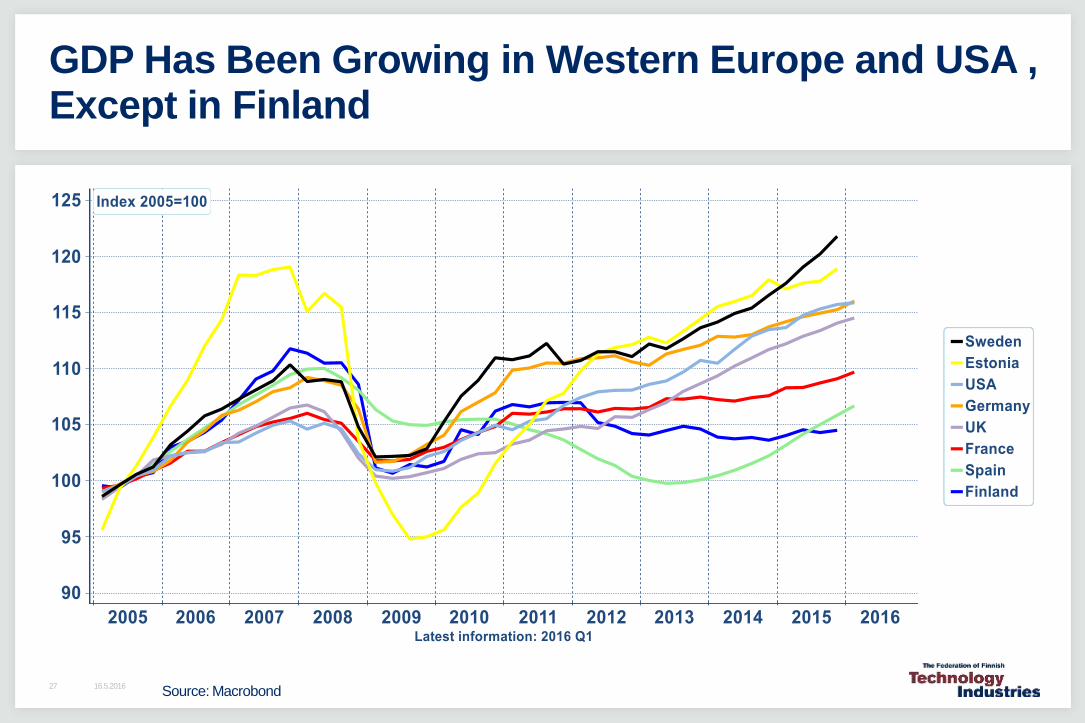
GDP Has Been Growing in Western Europe and USA , Except in Finland
Source: Macrobond
16.5.201628
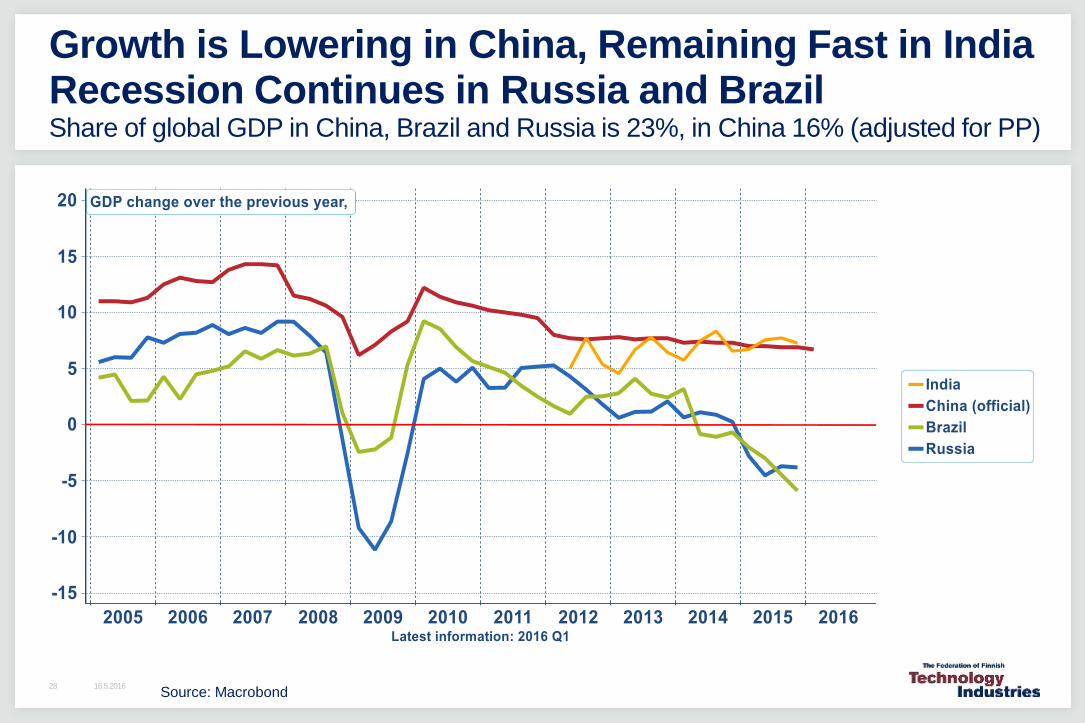
Growth is Lowering in China, Remaining Fast in IndiaRecession Continues in Russia and Brazil Share of global GDP in China, Brazil and Russia is 23%, in China 16% (adjusted for PP)
Source: Macrobond
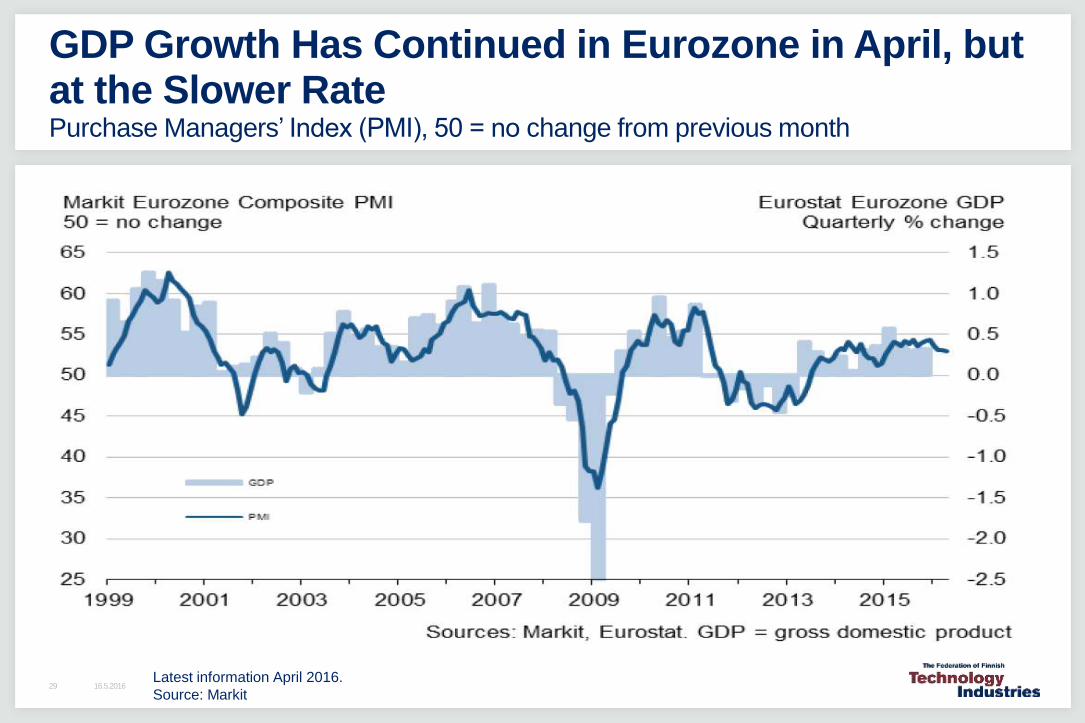
GDP Growth Has Continued in Eurozone in April, butat the Slower RatePurchase Managers’ Index (PMI), 50 = no change from previous month
Latest information April 2016.
Source: Markit 16.5.201629
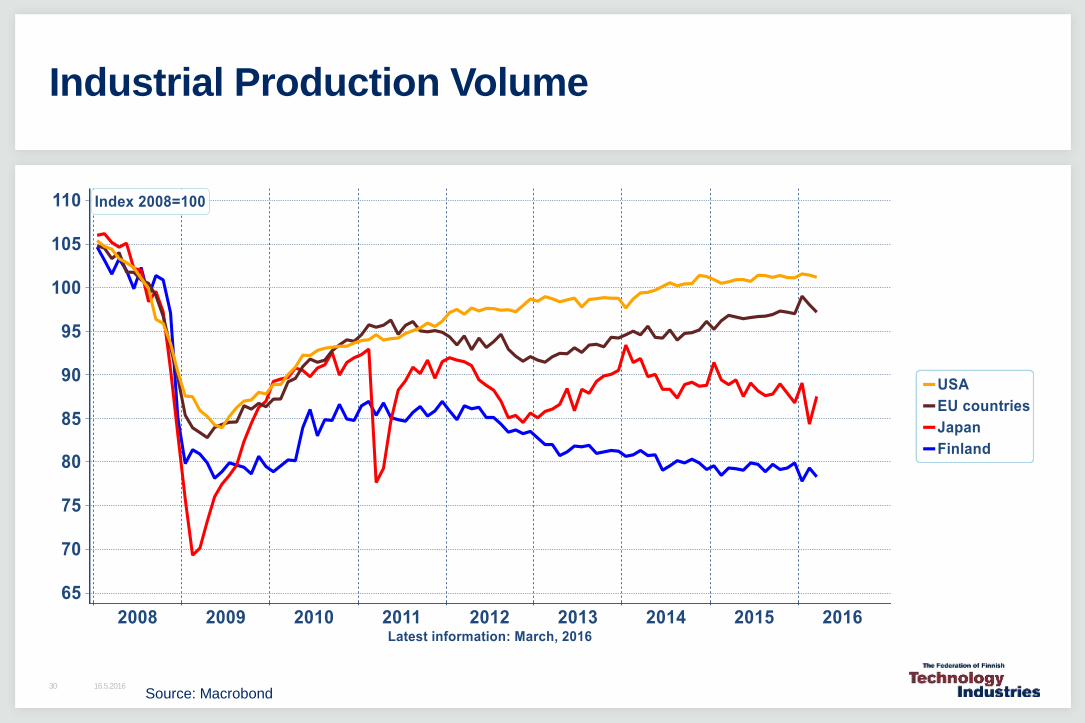
Industrial Production Volume
Source: Macrobond16.5.201630
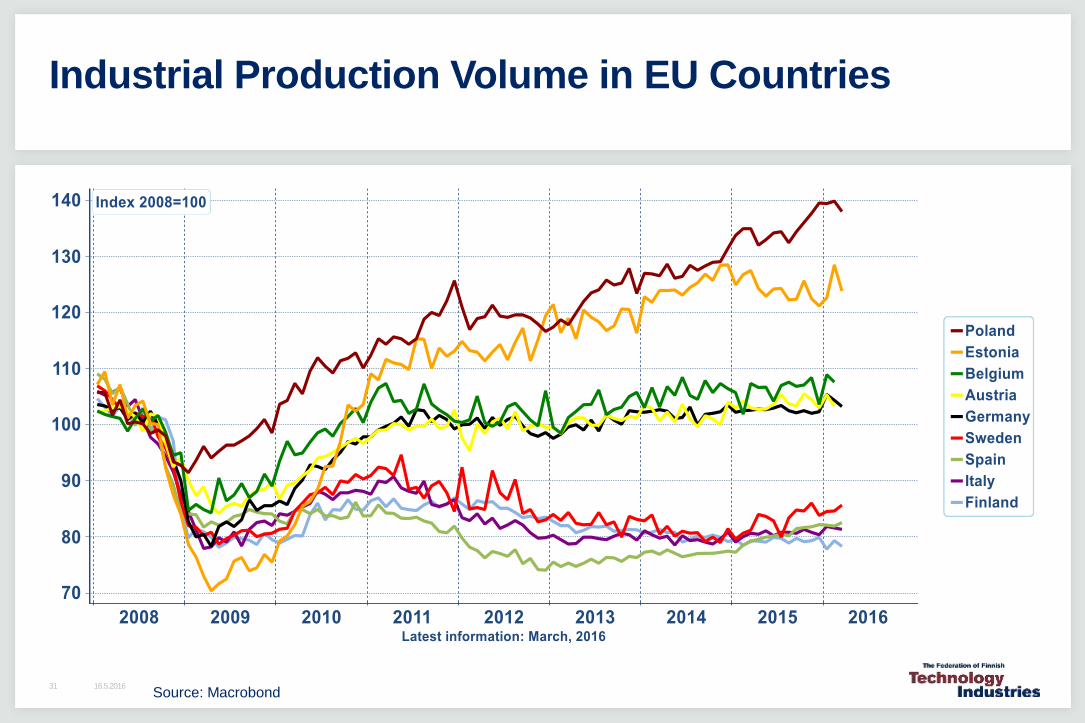
Industrial Production Volume in EU Countries
Source: Macrobond16.5.201631
16.5.201632
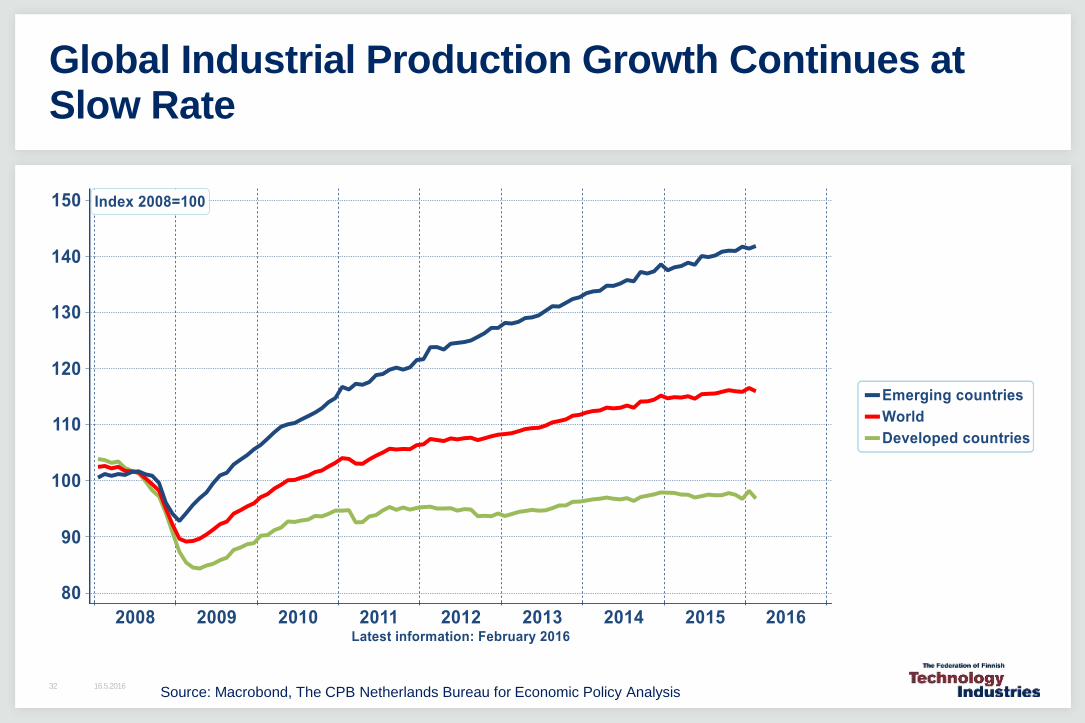
Global Industrial Production Growth Continues at Slow Rate
Source: Macrobond, The CPB Netherlands Bureau for Economic Policy Analysis
16.5.201633
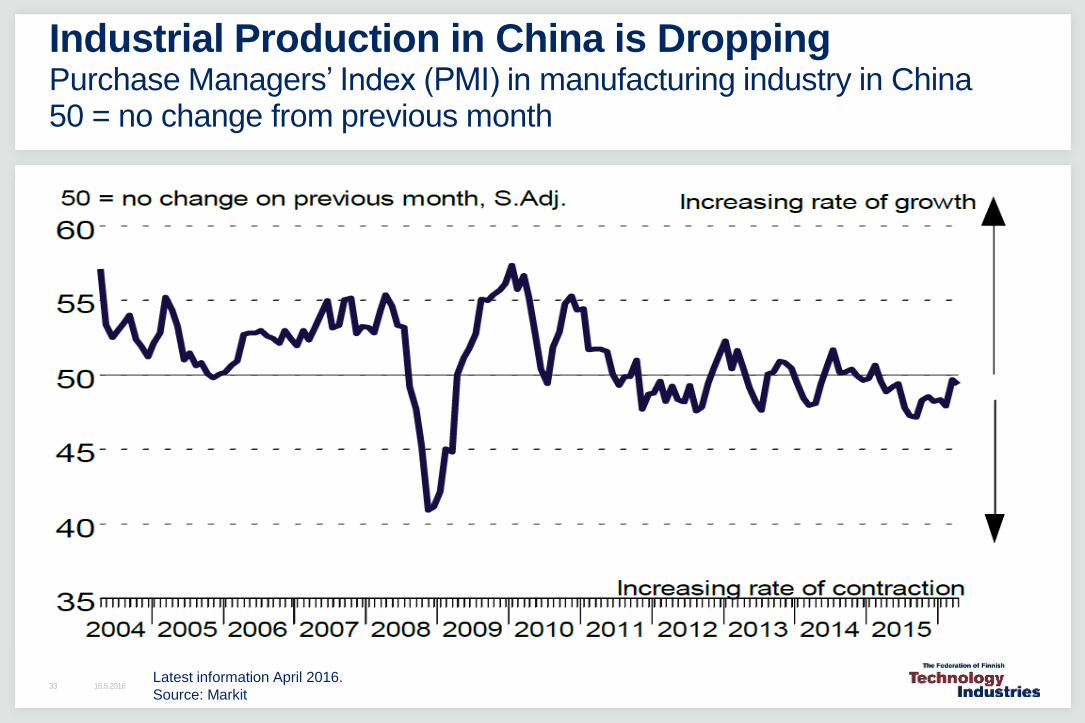
Industrial Production in China is DroppingPurchase Managers’ Index (PMI) in manufacturing industry in China50 = no change from previous month
Latest information April 2016.
Source: Markit
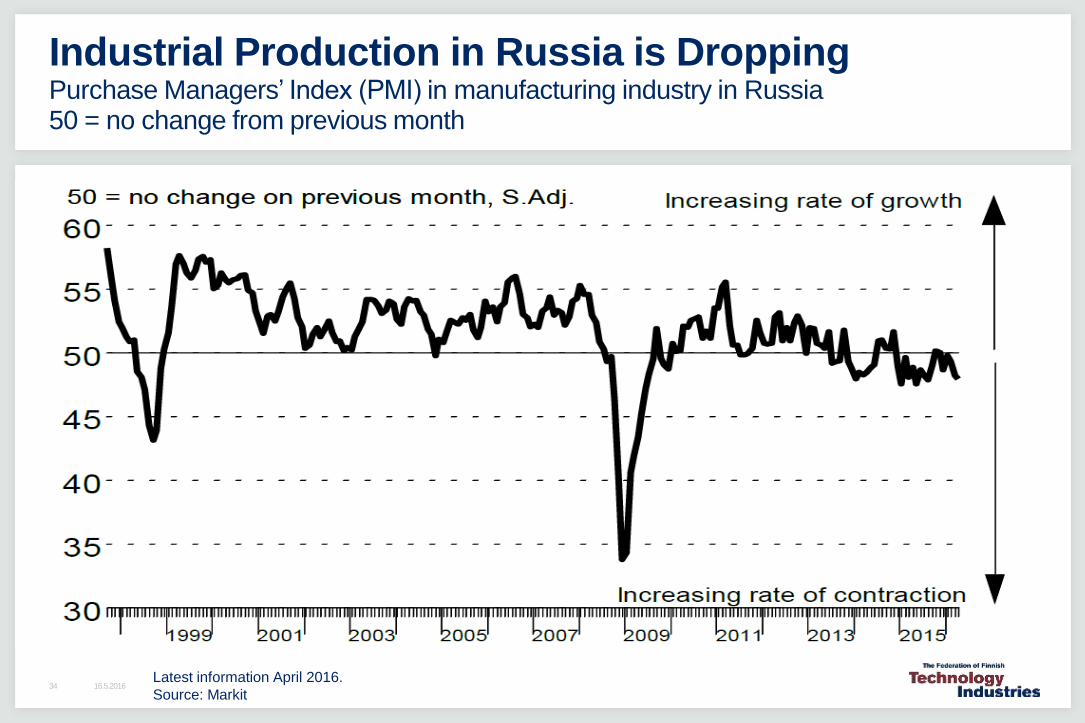
Industrial Production in Russia is DroppingPurchase Managers’ Index (PMI) in manufacturing industry in Russia50 = no change from previous month
Latest information April 2016.
Source: Markit 16.5.201634
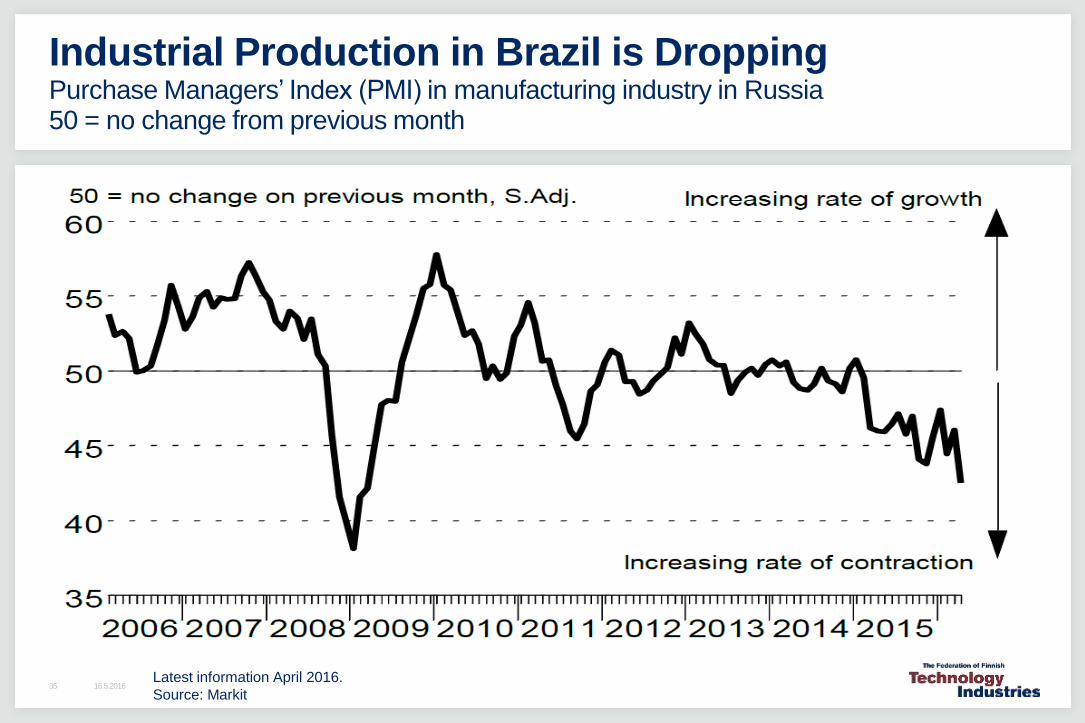
Industrial Production in Brazil is DroppingPurchase Managers’ Index (PMI) in manufacturing industry in Russia50 = no change from previous month
Latest information April 2016.
Source: Markit 16.5.201635
16.5.201636
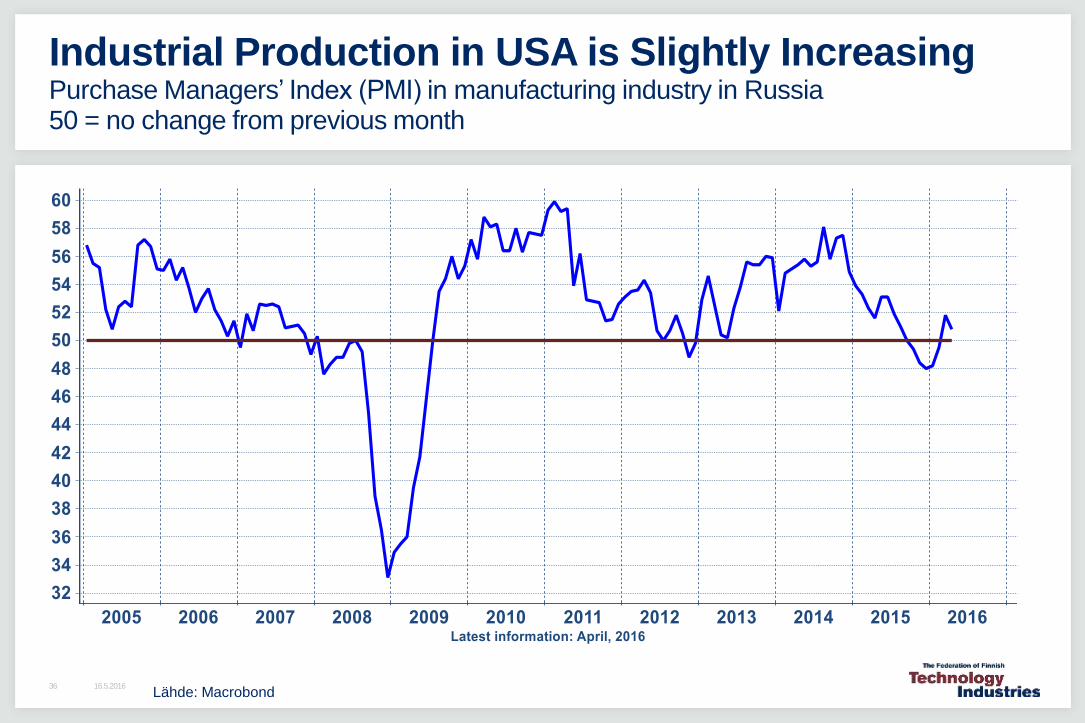
Industrial Production in USA is Slightly IncreasingPurchase Managers’ Index (PMI) in manufacturing industry in Russia50 = no change from previous month
Lähde: Macrobond
16.5.201637
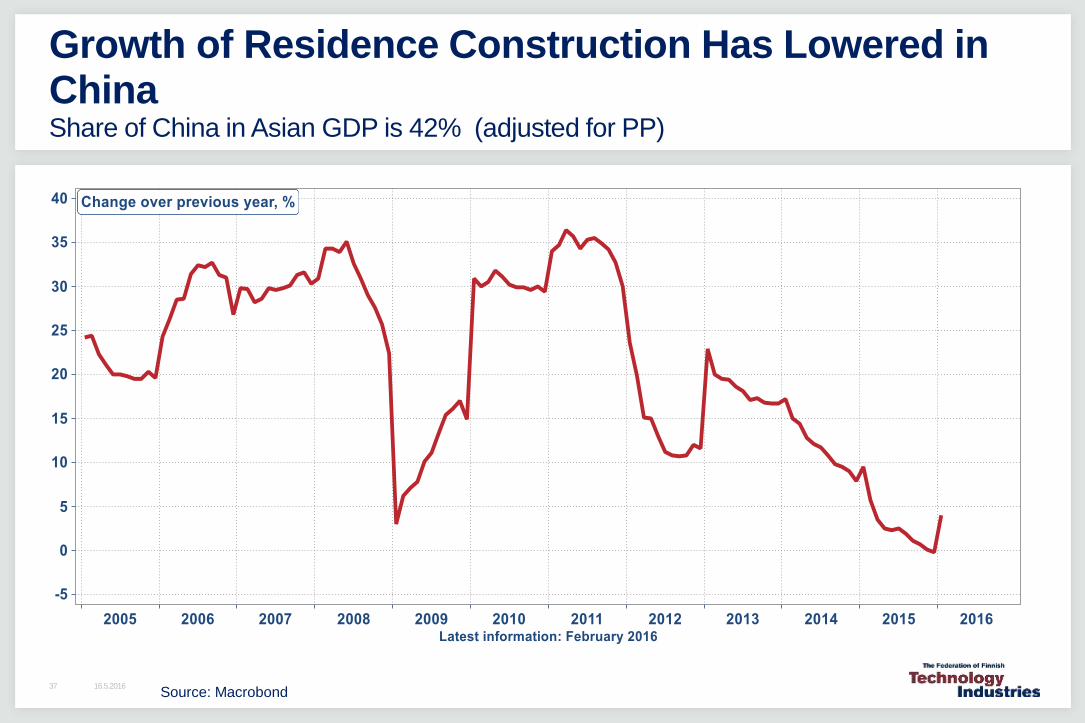
Growth of Residence Construction Has Lowered in China Share of China in Asian GDP is 42% (adjusted for PP)
Source: Macrobond
16.5.201638
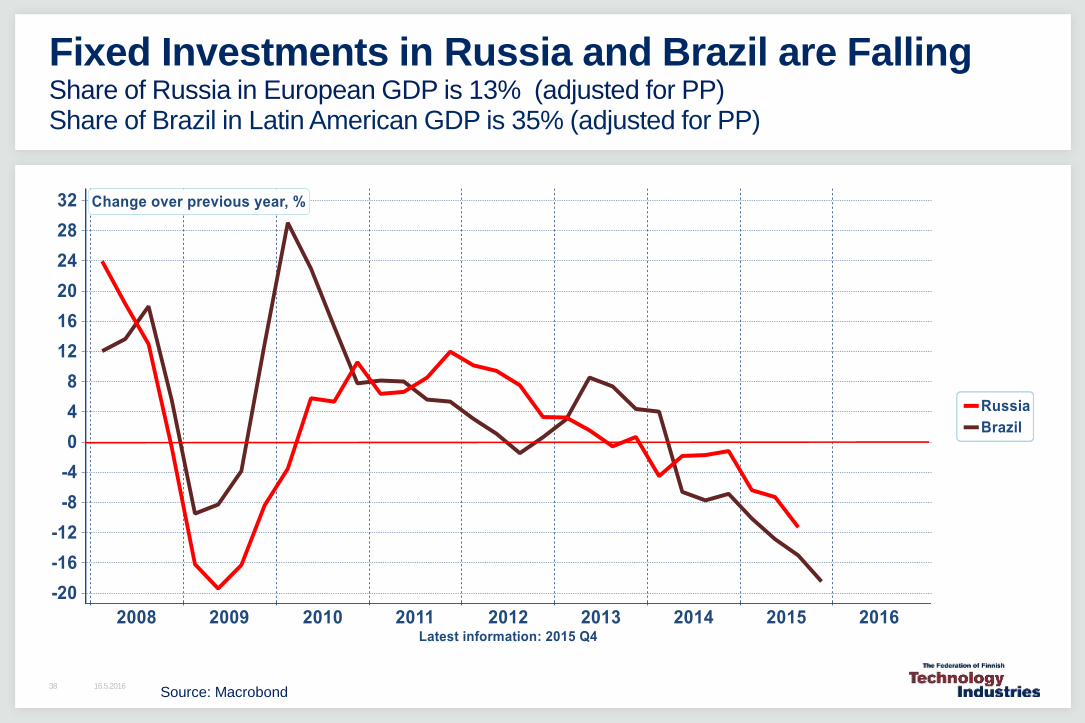
Fixed Investments in Russia and Brazil are FallingShare of Russia in European GDP is 13% (adjusted for PP)Share of Brazil in Latin American GDP is 35% (adjusted for PP)
Source: Macrobond
16.5.201639
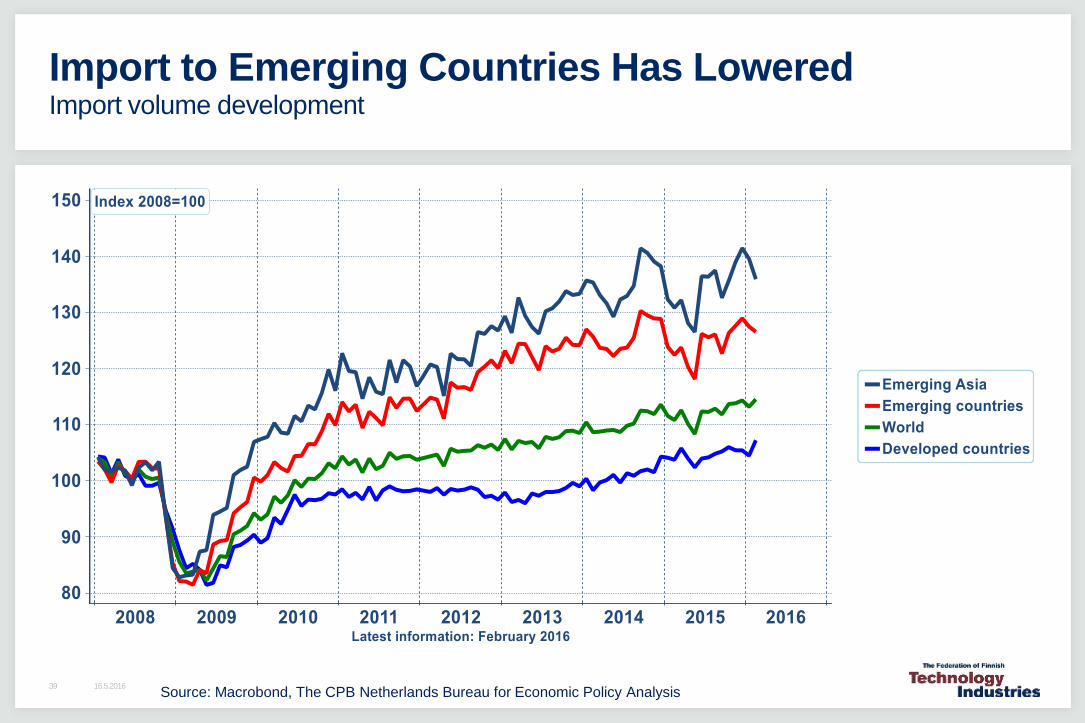
Import to Emerging Countries Has LoweredImport volume development
Source: Macrobond, The CPB Netherlands Bureau for Economic Policy Analysis
16.5.201640
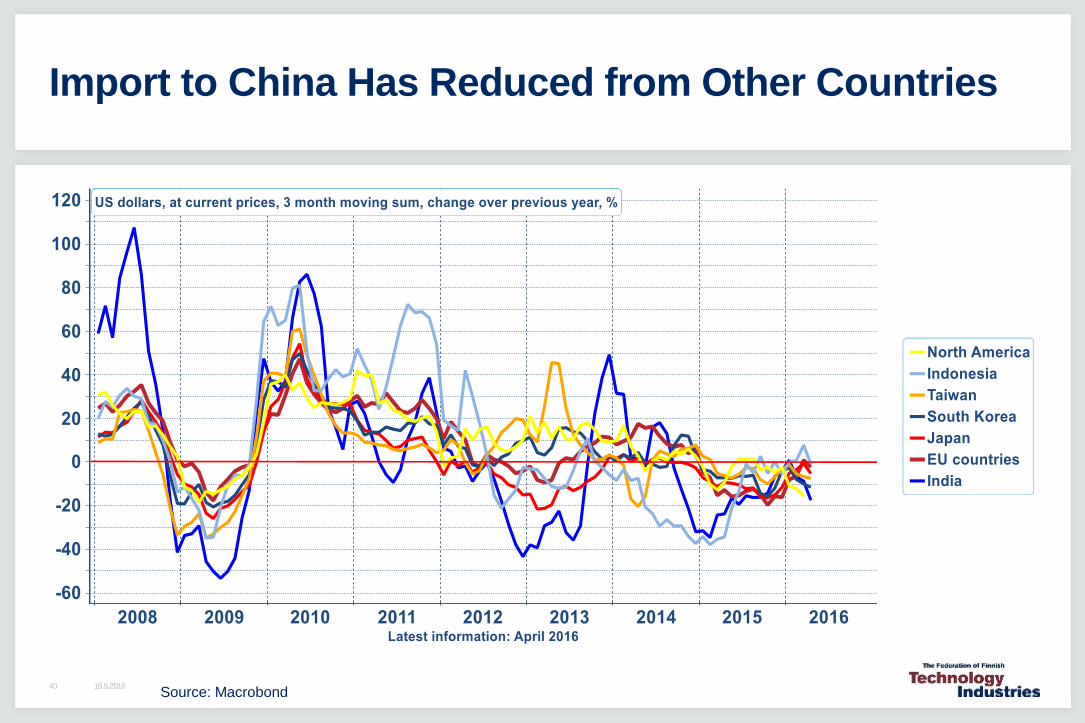
Import to China Has Reduced from Other Countries
Source: Macrobond
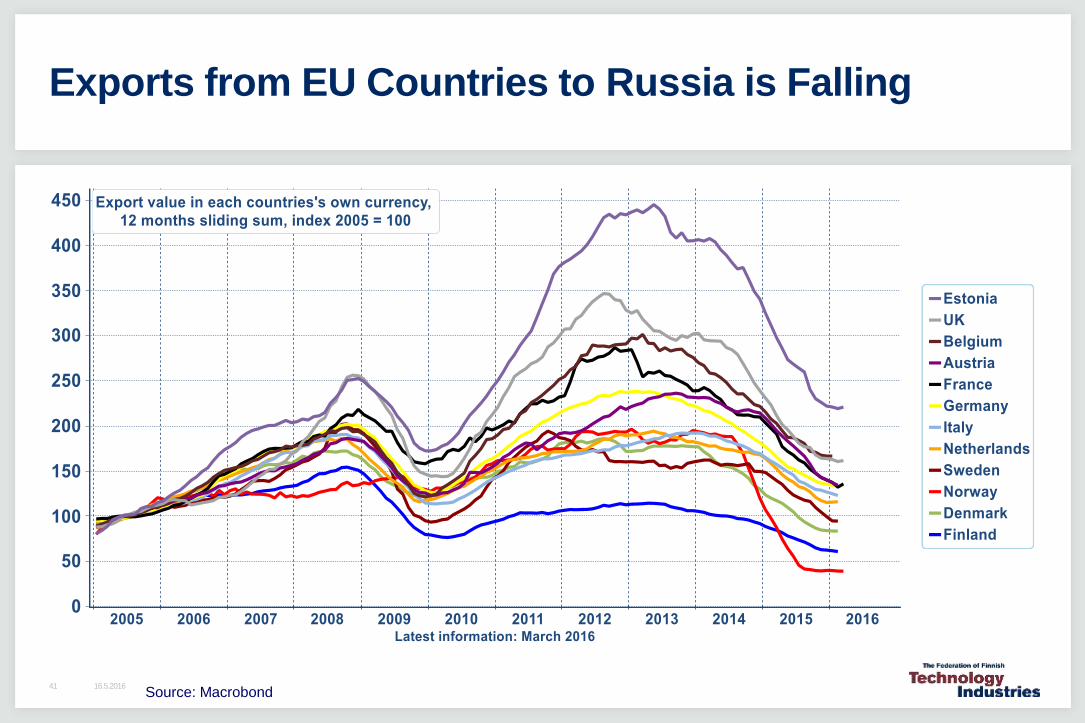
Exports from EU Countries to Russia is Falling
Source: Macrobond16.5.201641
02468
1012141618202224262830323436384042
197
5
197
6
197
7
197
8
197
9
198
0
198
1
198
2
198
3
198
4
198
5
198
6
198
7
198
8
198
9
199
0
199
1
199
2
199
3
199
4
199
5
199
6
199
7
199
8
199
9
200
0
200
1
200
2
200
3
200
4
200
5
200
6
200
7
200
8
200
9
201
0
201
1
201
2
201
3
201
4
201
5
16.5.2016
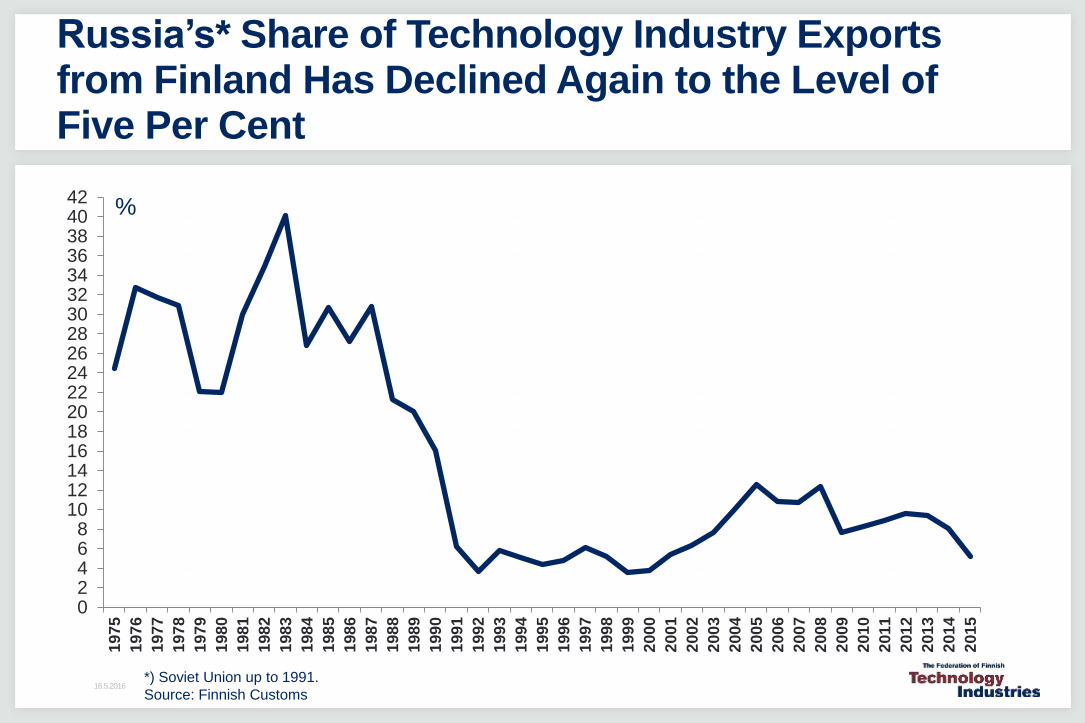
Russia’s* Share of Technology Industry Exportsfrom Finland Has Declined Again to the Level of Five Per Cent
%
*) Soviet Union up to 1991.
Source: Finnish Customs
16.5.201643
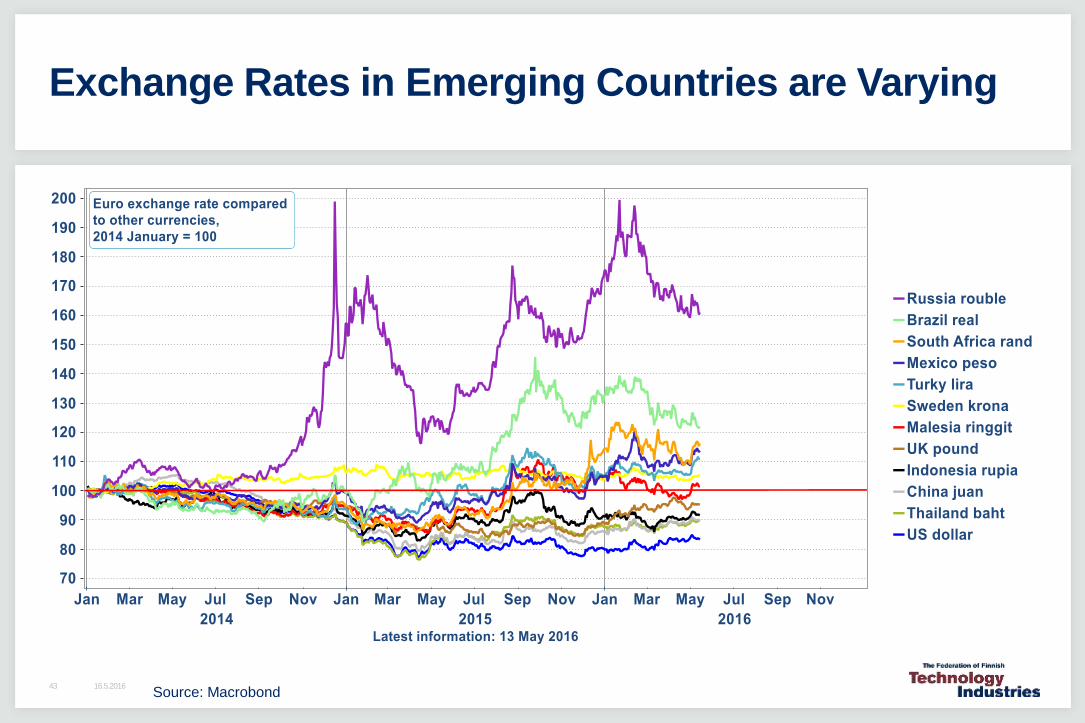
Exchange Rates in Emerging Countries are Varying
Source: Macrobond
16.5.2016
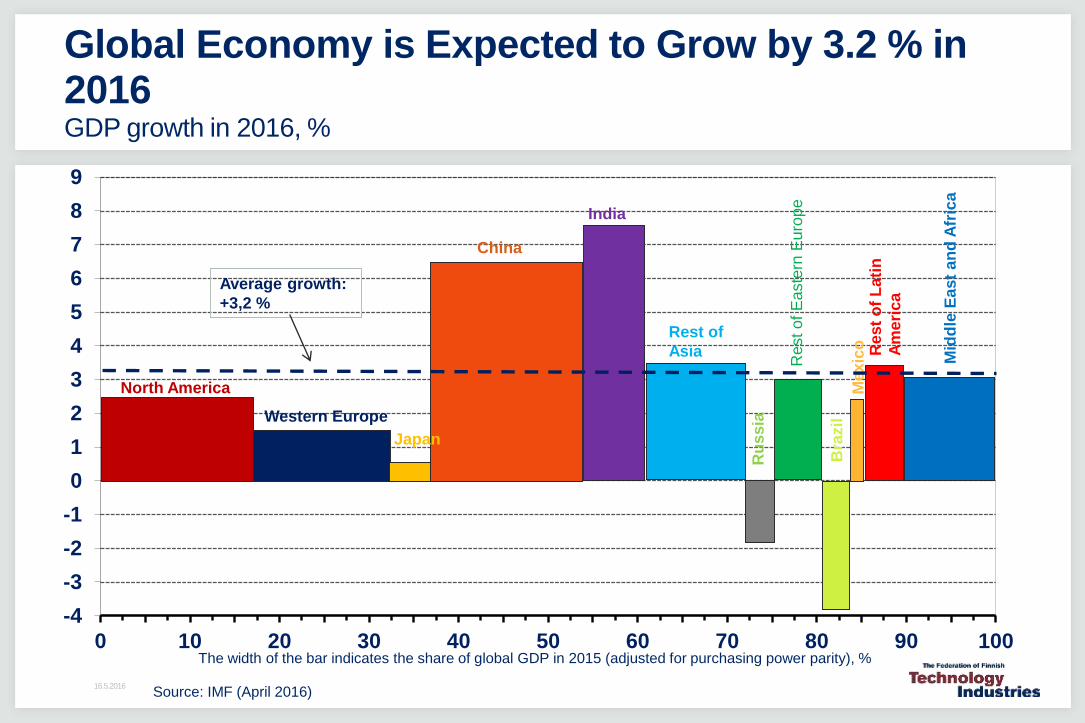
Global Economy is Expected to Grow by 3.2 % in 2016 GDP growth in 2016, %
Source: IMF (April 2016)
-4
-3
-2
-1
0
1
2
3
4
5
6
7
8
9
0 10 20 30 40 50 60 70 80 90 100
North America
Western Europe
Japan
China
India
Rest of
Asia
Restof
Easte
rn E
uro
pe
Ru
ssia
Bra
zil
Me
xic
o Rest
of
Lati
n
Am
eri
ca
Mid
dle
East
an
d A
fric
a
The width of the bar indicates the share of global GDP in 2015 (adjusted for purchasing power parity), %
Average growth:
+3,2 %
16.5.2016
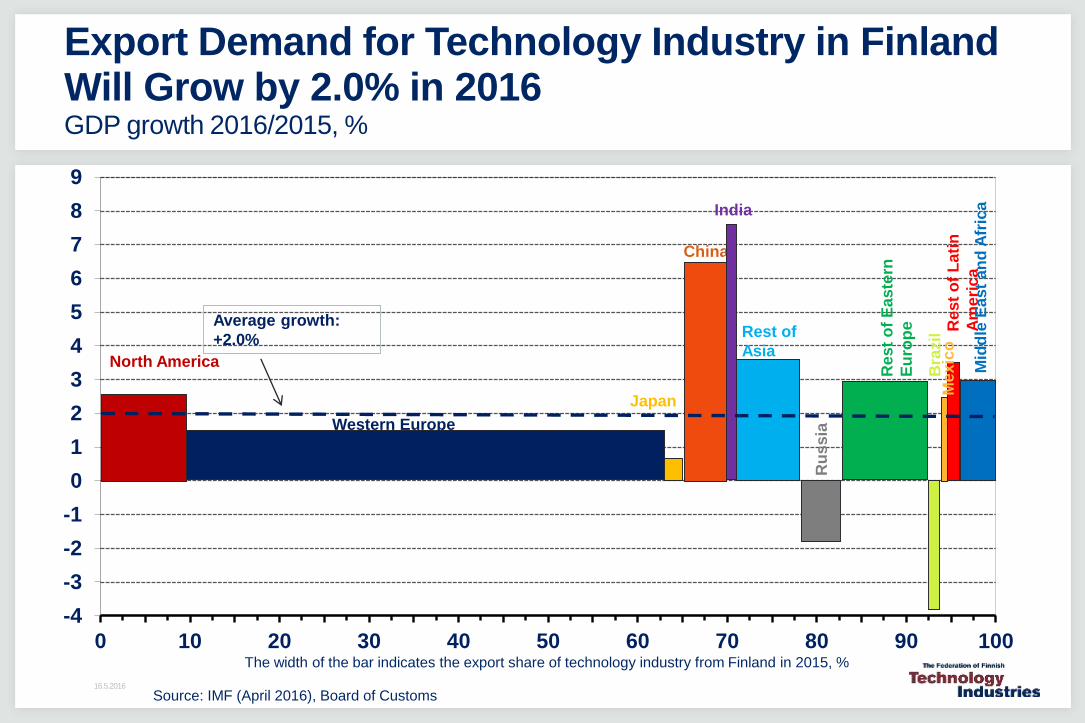
Export Demand for Technology Industry in Finland Will Grow by 2.0% in 2016 GDP growth 2016/2015, %
Source: IMF (April 2016), Board of Customs
-4
-3
-2
-1
0
1
2
3
4
5
6
7
8
9
0 10 20 30 40 50 60 70 80 90 100
North America
Western Europe
Japan
China
India
Rest of
Asia
Rest
of
Easte
rn
Eu
rop
e
Ru
ssia
Bra
zil
Mexic
oR
est
of
Lati
n
Am
eri
ca
Mid
dle
East
an
d A
fric
a
The width of the bar indicates the export share of technology industry from Finland in 2015, %
Average growth:
+2.0%
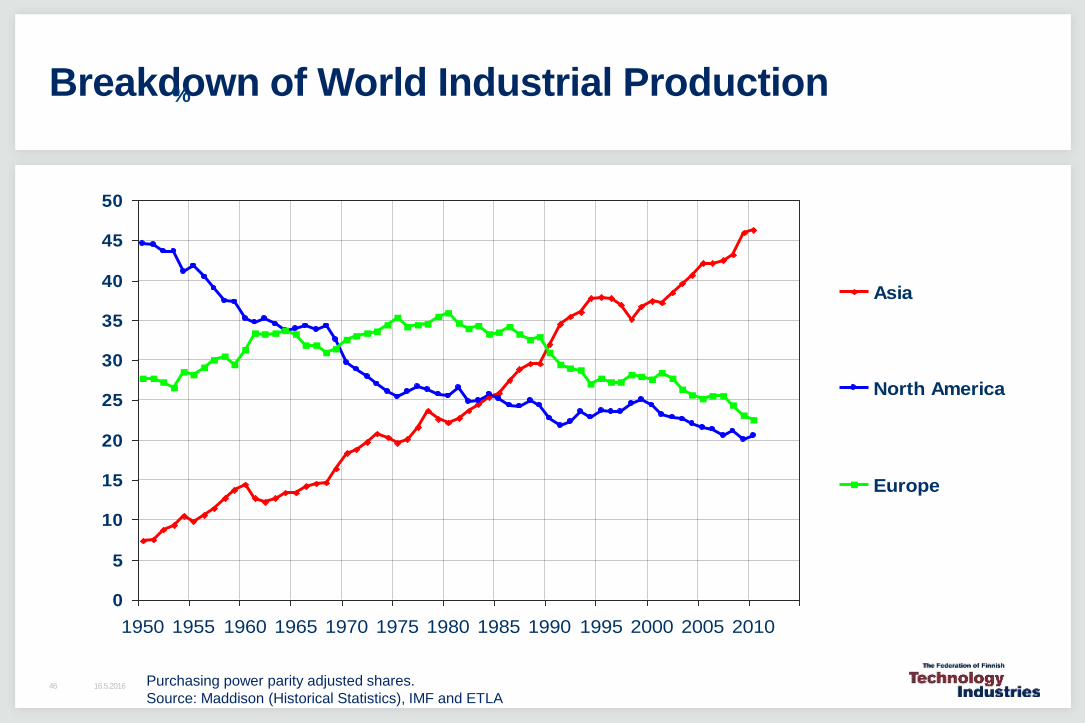
Breakdown of World Industrial Production
0
5
10
15
20
25
30
35
40
45
50
1950 1955 1960 1965 1970 1975 1980 1985 1990 1995 2000 2005 2010
Asia
North America
Europe
Purchasing power parity adjusted shares.
Source: Maddison (Historical Statistics), IMF and ETLA
%
16.5.201646
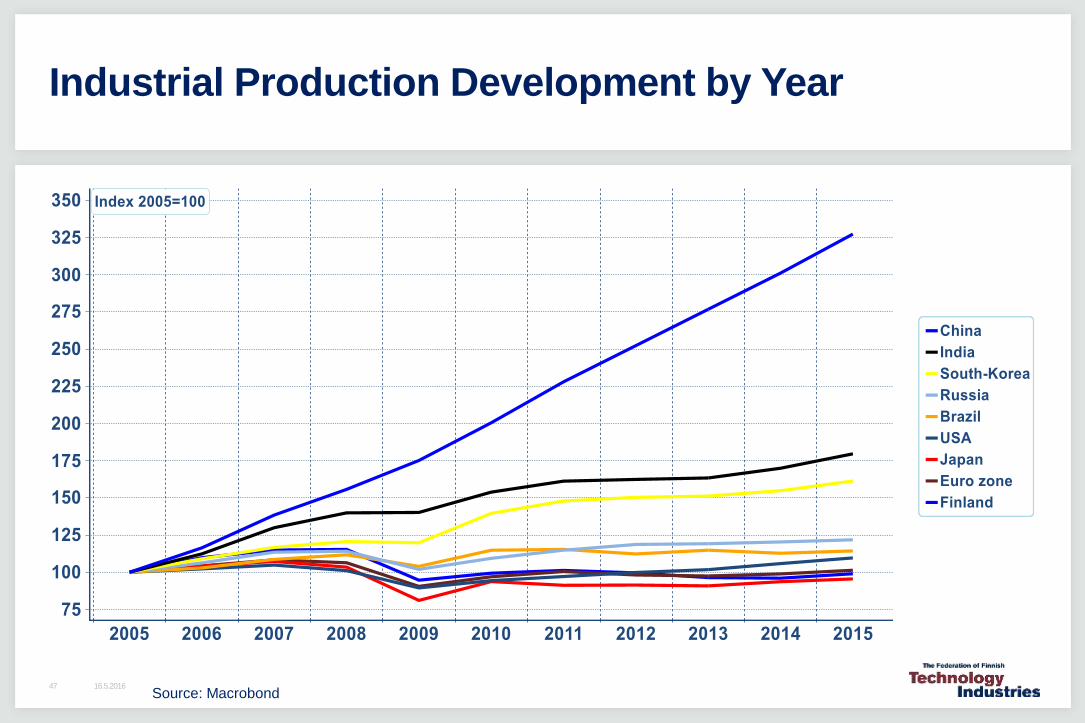
Industrial Production Development by Year
Source: Macrobond16.5.201647
The Big Challenge for Finland after 2008
16.5.201648
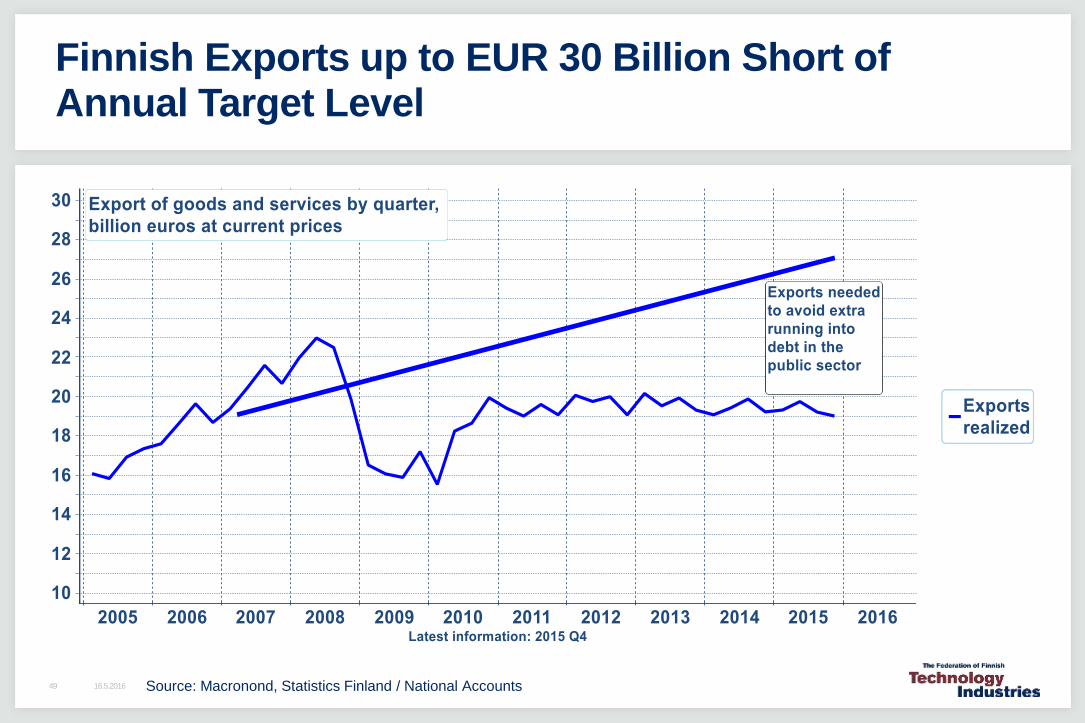
Finnish Exports up to EUR 30 Billion Short of Annual Target Level
Source: Macronond, Statistics Finland / National Accounts16.5.201649
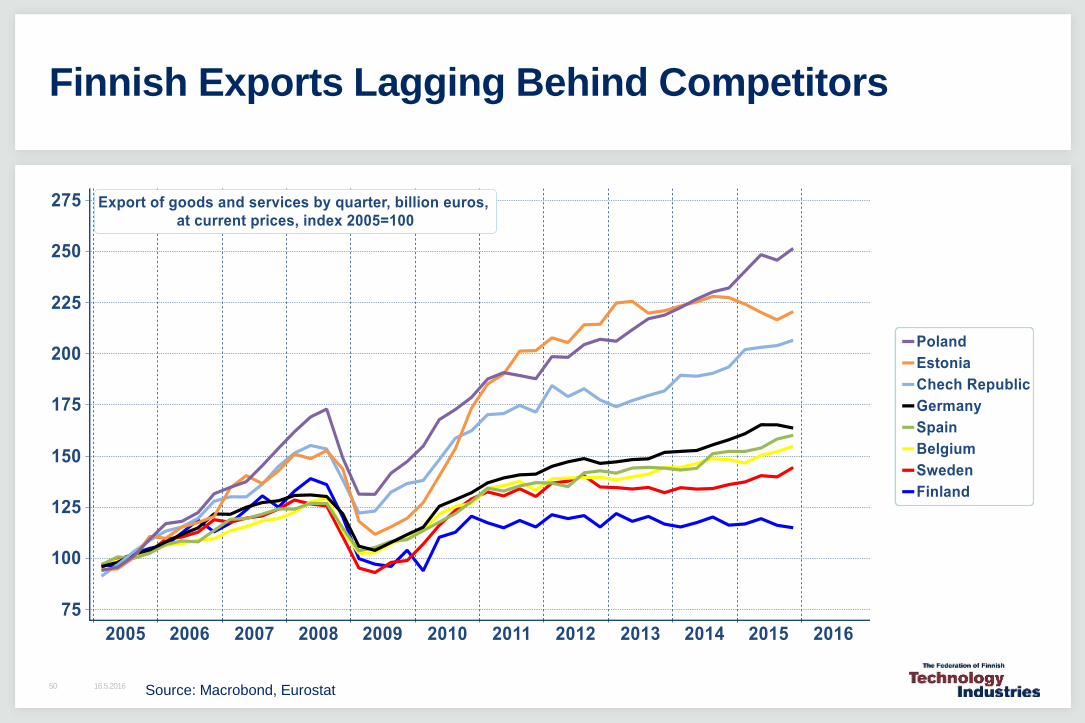
Finnish Exports Lagging Behind Competitors
Source: Macrobond, Eurostat16.5.201650
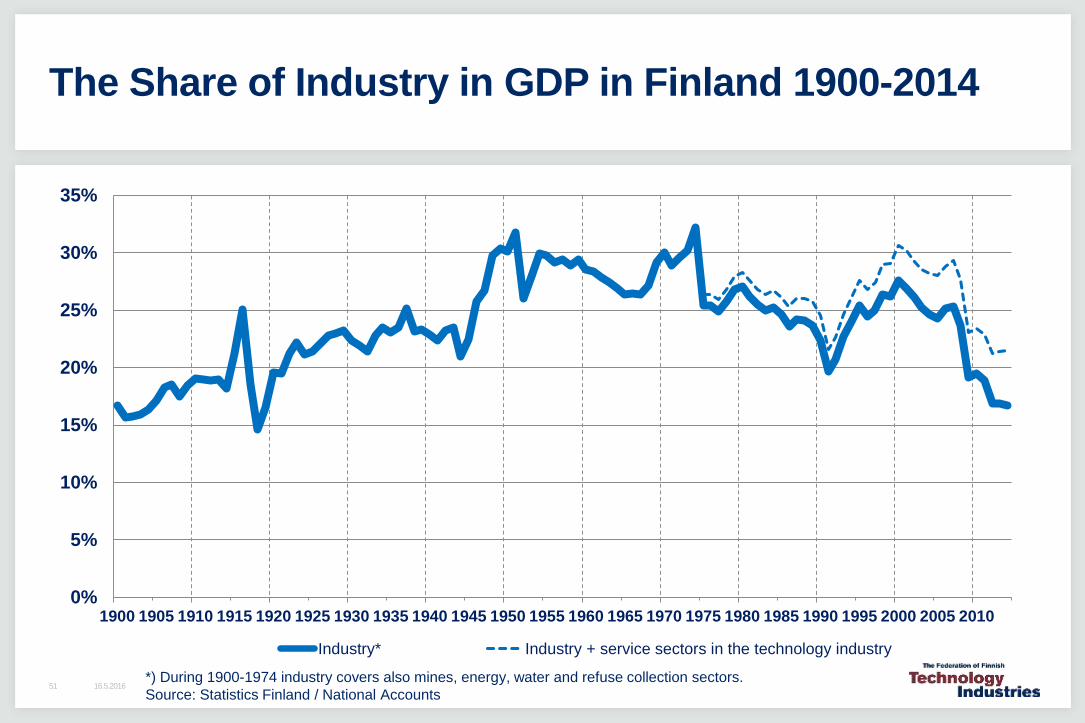
The Share of Industry in GDP in Finland 1900-2014
0%
5%
10%
15%
20%
25%
30%
35%
1900 1905 1910 1915 1920 1925 1930 1935 1940 1945 1950 1955 1960 1965 1970 1975 1980 1985 1990 1995 2000 2005 2010
Industry* Industry + service sectors in the technology industry
*) During 1900-1974 industry covers also mines, energy, water and refuse collection sectors.
Source: Statistics Finland / National Accounts16.5.201651
16.5.201652
55
60
65
70
75
80
85
90
95
100
70
75
80
85
90
95
100
105
110
115
120
125
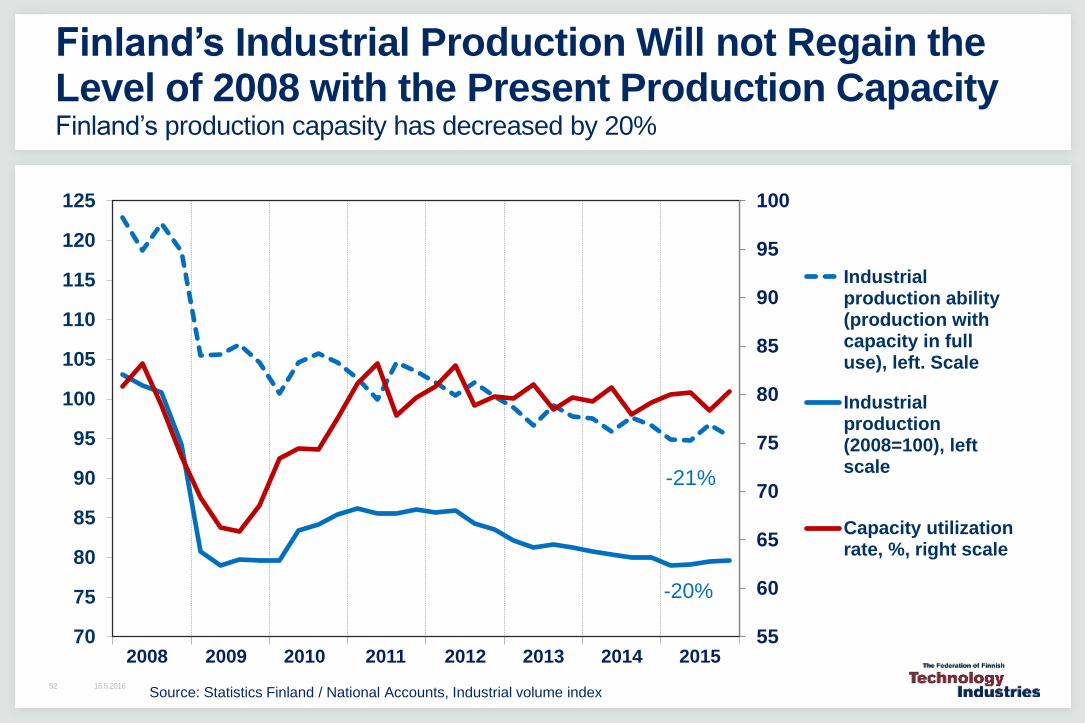
Industrialproduction ability(production withcapacity in fulluse), left. Scale
Industrialproduction(2008=100), leftscale
Capacity utilizationrate, %, right scale
-20%
2008 2009 2010 2011 2012 2013 2014 2015
-21%
Source: Statistics Finland / National Accounts, Industrial volume index
Finland’s Industrial Production Will not Regain the Level of 2008 with the Present Production CapacityFinland’s production capasity has decreased by 20%
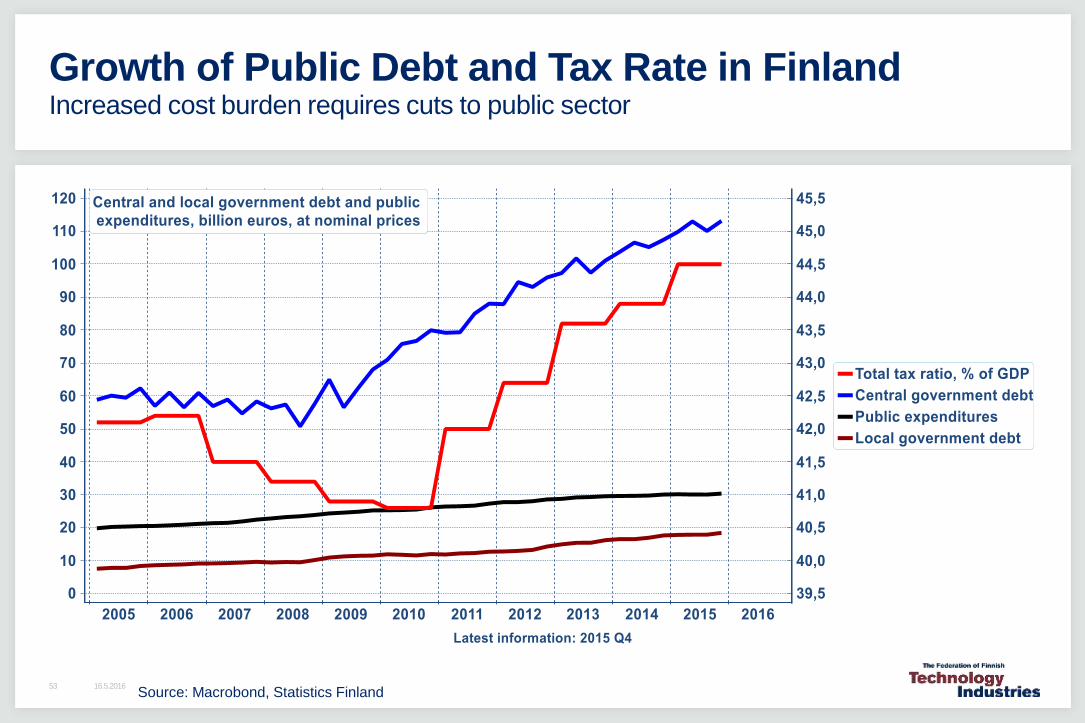
Growth of Public Debt and Tax Rate in FinlandIncreased cost burden requires cuts to public sector
Source: Macrobond, Statistics Finland 16.5.201653
85
90
95
100
105
110
115
120
125
130
135
140
145
150
155
2005 2006 2007 2008 2009 2010 2011 2012 2013 2014 2015e 2016e 2017e
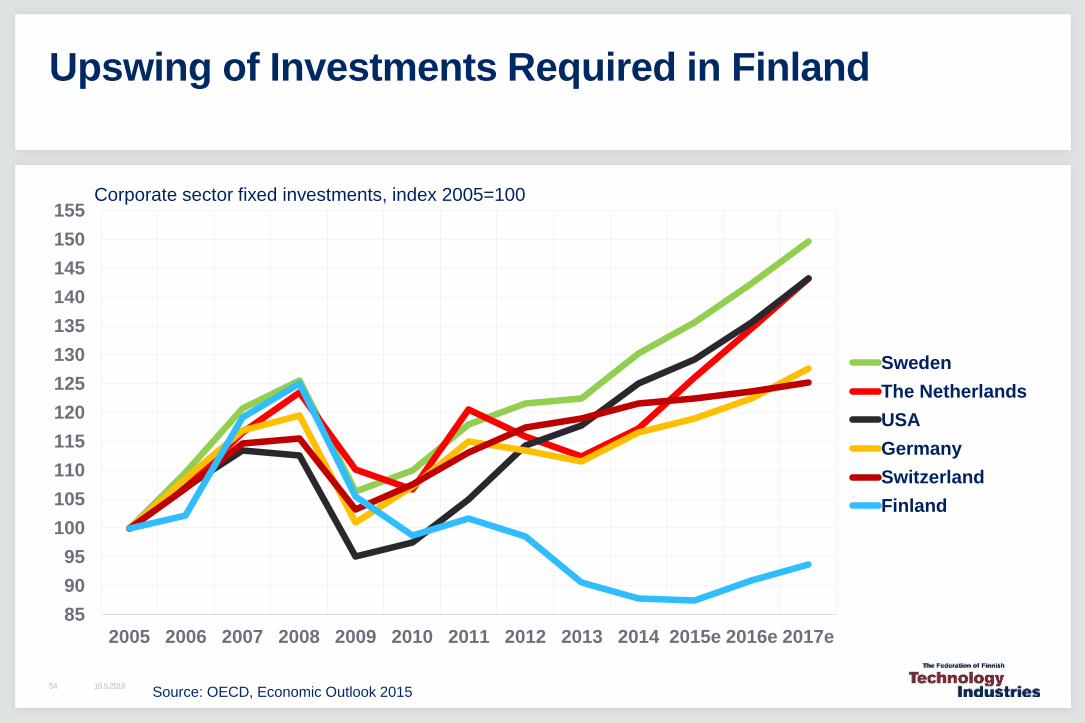
Corporate sector fixed investments, index 2005=100
Sweden
The Netherlands
USA
Germany
Switzerland
Finland
16.5.201654
Upswing of Investments Required in Finland
Source: OECD, Economic Outlook 2015
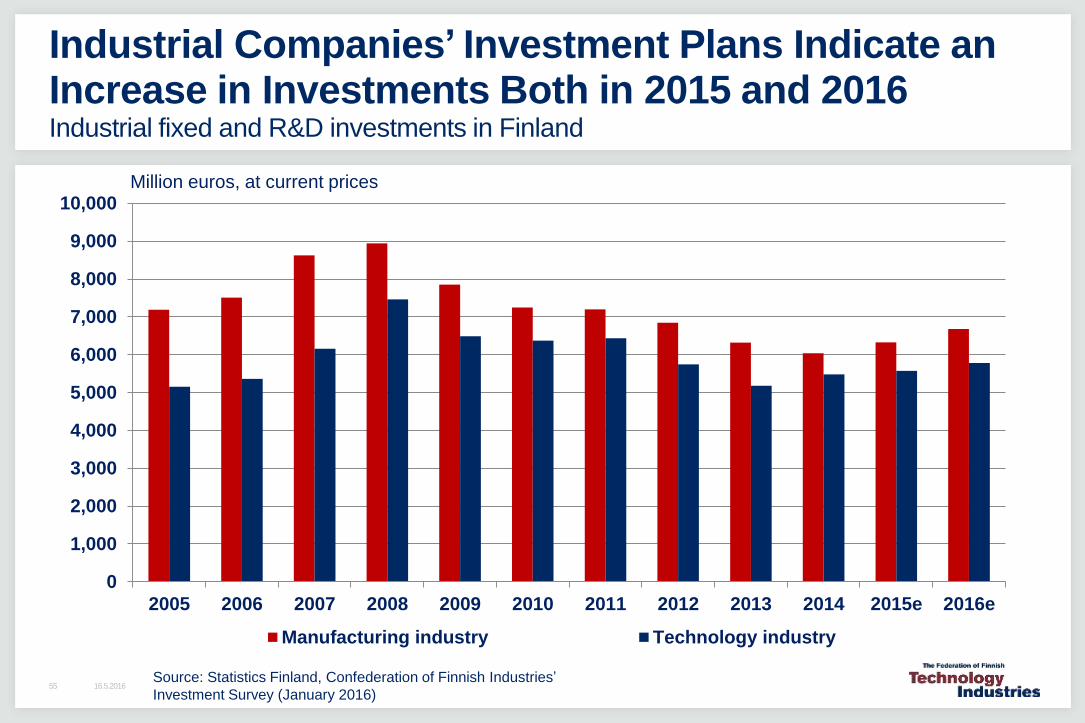
0
1,000
2,000
3,000
4,000
5,000
6,000
7,000
8,000
9,000
10,000
2005 2006 2007 2008 2009 2010 2011 2012 2013 2014 2015e 2016e
Manufacturing industry Technology industry
Industrial Companies’ Investment Plans Indicate an Increase in Investments Both in 2015 and 2016Industrial fixed and R&D investments in Finland
Source: Statistics Finland, Confederation of Finnish Industries’
Investment Survey (January 2016)
Million euros, at current prices
16.5.201655
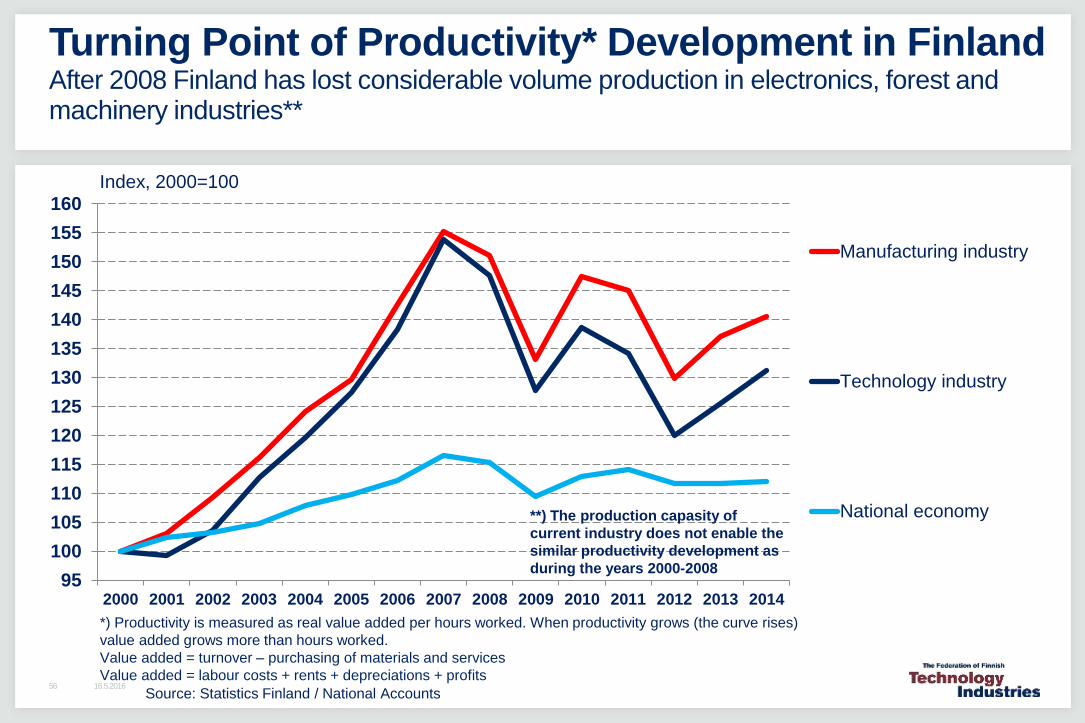
95
100
105
110
115
120
125
130
135
140
145
150
155
160
2000 2001 2002 2003 2004 2005 2006 2007 2008 2009 2010 2011 2012 2013 2014
Manufacturing industry
Technology industry
National economy
Turning Point of Productivity* Development in FinlandAfter 2008 Finland has lost considerable volume production in electronics, forest and machinery industries**
Source: Statistics Finland / National Accounts
*) Productivity is measured as real value added per hours worked. When productivity grows (the curve rises)
value added grows more than hours worked.
Value added = turnover – purchasing of materials and services
Value added = labour costs + rents + depreciations + profits
**) The production capasity of
current industry does not enable the
similar productivity development as
during the years 2000-2008
16.5.201656
Index, 2000=100
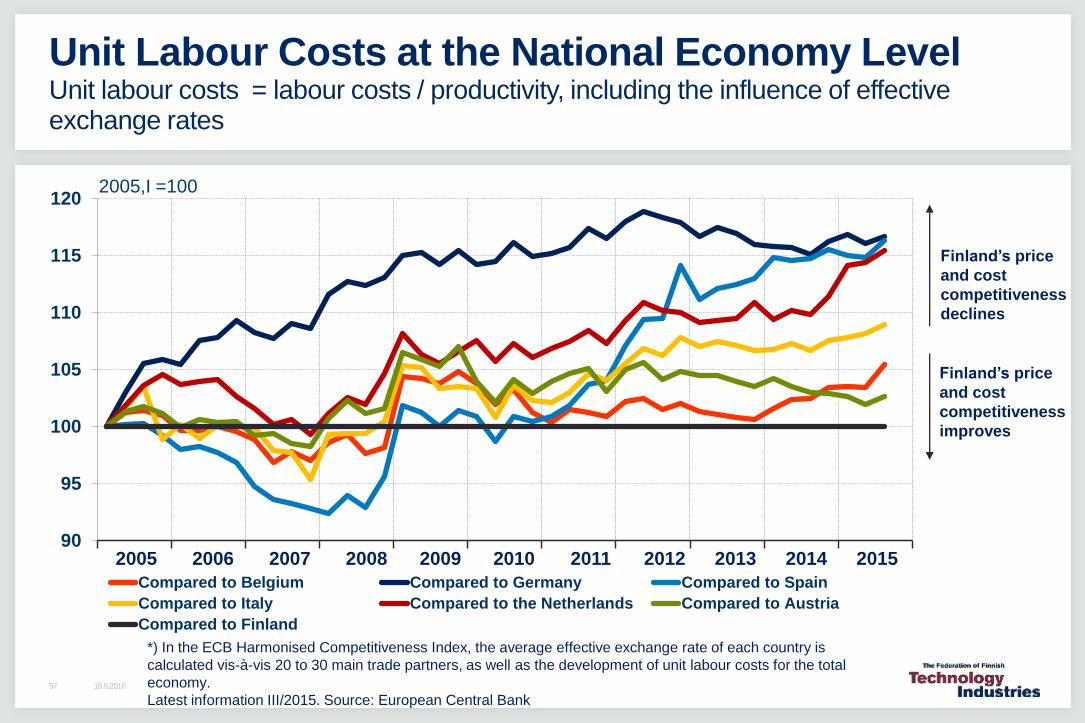
90
95
100
105
110
115
120
Compared to Belgium Compared to Germany Compared to Spain
Compared to Italy Compared to the Netherlands Compared to Austria
Compared to Finland
*) In the ECB Harmonised Competitiveness Index, the average effective exchange rate of each country is
calculated vis-à-vis 20 to 30 main trade partners, as well as the development of unit labour costs for the total
economy.
Latest information III/2015. Source: European Central Bank
Finland’s price
and cost
competitiveness
declines
2005,I =100
Finland’s price
and cost
competitiveness
improves
Unit Labour Costs at the National Economy LevelUnit labour costs = labour costs / productivity, including the influence of effective exchange rates
2005 2006 2007 2008 2009 2010 2011 2012 2013 2014 2015
16.5.201657
Support the renewal of the industry
Taxes should support growth and investment in Finland
Support decision making in companies related to compensation and
working time
No new European nor national burdens on companies, which are
deteriorating the competitiveness
What should be done?
16.5.201658
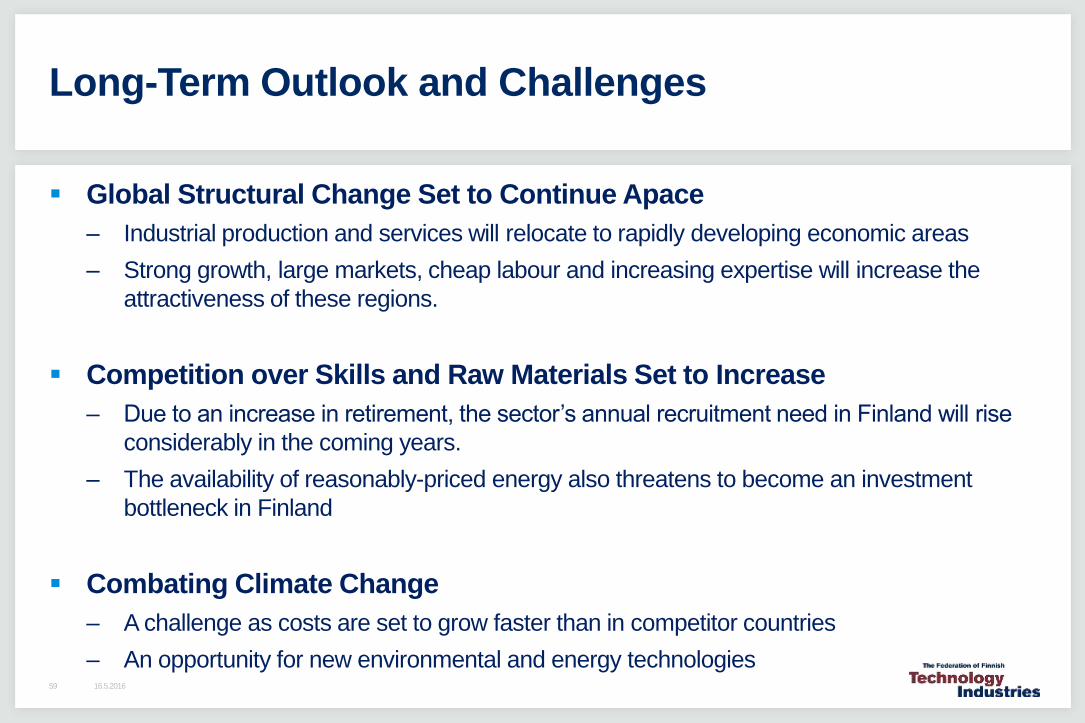
Global Structural Change Set to Continue Apace
– Industrial production and services will relocate to rapidly developing economic areas
– Strong growth, large markets, cheap labour and increasing expertise will increase the
attractiveness of these regions.
Competition over Skills and Raw Materials Set to Increase
– Due to an increase in retirement, the sector’s annual recruitment need in Finland will rise
considerably in the coming years.
– The availability of reasonably-priced energy also threatens to become an investment
bottleneck in Finland
Combating Climate Change
– A challenge as costs are set to grow faster than in competitor countries
– An opportunity for new environmental and energy technologies
Long-Term Outlook and Challenges
16.5.201659
The Federation of Finnish Technology Industries
16.5.201660
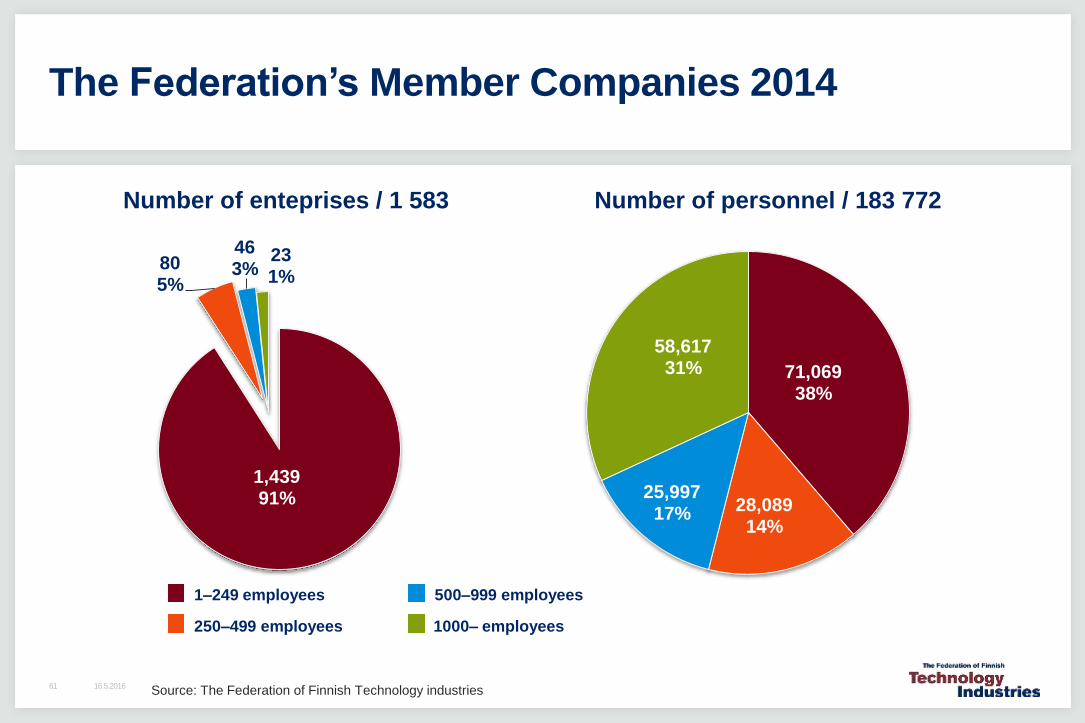
The Federation’s Member Companies 2014
61
71,06938%
28,08914%
25,99717%
58,61731%
1,43991%
80 5%
46 3%
23 1%
Number of enteprises / 1 583 Number of personnel / 183 772
1–249 employees
250–499 employees
500–999 employees
1000– employees
Source: The Federation of Finnish Technology industries16.5.2016
62
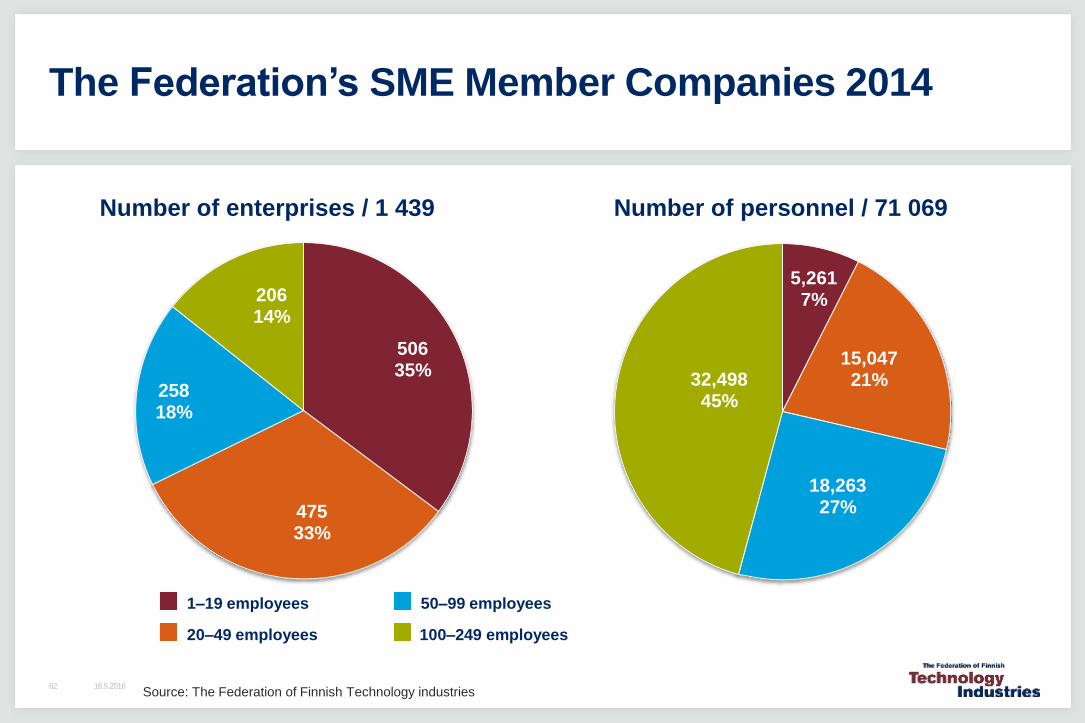
The Federation’s SME Member Companies 2014
50635%
475 33%
25818%
20614%
Number of enterprises / 1 439 Number of personnel / 71 069
1–19 employees
20–49 employees
50–99 employees
100–249 employees
5,2617%
15,04721%
18,26327%
32,49845%
Source: The Federation of Finnish Technology industries16.5.2016