Embed Size (px)
DESCRIPTION
Citation preview


Forward Looking StatementsIn the presentation that follows and in related comments by GMAC LLC (“GMAC”) management,our use of the words “expect”, “anticipate”, “estimate”, “forecast”, “objective”, “plan”, “could”,“should”, “would”, “may”, “goal”, “project”, “outlook”, “priorities”, “targets”, “intend”,“evaluate”, “pursue”, “seek” and similar expressions is intended to identify forward lookingstatements.
While these statements represent our current judgment on what the future may hold, and webelieve these judgments are reasonable, actual results may differ materially due to numerousimportant factors that are described in GMAC’s most recent report on SEC Form 10-K, which maybe revised or supplemented in subsequent reports on SEC Forms 10-Q and 8-K. Such factorsinclude, among others, the following: securing low cost funding to sustain growth for GMAC andResCap and maintaining the mutually beneficial relationship between GMAC and General Motors;changes in economic conditions, currency exchange rates, significant terrorist attacks or politicalinstability in the major markets where we operate; recent developments in the residentialmortgage market, especially in the nonprime sector; changes in the laws, regulations, policies orother activities of governments, agencies and similar organizations where such actions may affectthe production, licensing, distribution or sale of our products, the cost thereof or applicable taxrates; and the outbreak or escalation of hostilities between the United States and any foreignpower or territory and changes in international political conditions may continue to affect both theUnited States and the global economy and may increase other risks. Investors are cautioned notto place undue reliance on forward-looking statements. GMAC undertakes no obligation to updateor revise any forward-looking statements unless required by law.
Use of the term “loans” describes products associated with direct and indirect lending activitiesof GMAC’s global operations. The specific products include retail installment sales contracts,loans, lines of credit, leases or other financing products. The term “originate” refers to GMAC’spurchase, acquisition or direct origination of various “loan” products.

Cerberusled
InvestorConsortium
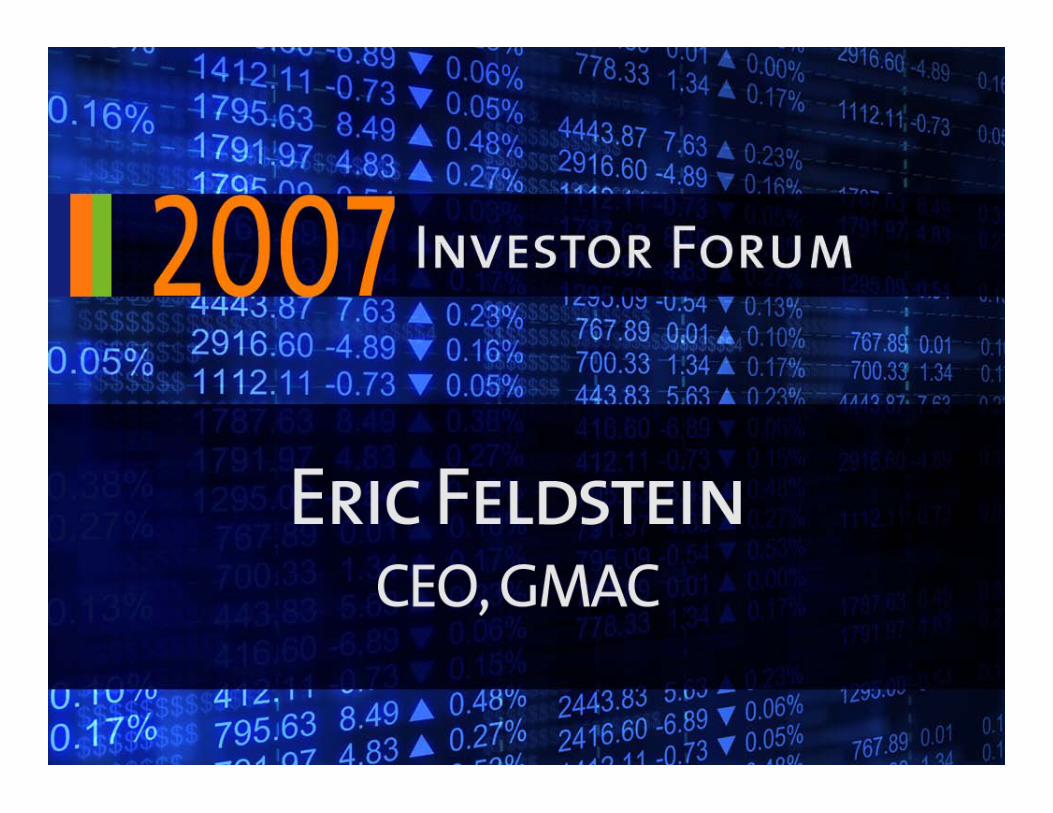
New GMAC Ownership
51% Equity49% Equity
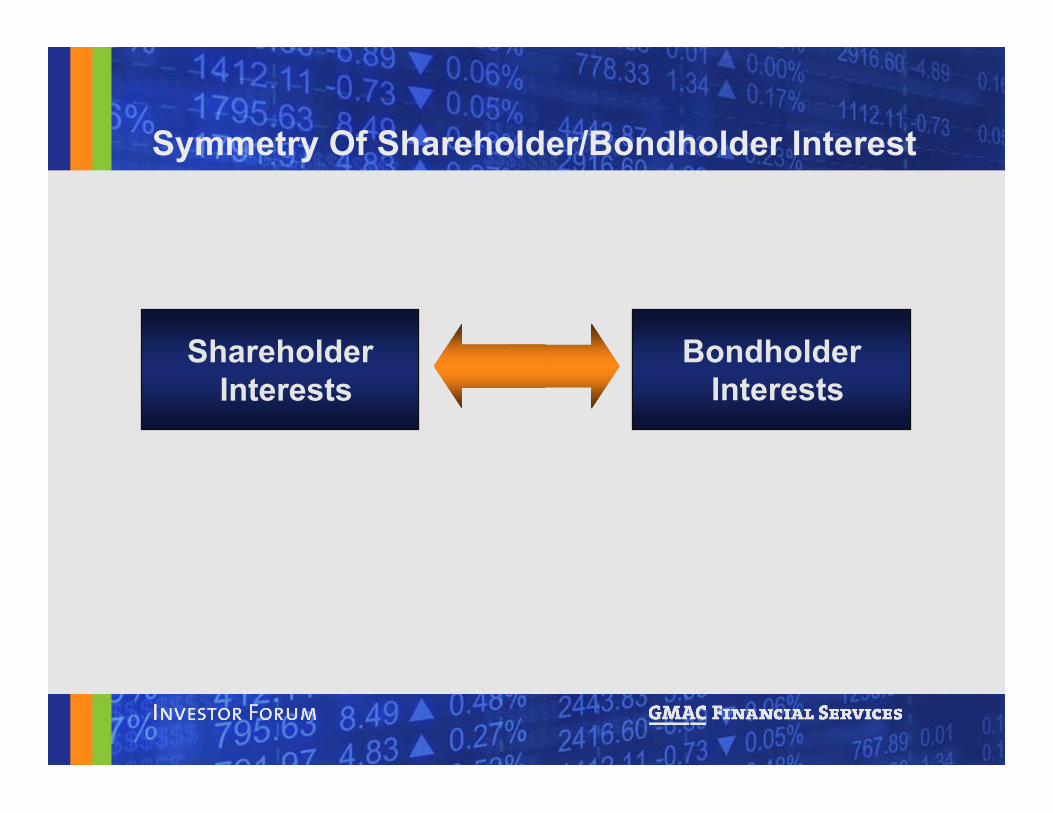
ShareholderInterests
BondholderInterests
Symmetry Of Shareholder/Bondholder Interest
VALUE PLAY• Increase the return on capital to equity holders
by further strengthening GMAC’s credit profileand reducing funding costs
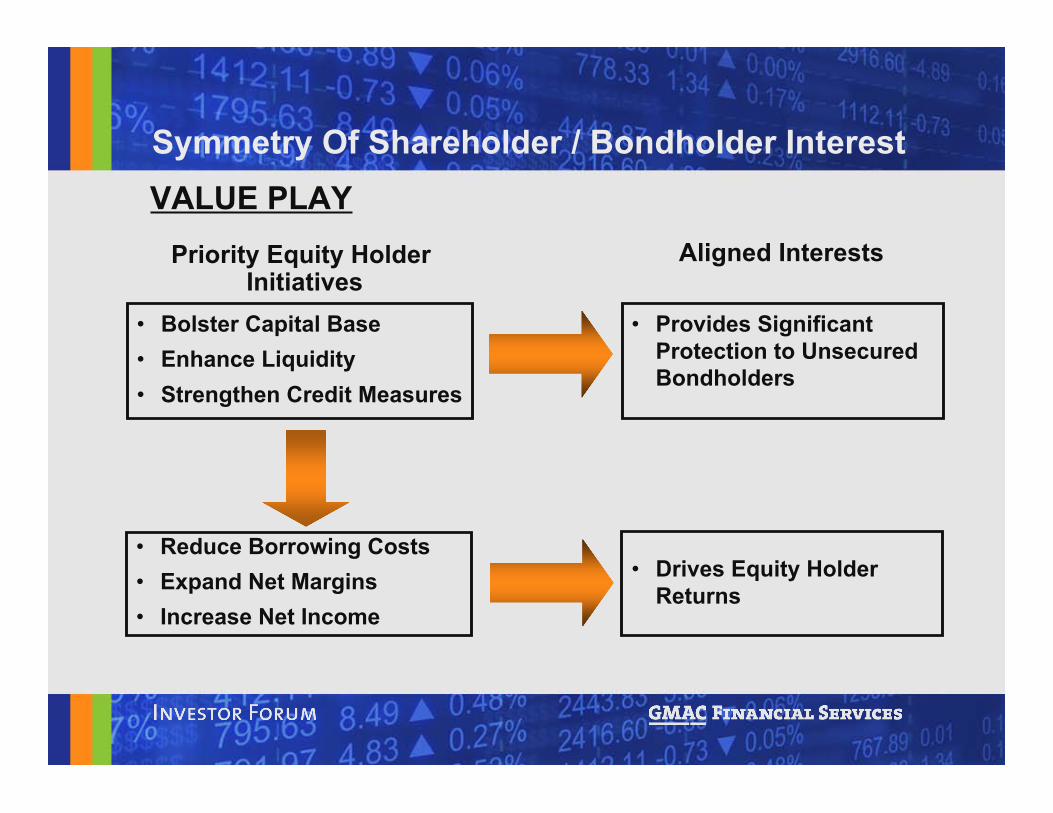
Symmetry Of Shareholder / Bondholder Interest
Symmetry Of Shareholder / Bondholder Interest
Priority Equity Holder Initiatives
• Bolster Capital Base• Enhance Liquidity • Strengthen Credit Measures
Aligned Interests
• Provides SignificantProtection to UnsecuredBondholders
• Drives Equity HolderReturns
• Reduce Borrowing Costs• Expand Net Margins• Increase Net Income
VALUE PLAY
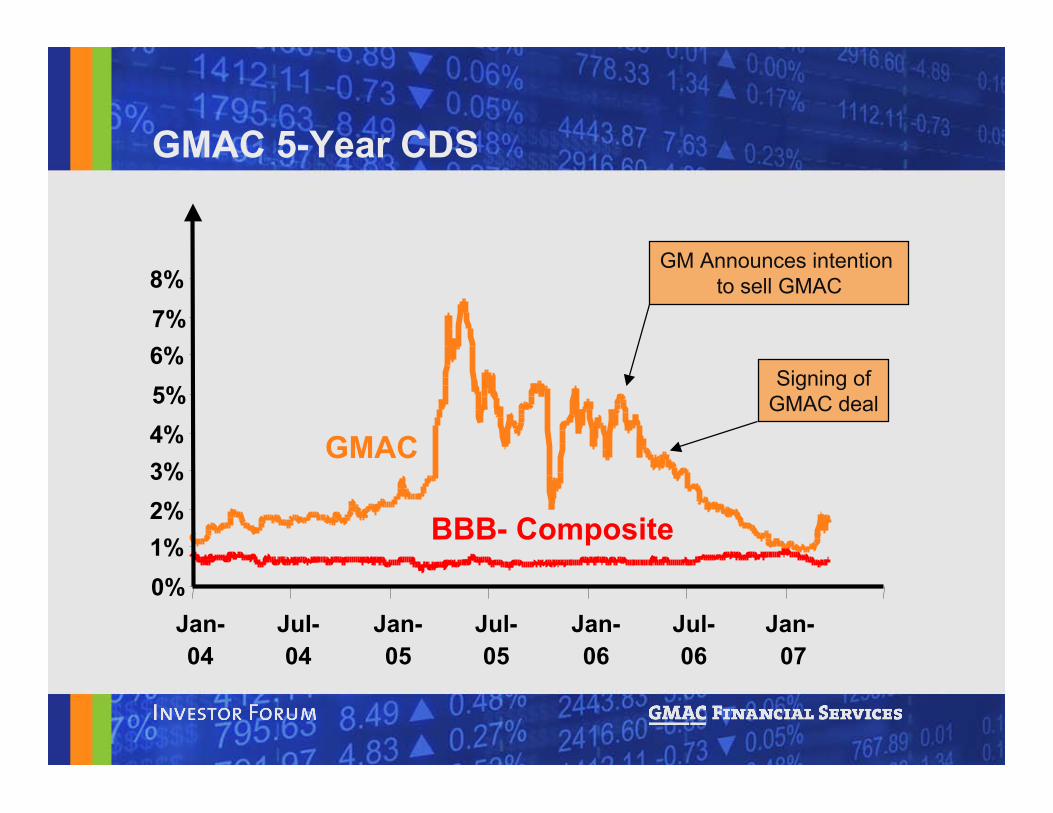
GMAC 5-Year CDSOriginal Excel Chart below
0%
1%
2%
3%
4%
5%
6%
7%
8%
Jan-04 Jul-04 Jan-05 Jul-05 Jan-06 Jul-06 Jan-07
BBB- Composite
GMAC
0%1%2%3%4%5%6%7%8%
Jan-04
Jul-04
Jan-05
Jul-05
Jan-06
Jul-06
Jan- 07
BBB- Composite
GMAC
GM Announces intention to sell GMAC
Signing ofGMAC deal
Risk Mitigation Efforts
• GM credit risk reduction
• Prudent balance sheet and capital management
• Enhanced liquidity and funding flexibility
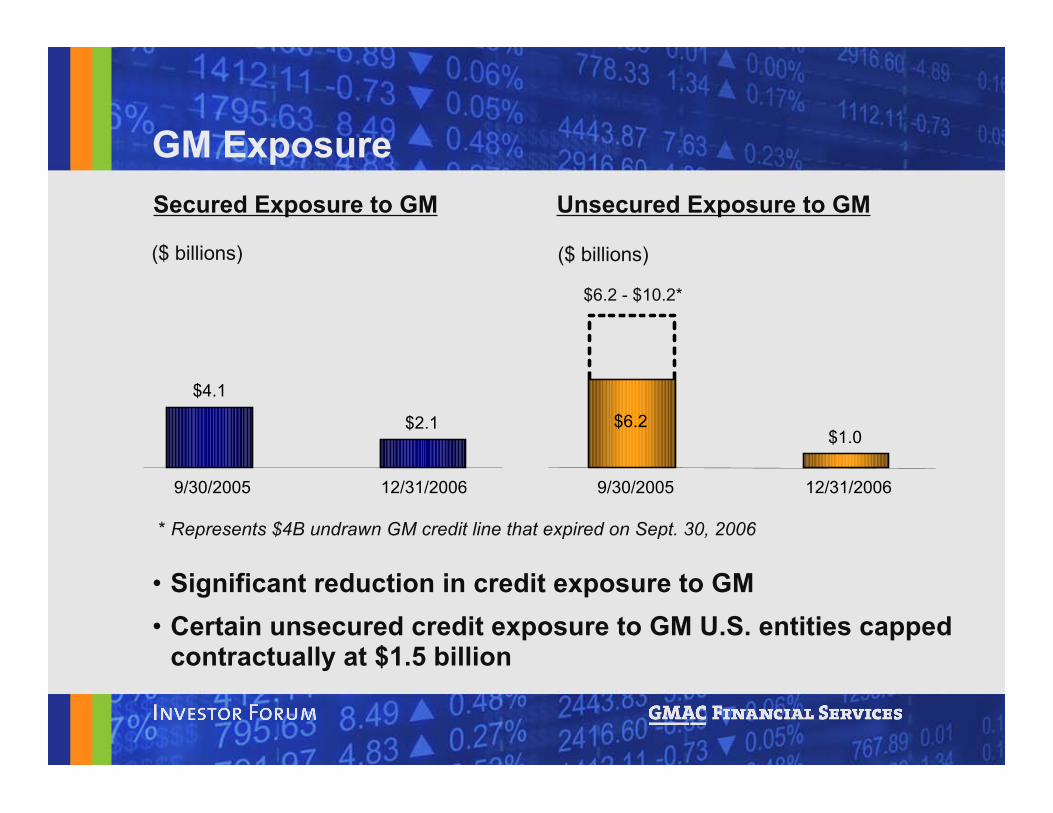
• Significant reduction in credit exposure to GM• Certain unsecured credit exposure to GM U.S. entities capped
contractually at $1.5 billion
Secured Exposure to GM Unsecured Exposure to GM
($ billions)($ billions)
* Represents $4B undrawn GM credit line that expired on Sept. 30, 2006
$4.1
$2.1
9/30/2005 12/31/2006
$6.2 - $10.2*
$1.0$6.2
9/30/2005 12/31/2006
GM Exposure
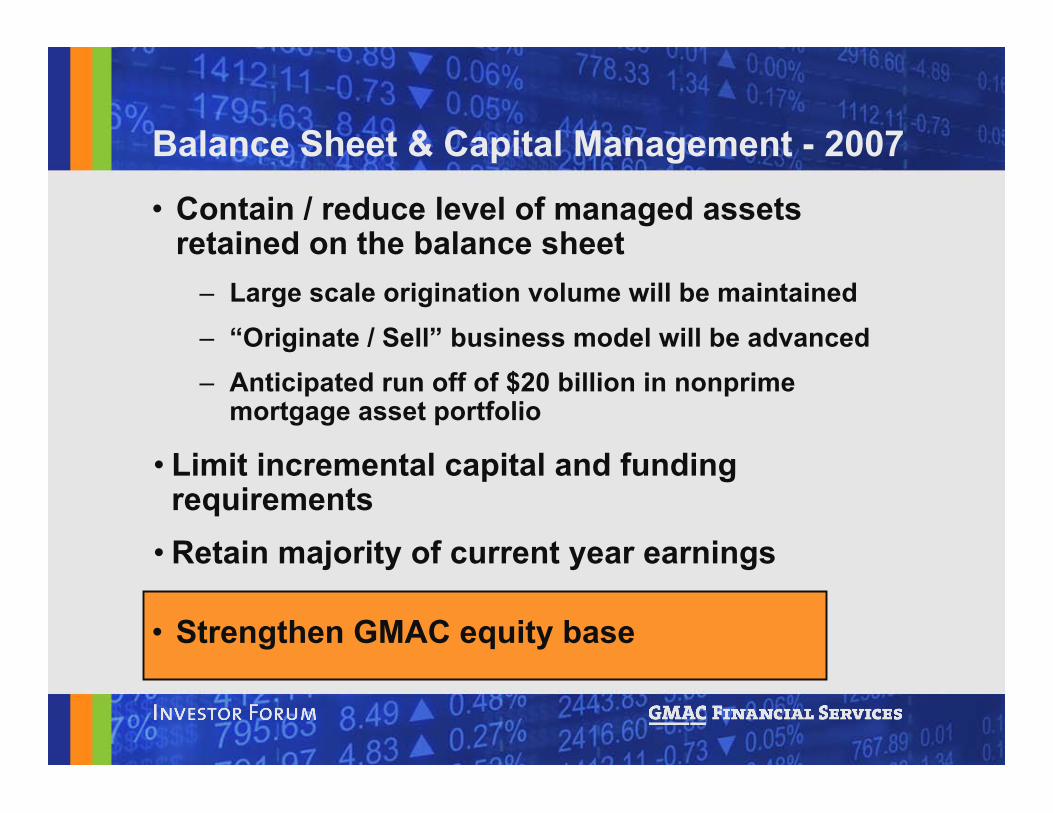
• Contain / reduce level of managed assetsretained on the balance sheet
– Large scale origination volume will be maintained– “Originate / Sell” business model will be advanced– Anticipated run off of $20 billion in nonprime
mortgage asset portfolio
Balance Sheet & Capital Management - 2007
• Strengthen GMAC equity base
• Limit incremental capital and fundingrequirements
• Retain majority of current year earnings
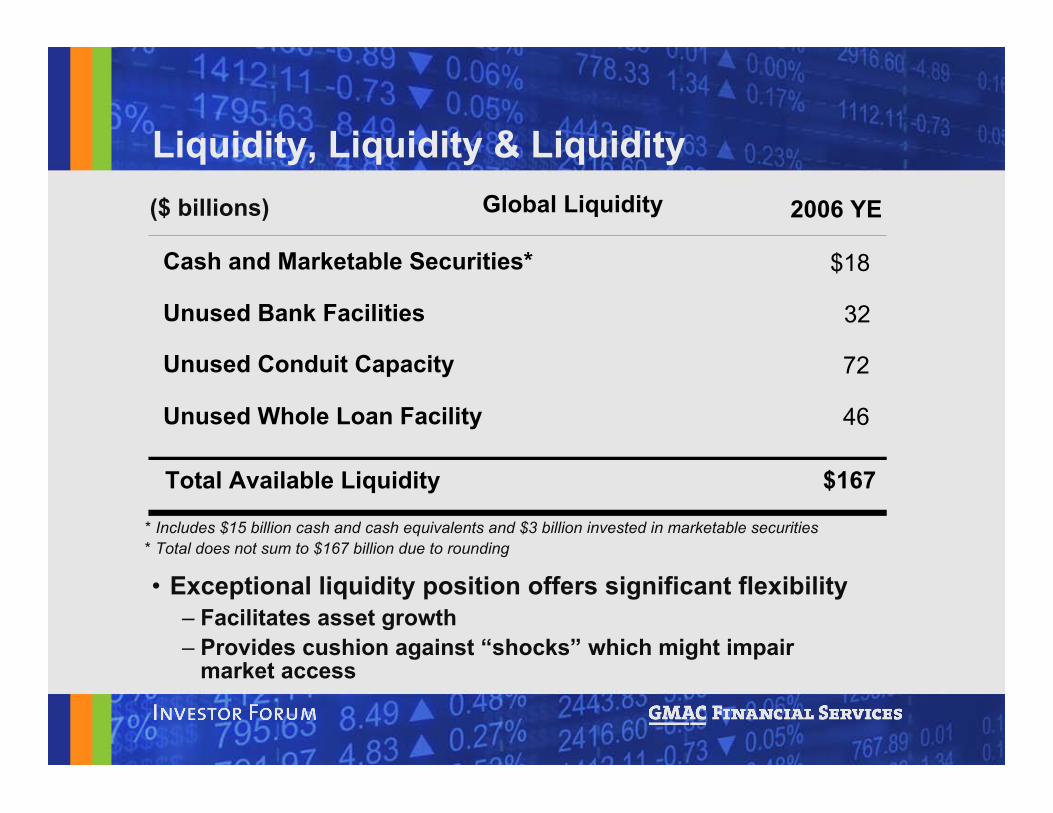
Liquidity, Liquidity & Liquidity
• Exceptional liquidity position offers significant flexibility– Facilitates asset growth– Provides cushion against “shocks” which might impair
market access
* Includes $15 billion cash and cash equivalents and $3 billion invested in marketable securities
($ billions) 2006 YE
Cash and Marketable Securities* $18
Unused Bank Facilities 32
Total Available Liquidity $167
Global Liquidity
Unused Conduit Capacity 72
Unused Whole Loan Facility 46
* Total does not sum to $167 billion due to rounding
ResCap Liquidity - Strategic Advantage• In the wake of a highly challenging mortgage
market, LIQUIDITY will be a critical successfactor
• ResCap’s year-end 2006 cash position of$2.0 billion and equity base of $7.6 billionprovides competitive advantage
– Enables company to:• Comfortably meet all debt obligations• Retain certain assets during periods of severe
market illiquidity• Avoid selling assets at distressed levels• Take advantage of market dislocation by acquiring
certain assets opportunistically
Growth Initiatives• Augment profitability of existing GM-related business• Diversify auto finance and insurance operations beyond
the GM dealer network• Increase share of U.S. mortgage market over the long
term– Capitalize on opportunities arising from sharp market
downturn• Continue profitable expansion overseas
– Capitalize on unique international footprint – 40 countries– Extensive experience operating in international markets– Export superior “financing” technology to lesser
developed capital markets abroad
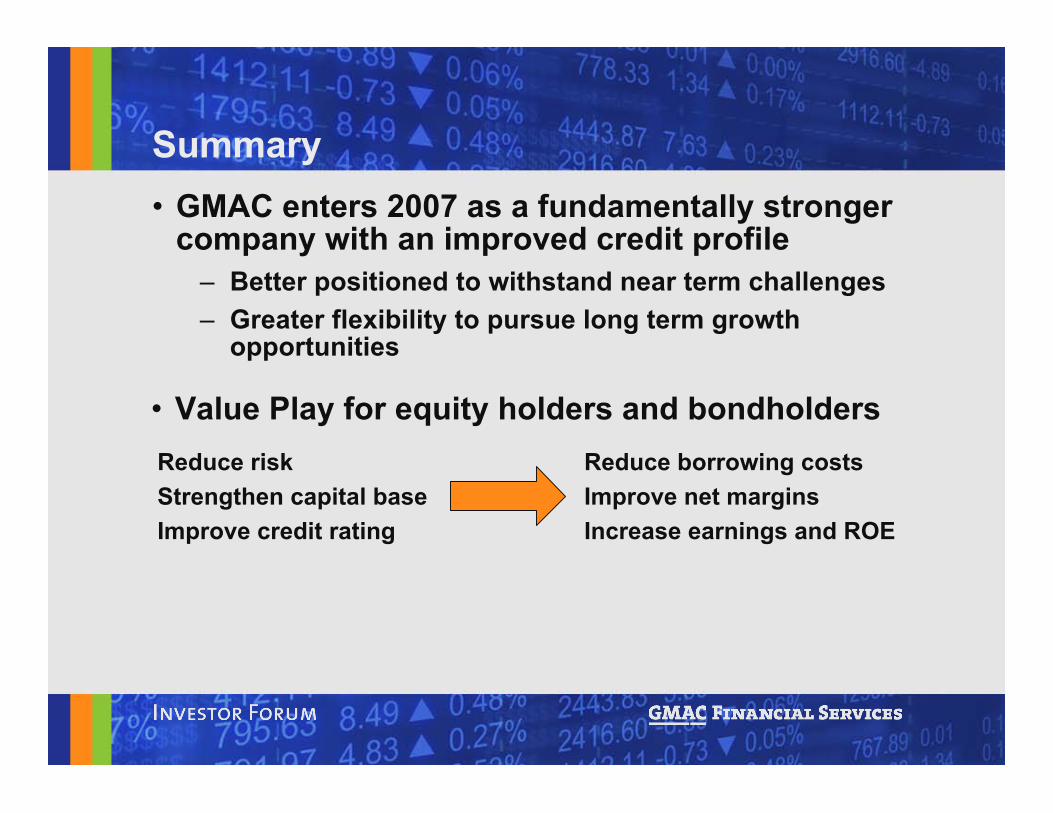
Summary• GMAC enters 2007 as a fundamentally stronger
company with an improved credit profile– Better positioned to withstand near term challenges– Greater flexibility to pursue long term growth
opportunities
• Value Play for equity holders and bondholdersReduce borrowing costsImprove net marginsIncrease earnings and ROE
Reduce riskStrengthen capital baseImprove credit rating

Business Update
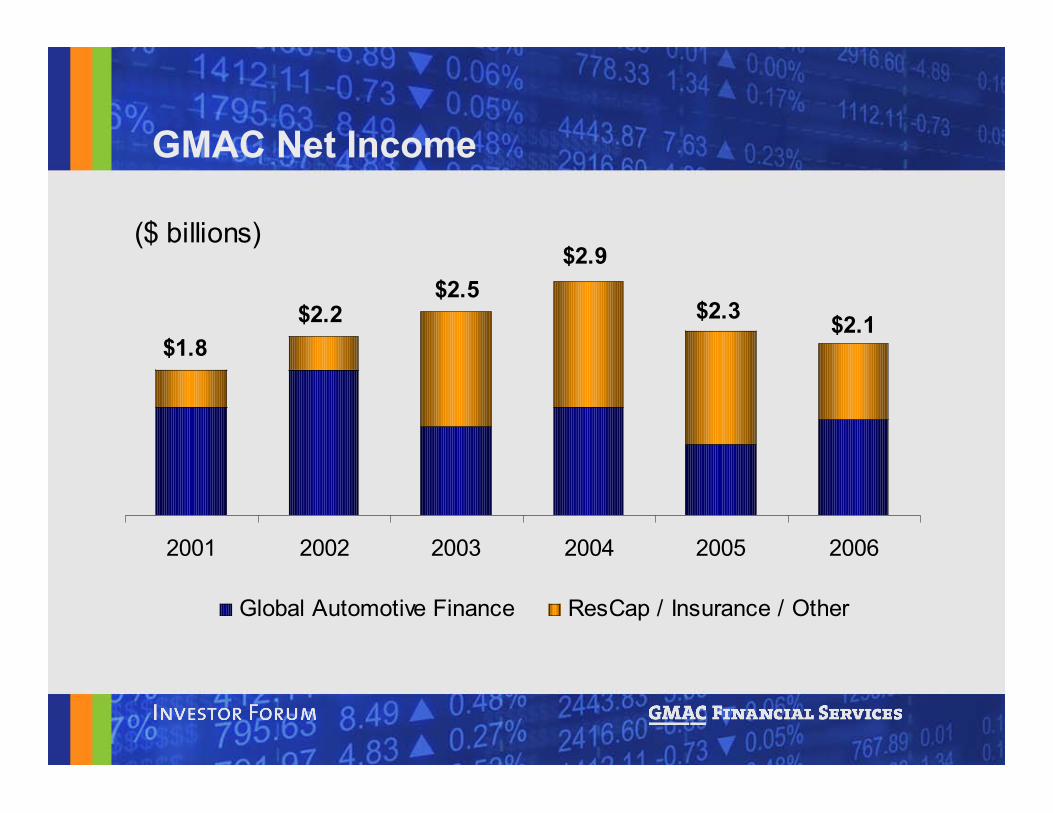
2001 2002 2003 2004 2005 2006
Global Automotive Finance ResCap / Insurance / Other
($ billions)
$2.2$2.5
$2.9
$2.3$2.1
$1.8
GMAC Net Income
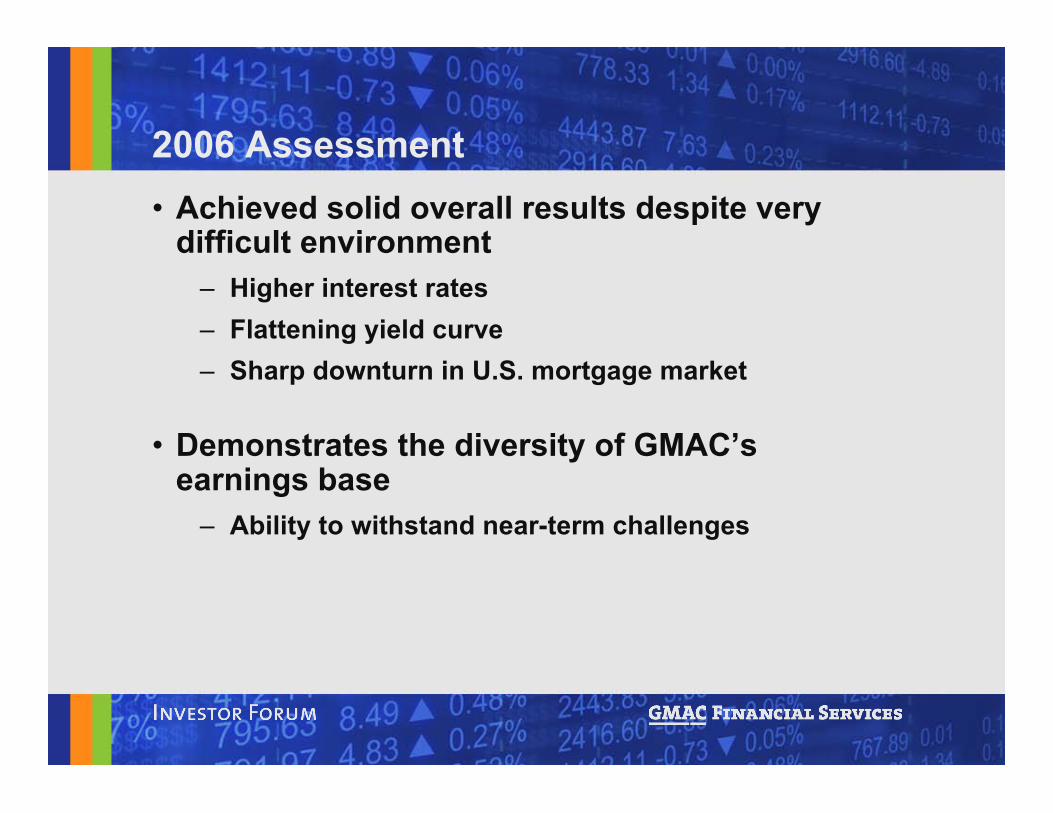
2006 Assessment• Achieved solid overall results despite very
difficult environment– Higher interest rates– Flattening yield curve– Sharp downturn in U.S. mortgage market
• Demonstrates the diversity of GMAC’searnings base
– Ability to withstand near-term challenges
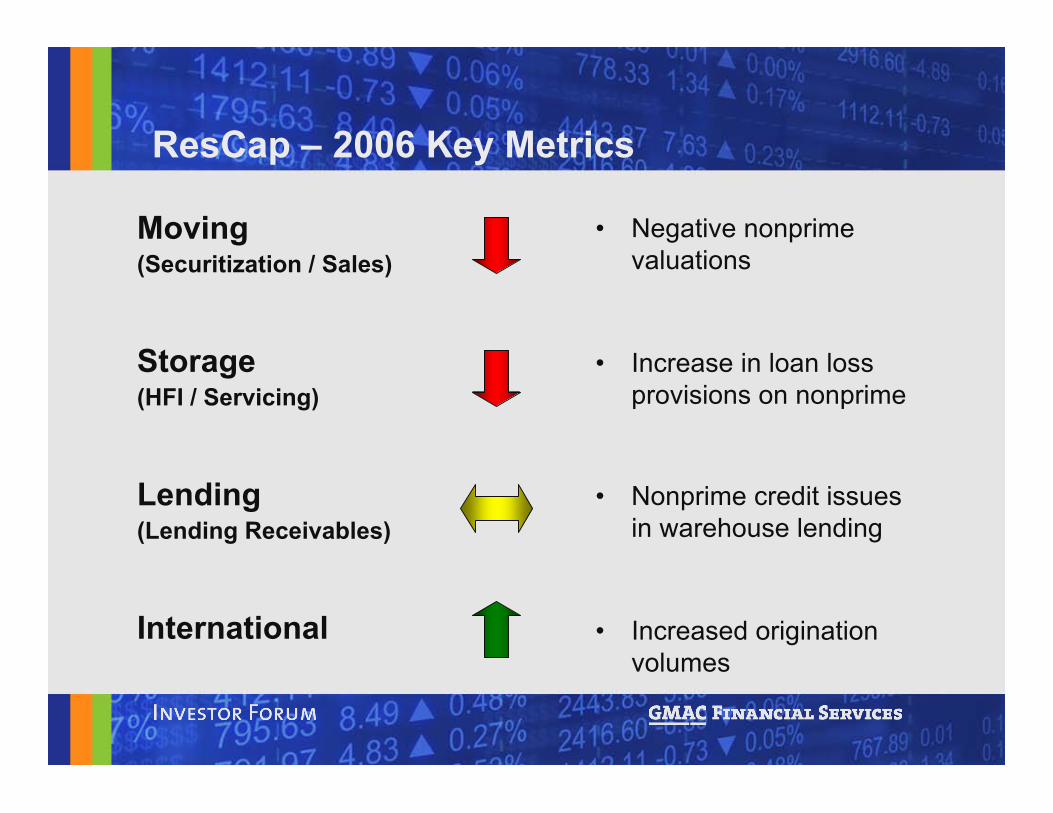
Moving(Securitization / Sales)
Storage(HFI / Servicing)
Lending(Lending Receivables)
International
• Negative nonprimevaluations
ResCap – 2006 Key Metrics
• Increase in loan lossprovisions on nonprime
• Nonprime credit issuesin warehouse lending
• Increased originationvolumes
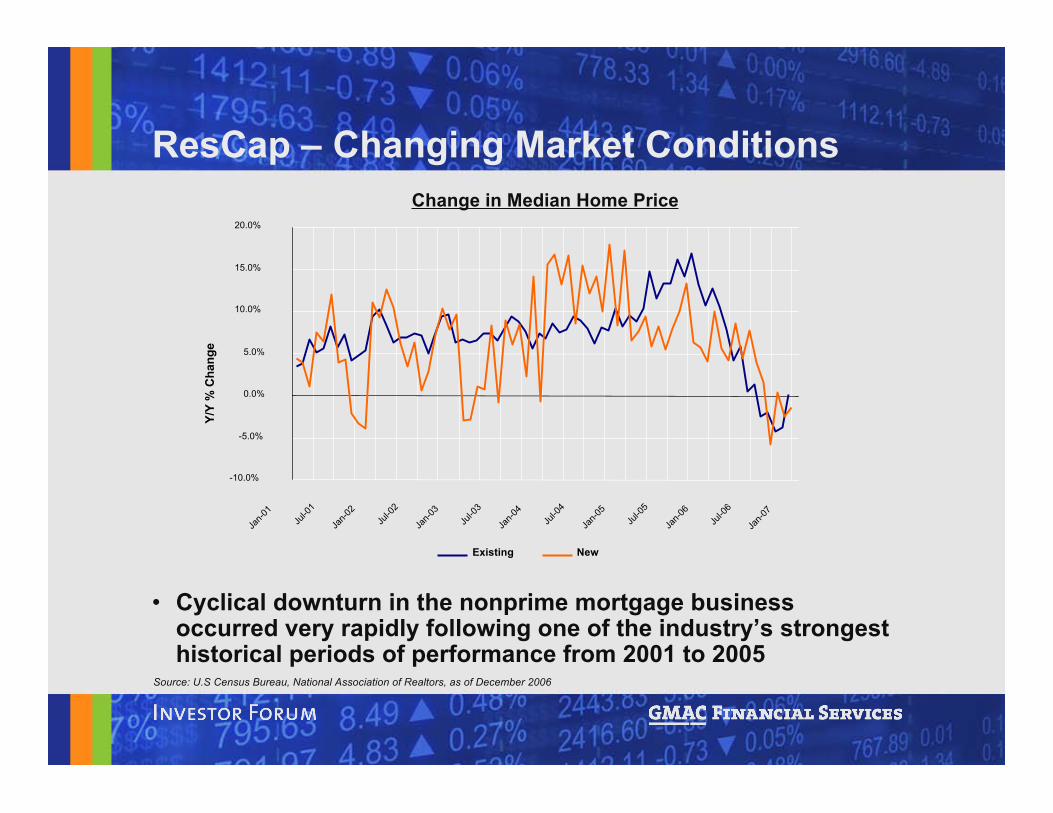
• Cyclical downturn in the nonprime mortgage businessoccurred very rapidly following one of the industry’s strongesthistorical periods of performance from 2001 to 2005
ResCap – Changing Market ConditionsChange in Median Home Price
Source: U.S Census Bureau, National Association of Realtors, as of December 2006
-10.0%
-5.0%
0.0%
5.0%
10.0%
15.0%
20.0%
Jan-0
1Ju
l-01
Jan-0
2Ju
l-02
Jan-0
3Ju
l-03
Jan-0
4Ju
l-04
Jan-0
5Ju
l-05
Jan-0
6Ju
l-06
Jan-0
7
Y/Y
% C
hang
e
Existing New
$0
$100
$200
$300
$400
$500
$600
$700
1995
1996
1997
1998
1999
2000
2001
2002
2003
2004
2005
2006
$ bi
llion
s
0.0%
1.0%
2.0%
3.0%
4.0%
5.0%
6.0%
7.0%
B&C Mkt $ RCG B&C Share %
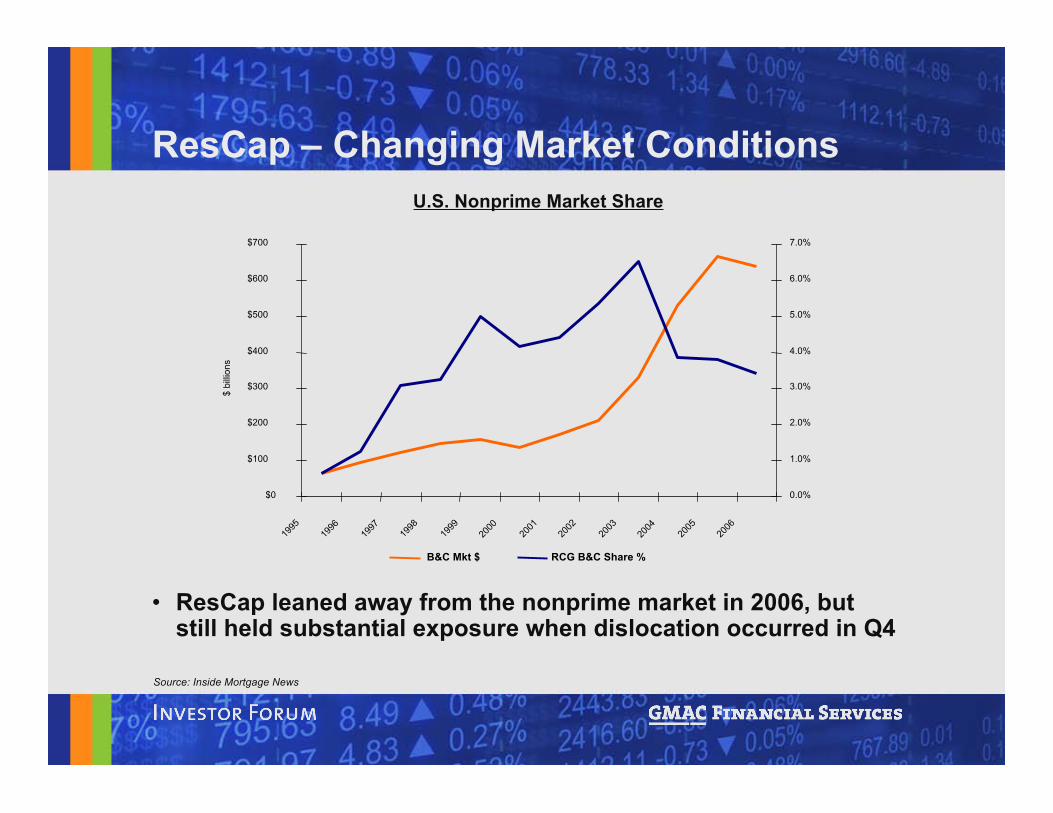
ResCap – Changing Market ConditionsU.S. Nonprime Market Share
Source: Inside Mortgage News
• ResCap leaned away from the nonprime market in 2006, butstill held substantial exposure when dislocation occurred in Q4
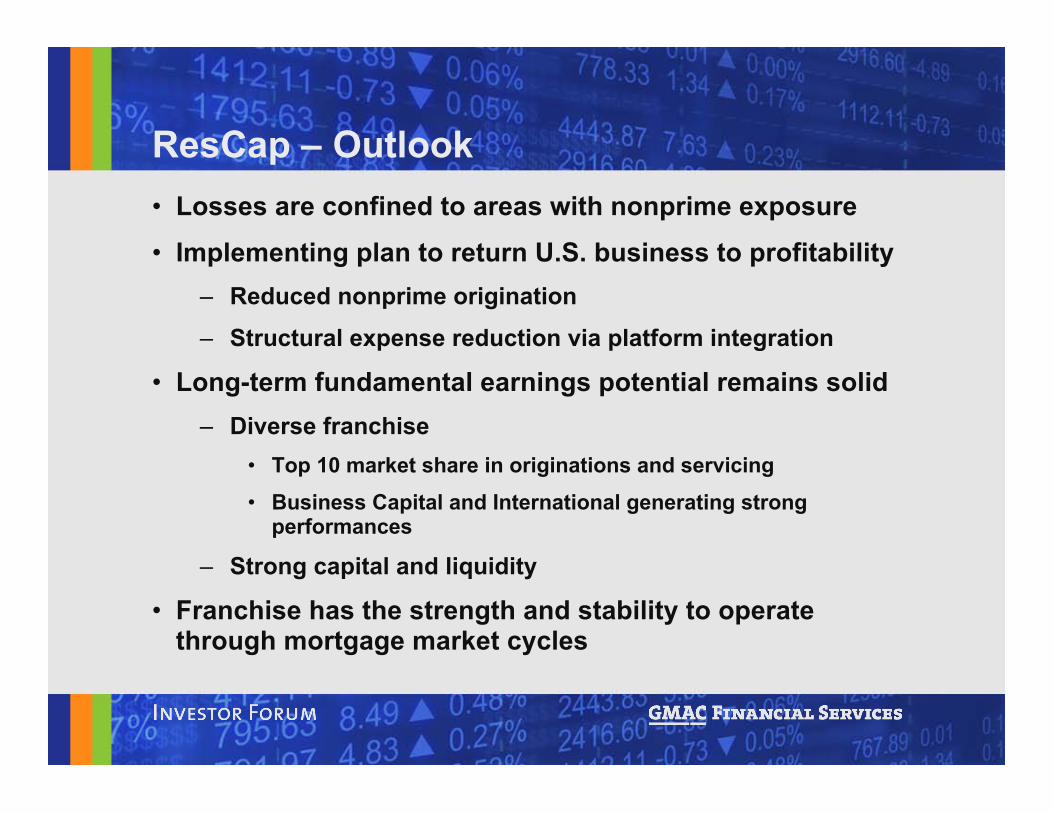
ResCap – Outlook• Losses are confined to areas with nonprime exposure
• Implementing plan to return U.S. business to profitability– Reduced nonprime origination
– Structural expense reduction via platform integration
• Long-term fundamental earnings potential remains solid– Diverse franchise
• Top 10 market share in originations and servicing• Business Capital and International generating strong
performances
– Strong capital and liquidity
• Franchise has the strength and stability to operatethrough mortgage market cycles
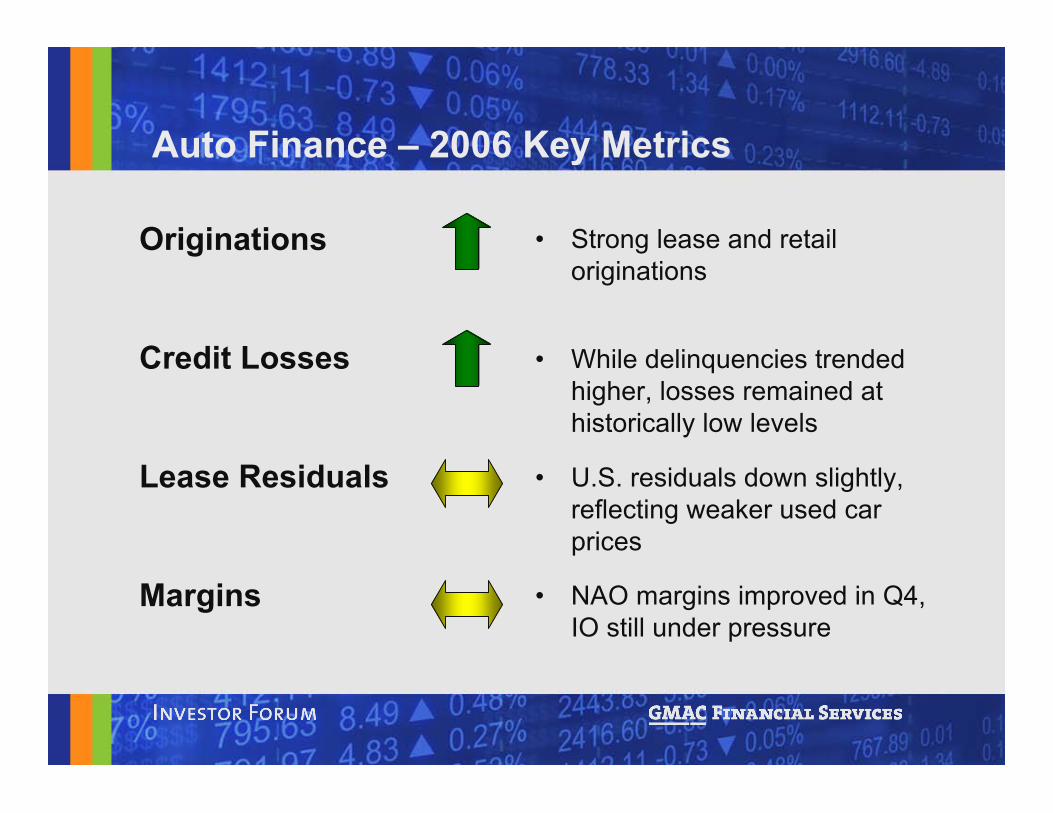
• Strong lease and retailoriginations
Originations
Credit Losses
Lease Residuals
Margins
Auto Finance – 2006 Key Metrics
• While delinquencies trendedhigher, losses remained athistorically low levels
• U.S. residuals down slightly,reflecting weaker used carprices
• NAO margins improved in Q4,IO still under pressure
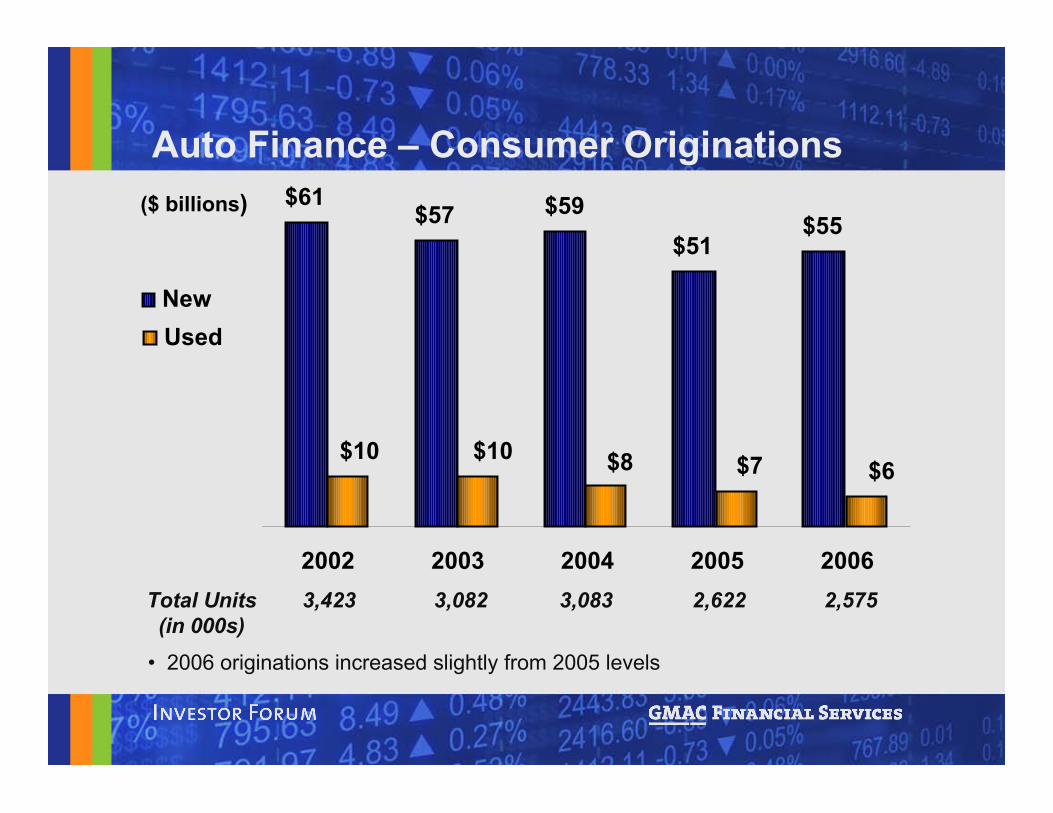
• 2006 originations increased slightly from 2005 levels
($ billions)
Total Units 3,423 3,082 3,083 2,622 2,575 (in 000s)
Auto Finance – Consumer Originations$61
$57 $59$51
$55
$10 $10 $8 $7 $6
2002 2003 2004 2005 2006
NewUsed
• Overall trends remain stable– 2006 performance was down slightly reflecting weaker used car prices
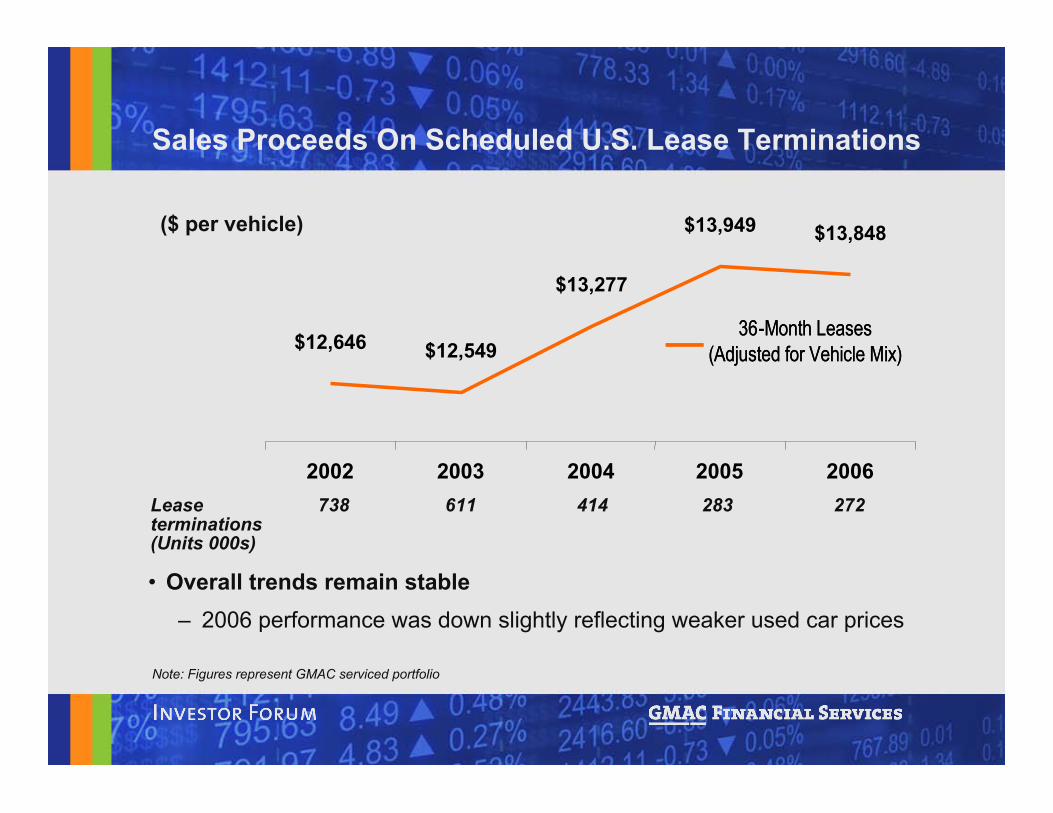
Sales Proceeds On Scheduled U.S. Lease Terminations
Lease 738 611 414 283 272terminations(Units 000s)
($ per vehicle)
36-Month Leases
(Adjusted for Vehicle Mix)
36-Month Leases
(Adjusted for Vehicle Mix)$12,646 $12,549
$13,277
$13,949 $13,848
2002 2003 2004 2005 2006
Note: Figures represent GMAC serviced portfolio
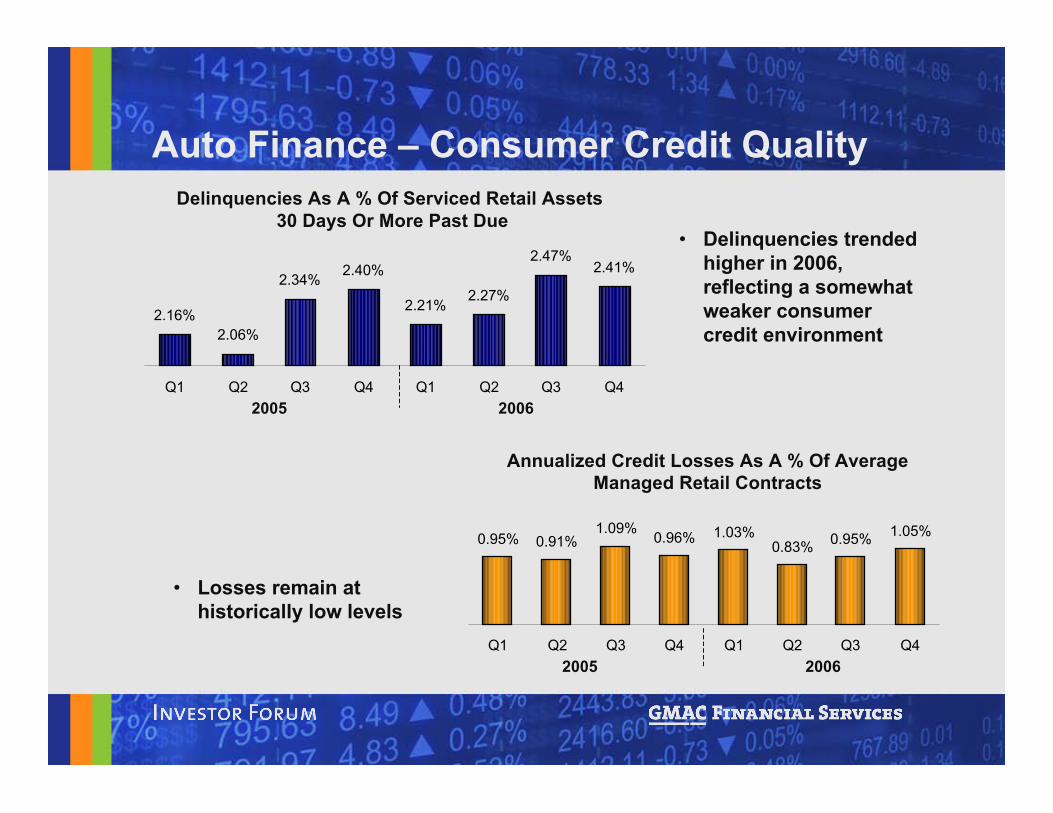
• Delinquencies trendedhigher in 2006,reflecting a somewhatweaker consumercredit environment
• Losses remain athistorically low levels
Annualized Credit Losses As A % Of AverageManaged Retail Contracts
Delinquencies As A % Of Serviced Retail Assets 30 Days Or More Past Due
Auto Finance – Consumer Credit Quality
20062005
2.16%2.06%
2.34% 2.40%
2.21%2.27%
2.47%2.41%
Q1 Q2 Q3 Q4 Q1 Q2 Q3 Q4
2005 2006
0.95% 0.91%1.09% 0.96% 1.03%
0.83% 0.95% 1.05%
Q1 Q2 Q3 Q4 Q1 Q2 Q3 Q4
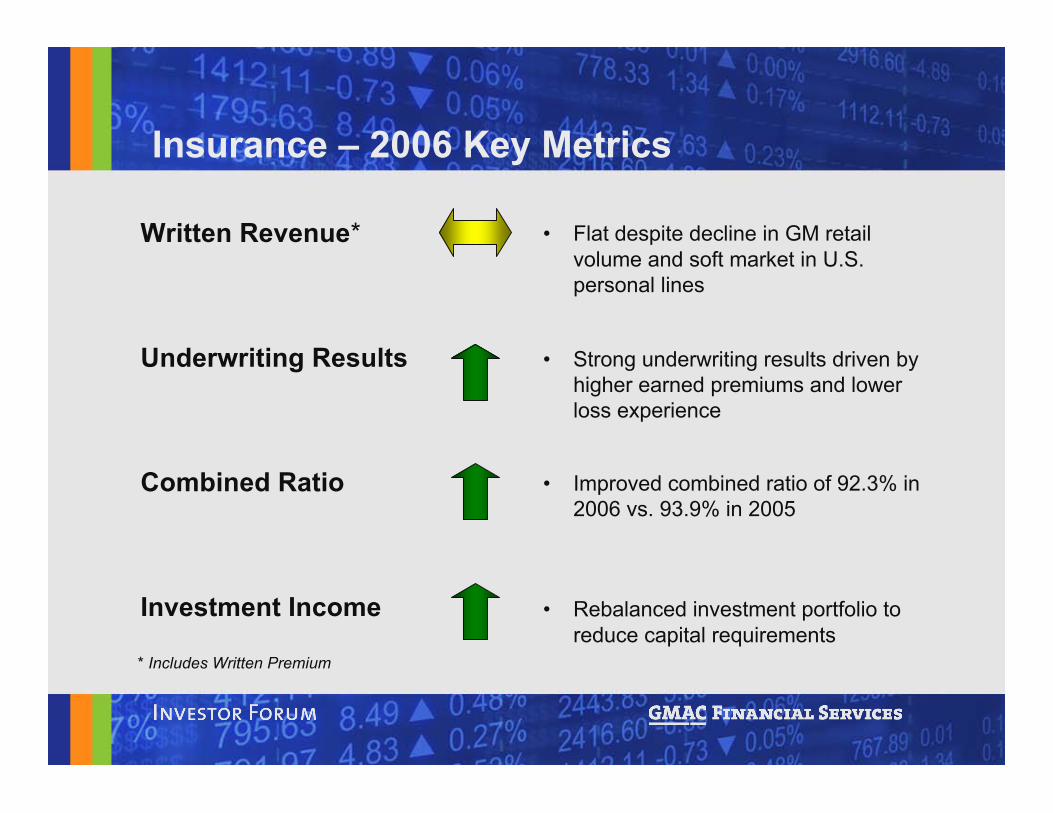
Written Revenue*
Underwriting Results
Combined Ratio
Investment Income
• Flat despite decline in GM retailvolume and soft market in U.S.personal lines
* Includes Written Premium
Insurance – 2006 Key Metrics
• Strong underwriting results driven byhigher earned premiums and lowerloss experience
• Improved combined ratio of 92.3% in2006 vs. 93.9% in 2005
• Rebalanced investment portfolio toreduce capital requirements
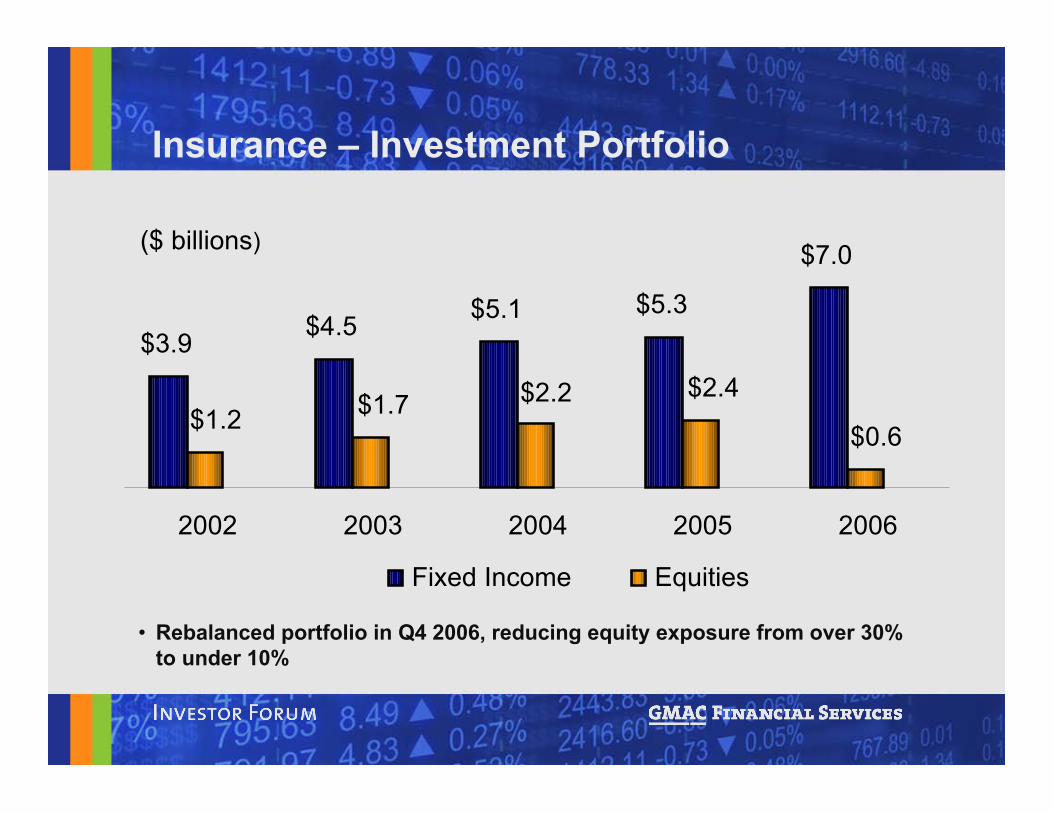
Insurance – Investment Portfolio
• Rebalanced portfolio in Q4 2006, reducing equity exposure from over 30%to under 10%
($ billions)
$3.9 $4.5 $5.1 $5.3
$7.0
$0.6
$2.4$2.2$1.7$1.2
2002 2003 2004 2005 2006
Fixed Income Equities
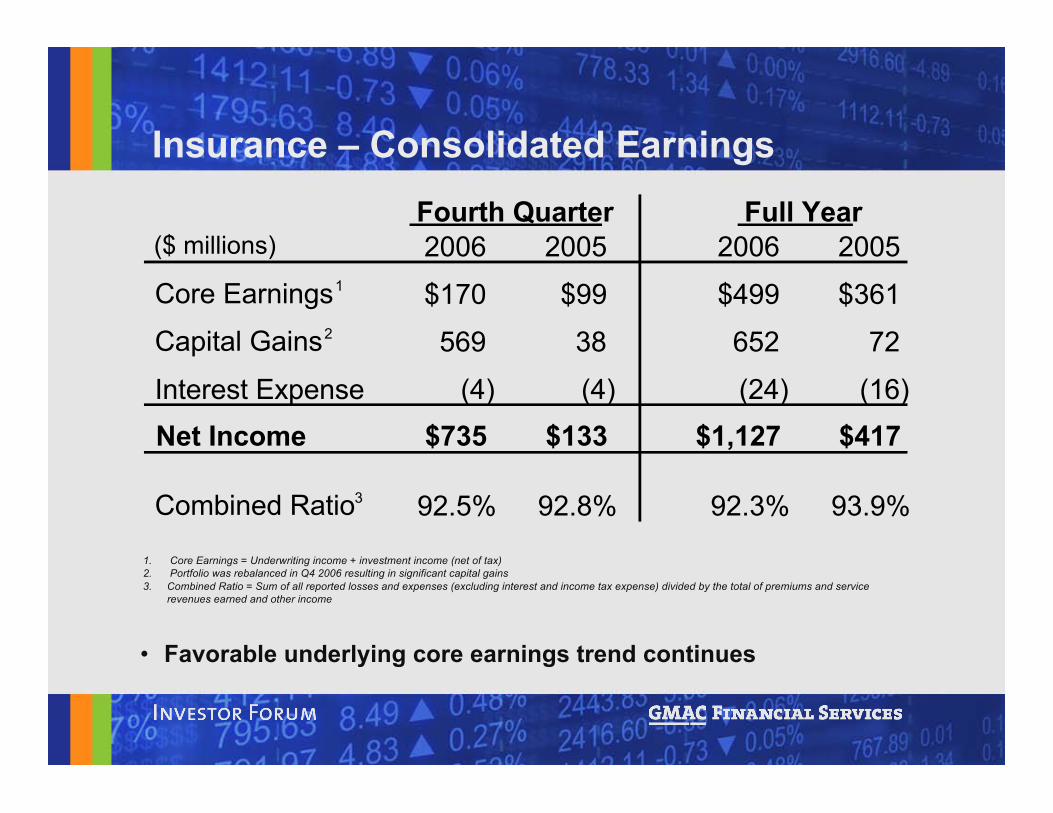
1. Core Earnings = Underwriting income + investment income (net of tax)2. Portfolio was rebalanced in Q4 2006 resulting in significant capital gains3. Combined Ratio = Sum of all reported losses and expenses (excluding interest and income tax expense) divided by the total of premiums and service
revenues earned and other income
• Favorable underlying core earnings trend continues
Insurance – Consolidated Earnings
($ millions) 2006 2005 2006 2005
Core Earnings1 $170 $99 $499 $361
Capital Gains2 569 38 652 72
Interest Expense (4) (4) (24) (16)Net Income $735 $133 $1,127 $417
Combined Ratio3 92.5% 92.8% 92.3% 93.9%
Fourth Quarter Full Year

Cerberusled
InvestorConsortium
The Transaction
51% Equity49% Equity
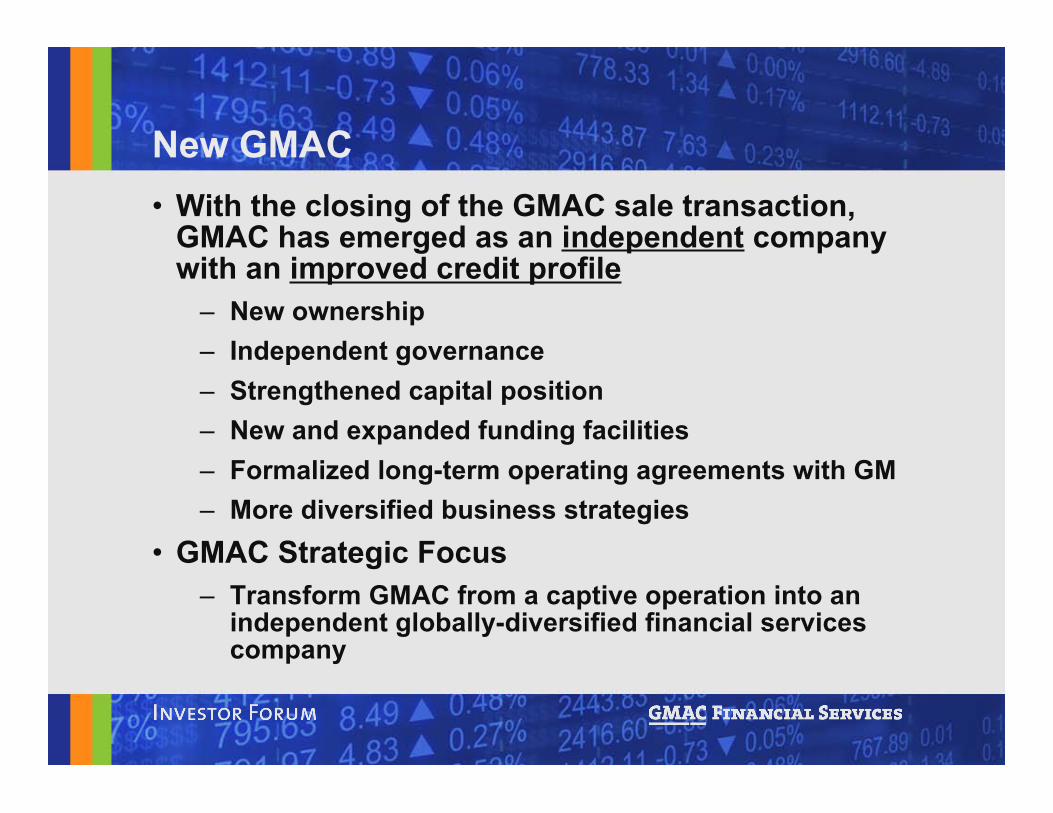
New GMAC• With the closing of the GMAC sale transaction,
GMAC has emerged as an independent companywith an improved credit profile
– New ownership– Independent governance– Strengthened capital position– New and expanded funding facilities– Formalized long-term operating agreements with GM– More diversified business strategies
• GMAC Strategic Focus– Transform GMAC from a captive operation into an
independent globally-diversified financial servicescompany
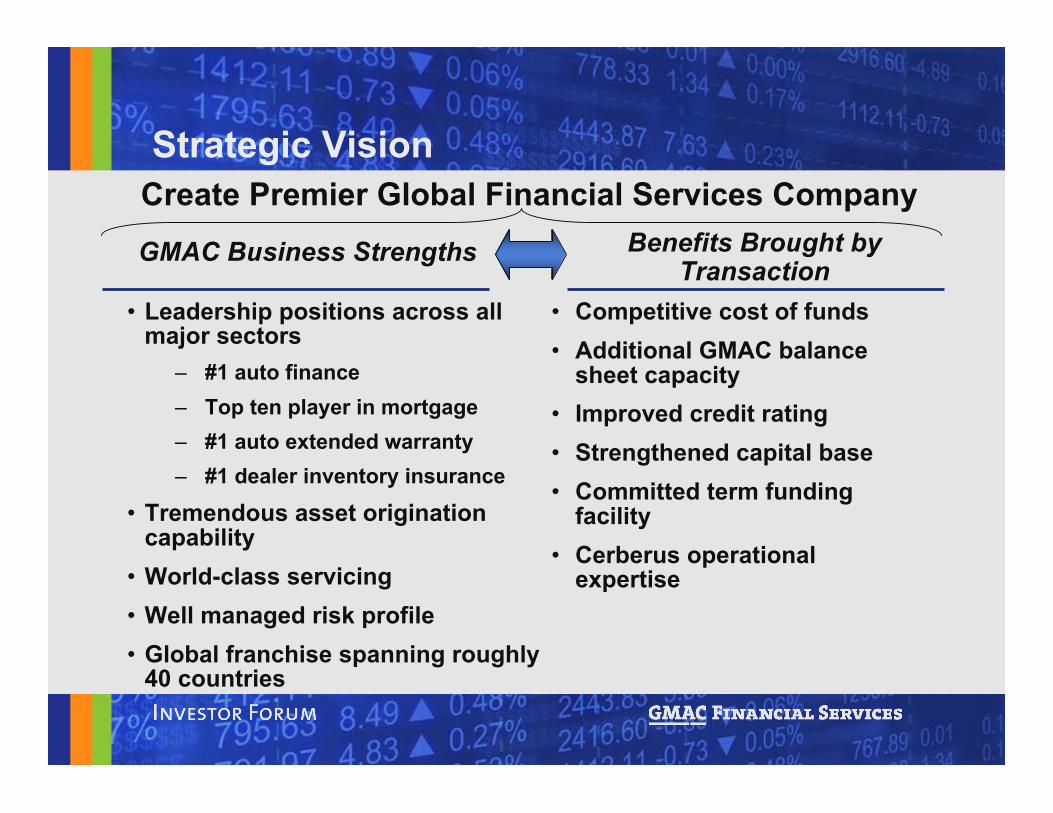
• Leadership positions across allmajor sectors
– #1 auto finance– Top ten player in mortgage– #1 auto extended warranty– #1 dealer inventory insurance
• Tremendous asset originationcapability
• World-class servicing• Well managed risk profile• Global franchise spanning roughly
40 countries
GMAC Business Strengths
• Competitive cost of funds• Additional GMAC balance
sheet capacity• Improved credit rating• Strengthened capital base• Committed term funding
facility• Cerberus operational
expertise
Benefits Brought byTransaction
Create Premier Global Financial Services CompanyStrategic Vision
• Implement changes to U.S. mortgage operations toaddress deteriorating nonprime market environment
– Position business to grow again as industryconsolidates
• Diversify operations beyond GM-related businesses
– Leverage existing dealer relationship to expandpresence beyond GM dealer network
• Continue profitable expansion overseas
– Capitalize on uniquely broad footprint and extensiveexperience in international markets
Strategic Priorities
• Grow GMAC fee-based businesses (e.g., SmartAuction,fee for servicing, etc.)
– Generates cashflow with virtually no strain oncapital position
• Capitalize on cross-sell opportunities across GMAC’s18 million customers
– Sell more products per customer– Reduce asset acquisition cost
• Attack cost side of the business by aligning resourcesmore efficiently across multiple operations and regions
• Maintain asset quality– Further strengthen credit measures and historically
strong credit culture across all major businesses
Strategic Priorities (Continued…)
2007 Outlook• Pressures at ResCap will constrain GMAC results in
the near term– Expect continued pressure from housing prices and
nonprime mortgage market• Highest priority is implementing changes at ResCap
– Sharply reduce nonprime mortgage origination volume– Expand loan remediation activities– Right-size structural cost base– Maximize earnings from other ResCap businesses
2007 Outlook (Continued…)• Global Auto Finance is well positioned to generate
attractive returns– Solid foundation for growth– Cost of funds should improve over time– Revenue diversification
• Insurance is expected to deliver another robust year– Positive underwriting results– Solid investment returns
• GMAC’s long term prospects remain favorable– ResCap’s fundamental earnings potential remains solid– Auto Finance and Insurance operations should mitigate
pressure at ResCap in near term and provide base forgrowth in long term
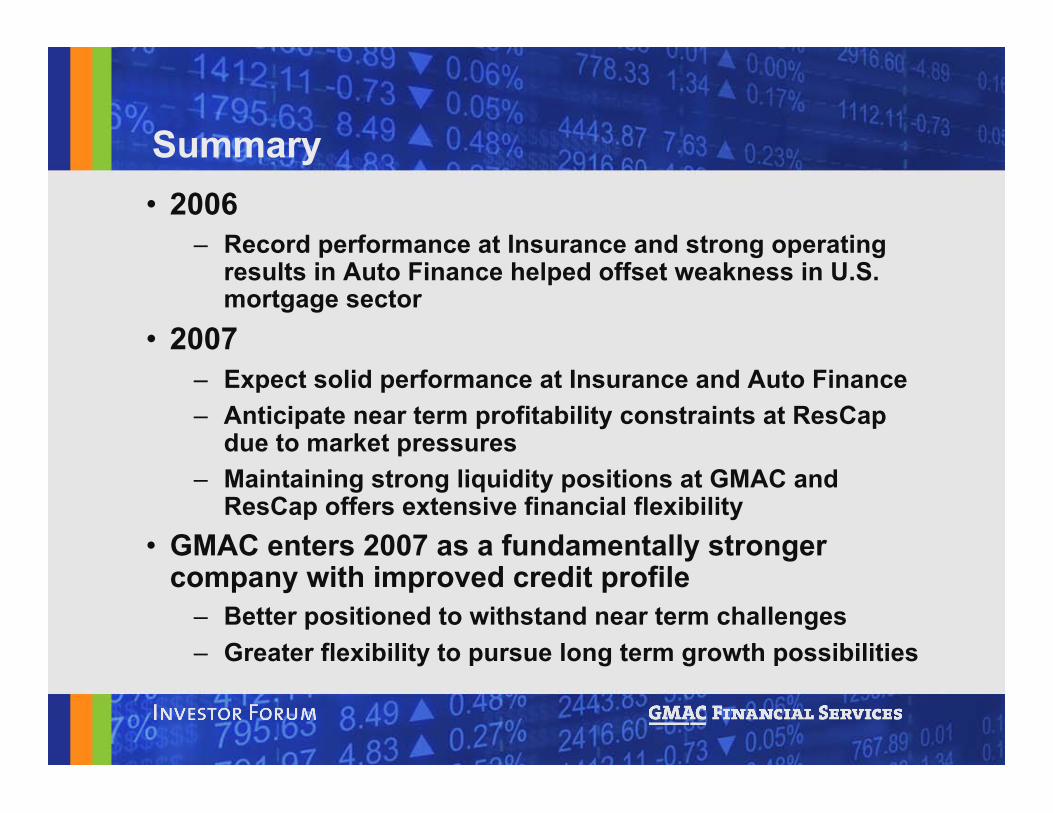
Summary• 2006
– Record performance at Insurance and strong operatingresults in Auto Finance helped offset weakness in U.S.mortgage sector
• 2007– Expect solid performance at Insurance and Auto Finance– Anticipate near term profitability constraints at ResCap
due to market pressures– Maintaining strong liquidity positions at GMAC and
ResCap offers extensive financial flexibility• GMAC enters 2007 as a fundamentally stronger
company with improved credit profile– Better positioned to withstand near term challenges– Greater flexibility to pursue long term growth possibilities


Overview• 2006 Performance
• Near-term Earnings Drivers
• Funding Update
• Credit Profile
• Risk Management Update
• 2007 Outlook
• Conclusion
2006 Performance
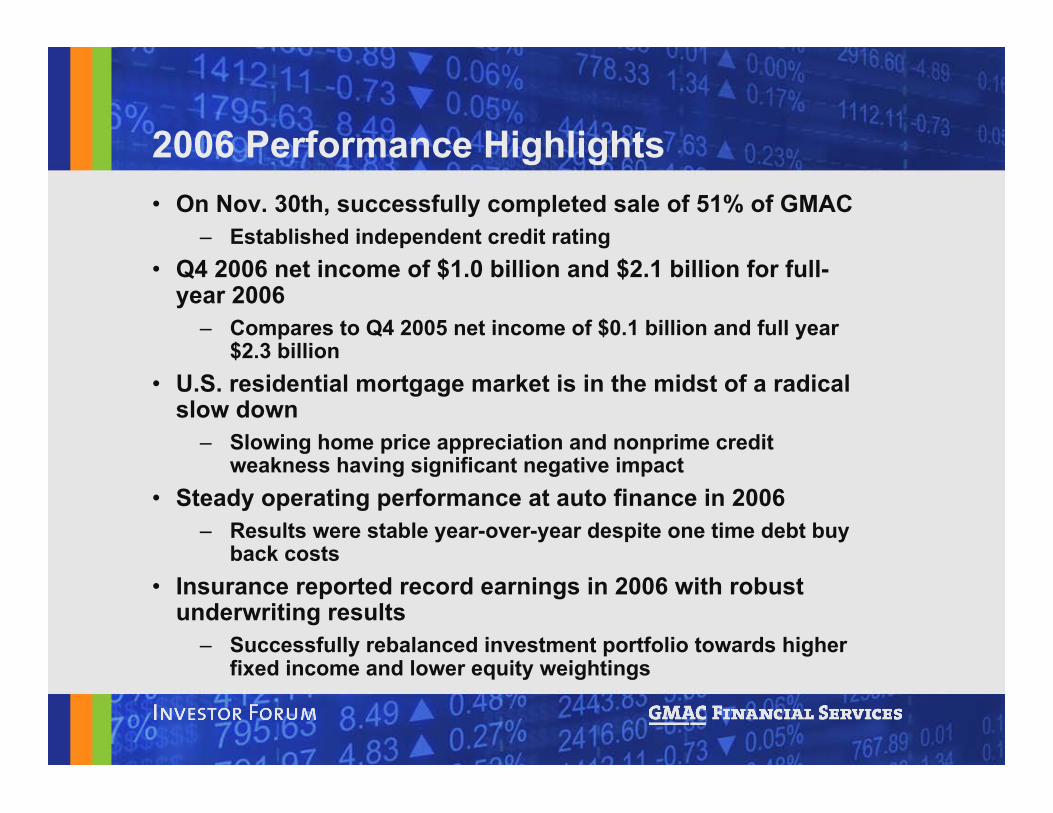
2006 Performance Highlights• On Nov. 30th, successfully completed sale of 51% of GMAC
– Established independent credit rating• Q4 2006 net income of $1.0 billion and $2.1 billion for full-
year 2006– Compares to Q4 2005 net income of $0.1 billion and full year
$2.3 billion• U.S. residential mortgage market is in the midst of a radical
slow down– Slowing home price appreciation and nonprime credit
weakness having significant negative impact• Steady operating performance at auto finance in 2006
– Results were stable year-over-year despite one time debt buyback costs
• Insurance reported record earnings in 2006 with robustunderwriting results
– Successfully rebalanced investment portfolio towards higherfixed income and lower equity weightings
Earnings*
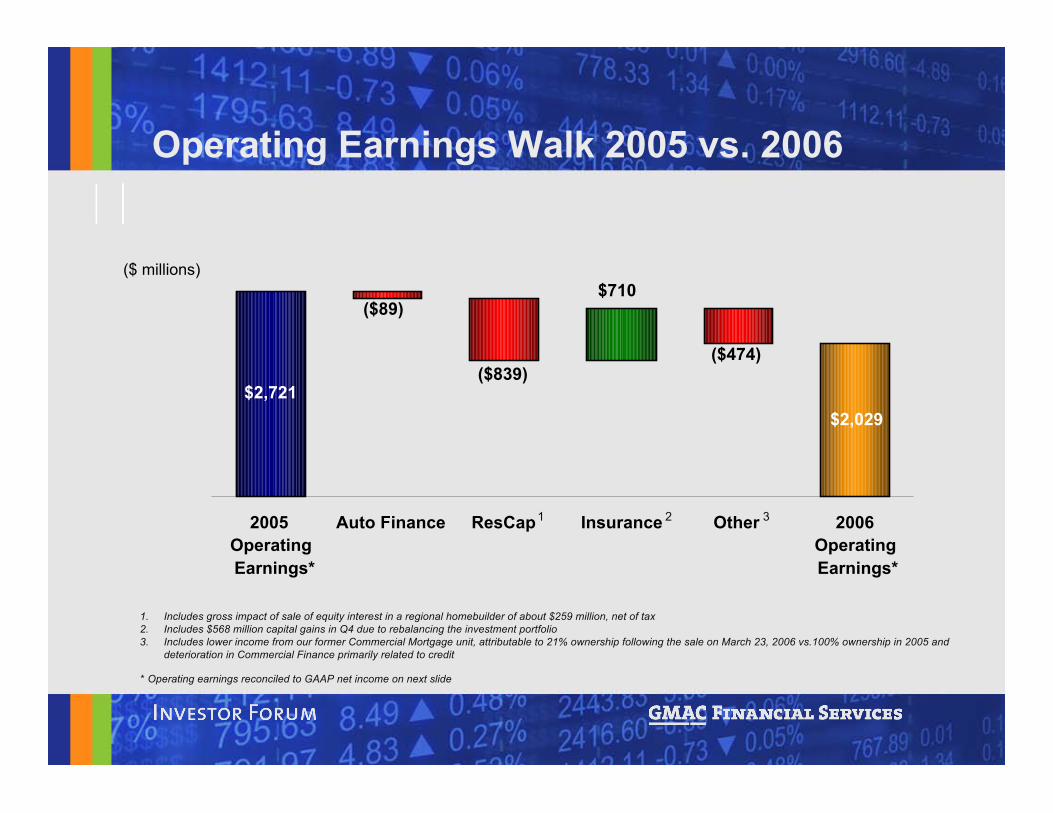
1. Includes gross impact of sale of equity interest in a regional homebuilder of about $259 million, net of tax2. Includes $568 million capital gains in Q4 due to rebalancing the investment portfolio3. Includes lower income from our former Commercial Mortgage unit, attributable to 21% ownership following the sale on March 23, 2006 vs.100% ownership in 2005 and
deterioration in Commercial Finance primarily related to credit
($ millions)
Operating Earnings Walk 2005 vs. 2006
* Operating earnings reconciled to GAAP net income on next slide
1 2 3
$2,029$2,721
$710
($474)
($89)
($839)
2005OperatingEarnings*
Auto Finance ResCap Insurance Other 2006Operating
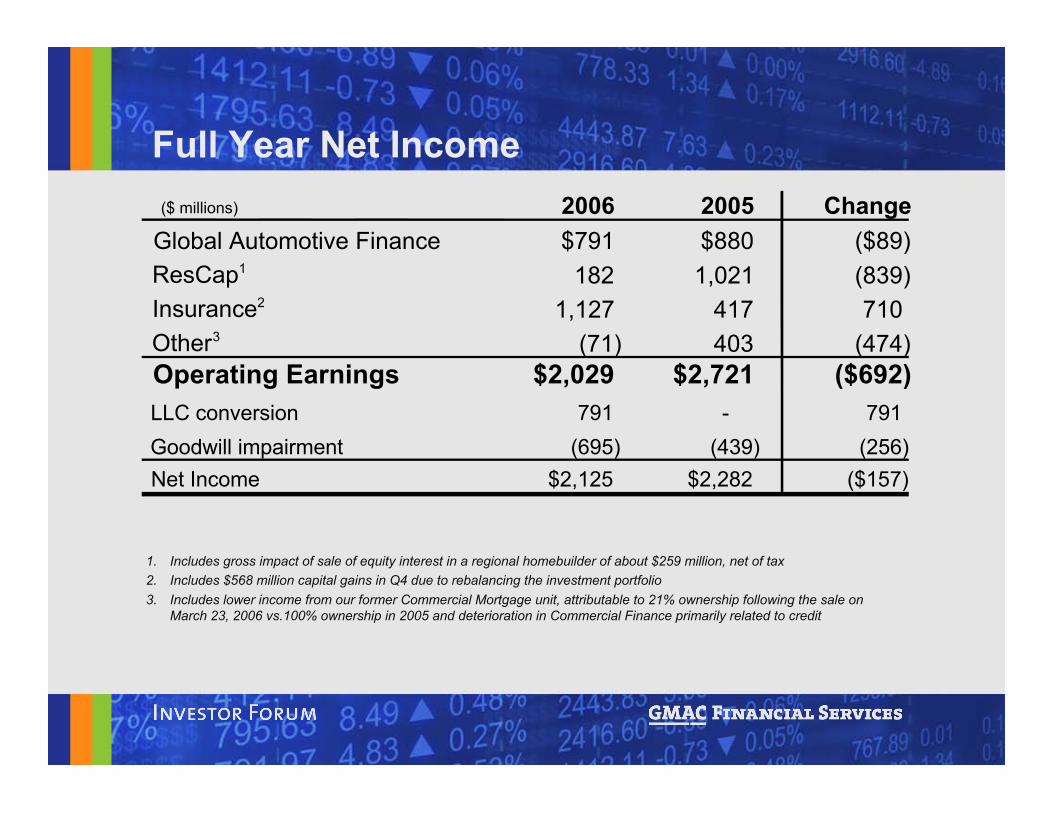
1. Includes gross impact of sale of equity interest in a regional homebuilder of about $259 million, net of tax2. Includes $568 million capital gains in Q4 due to rebalancing the investment portfolio3. Includes lower income from our former Commercial Mortgage unit, attributable to 21% ownership following the sale on
March 23, 2006 vs.100% ownership in 2005 and deterioration in Commercial Finance primarily related to credit
Full Year Net Income($ millions) 2006 2005 Change
Global Automotive Finance $791 $880 ($89)ResCap1 182 1,021 (839)Insurance2 1,127 417 710Other3 (71) 403 (474)Operating Earnings $2,029 $2,721 ($692)LLC conversion 791 - 791 Goodwill impairment (695) (439) (256) Net Income $2,125 $2,282 ($157)
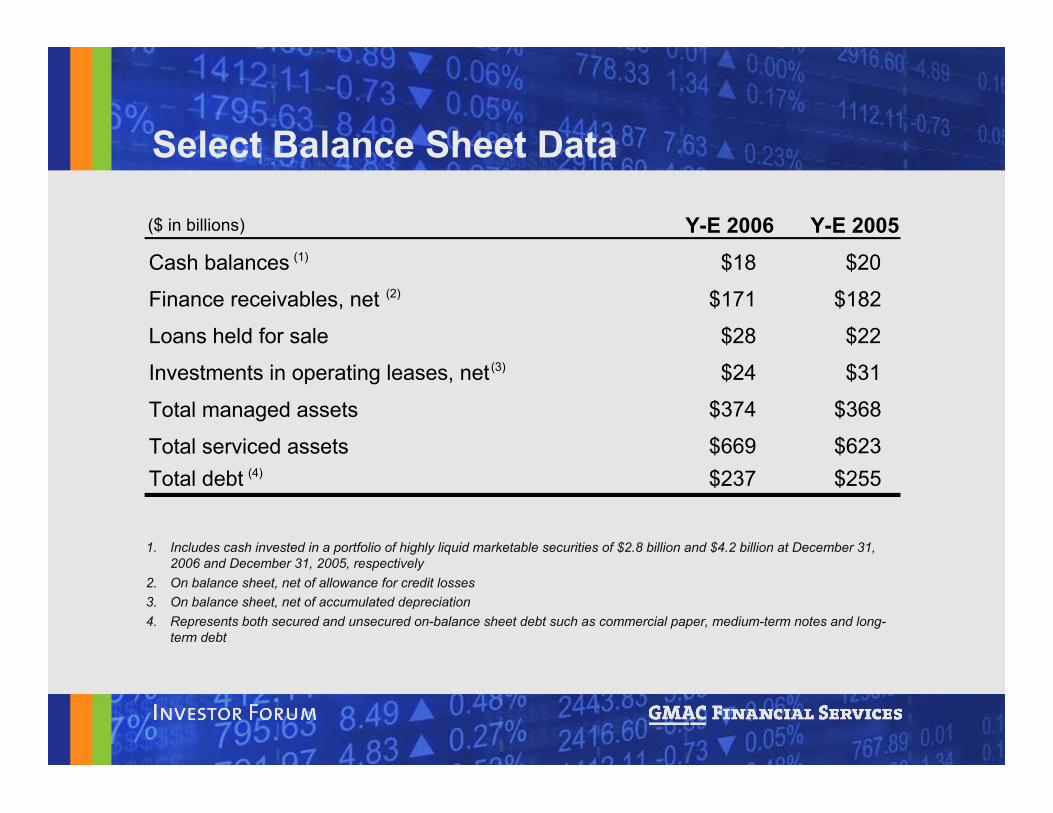
Select Balance Sheet Data
1. Includes cash invested in a portfolio of highly liquid marketable securities of $2.8 billion and $4.2 billion at December 31,2006 and December 31, 2005, respectively
2. On balance sheet, net of allowance for credit losses3. On balance sheet, net of accumulated depreciation4. Represents both secured and unsecured on-balance sheet debt such as commercial paper, medium-term notes and long-
term debt
($ in billions) Y-E 2006 Y-E 2005Cash balances (1) $18 $20
Finance receivables, net (2) $171 $182
Loans held for sale $28 $22
Investments in operating leases, net (3) $24 $31
Total managed assets $374 $368
Total serviced assets $669 $623 Total debt (4) $237 $255
Near-Term EarningsDrivers
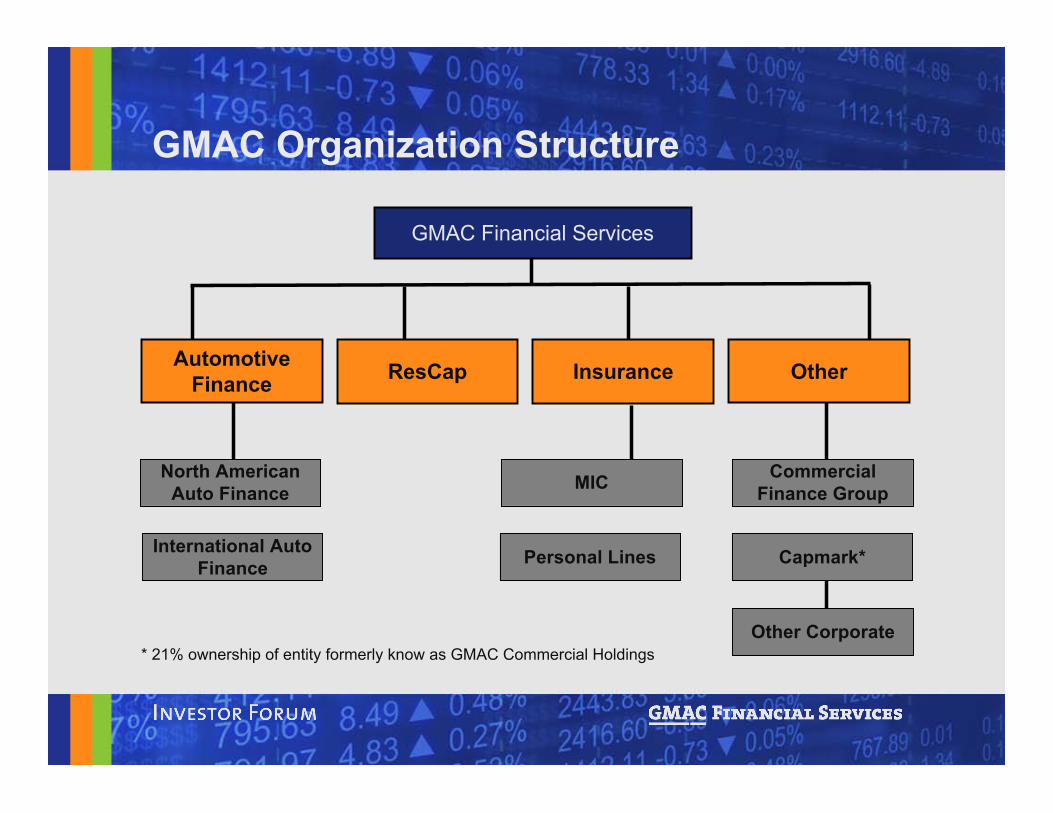
Other Corporate
GMAC Financial Services
North AmericanAuto Finance
International AutoFinance
MIC
Personal Lines
CommercialFinance Group
Capmark*
* 21% ownership of entity formerly know as GMAC Commercial Holdings
GMAC Organization Structure
AutomotiveFinance InsuranceResCap Other
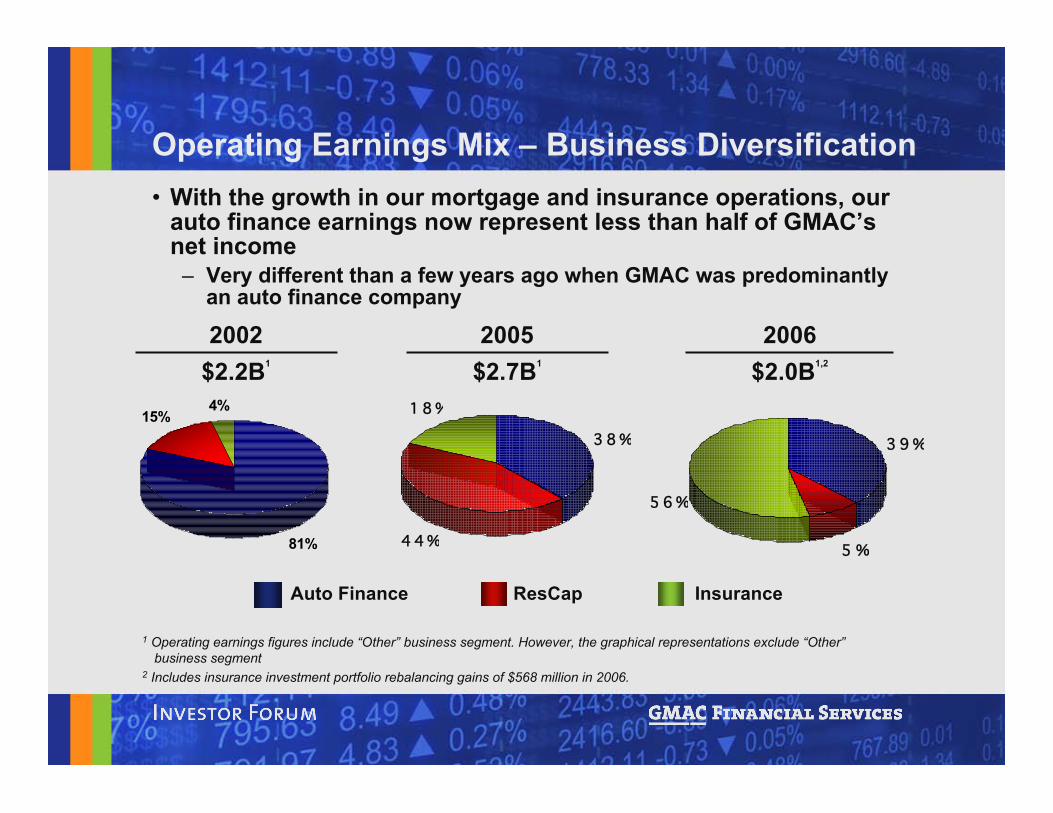
• With the growth in our mortgage and insurance operations, ourauto finance earnings now represent less than half of GMAC’snet income– Very different than a few years ago when GMAC was predominantly
an auto finance company
81%
15%4%
5 %
3 9%
5 6%
3 8%
4 4%
1 8%
Auto Finance ResCap
2005$2.7B1
2006$2.0B1,2
Insurance
2002$2.2B1
1 Operating earnings figures include “Other” business segment. However, the graphical representations exclude “Other”business segment
2 Includes insurance investment portfolio rebalancing gains of $568 million in 2006.
Operating Earnings Mix – Business Diversification
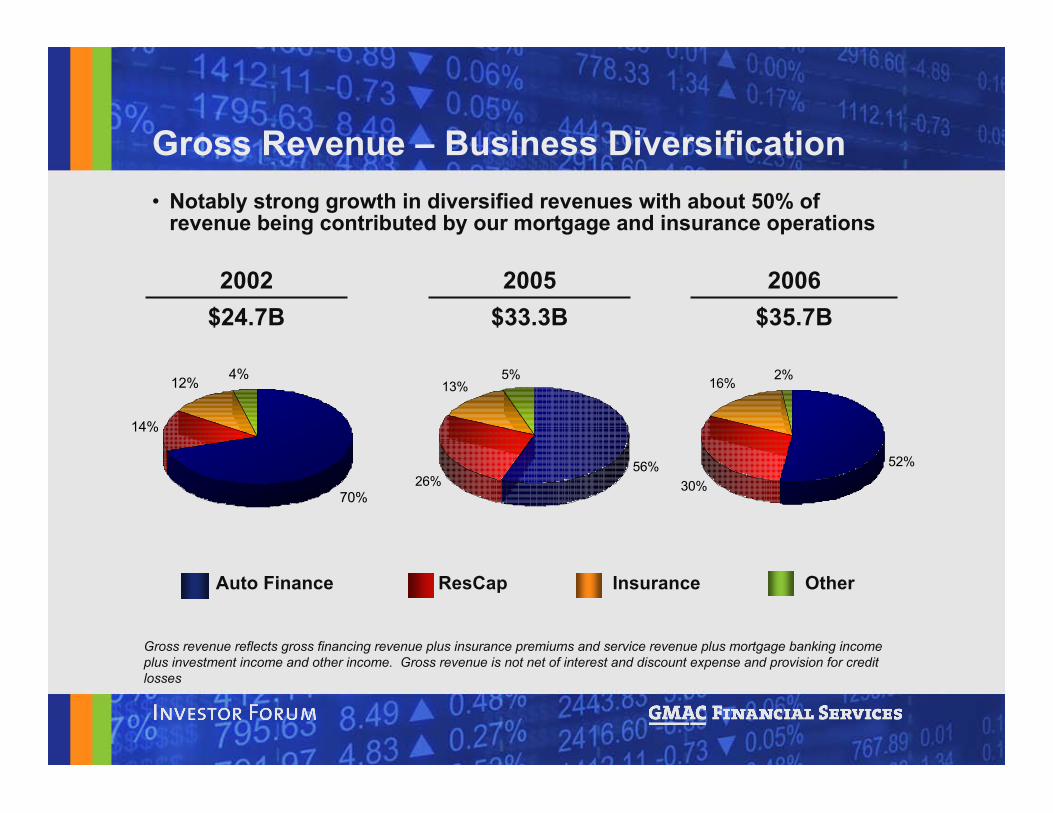
Gross Revenue – Business Diversification• Notably strong growth in diversified revenues with about 50% of
revenue being contributed by our mortgage and insurance operations
70%
14%
12% 4%
52%
30%
16% 2%
Gross revenue reflects gross financing revenue plus insurance premiums and service revenue plus mortgage banking incomeplus investment income and other income. Gross revenue is not net of interest and discount expense and provision for creditlosses
56%
26%
13%5%
2005$33.3B
2006$35.7B
2002$24.7B
Auto Finance ResCap Insurance Other
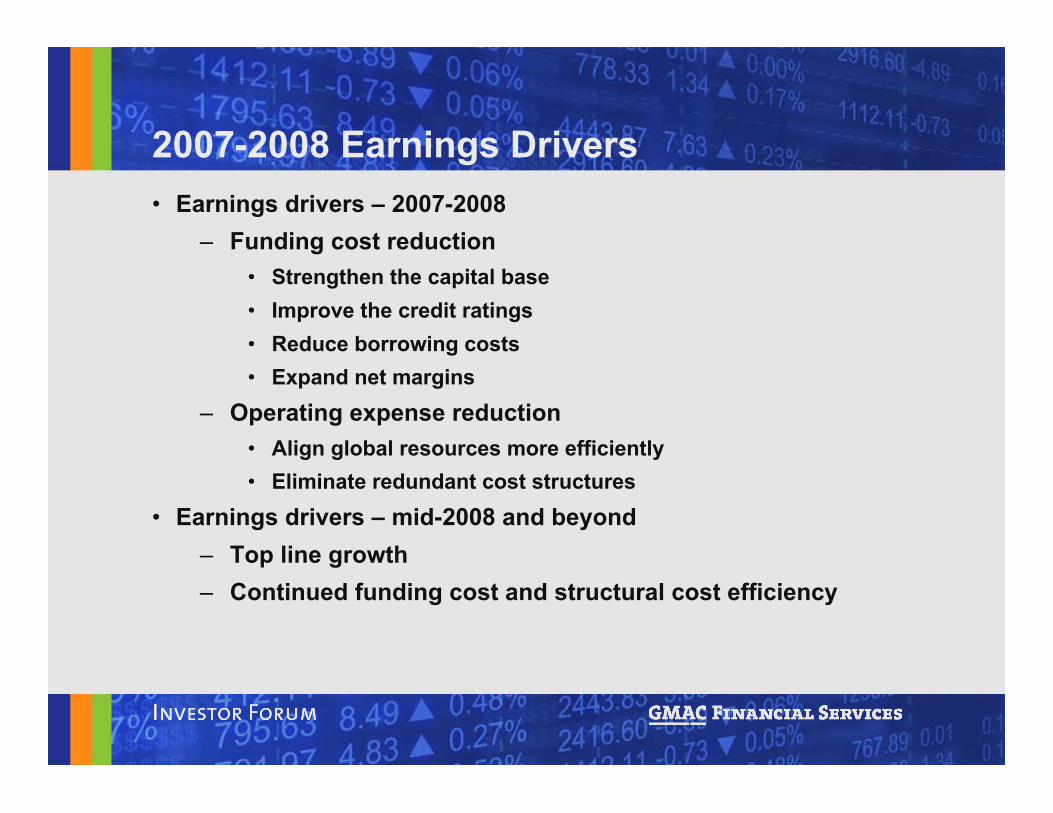
2007-2008 Earnings Drivers• Earnings drivers – 2007-2008
– Funding cost reduction• Strengthen the capital base• Improve the credit ratings• Reduce borrowing costs• Expand net margins
– Operating expense reduction• Align global resources more efficiently• Eliminate redundant cost structures
• Earnings drivers – mid-2008 and beyond– Top line growth– Continued funding cost and structural cost efficiency
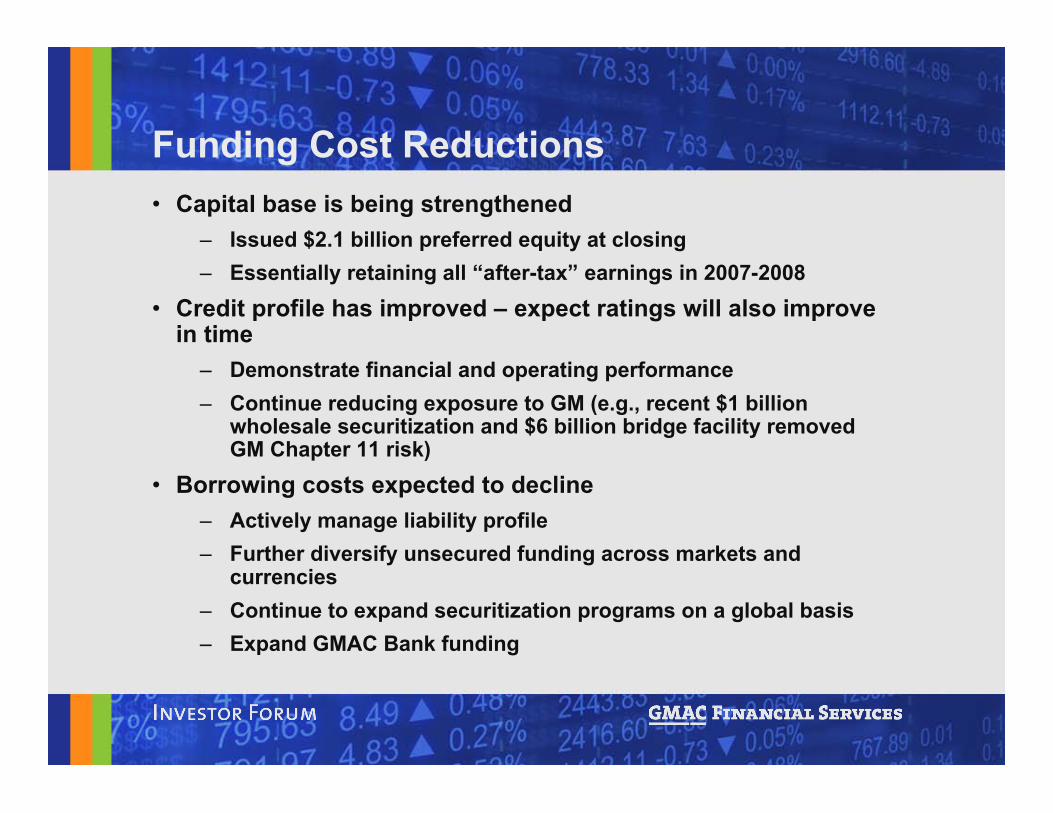
Funding Cost Reductions• Capital base is being strengthened
– Issued $2.1 billion preferred equity at closing– Essentially retaining all “after-tax” earnings in 2007-2008
• Credit profile has improved – expect ratings will also improvein time
– Demonstrate financial and operating performance– Continue reducing exposure to GM (e.g., recent $1 billion
wholesale securitization and $6 billion bridge facility removedGM Chapter 11 risk)
• Borrowing costs expected to decline– Actively manage liability profile– Further diversify unsecured funding across markets and
currencies– Continue to expand securitization programs on a global basis– Expand GMAC Bank funding
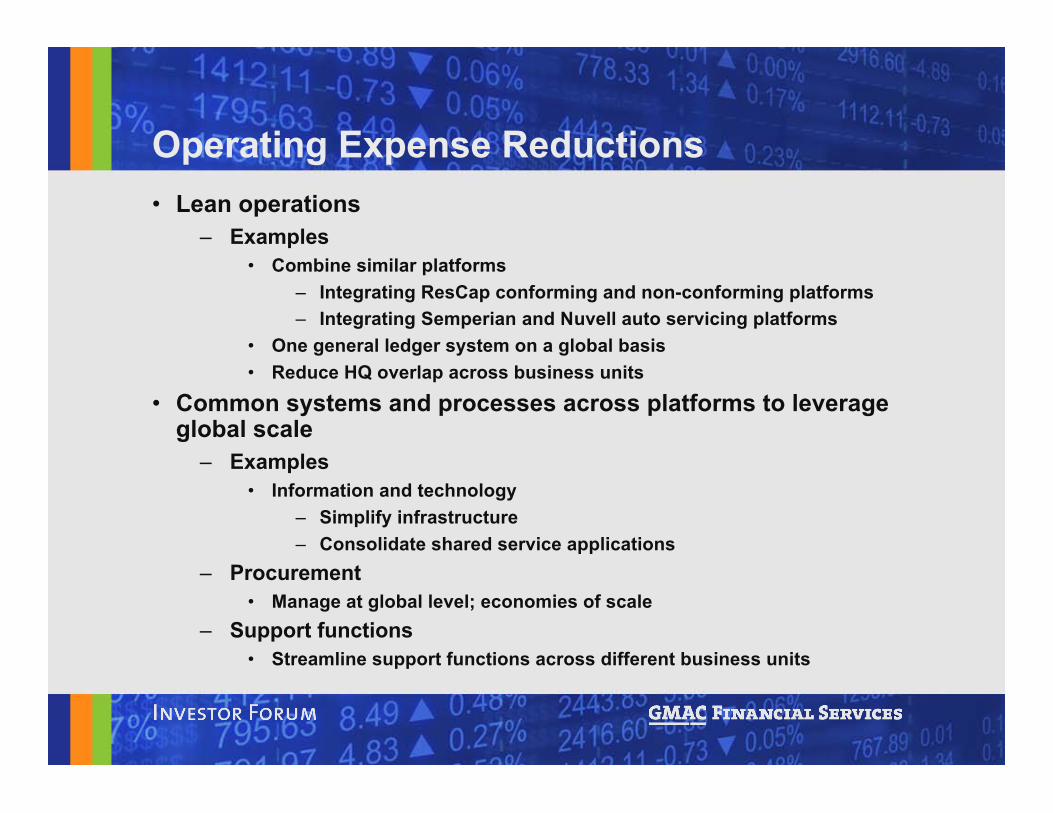
Operating Expense Reductions• Lean operations
– Examples• Combine similar platforms
– Integrating ResCap conforming and non-conforming platforms– Integrating Semperian and Nuvell auto servicing platforms
• One general ledger system on a global basis• Reduce HQ overlap across business units
• Common systems and processes across platforms to leverageglobal scale
– Examples• Information and technology
– Simplify infrastructure– Consolidate shared service applications
– Procurement• Manage at global level; economies of scale
– Support functions• Streamline support functions across different business units
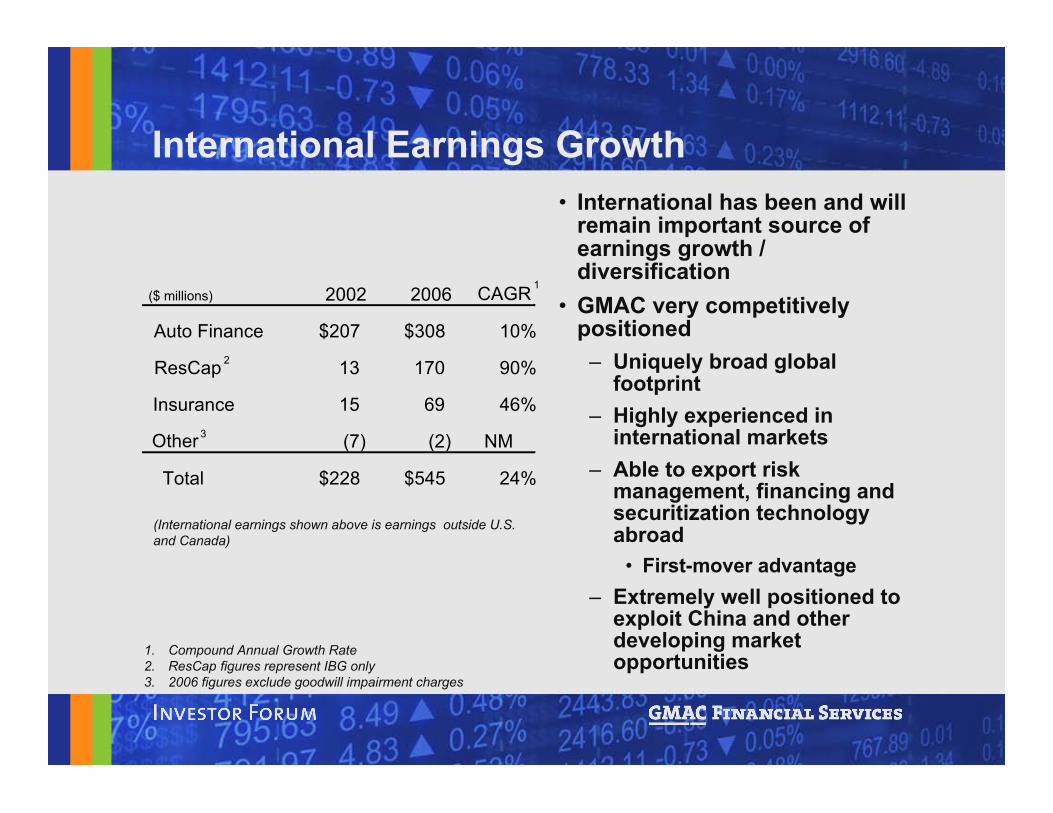
1. Compound Annual Growth Rate2. ResCap figures represent IBG only3. 2006 figures exclude goodwill impairment charges
International Earnings Growth• International has been and will
remain important source ofearnings growth /diversification
• GMAC very competitivelypositioned
– Uniquely broad globalfootprint
– Highly experienced ininternational markets
– Able to export riskmanagement, financing andsecuritization technologyabroad
• First-mover advantage– Extremely well positioned to
exploit China and otherdeveloping marketopportunities
(International earnings shown above is earnings outside U.S.and Canada)
($ millions) 2002 2006 CAGR 1
Auto Finance $207 $308 10%
ResCap 13 170 90%
Insurance 15 69 46%
Other3 (7) (2) NM
Total $228 $545 24%
2
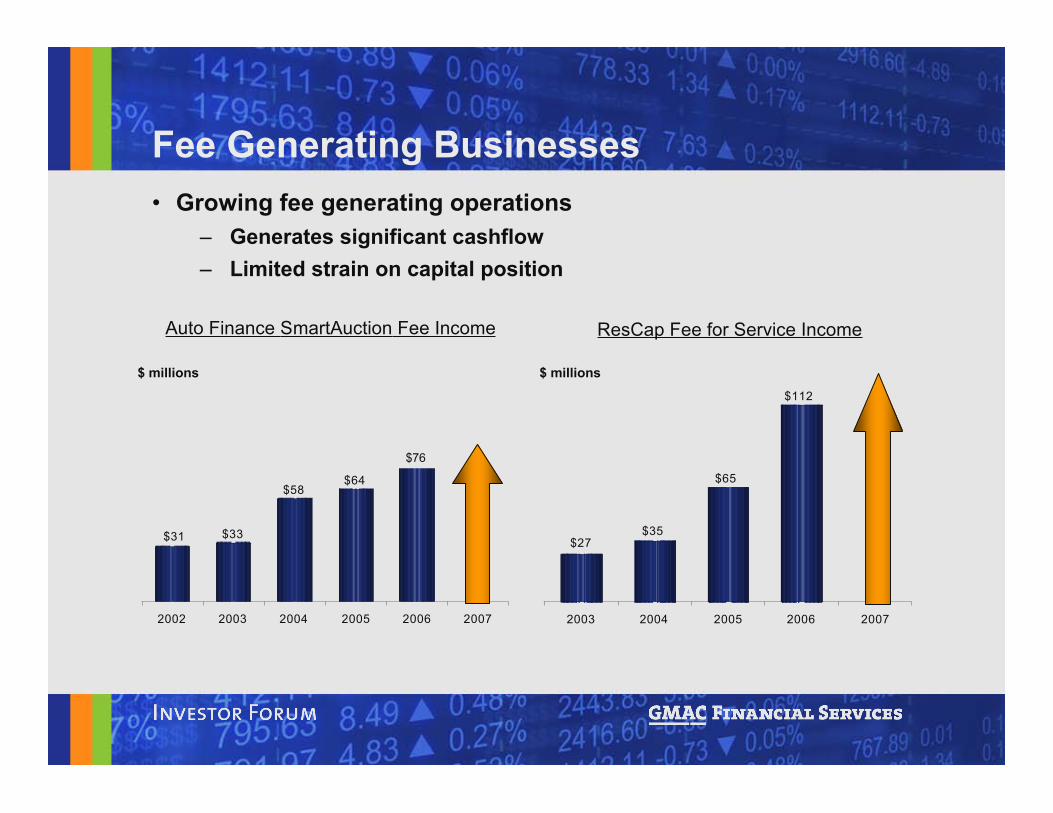
Fee Generating Businesses• Growing fee generating operations
– Generates significant cashflow– Limited strain on capital position
Auto Finance SmartAuction Fee Income
$ millions $ millions
ResCap Fee for Service Income
$64$58
$33$31
75
2002 2003 2004 2005 2006 2007
$112
$65
$35$27
2003 2004 2005 2006 2007
$76
Funding Update
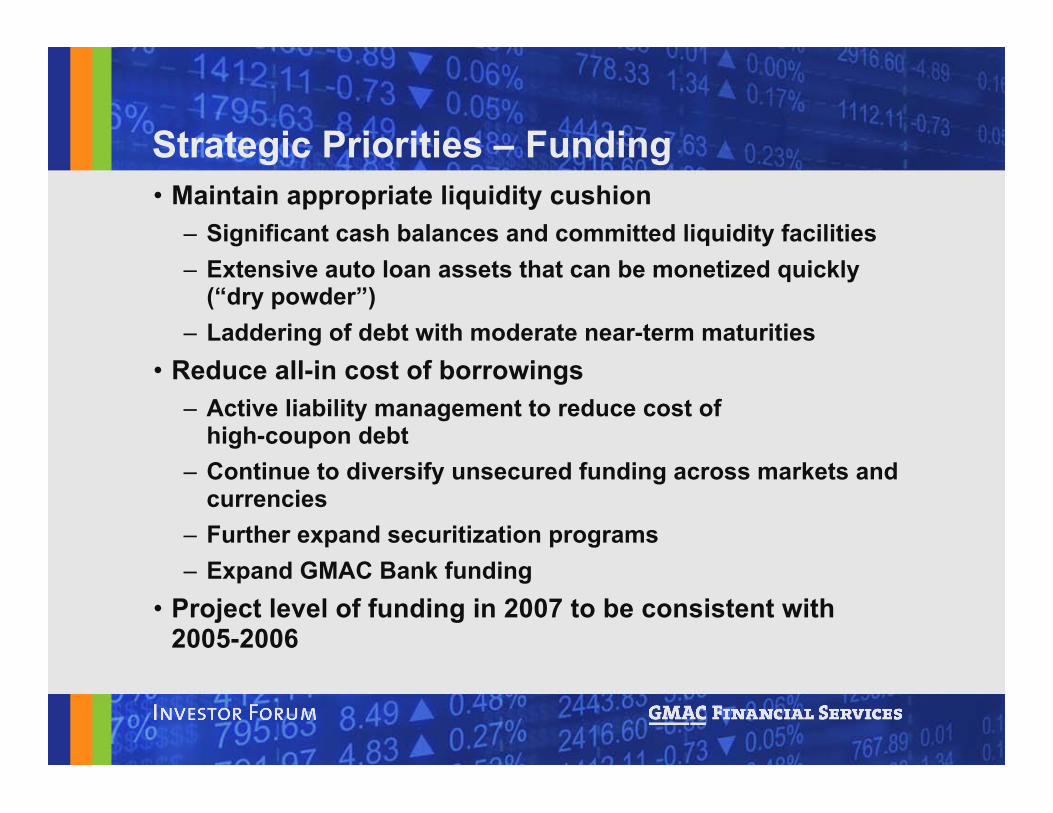
• Maintain appropriate liquidity cushion– Significant cash balances and committed liquidity facilities– Extensive auto loan assets that can be monetized quickly
(“dry powder”)– Laddering of debt with moderate near-term maturities
• Reduce all-in cost of borrowings– Active liability management to reduce cost of
high-coupon debt– Continue to diversify unsecured funding across markets and
currencies– Further expand securitization programs– Expand GMAC Bank funding
• Project level of funding in 2007 to be consistent with2005-2006
Strategic Priorities – Funding
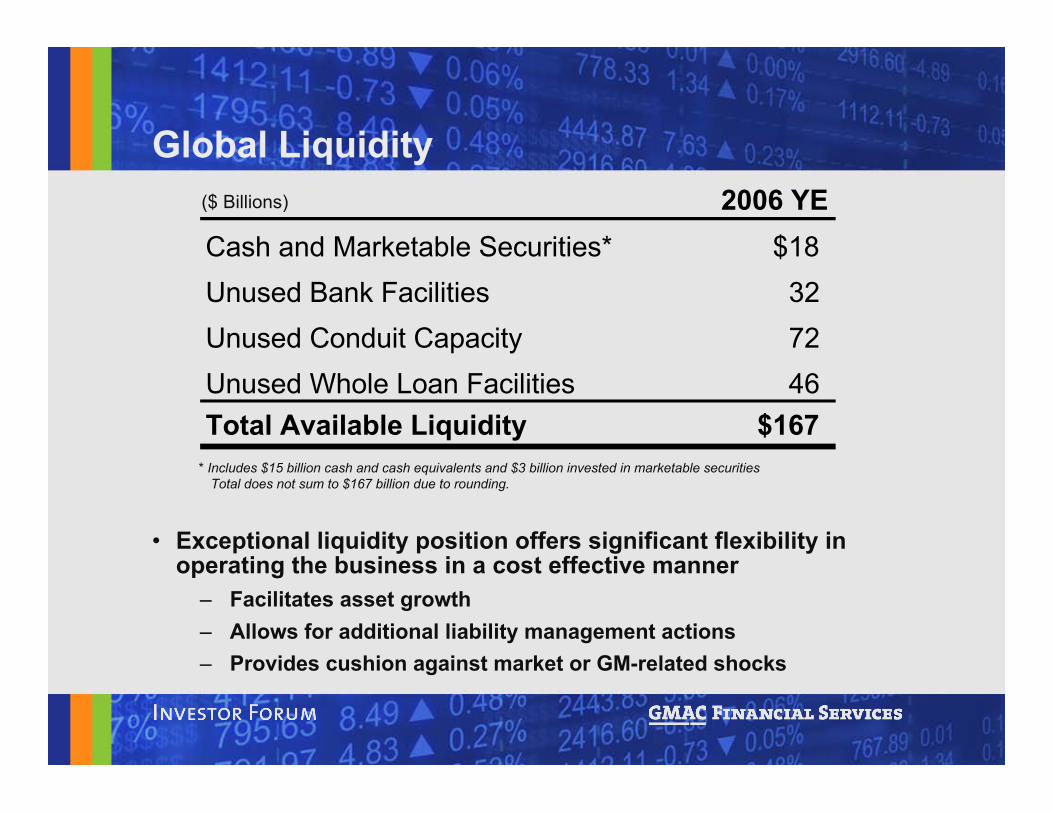
($ Billions)
Global Liquidity
• Exceptional liquidity position offers significant flexibility inoperating the business in a cost effective manner
– Facilitates asset growth– Allows for additional liability management actions– Provides cushion against market or GM-related shocks
* Includes $15 billion cash and cash equivalents and $3 billion invested in marketable securitiesTotal does not sum to $167 billion due to rounding.
2006 YECash and Marketable Securities* $18Unused Bank Facilities 32Unused Conduit Capacity 72Unused Whole Loan Facilities 46Total Available Liquidity $167
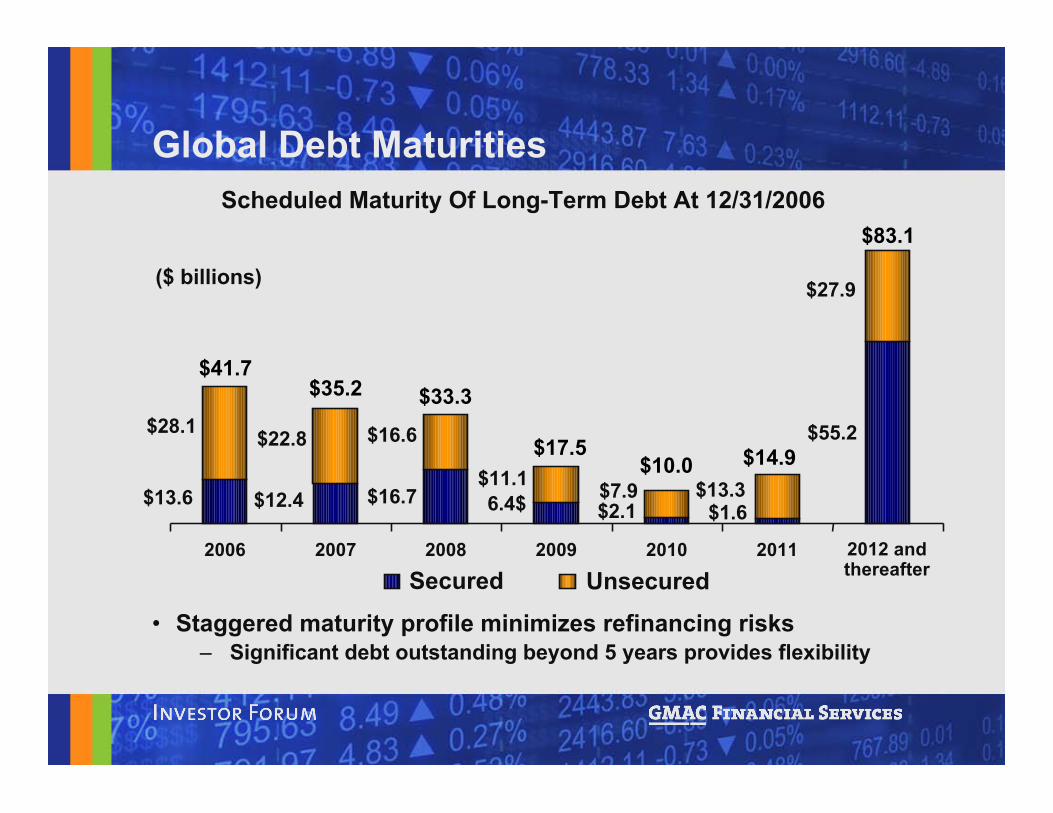
Global Debt Maturities
• Staggered maturity profile minimizes refinancing risks– Significant debt outstanding beyond 5 years provides flexibility
Scheduled Maturity Of Long-Term Debt At 12/31/2006
13.6 12.46.4
2.1 1.6
55.228.122.8 16.6
11.1
7.913.3
27.9
16.7
2006
2007
2008
2009
2010
2011
2012 a
nd there
after
Unsecured
Secured
UnsecuredSecured
$13.6 $12.4 6.4$ $2.1 $1.6
$55.2$28.1 $22.8 $16.6
$11.1 $7.9 $13.3
$27.9
$16.7
2006 2007 2008 2009 2010 2011 2012 andthereafter
$83.1
$35.2 $33.3
$17.5$10.0 $14.9
$41.7
($ billions)
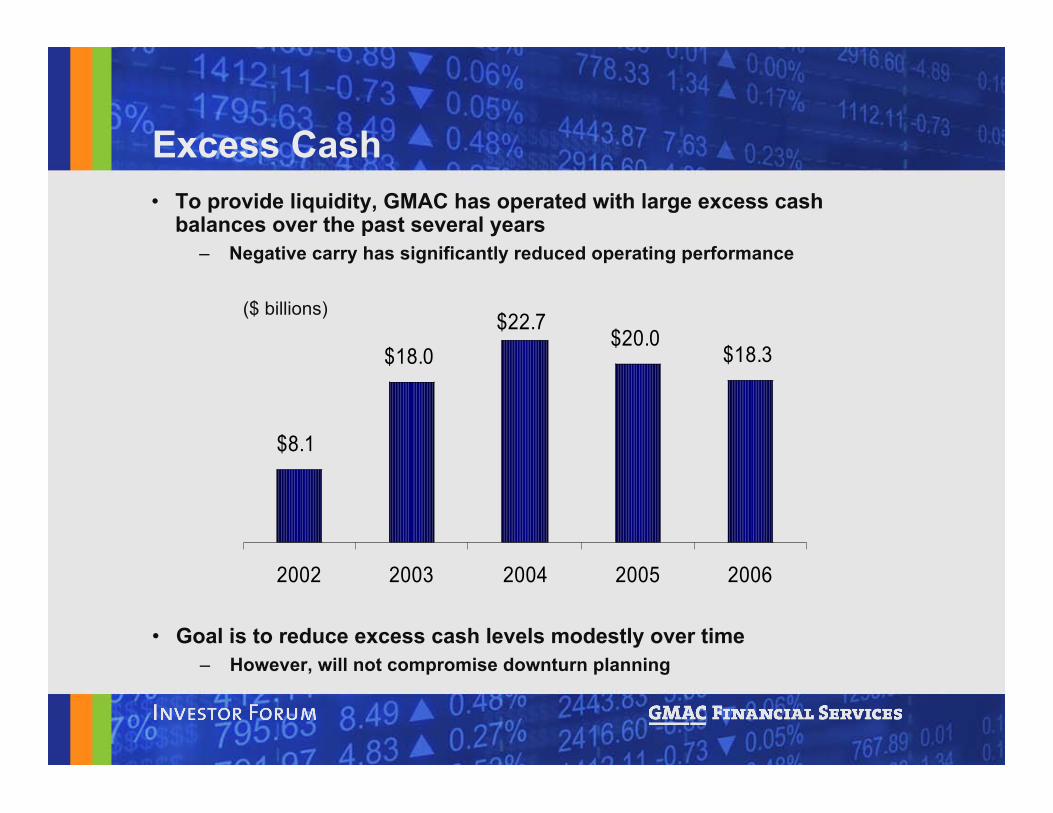
Excess Cash
• Goal is to reduce excess cash levels modestly over time– However, will not compromise downturn planning
$8.1
$18.0
$22.7$20.0
$18.3
2002 2003 2004 2005 2006
($ billions)
• To provide liquidity, GMAC has operated with large excess cashbalances over the past several years
– Negative carry has significantly reduced operating performance
Calls / Tenders• From time to time, GMAC redeems debt before maturity
– Such redemptions consist of calls, tender offers and open marketrepurchases
• Objective of the calls / tenders is to– Manage cash portfolio (short dated debt)– Reduce funding costs (longer dated debt)– Adjust overall liability profile (short and longer dated debt)
• Recent examples from 2006– Completed a $1 billion tender offer for certain high cost deferred
interest bonds• Represented some of GMAC’s most expensive debt
– Called $855 million of SmartNotes• Will continue to manage our liability profile as appropriate
– Called $620 million of debt to date in 2007
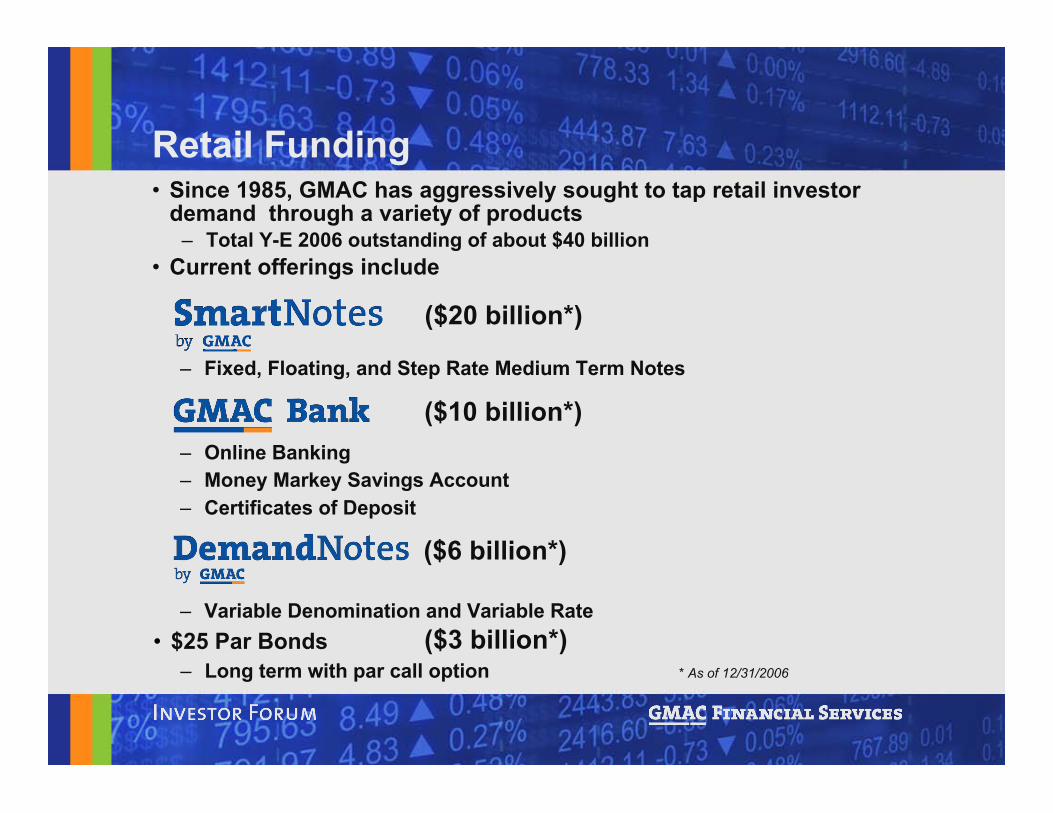
Retail Funding• Since 1985, GMAC has aggressively sought to tap retail investor
demand through a variety of products– Total Y-E 2006 outstanding of about $40 billion
• Current offerings include
($6 billion*)
– Variable Denomination and Variable Rate
– Online Banking– Money Markey Savings Account– Certificates of Deposit
($10 billion*)– Fixed, Floating, and Step Rate Medium Term Notes
($20 billion*)
• $25 Par Bonds ($3 billion*)* As of 12/31/2006– Long term with par call option
Institutional Unsecured Funding• GMAC has long been a frequent issuer of
unsecured debt globally– After a period of minimal activity during 2005 / 2006
due to market volatility, GMAC re-entered the bondmarket in December 2006
• $1 billion 5 year transaction was heavily oversubscribed• Mixed ratings drove participation from high yield and high
grade investors
• 2007 funding is likely to include some additionalunsecured financing
– Continue to diversify funding across markets,currencies and investor bases
– Will be responsive to investor demand and marketenvironment
Expanding Auto ABS• GMAC continues to expand its auto securitization capabilities• Geographic reach to top international countries
U.S. Canada Australia GermanyMexico Netherlands U.K. New ZealandEcuador Argentina Italy
• Securitization sale of all major auto asset classes– Prime and nonprime retail– Retail whole loans– Dealer floorplan and dealer loans– Operating / full-service lease
• Diversification of structures permits issuing to investor demand– Money markets and term markets– Public and private markets– Fixed and floating– Revolving and amortizing
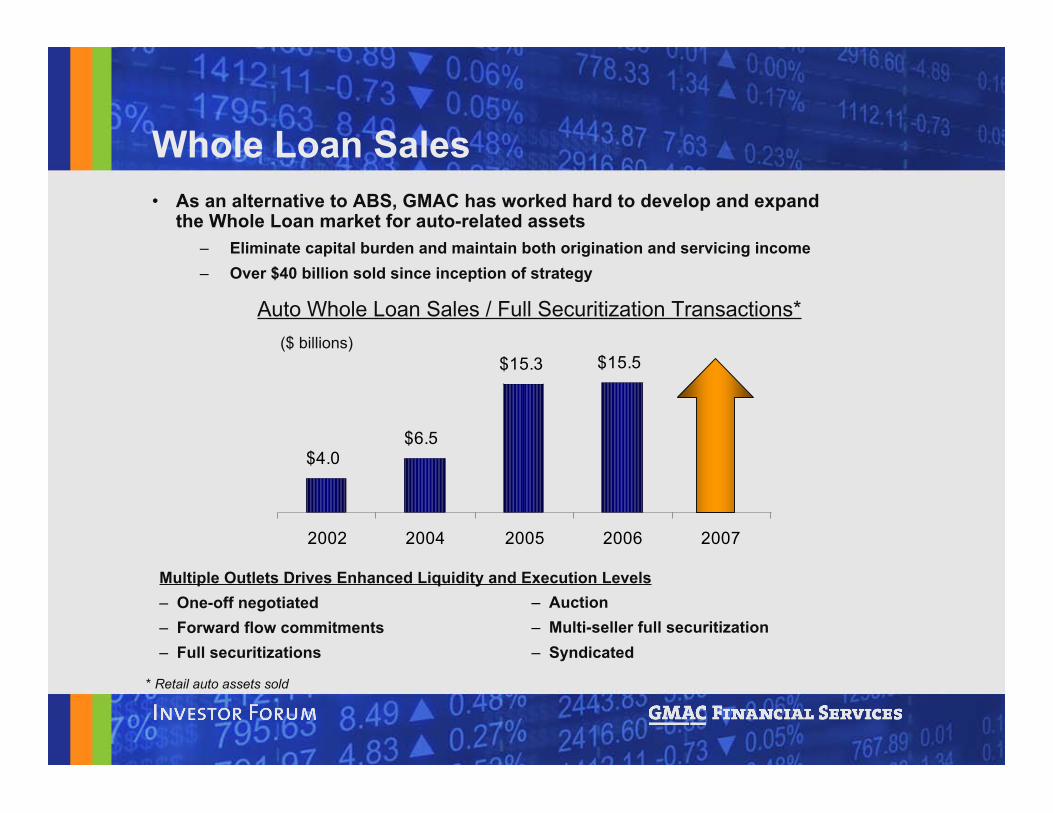
Whole Loan Sales• As an alternative to ABS, GMAC has worked hard to develop and expand
the Whole Loan market for auto-related assets– Eliminate capital burden and maintain both origination and servicing income– Over $40 billion sold since inception of strategy
$4.0
$6.5
$15.3 $15.5
2002 2004 2005 2006 2007
Auto Whole Loan Sales / Full Securitization Transactions*
Multiple Outlets Drives Enhanced Liquidity and Execution Levels– One-off negotiated – Forward flow commitments – Full securitizations
* Retail auto assets sold
($ billions)
– Auction – Multi-seller full securitization – Syndicated
Wholesale Securitization Update• GMAC has been an active issuer of wholesale securitizations
since 1994• Through 2006, U.S. transactions included an amortization trigger in
the event of a GM Chapter 11 bankruptcy filing• New $1 billion wholesale securitization structure launched last month
– Structure does not include GM Chapter 11 bankruptcy trigger– Future wholesale transactions will also exclude the Chapter 11
trigger• Recently completed $6 billion bridge funding facility to provide added
liquidity protection for older wholesale securitizations– Would help manage early amortization in the unlikely event of
GM Chapter 11 filing– This facility along with the $10 billion secured facility executed
last August as part of the sale addressed the liquidity riskassociated with GM Chapter 11
• Key rating agency concern now mostly mitigated
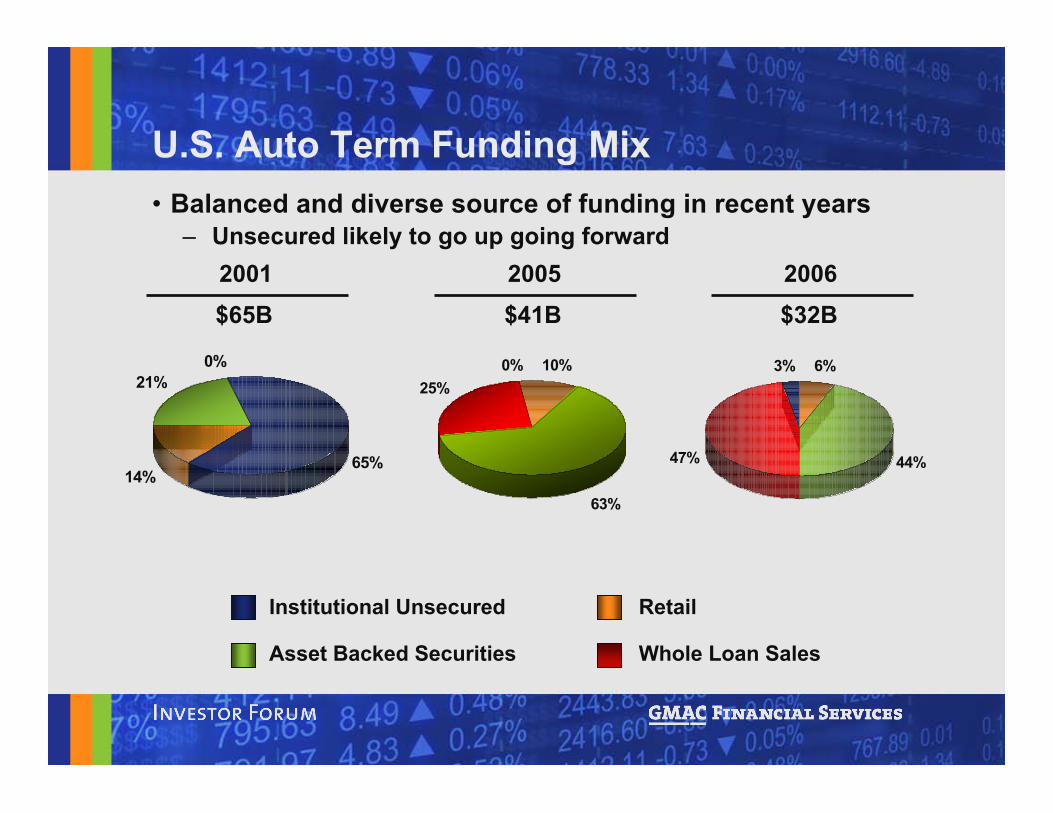
Asset Backed Securities
Institutional Unsecured
Whole Loan Sales
Retail
U.S. Auto Term Funding Mix
2001$65B
2005$41B
2006$32B
14%
21%0%
65%
0% 10%
63%
25%
47%
3% 6%
44%
• Balanced and diverse source of funding in recent years– Unsecured likely to go up going forward
Funding Summary• Continuous focus on exceptional liquidity and reducing cost
– Delicate balance will be maintained
• Core issuance philosophy of diversification helps manage bothobjectives
– Secured and unsecured, whole loans and deposits– Private and public– Retail and institutional– Tenors from overnight to 40 years– Full range of risk transfer
• May sell only AAAs or all the way to residuals
– All major currencies and markets• GBP, CAD, EUR, USD, JPY and more
• Will continue to balance prudent liquidity management withreductions in costs of borrowing
Credit Profile
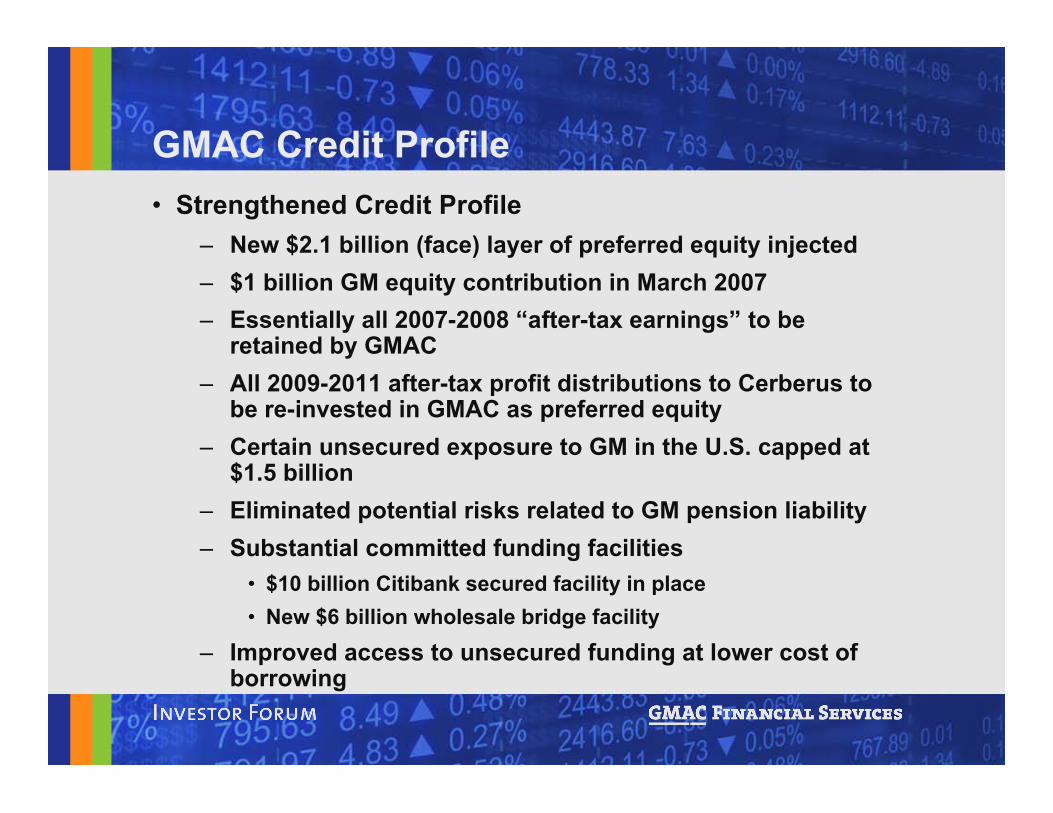
GMAC Credit Profile• Strengthened Credit Profile
– New $2.1 billion (face) layer of preferred equity injected– $1 billion GM equity contribution in March 2007– Essentially all 2007-2008 “after-tax earnings” to be
retained by GMAC– All 2009-2011 after-tax profit distributions to Cerberus to
be re-invested in GMAC as preferred equity– Certain unsecured exposure to GM in the U.S. capped at
$1.5 billion– Eliminated potential risks related to GM pension liability– Substantial committed funding facilities
• $10 billion Citibank secured facility in place• New $6 billion wholesale bridge facility
– Improved access to unsecured funding at lower cost ofborrowing
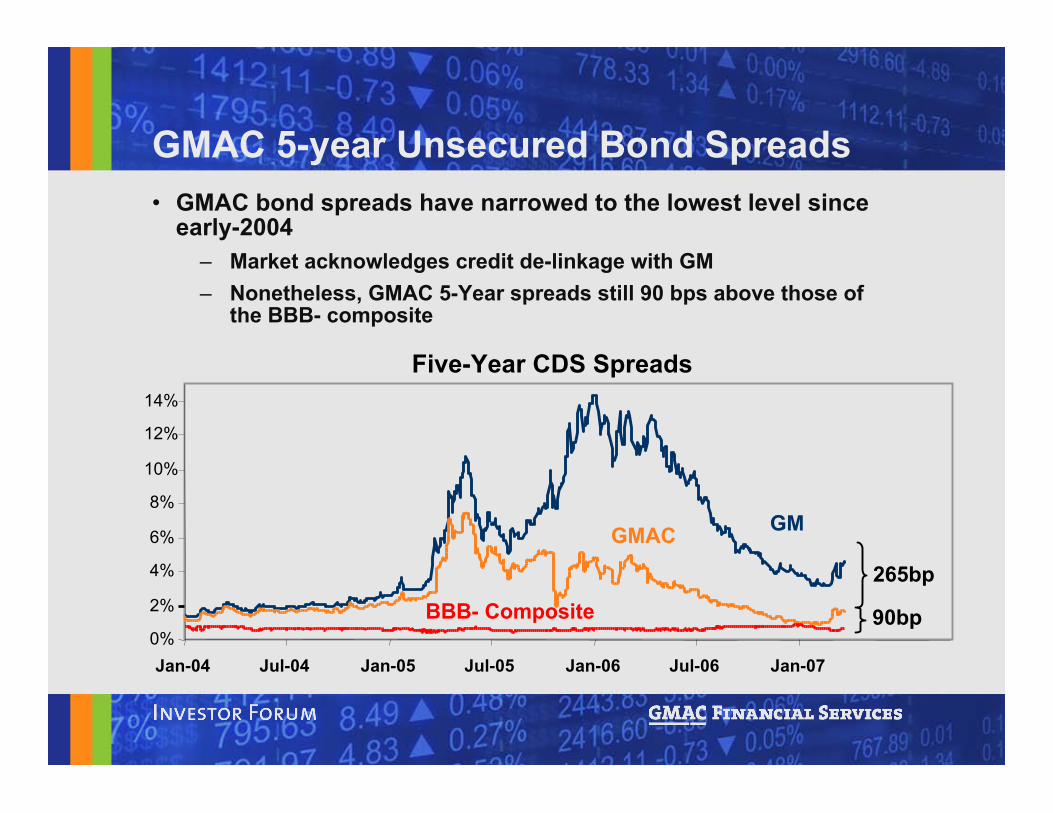
GMAC 5-year Unsecured Bond Spreads• GMAC bond spreads have narrowed to the lowest level since
early-2004– Market acknowledges credit de-linkage with GM– Nonetheless, GMAC 5-Year spreads still 90 bps above those of
the BBB- composite
0%
2%
4%
6%
8%
10%
12%
14%
J a n - 0 4 J u l - 0 4 J a n - 0 5 J u l - 0 5 J a n - 0 6 J u l - 0 6 J a n - 0 7
BBB- Composite
GMAC G265b
p90bp
Five-Year CDS Spreads
0%
2%
4%
6%
8%
10%
12%
14%
Jan-04 Jul-04 Jan-05 Jul-05 Jan-06 Jul-06 Jan-07
BBB- Composite
GMAC GM
Five-Year CDS Spreads
265bp
90bp
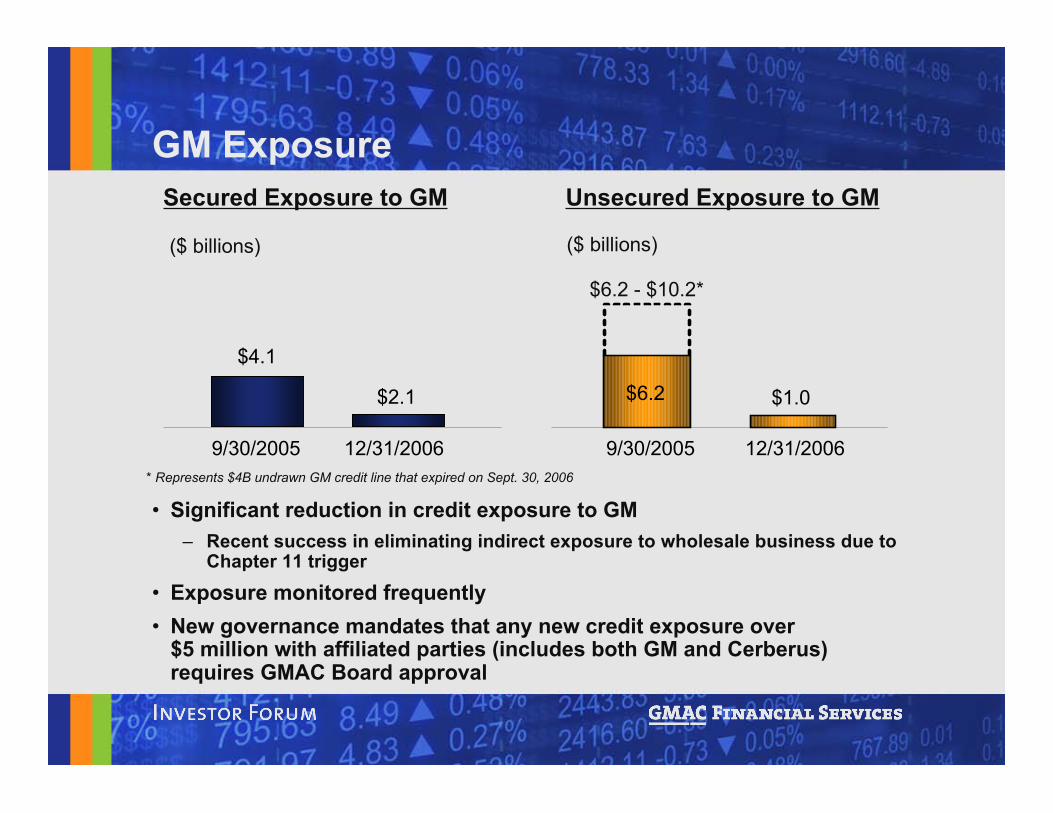
GM Exposure
• Significant reduction in credit exposure to GM– Recent success in eliminating indirect exposure to wholesale business due to
Chapter 11 trigger
• Exposure monitored frequently• New governance mandates that any new credit exposure over
$5 million with affiliated parties (includes both GM and Cerberus)requires GMAC Board approval
Secured Exposure to GM Unsecured Exposure to GM
($ billions)($ billions)
* Represents $4B undrawn GM credit line that expired on Sept. 30, 2006
$6.2 - $10.2*
$4.1
$2.1
9/30/2005 12/31/2006
$1.0$6.2
9/30/2005 12/31/2006
Risk ManagementUpdate
Risk Management• GMAC approaches risk management at both the corporate level and
within each business unit• A corporate wide Enterprise Risk Management Committee oversees
market, credit and operational risk– Each business entity has additional committees and personnel with oversight
of matters such as asset liability mix, underwriting, etc.• Financial and disclosure controls coordinated across all GMAC
businesses by the Corporate Controller function• Overall track record is strong
– Weaknesses are identified and fixed– Continuous monitoring across the company– Recent FAS133 related restatement resulted in a SOX 404 material weakness
in 2006• No cash or economic impact
• In addition, our operations are subject to regulation in a number ofmarkets around the world
– Internal control over financial reporting subject to annual assessment bymanagement and annual audit by external auditors
Enterprise Risk ManagementResponsibilities• Reviews all significant risk exposures and issues to
provide a comprehensive view of risks to GMACmanagement
• Oversee enterprise wide risk policies and standards– Establishes policies and minimum risk standards– Provides enterprise-wide risk identification, monitoring
and reporting– Analyzes gaps and assess potential impact– Works in conjunction with business units to close gaps
• Monitors ongoing initiatives and top risks across theenterprise
– Reviews performance against targets / limits• Provides continuous feedback to business unit
leadership and GMAC senior management
Regulators Oversight Of GMAC• GMAC is subject to regulatory oversight primarily as a result of
its ownership of a U.S. based bank– Oversight from FDIC and Utah Department of Financial
Institutions– Supervision of banks includes examination and oversight of
banks’ owners, including indirect owners, so GMAC is subject toregulatory review
– Examiners scrutinize the banks, GMAC, and its shareholders forcompliance with affiliate transactions rules and various “safetyand soundness” requirements
• In addition, many of GMAC’s business units are subject toregulation
– Certain of our foreign subsidiaries operate in local markets aseither banks or regulated finance companies
– Insurance operations are regulated in most markets– Most of our other operations are subject to licensing regulations
in the markets where they operate
2007 Outlook
2007 Outlook• Continuing pressures at ResCap likely to constrain
GMAC’s overall near-term results• Highest priority is implementing changes at ResCap to
address rapidly changing mortgage market• Global Auto Finance is well positioned to generate
attractive returns• Insurance is expected to deliver another robust year• GMAC’s long term prospects remain favorable
– ResCap’s fundamental earnings potential remains solid– Auto Finance and Insurance should mitigate pressure at
ResCap in near term and provide base for growth inlong term
Conclusion
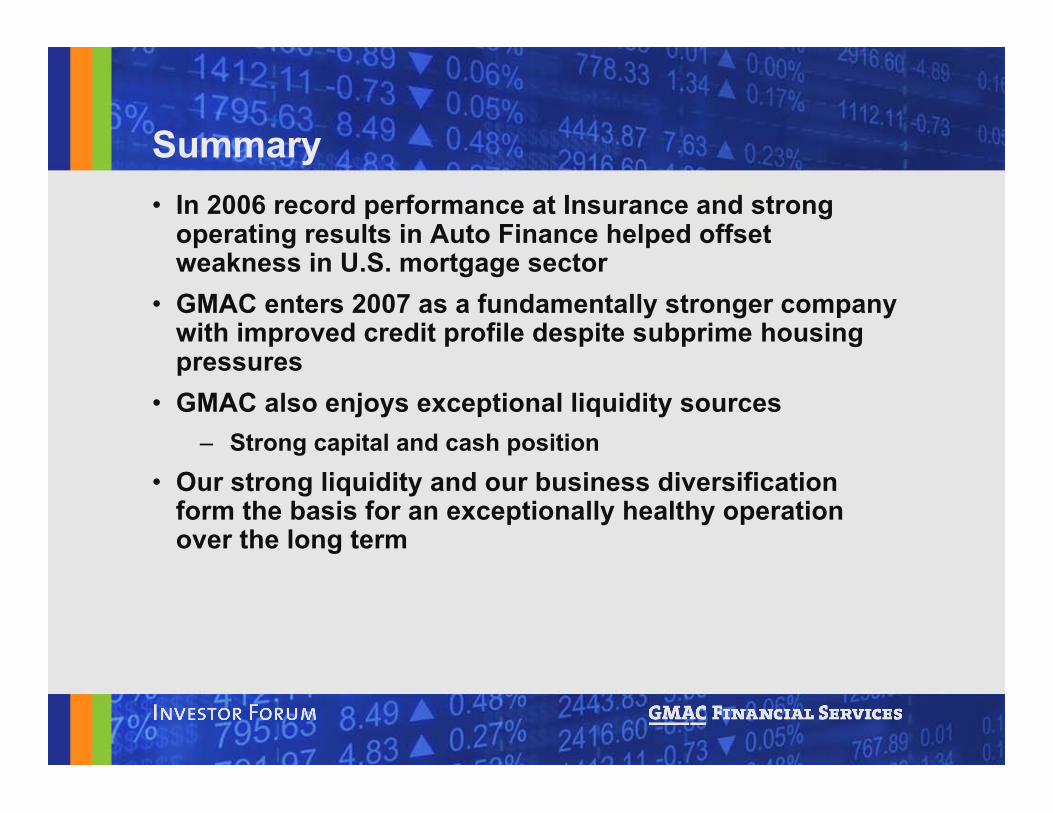
Summary• In 2006 record performance at Insurance and strong
operating results in Auto Finance helped offsetweakness in U.S. mortgage sector
• GMAC enters 2007 as a fundamentally stronger companywith improved credit profile despite subprime housingpressures
• GMAC also enjoys exceptional liquidity sources– Strong capital and cash position
• Our strong liquidity and our business diversificationform the basis for an exceptionally healthy operationover the long term