Embed Size (px)
Citation preview
Presented by : Idowu Ayodeji AdetunjiSupervised by: Prof. Liu Ying
June 4th 2013.
The Federal Government of Nigeria aims to make Nigeria one of the top twenty economies by the year 2020.
To achieve this aim, the economy must be diversified- recourse to agriculture.
Government now aggressively sources for more domestic and foreign investments into the agricultural sector.
Though Nigeria has, over the years, attracted huge volumes of foreign direct investment (FDI).
Surprisingly, large chunk of these investments escape the agricultural sector.
Little or no research work has been done to evaluate “FDI-Agriculture” relationship in Nigeria.
The few studies that observed this relationship employed FDI that was obtained in the entire economy rather than that which was specifically obtained in the agricultural sector.
To evaluate and forecast the relationship between the level of productivity in the agricultural sector relative to the amount of foreign direct investment that has been obtained in the sector.
The level of agricultural sector output is significantly related to the level of FDI the sector receives.
The level of labor generation of the agricultural sector is significantly related to FDI in the agricultural sector.
FDI into the agricultural sector and the agricultural sector output have a complementary long-run relationship.
Foreign investment inflows to the agricultural sector have a complementary long run relationship with labor generation in the agricultural sector.
To understand the link between FDI inflows and productivity levels of the agricultural sector.
To uncover channels through which FDI stimulates the growth and development of Nigeria’s agricultural sector.
To identify the policy levers that may be engineered to maximize both inflows and gains of FDI into the agricultural sector.
Theory and evidence shows that an agricultural economy is strategic to national development, particularly for developing countries (Okorie and Eboh, 1990).
Nigeria’s agriculture enjoyed a boisterous era between the sixties and the seventies but started to decline soon after the discovery of oil.
Quantity and quality of government spending is low (Mogues et al, 2008).
The relationship between FDI and economic growth in Nigeria is unclear (Ayanwale, 2007).
Question of the significance and sustainability of FDI to Nigeria’s economic growth is yet unanswered.
Autoregressive models are more robust to detect the dynamic interactions involved within their framework.
In order to evaluate and forecast the impact of FDI in the agricultural sector of Nigeria; the relationship between the three time series variables from 1980- 2007 was examined in a vector autoregressive (VAR) environment.
Data used in this study was obtained from Central Bank of Nigeria (CBN) statistical bulletin.
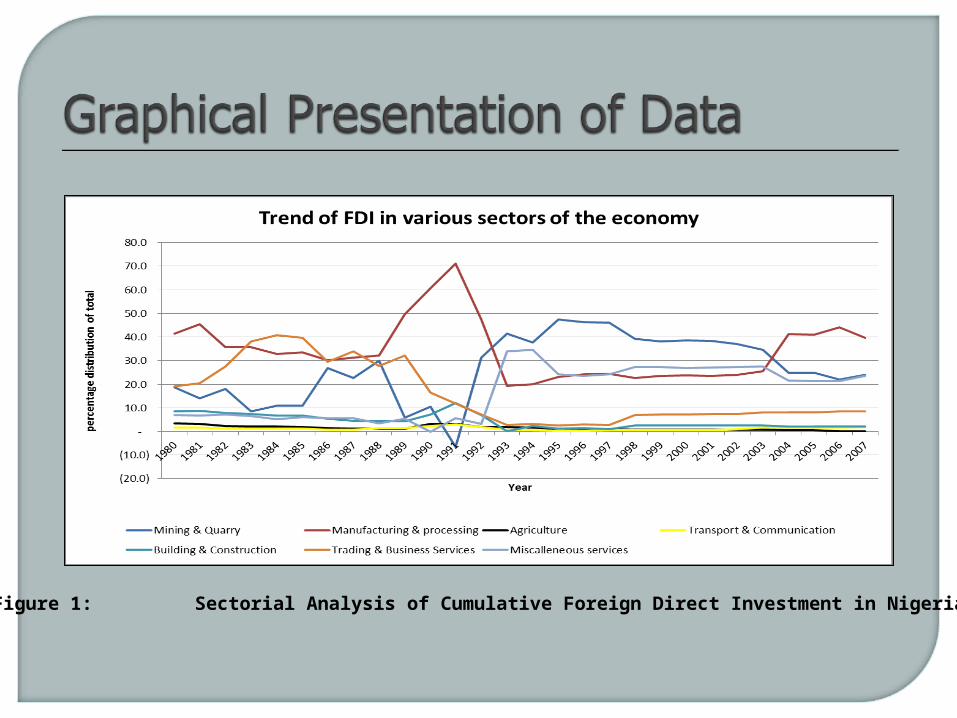
Figure 1: Sectorial Analysis of Cumulative Foreign Direct Investment in Nigeria
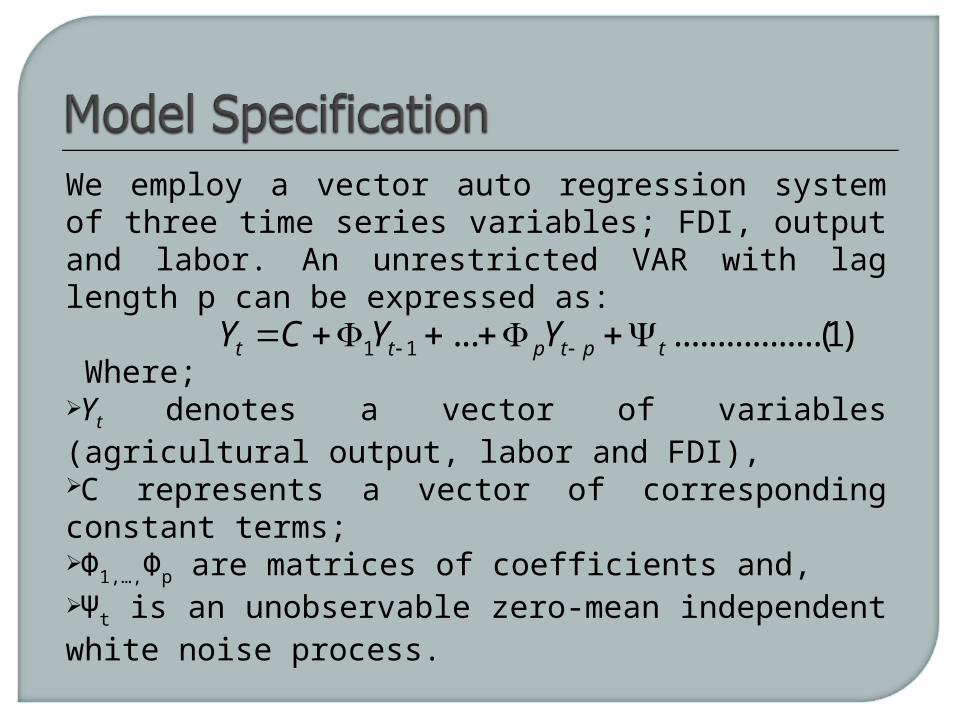
We employ a vector auto regression system of three time series variables; FDI, output and labor. An unrestricted VAR with lag length p can be expressed as:
Where; Yt denotes a vector of variables (agricultural output, labor and FDI), C represents a vector of corresponding constant terms; Φ1,…,Φp are matrices of coefficients and, Ψt is an unobservable zero-mean independent white noise process.
1 1 ... .................(1)t t p t p tY C Y Y
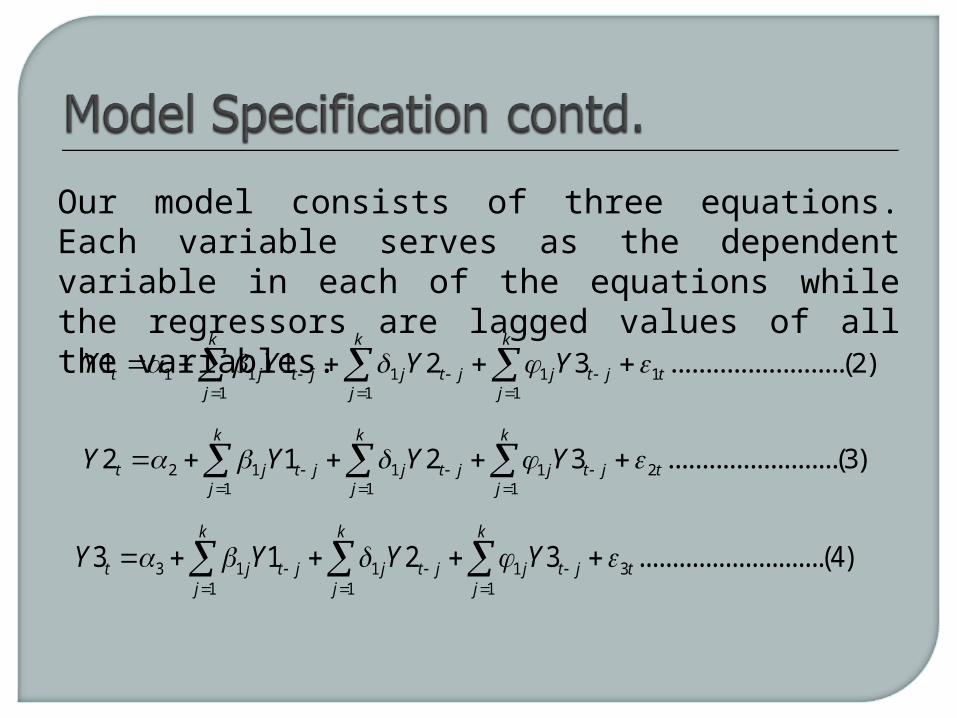
Our model consists of three equations. Each variable serves as the dependent variable in each of the equations while the regressors are lagged values of all the variables.
1 1 1 1 11 1 1
1 1 2 3 .........................(2)k k k
t j t j j t j j t j tj j j
Y Y Y Y
2 1 1 1 21 1 1
2 1 2 3 .........................(3)k k k
t j t j j t j j t j tj j j
Y Y Y Y
3 1 1 1 31 1 1
3 1 2 3 ............................(4)k k k
t j t j j t j j t j tj j j
Y Y Y Y
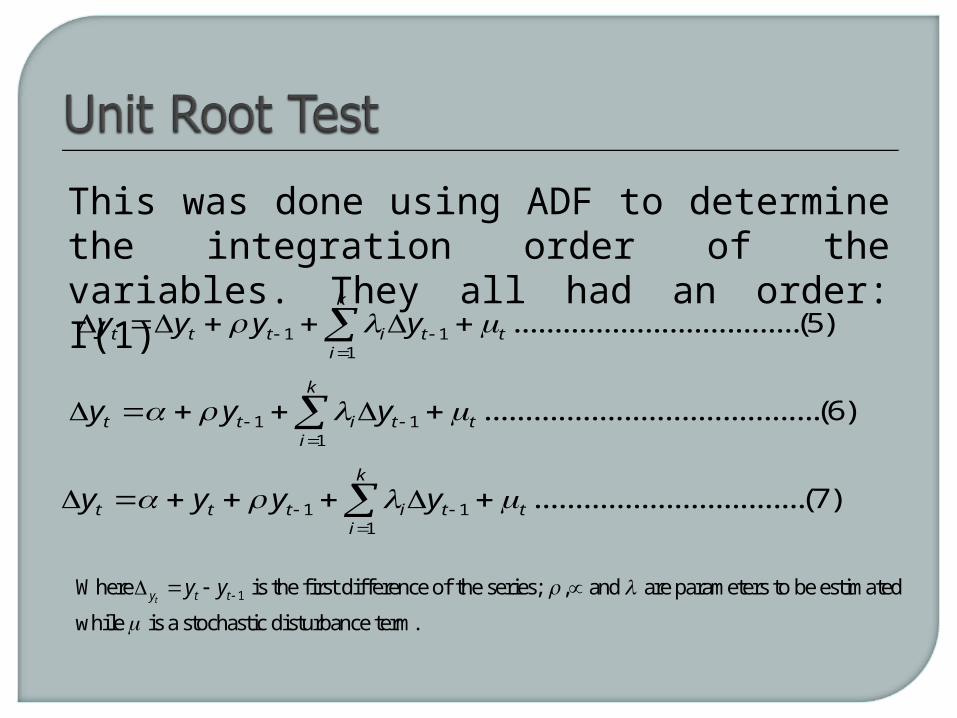
This was done using ADF to determine the integration order of the variables. They all had an order: I(1)
1 11
...................................(5)k
t t t i t ti
y y y y
1 11
.........................................(6)k
t t i t ti
y y y
1 11
.................................(7)k
t t t i t ti
y y y y
1Where is the first difference of the series; , and are parameters to be estimated
while is a stochastic disturbance term.ty t ty y
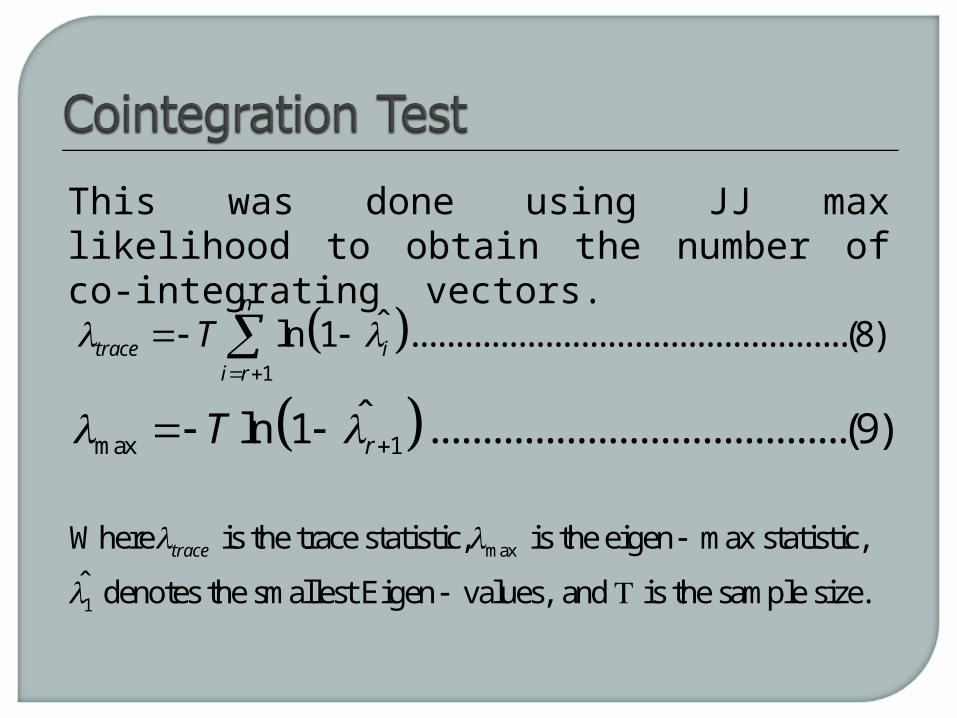
This was done using JJ max likelihood to obtain the number of co-integrating vectors.
1
ˆln 1 .................................................(8)n
trace ii r
T
max 1ˆln 1 ........................................(9)rT
max
1
Where is the trace statistic, is the eigen max statistic,
ˆ denotes the smallest Eigen values, and is the sample size.
trace
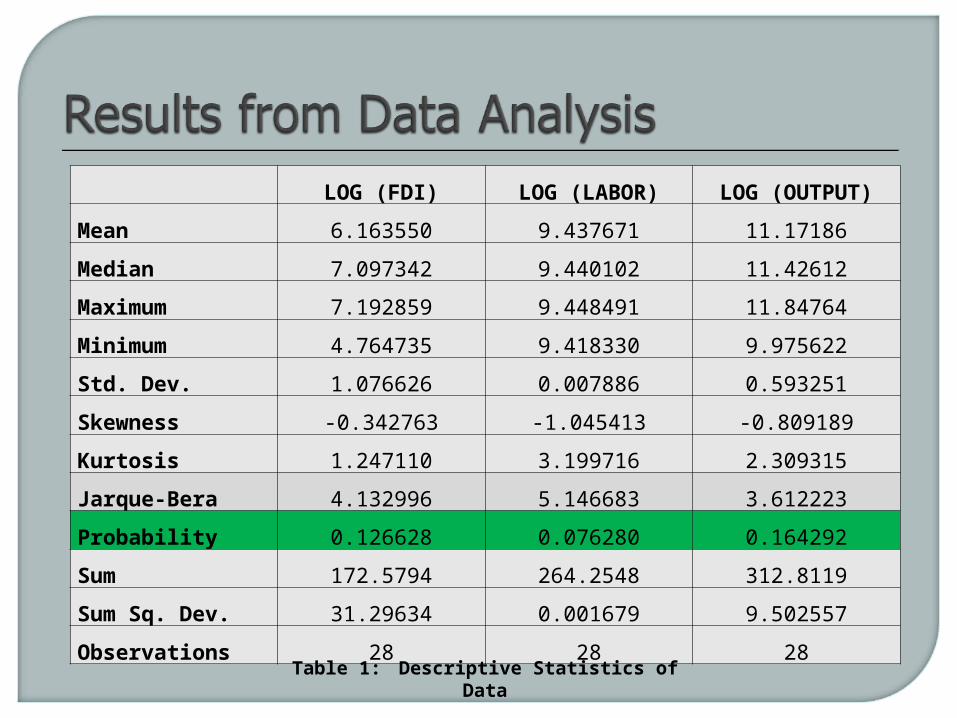
LOG (FDI) LOG (LABOR) LOG (OUTPUT)
Mean 6.163550 9.437671 11.17186
Median 7.097342 9.440102 11.42612
Maximum 7.192859 9.448491 11.84764
Minimum 4.764735 9.418330 9.975622
Std. Dev. 1.076626 0.007886 0.593251
Skewness -0.342763 -1.045413 -0.809189
Kurtosis 1.247110 3.199716 2.309315
Jarque-Bera 4.132996 5.146683 3.612223
Probability 0.126628 0.076280 0.164292
Sum 172.5794 264.2548 312.8119
Sum Sq. Dev. 31.29634 0.001679 9.502557
Observations 28 28 28Table 1: Descriptive Statistics of Data
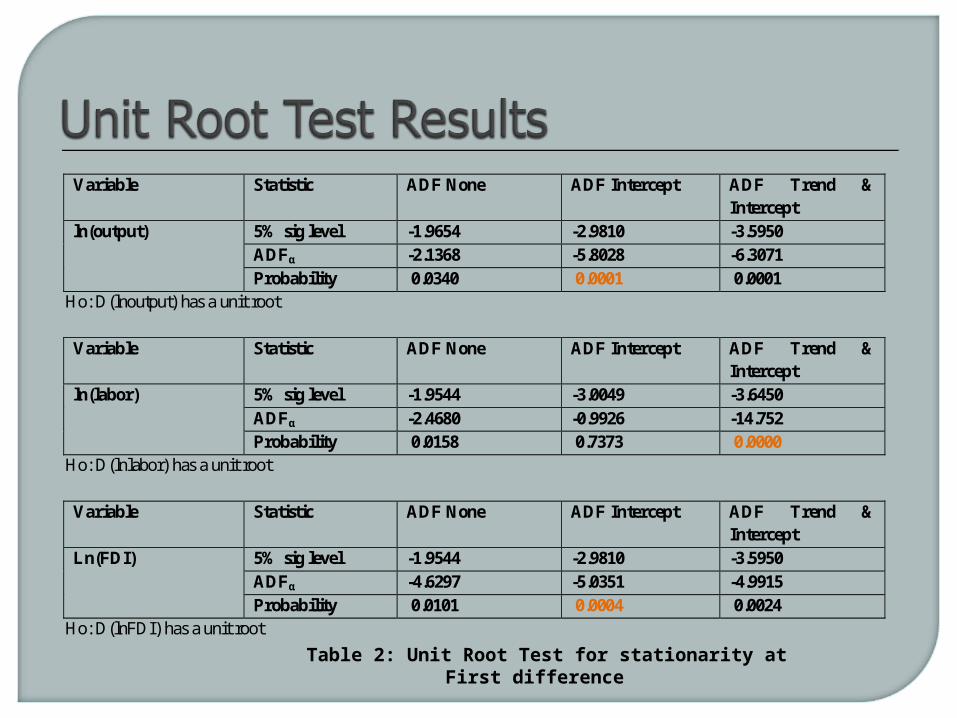
Table 4.1.3 Unit Root Test at stationarity at First difference
Variable Statistic ADF None ADF Intercept ADF Trend & Intercept
ln(output) 5% sig level -1.9654 -2.9810 -3.5950 ADFα -2.1368 -5.8028 -6.3071 Probability 0.0340 0.0001 0.0001
Ho: D(lnoutput) has a unit root Variable Statistic ADF None ADF Intercept ADF Trend &
Intercept ln(labor) 5% sig level -1.9544 -3.0049 -3.6450
ADFα -2.4680 -0.9926 -14.752 Probability 0.0158 0.7373 0.0000
Ho: D(lnlabor) has a unit root Variable Statistic ADF None ADF Intercept ADF Trend &
Intercept Ln(FDI) 5% sig level -1.9544 -2.9810 -3.5950
ADFα -4.6297 -5.0351 -4.9915 Probability 0.0101 0.0004 0.0024
Ho: D(lnFDI) has a unit root
Table 2: Unit Root Test for stationarity at First difference
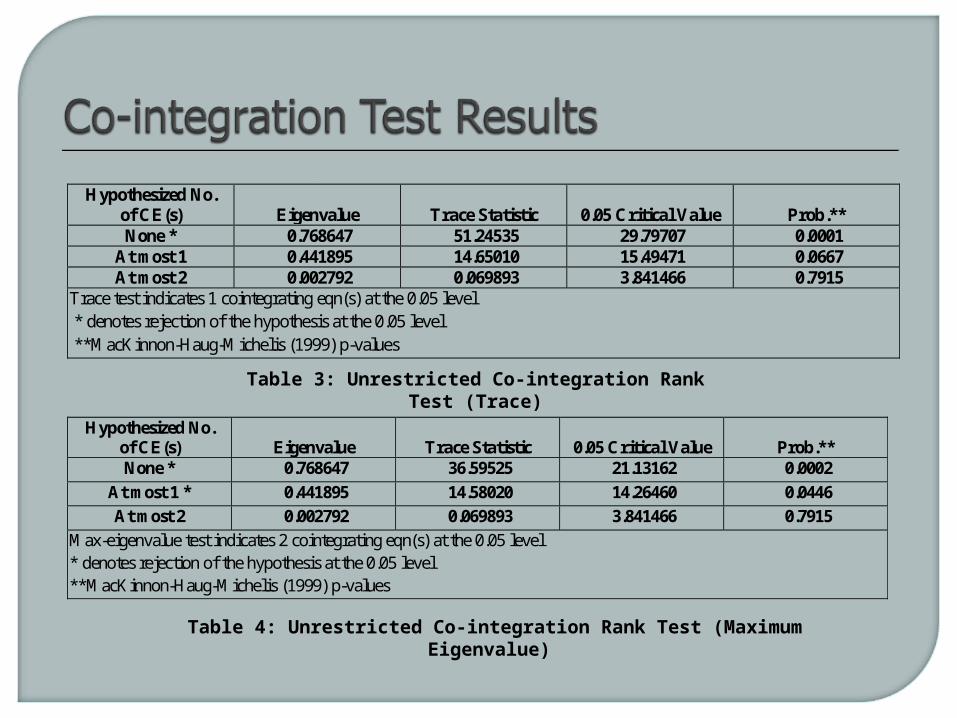
Table 4.1.4.1 Unrestricted Cointegration Rank Test (Trace) Hypothesized No.
of CE(s) Eigenvalue Trace Statistic 0.05 Critical Value Prob.** None * 0.768647 51.24535 29.79707 0.0001
At most 1 0.441895 14.65010 15.49471 0.0667 At most 2 0.002792 0.069893 3.841466 0.7915
Trace test indicates 1 cointegrating eqn(s) at the 0.05 level * denotes rejection of the hypothesis at the 0.05 level **MacKinnon-Haug-Michelis (1999) p-values
Table 4.1.4.2 Unrestricted Cointegration Rank Test (Maximum Eigenvalue)
Hypothesized No. of CE(s) Eigenvalue Trace Statistic 0.05 Critical Value Prob.** None * 0.768647 36.59525 21.13162 0.0002
At most 1 * 0.441895 14.58020 14.26460 0.0446
At most 2 0.002792 0.069893 3.841466 0.7915
Max-eigenvalue test indicates 2 cointegrating eqn(s) at the 0.05 level * denotes rejection of the hypothesis at the 0.05 level **MacKinnon-Haug-Michelis (1999) p-values
Table 3: Unrestricted Co-integration Rank Test (Trace)
Table 4: Unrestricted Co-integration Rank Test (Maximum Eigenvalue)
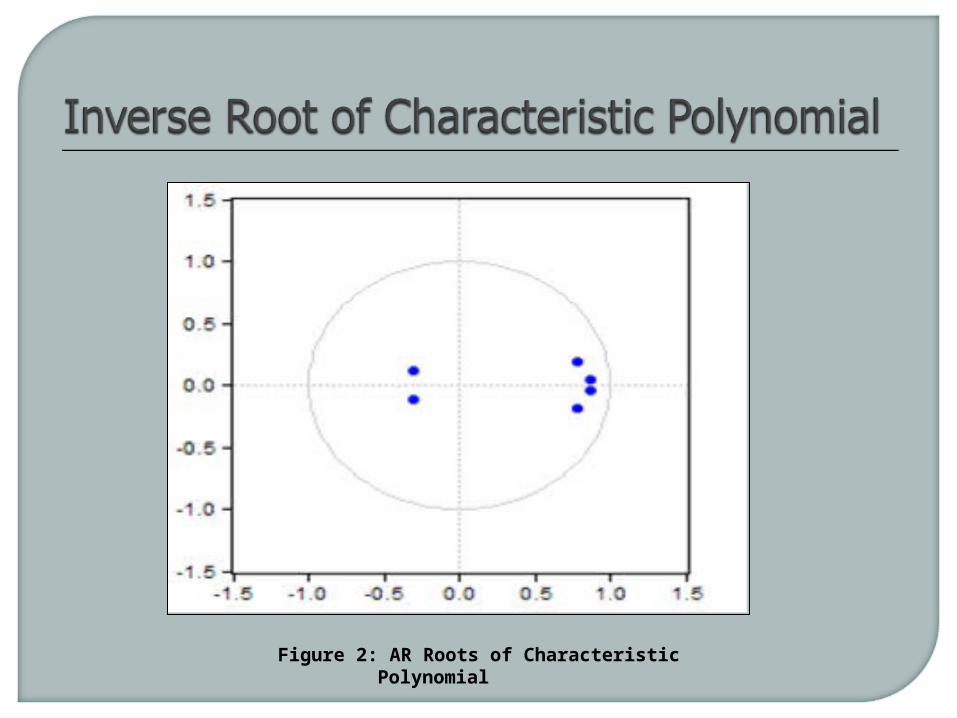
Figure 2: AR Roots of Characteristic Polynomial
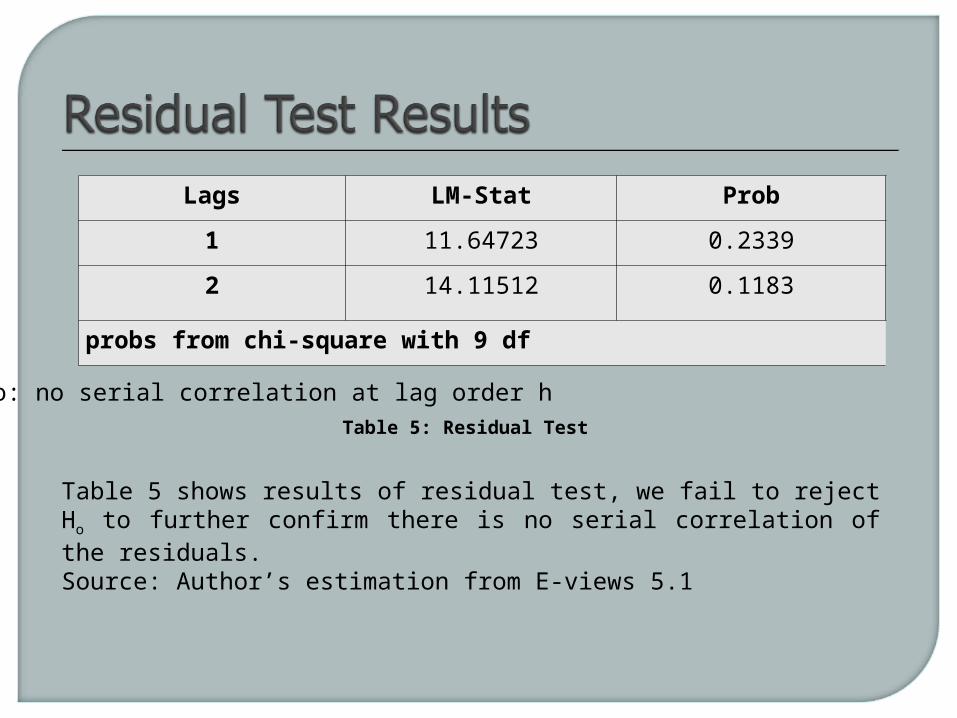
Lags LM-Stat Prob
1 11.64723 0.2339
2 14.11512 0.1183
probs from chi-square with 9 df
Table 5 shows results of residual test, we fail to reject Ho to further confirm there is no serial correlation of the residuals. Source: Author’s estimation from E-views 5.1
Table 5: Residual Test
Ho: no serial correlation at lag order h
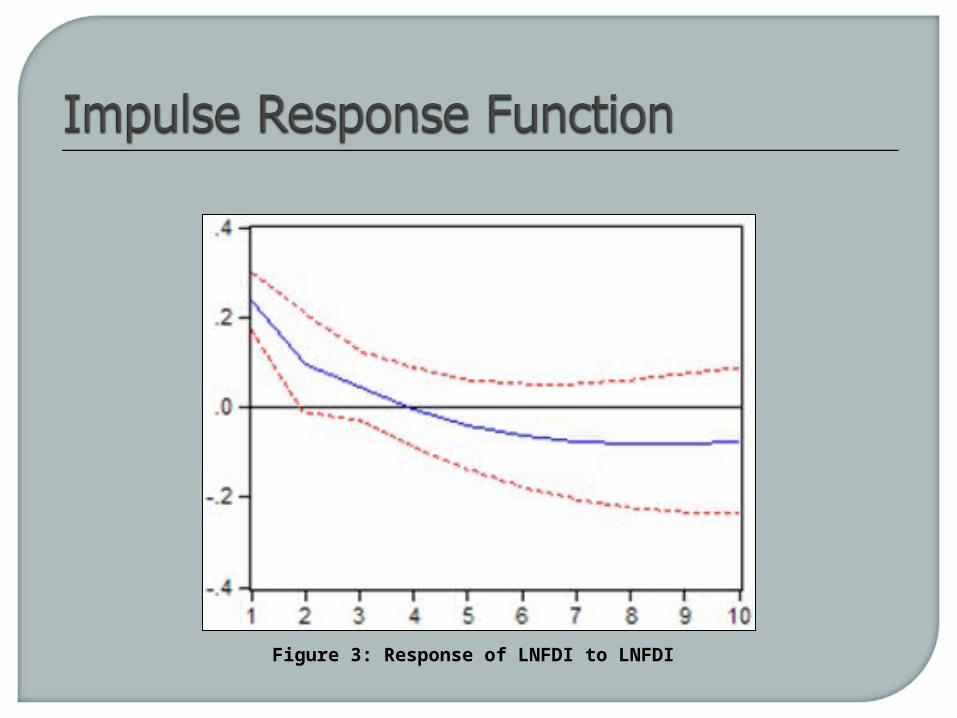
Figure 3: Response of LNFDI to LNFDI
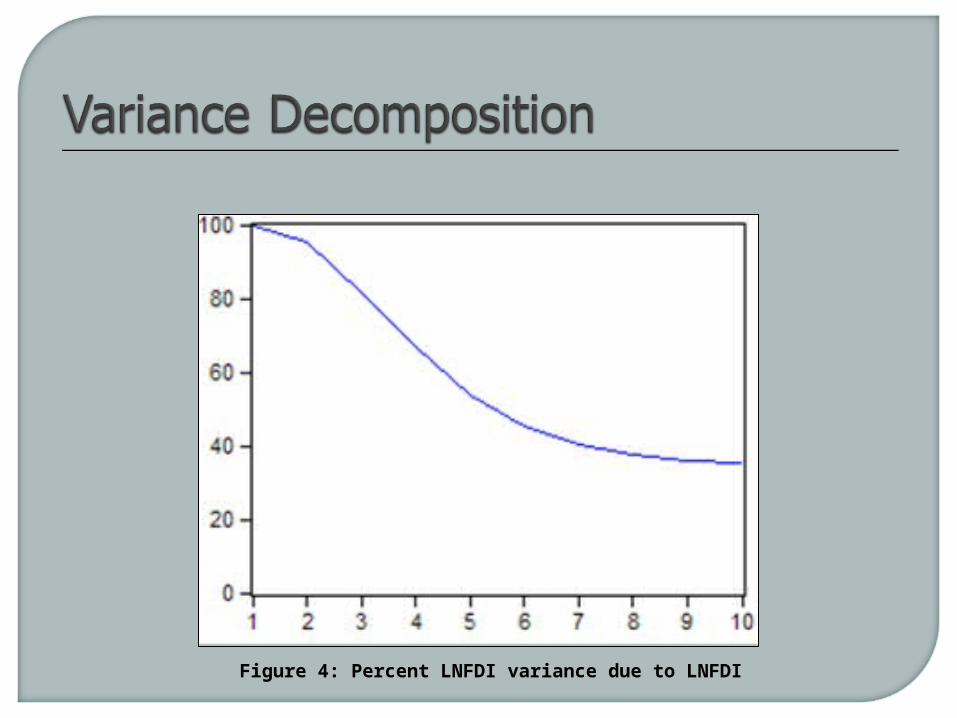
Figure 4: Percent LNFDI variance due to LNFDI
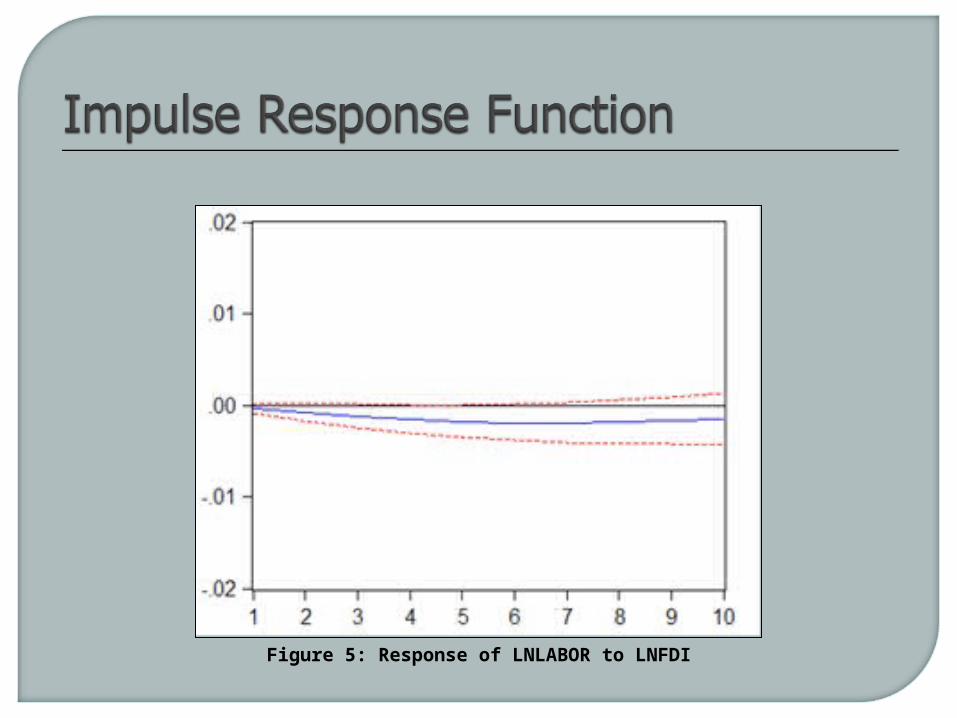
Figure 5: Response of LNLABOR to LNFDI
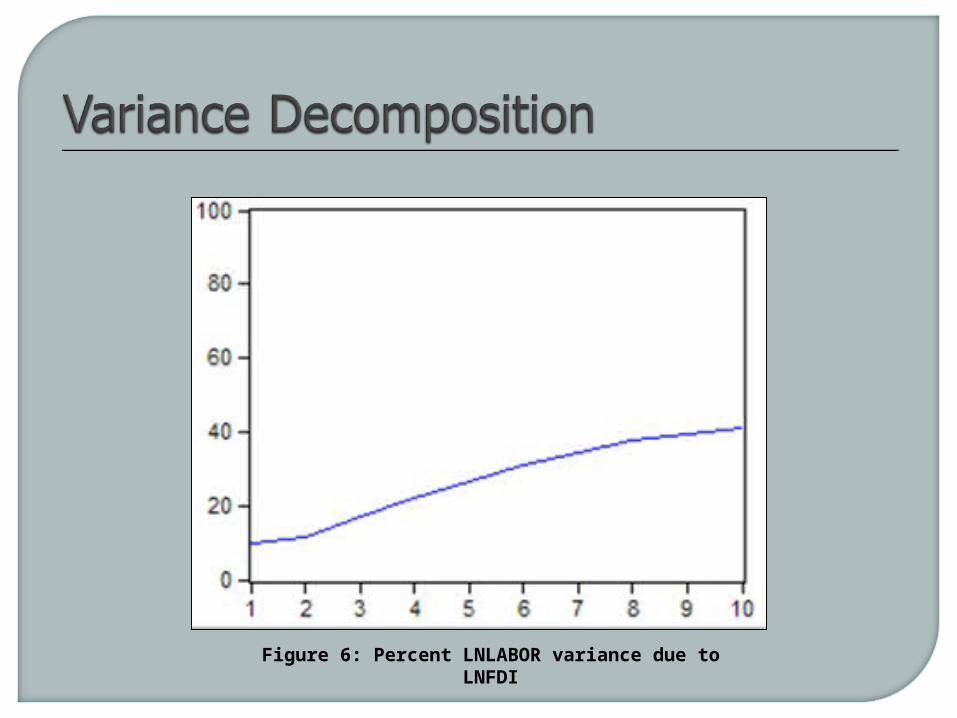
Figure 6: Percent LNLABOR variance due to LNFDI
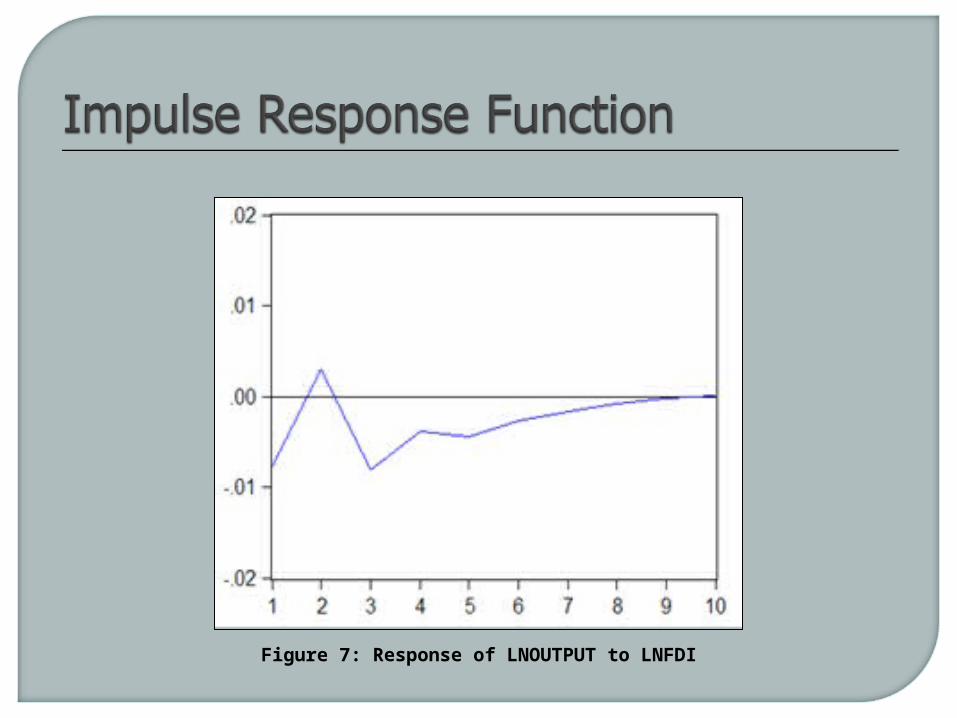
Figure 7: Response of LNOUTPUT to LNFDI
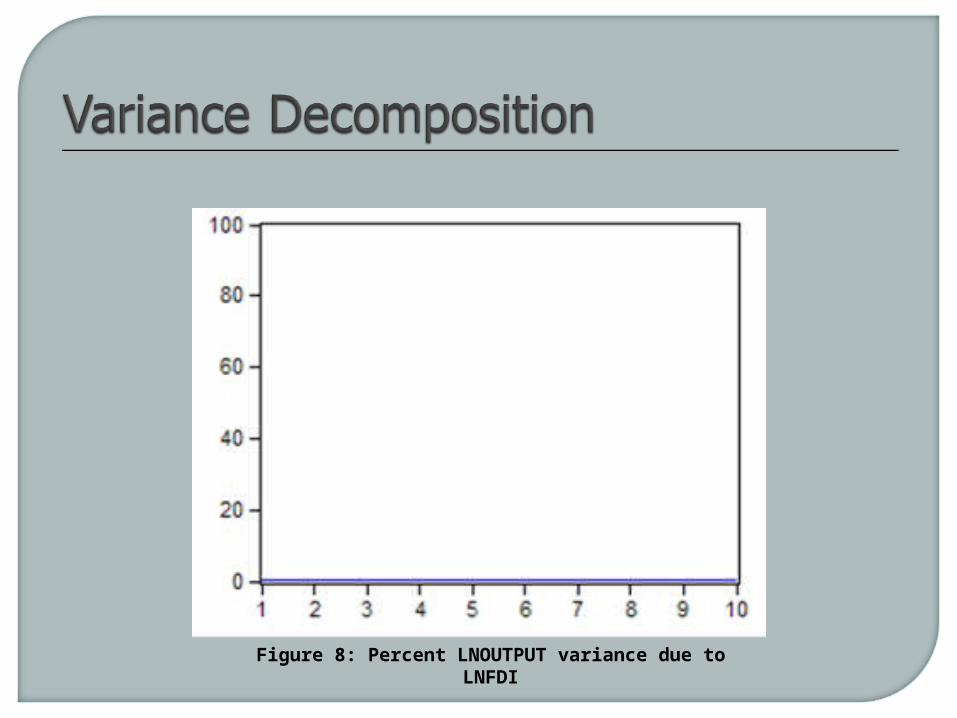
Figure 8: Percent LNOUTPUT variance due to LNFDI
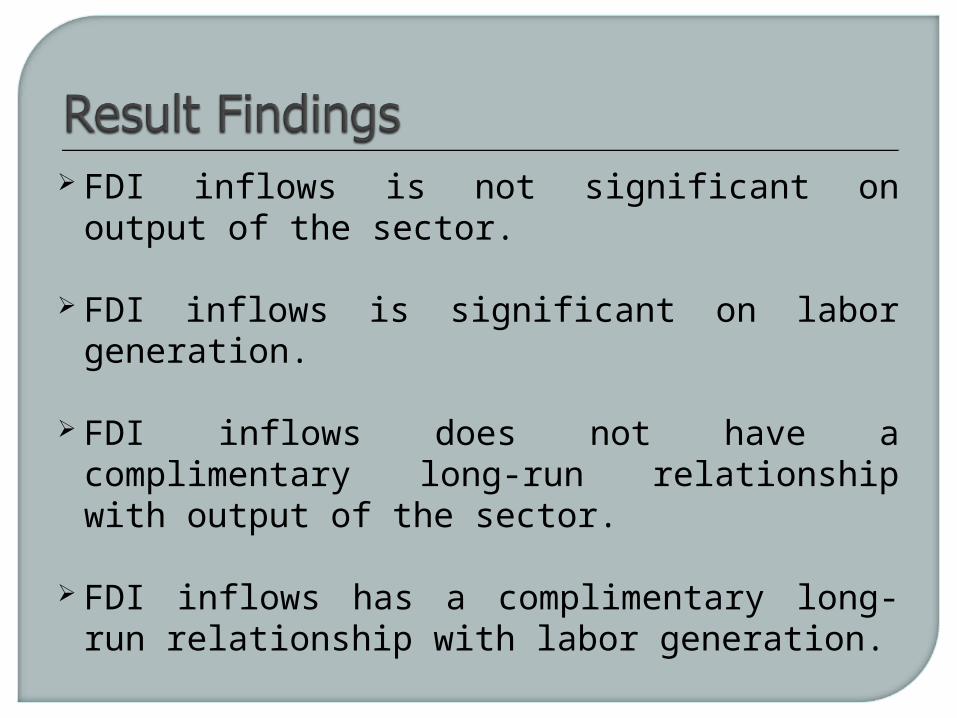
FDI inflows is not significant on output of the sector.
FDI inflows is significant on labor generation.
FDI inflows does not have a complimentary long-run relationship with output of the sector.
FDI inflows has a complimentary long-run relationship with labor generation.
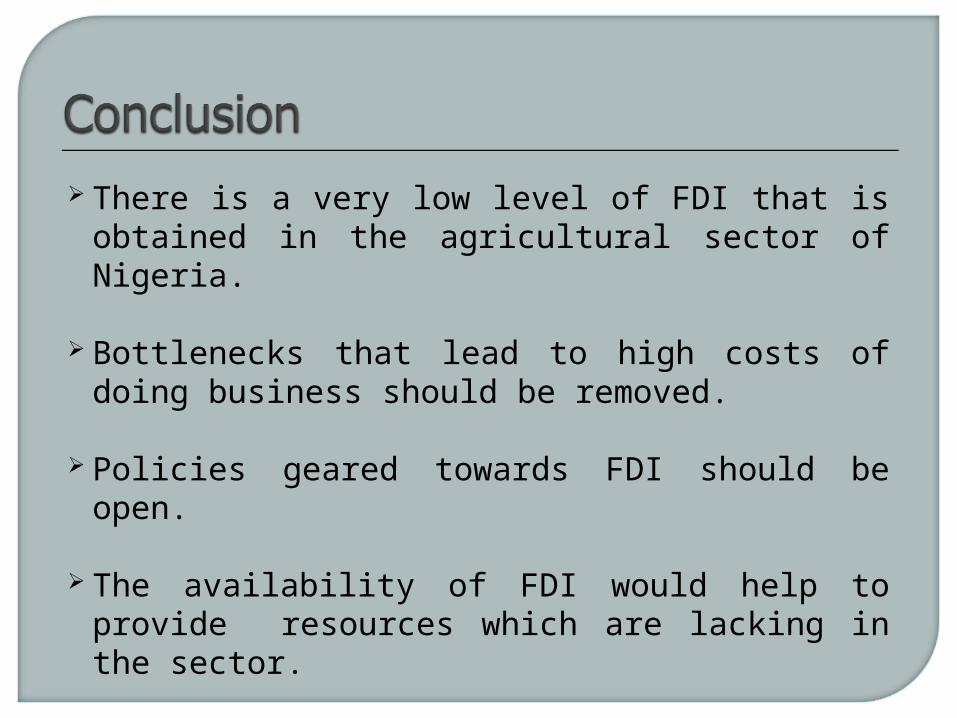
There is a very low level of FDI that is obtained in the agricultural sector of Nigeria.
Bottlenecks that lead to high costs of doing business should be removed.
Policies geared towards FDI should be open.
The availability of FDI would help to provide resources which are lacking in the sector.
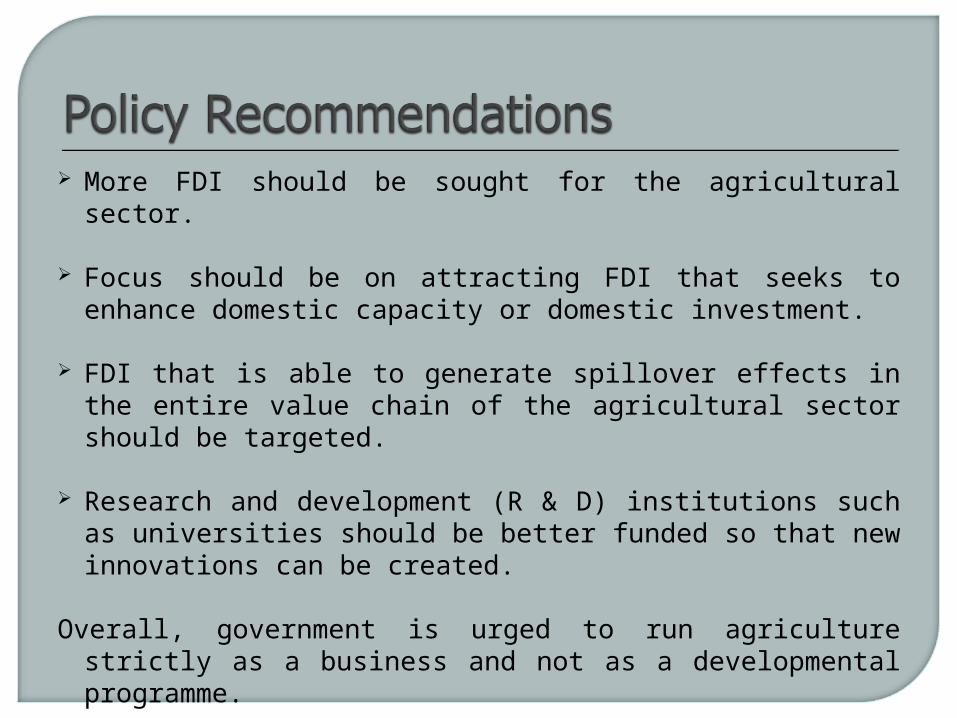
More FDI should be sought for the agricultural sector.
Focus should be on attracting FDI that seeks to enhance domestic capacity or domestic investment.
FDI that is able to generate spillover effects in the entire value chain of the agricultural sector should be targeted.
Research and development (R & D) institutions such as universities should be better funded so that new innovations can be created.
Overall, government is urged to run agriculture strictly as a business and not as a developmental programme.

Thank you

Thank you

Thank you