Embed Size (px)
Citation preview
Social Progress Index –an innovative toolkit for addressingthe challenges of the 21st century
Deloitte Sustainability Consulting Central EuropeImpact | Economics | Relations | Transformation
© 2015 Deloitte Advisory Sp. z o. o. 2
Deloitte & Social Progress IndexAim of the meeting
2
• Introduce the Social Progress Index as a way of measuring countries’ social and environmental progress on issues that matter most to people
• Start the debate on practical usage of the Index as a tool for policy and business leaders in:– policy-making and measuring countries’ progress– reviewing, comparing and driving regional progress (regions/ cities level)– shaping and measuring business strategies in addressing social and
environmental needs
• Relate to actionability – plan further actions by inspiring some of you to use the Index in planning and measuring your activities
© 2015 Deloitte Advisory Sp. z o. o. 3
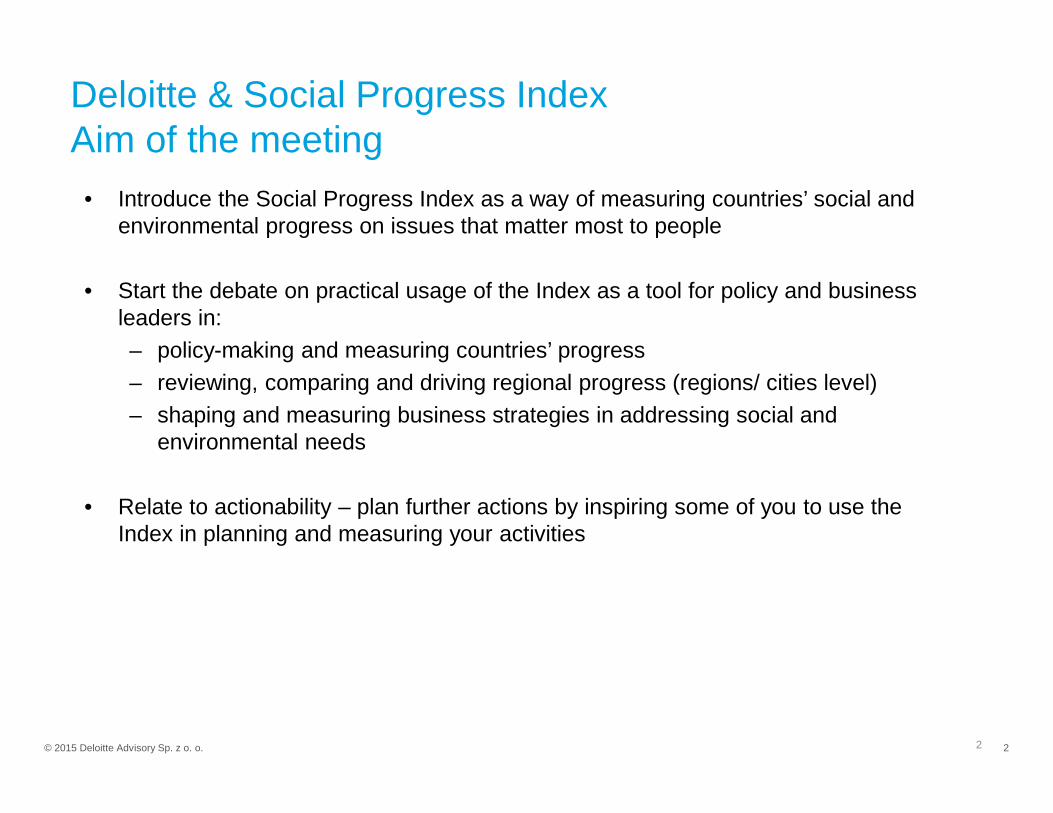
Deloitte – „Making an impact that matters”
Deloitte Global’s strategy focus on „Making an impactthat matters” is reflected in Deloitte's strategic partnership with the Social Progress Imperative:
“Deloitte is collaborating with the Social Progress Imperative and others because we believe business has a role to pl ay in helping solve the world’s critical issues and the Index is a tool that can ignite collective action from business, government, and society.”
Steve AlmondGlobal Chairman, Deloitte Global
© 2015 Deloitte Advisory Sp. z o. o. 4
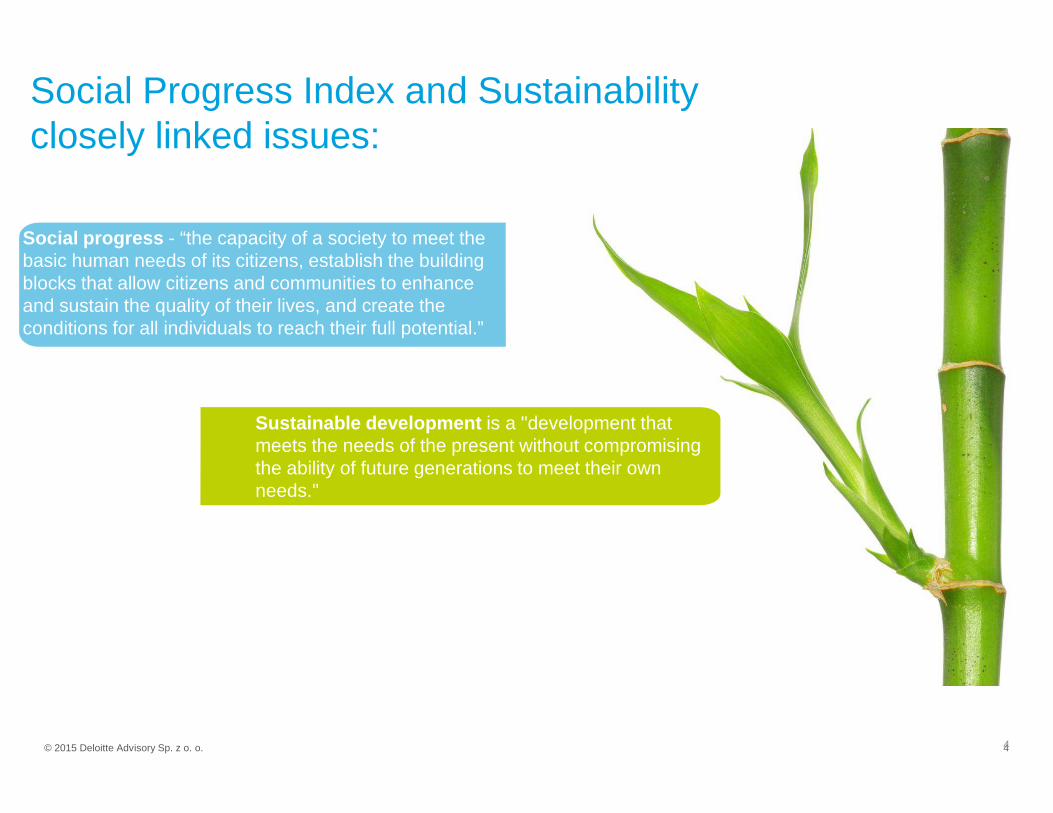
Social Progress Index and Sustainabilityclosely linked issues:
4
Social progress - “the capacity of a society to meet the basic human needs of its citizens, establish the building blocks that allow citizens and communities to enhance and sustain the quality of their lives, and create the conditions for all individuals to reach their full potential.”
Sustainable development is a "development that meets the needs of the present without compromising the ability of future generations to meet their own needs."
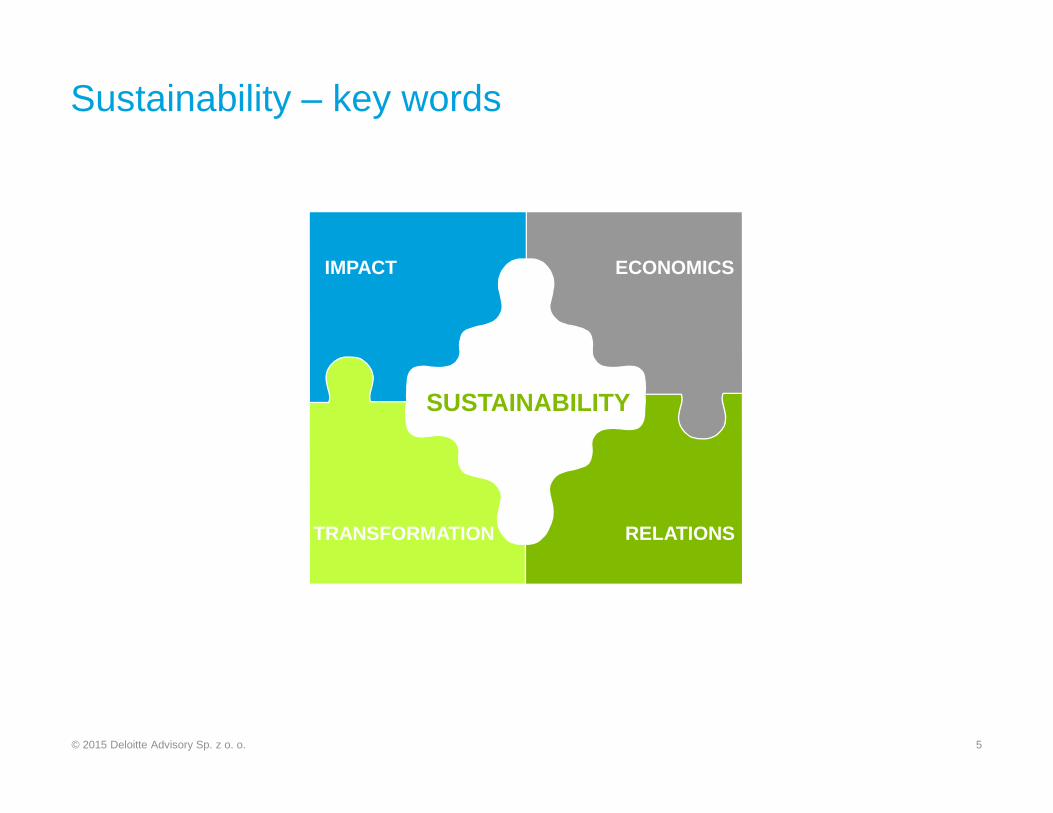
Sustainability – key words
© 2015 Deloitte Advisory Sp. z o. o. 5
SUSTAINABILITY
IMPACT ECONOMICS
RELATIONSTRANSFORMATION
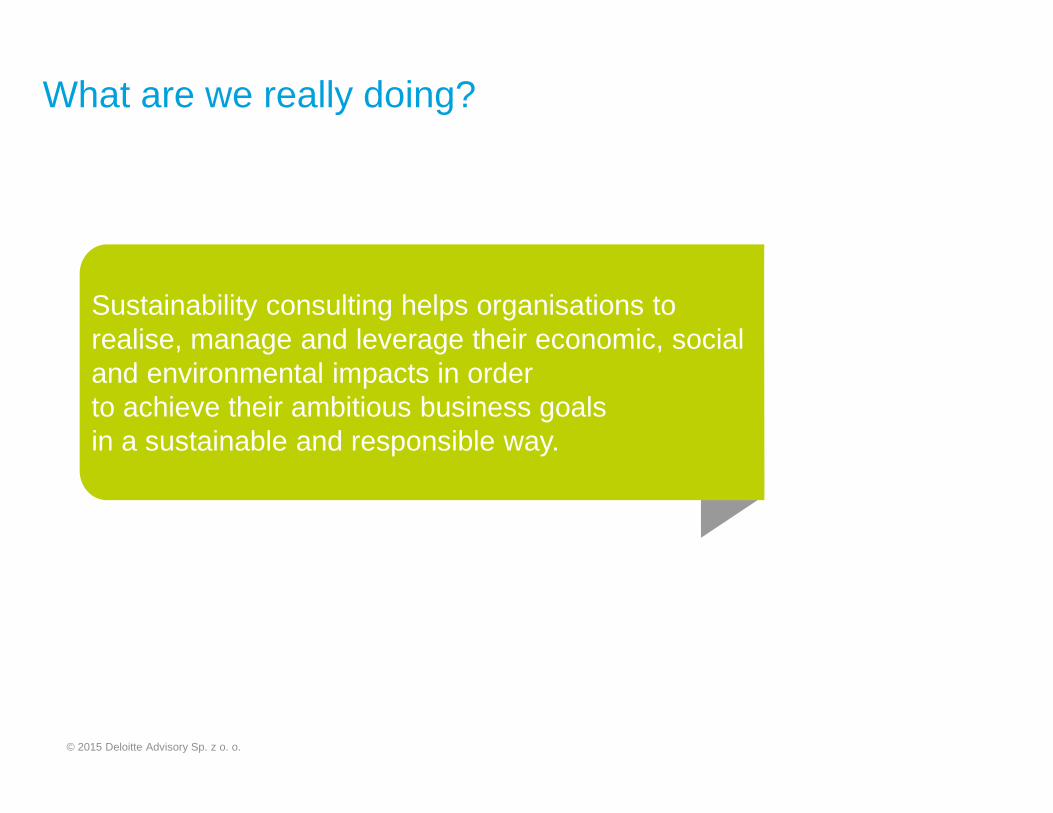
What are we really doing?
Sustainability consulting helps organisations to realise, manage and leverage their economic, socialand environmental impacts in orderto achieve their ambitious business goalsin a sustainable and responsible way.
© 2015 Deloitte Advisory Sp. z o. o.
© 2015 Deloitte Advisory Sp. z o. o.
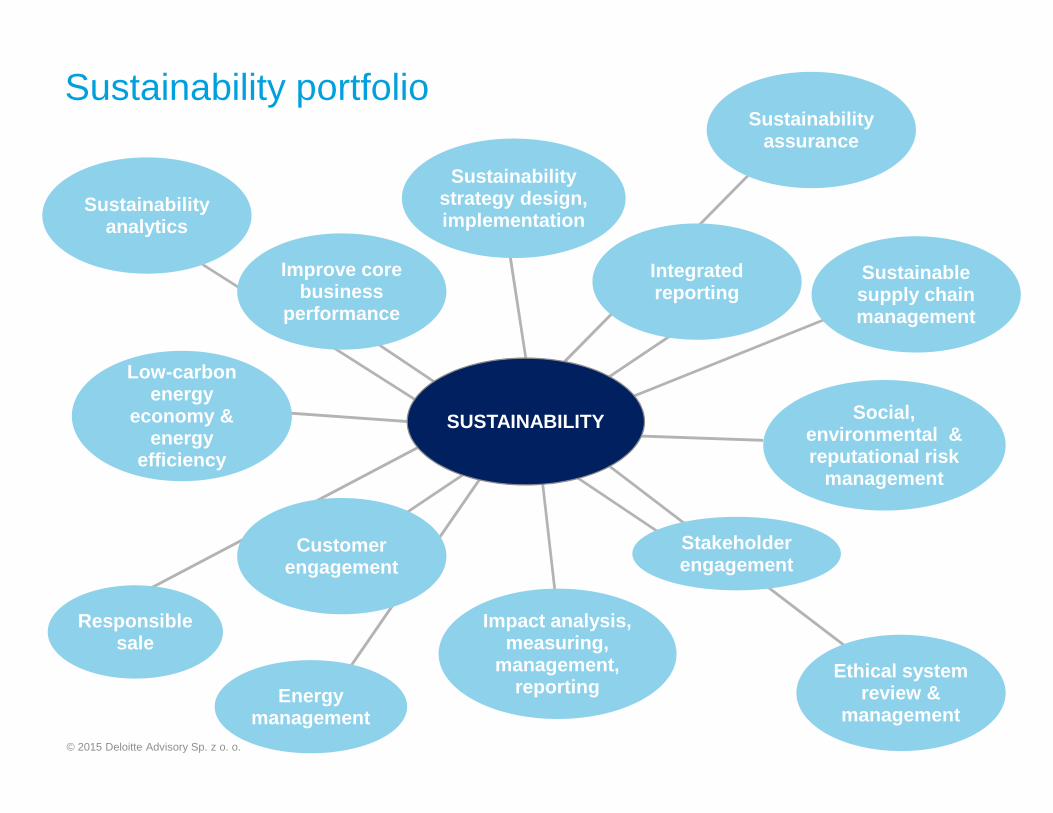
Sustainability portfolio
Impact analysis, measuring,
management, reporting
Integrated reporting
Improve corebusiness
performance
Stakeholder engagement
Customer engagement
SUSTAINABILITY
Ethical system review &
management
Sustainable supply chain management
Sustainabilityanalytics
Low-carbon energy
economy & energy
efficiency
Sustainabilitystrategy design, implementation
Social, environmental & reputational risk
management
Responsiblesale
Sustainabilityassurance
Energymanagement
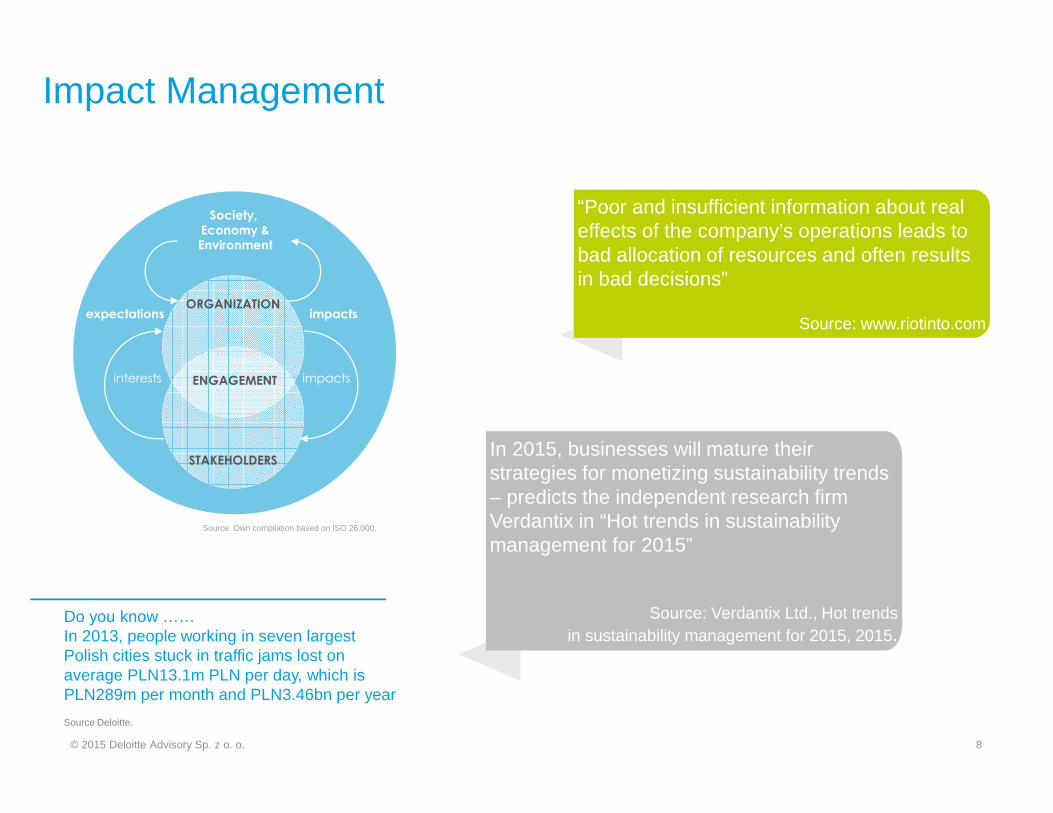
Impact Management
ORGANIZATION
STAKEHOLDERS
Society,
Economy &
Environment
expectations
interests impacts
impacts
ENGAGEMENT
Source: Own compilation based on ISO 26 000.
In 2015, businesses will mature their strategies for monetizing sustainability trends – predicts the independent research firm Verdantix in “Hot trends in sustainability management for 2015”
Source: Verdantix Ltd., Hot trendsin sustainability management for 2015, 2015.
“Poor and insufficient information about real effects of the company’s operations leads to bad allocation of resources and often results in bad decisions”
Source: www.riotinto.com
Do you know ……In 2013, people working in seven largest Polish cities stuck in traffic jams lost on average PLN13.1m PLN per day, which is PLN289m per month and PLN3.46bn per year
Source Deloitte.
© 2015 Deloitte Advisory Sp. z o. o. 8
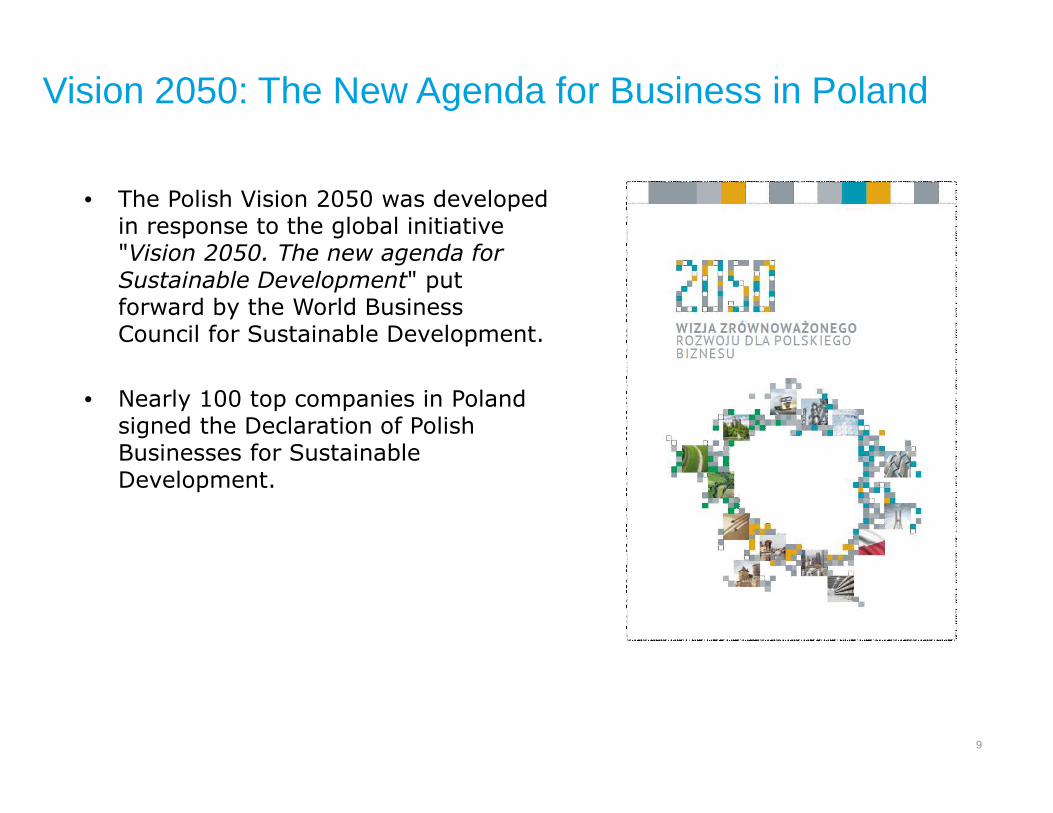
Vision 2050: The New Agenda for Business in Poland
9
• The Polish Vision 2050 was developed in response to the global initiative "Vision 2050. The new agenda for Sustainable Development" put forward by the World Business Council for Sustainable Development.
• Nearly 100 top companies in Poland signed the Declaration of Polish Businesses for Sustainable Development.
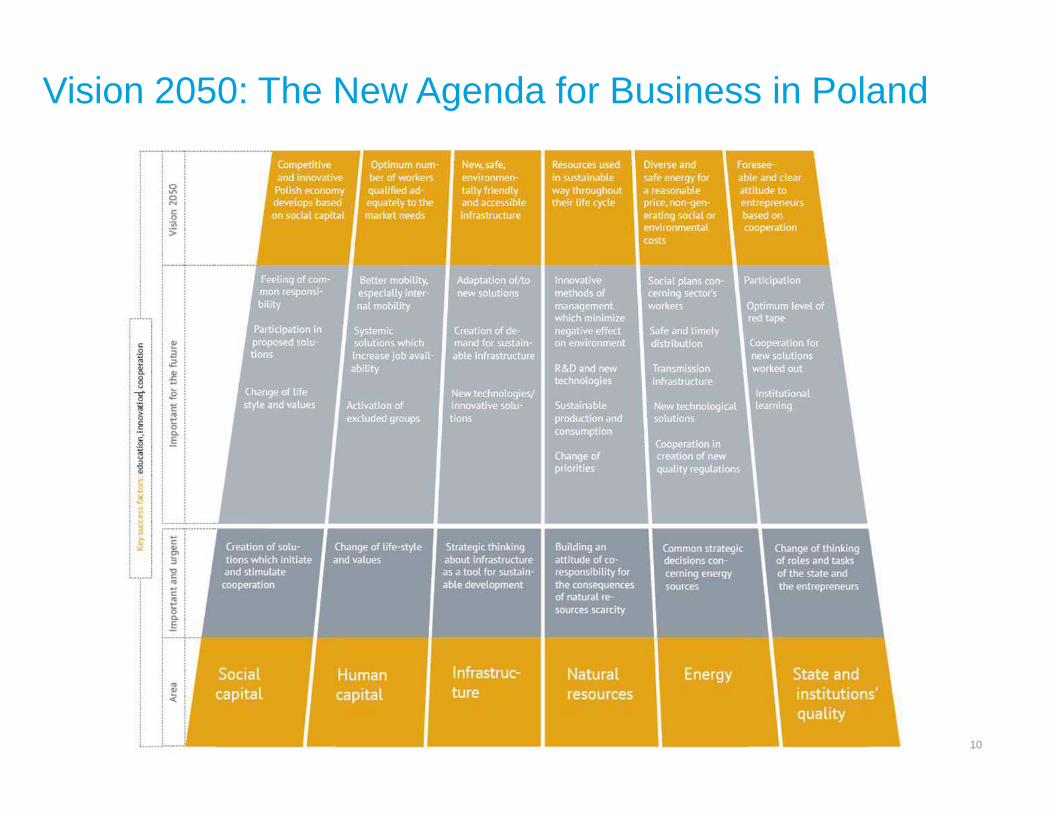
Vision 2050: The New Agenda for Business in Poland
10
Social Progress Imperative #socialprogress
TITLE HERE DATE/LOCATIONOTHER
SOCIAL PROGRESS INDEX
Michael GreenWarsaw Innovation Days, 15 th June 2015
Social Progress Imperative #socialprogress
Economic Development
GDP per capita
Social Progress
12
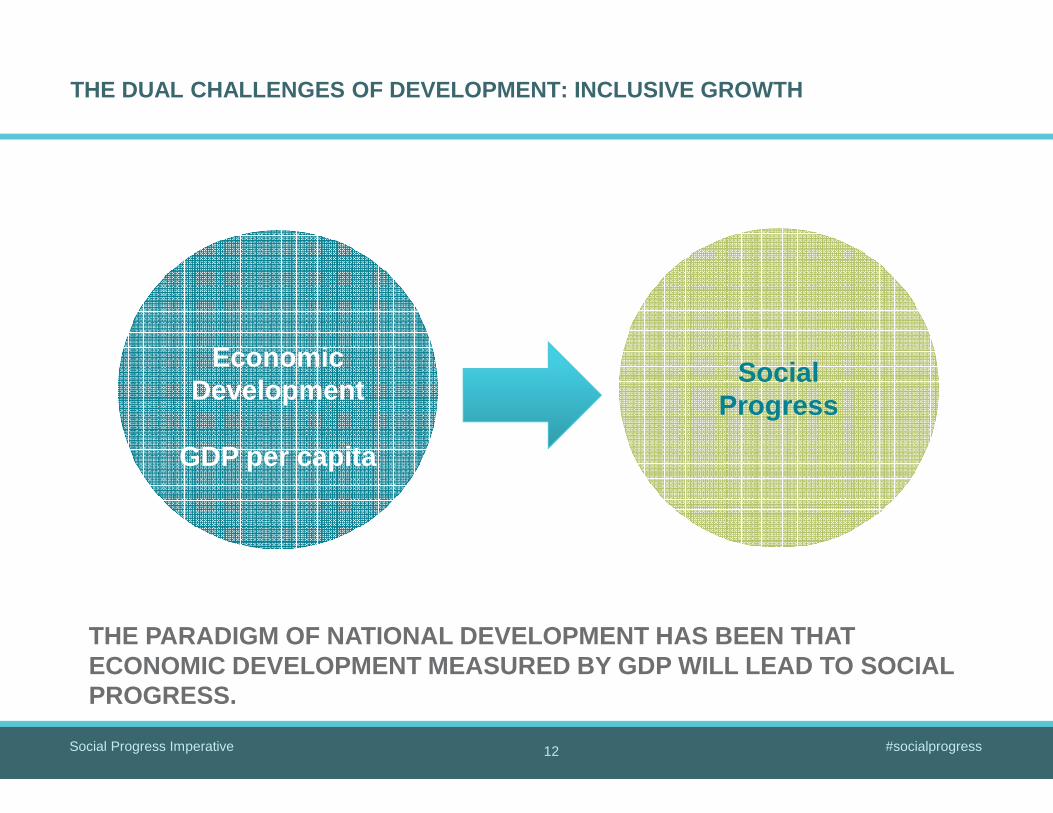
THE PARADIGM OF NATIONAL DEVELOPMENT HAS BEEN THAT ECONOMIC DEVELOPMENT MEASURED BY GDP WILL LEAD TO S OCIAL PROGRESS.
THE DUAL CHALLENGES OF DEVELOPMENT: INCLUSIVE GROWT H
Social Progress Imperative #socialprogress
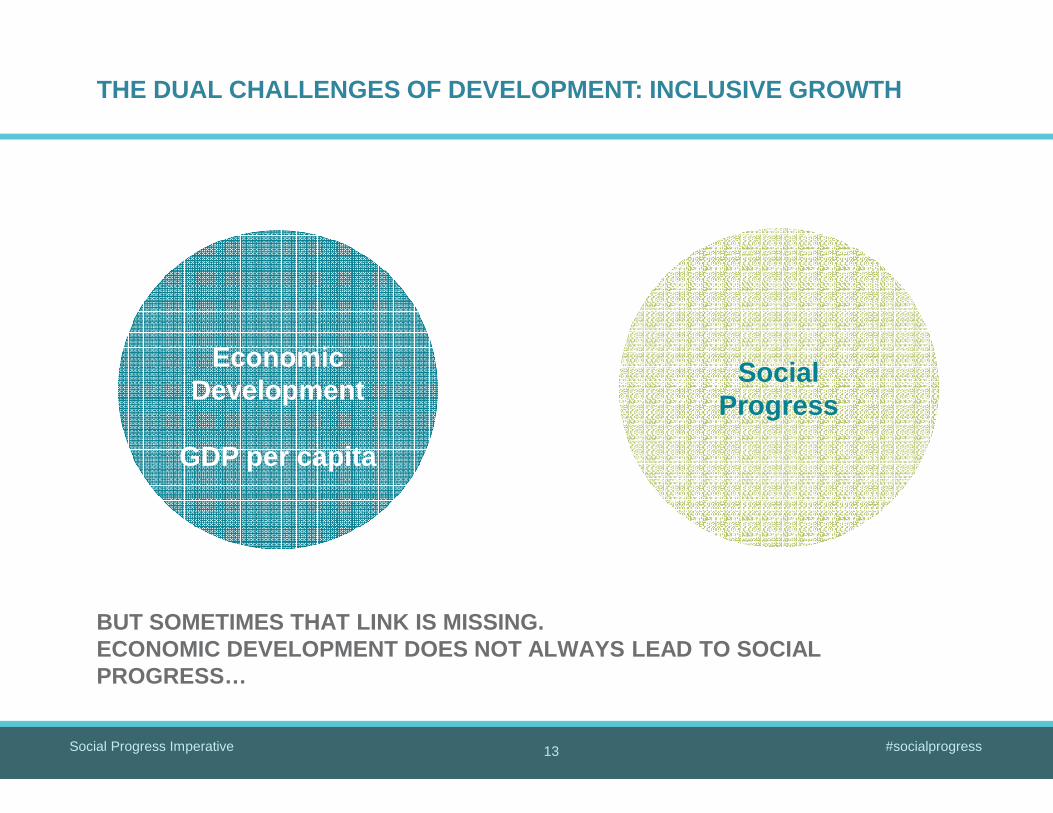
BUT SOMETIMES THAT LINK IS MISSING.ECONOMIC DEVELOPMENT DOES NOT ALWAYS LEAD TO SOCIAL PROGRESS…
Economic Development
GDP per capita
Social Progress
13
THE DUAL CHALLENGES OF DEVELOPMENT: INCLUSIVE GROWT H

Social Progress Imperative #socialprogress
…AND SOMETIMES SOCIAL PROGRESS INFLUENCES ECONOMIC DEVELOPMENT.
14
Economic Development
GDP per capita
Social Progress
THE DUAL CHALLENGES OF DEVELOPMENT: INCLUSIVE GROWT H
Social Progress Imperative #socialprogress
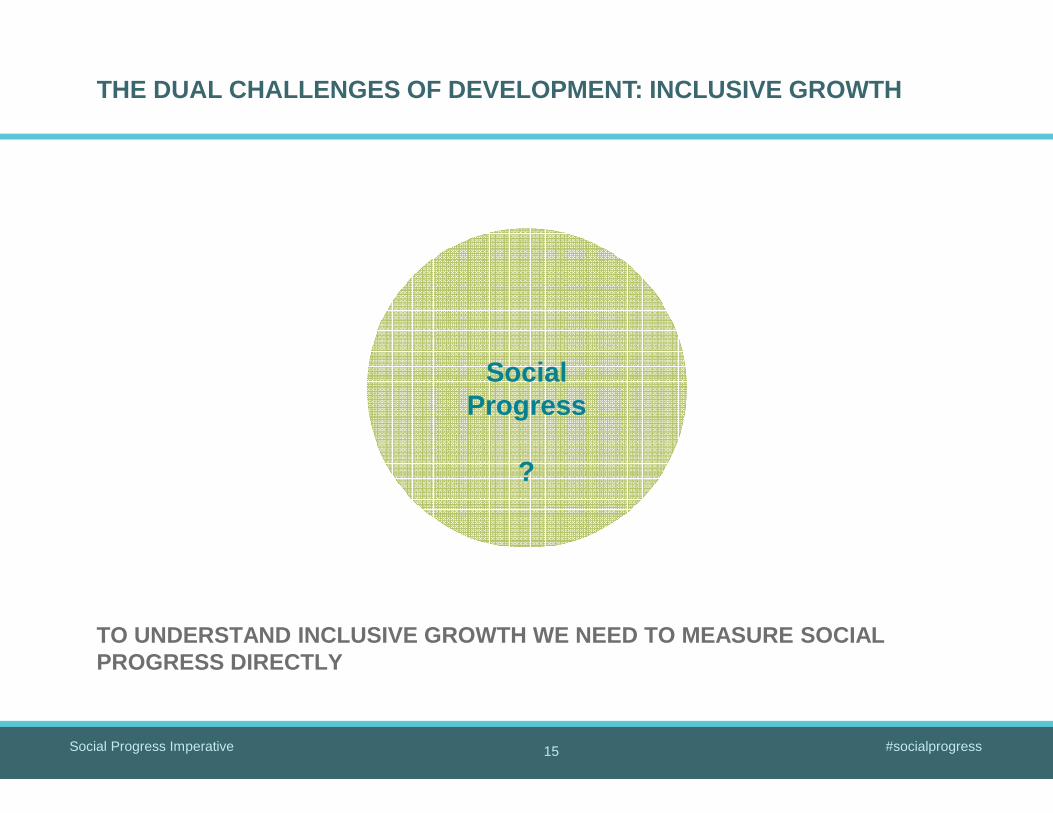
TO UNDERSTAND INCLUSIVE GROWTH WE NEED TO MEASURE S OCIAL PROGRESS DIRECTLY
Social Progress
?
15
THE DUAL CHALLENGES OF DEVELOPMENT: INCLUSIVE GROWT H
Social Progress Imperative #socialprogress
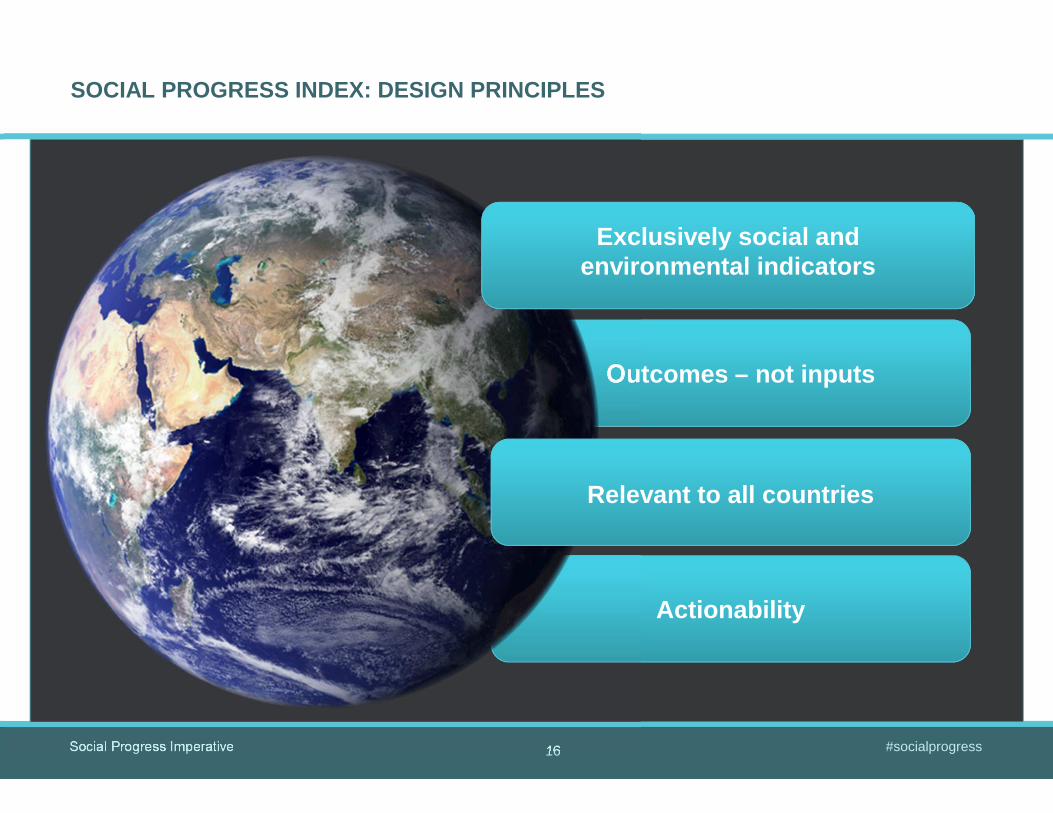
SOCIAL PROGRESS INDEX: DESIGN PRINCIPLES
16
Outcomes – not inputs
Actionability
Relevant to all countries
Exclusively social and environmental indicators
Social Progress Imperative #socialprogress
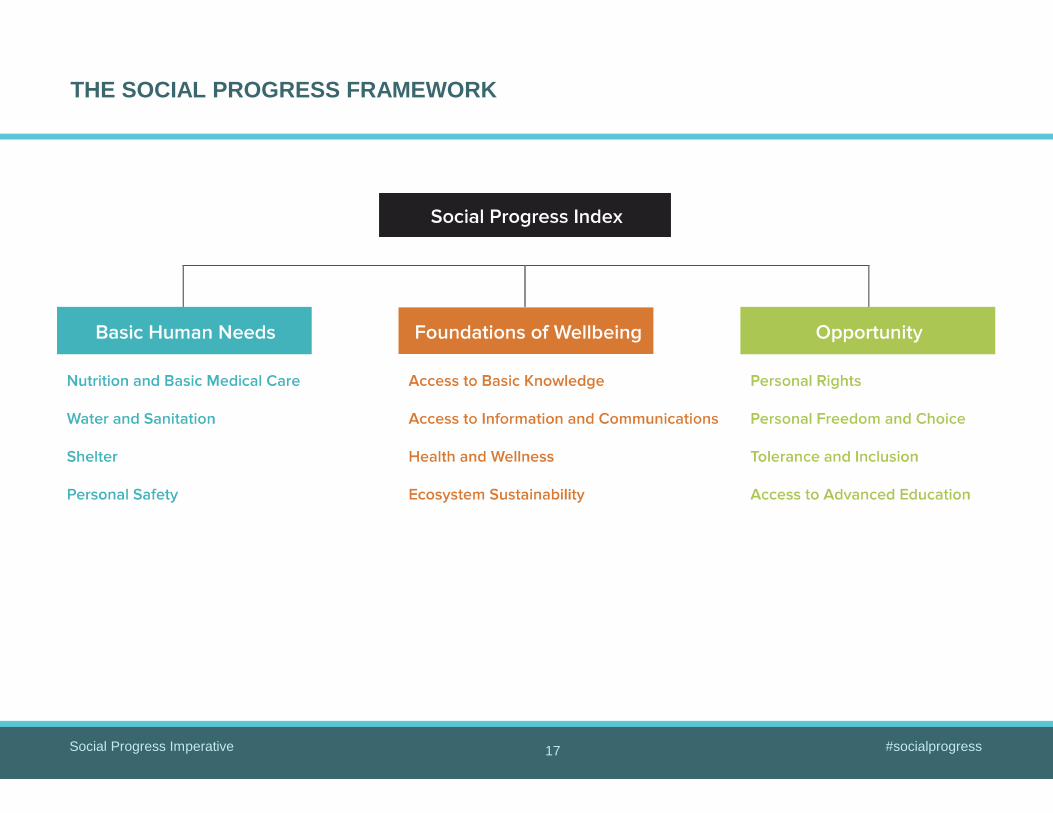
THE SOCIAL PROGRESS FRAMEWORK
17
Social Progress Imperative #socialprogress
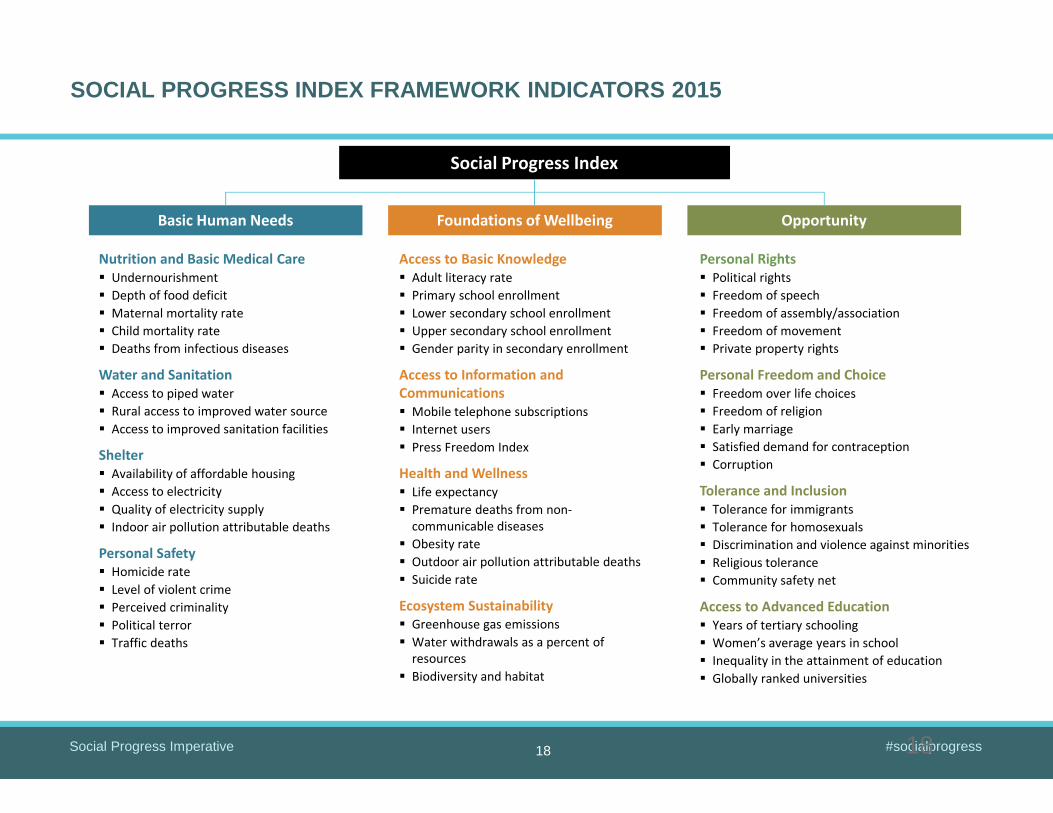
SOCIAL PROGRESS INDEX FRAMEWORK INDICATORS 2015
18
Basic Human Needs Opportunity
Nutrition and Basic Medical Care
� Undernourishment
� Depth of food deficit
� Maternal mortality rate
� Child mortality rate
� Deaths from infectious diseases
Water and Sanitation
� Access to piped water
� Rural access to improved water source
� Access to improved sanitation facilities
Shelter
� Availability of affordable housing
� Access to electricity
� Quality of electricity supply
� Indoor air pollution attributable deaths
Personal Safety
� Homicide rate
� Level of violent crime
� Perceived criminality
� Political terror
� Traffic deaths
Access to Basic Knowledge
� Adult literacy rate
� Primary school enrollment
� Lower secondary school enrollment
� Upper secondary school enrollment
� Gender parity in secondary enrollment
Access to Information and
Communications
� Mobile telephone subscriptions
� Internet users
� Press Freedom Index
Health and Wellness
� Life expectancy
� Premature deaths from non-
communicable diseases
� Obesity rate
� Outdoor air pollution attributable deaths
� Suicide rate
Ecosystem Sustainability
� Greenhouse gas emissions
� Water withdrawals as a percent of
resources
� Biodiversity and habitat
Personal Rights
� Political rights
� Freedom of speech
� Freedom of assembly/association
� Freedom of movement
� Private property rights
Personal Freedom and Choice
� Freedom over life choices
� Freedom of religion
� Early marriage
� Satisfied demand for contraception
� Corruption
Tolerance and Inclusion
� Tolerance for immigrants
� Tolerance for homosexuals
� Discrimination and violence against minorities
� Religious tolerance
� Community safety net
Access to Advanced Education
� Years of tertiary schooling
� Women’s average years in school
� Inequality in the attainment of education
� Globally ranked universities
Social Progress Index
Foundations of Wellbeing
18
Social Progress Imperative #socialprogress
SOCIAL PROGRESS INDEX VS. GDP PER CAPITA (PPP)*
19
Social Progress Imperative #socialprogress
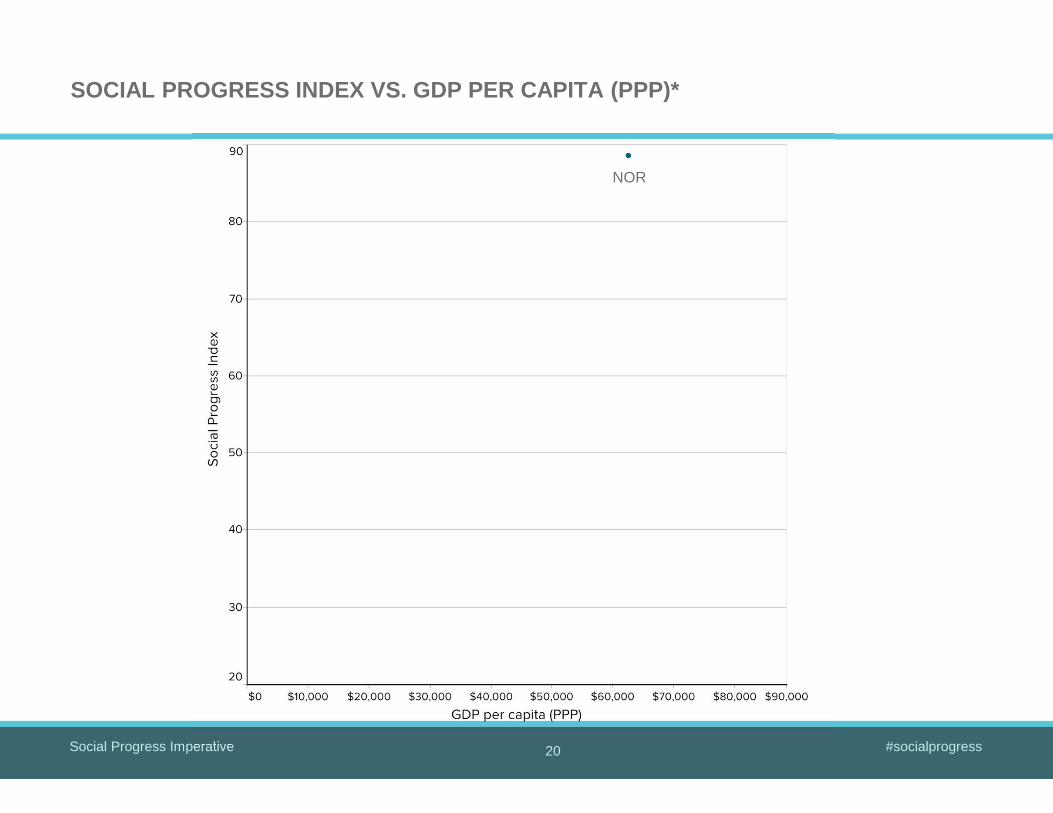
SOCIAL PROGRESS INDEX VS. GDP PER CAPITA (PPP)*
20
NOR
Social Progress Imperative #socialprogress
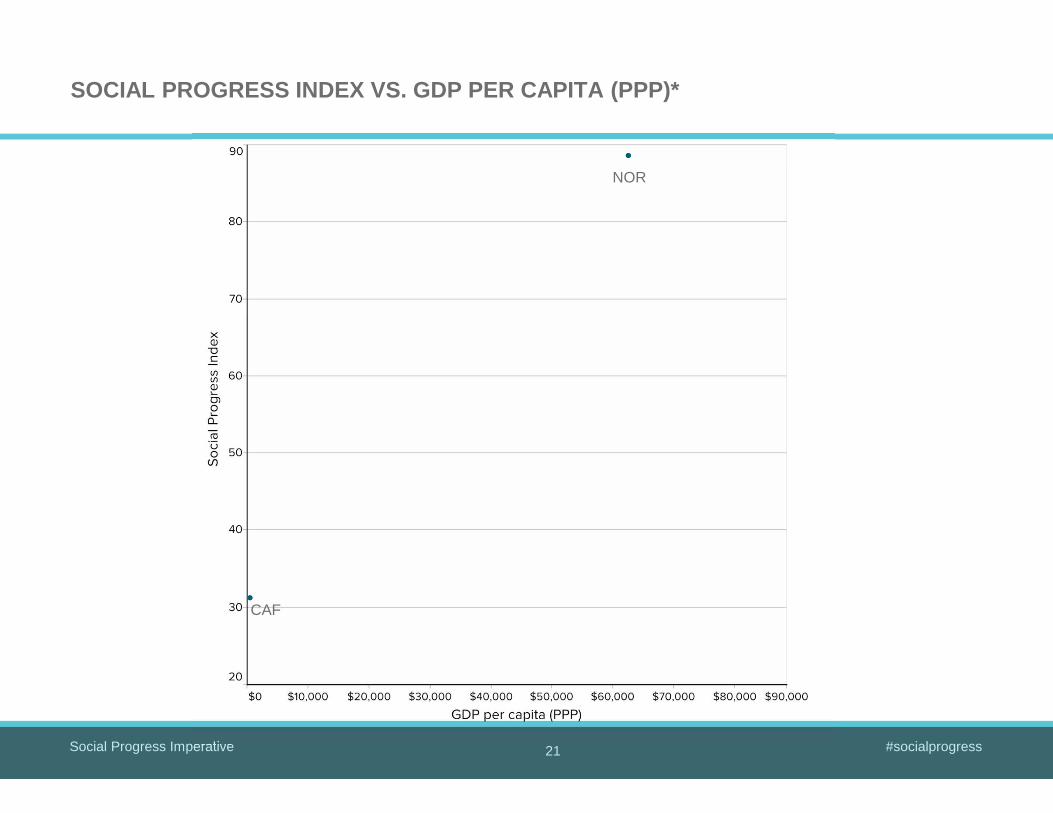
SOCIAL PROGRESS INDEX VS. GDP PER CAPITA (PPP)*
21
CAF
NOR
Social Progress Imperative #socialprogress
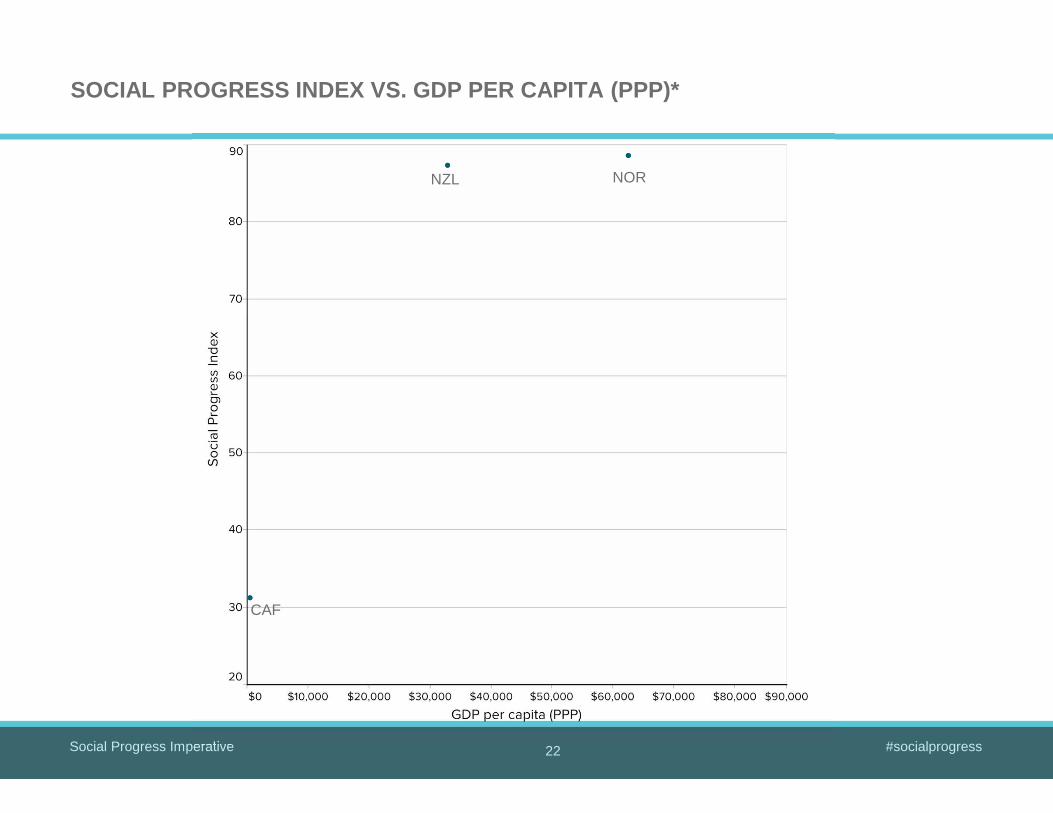
SOCIAL PROGRESS INDEX VS. GDP PER CAPITA (PPP)*
22
NZL
CAF
NOR
Social Progress Imperative #socialprogress
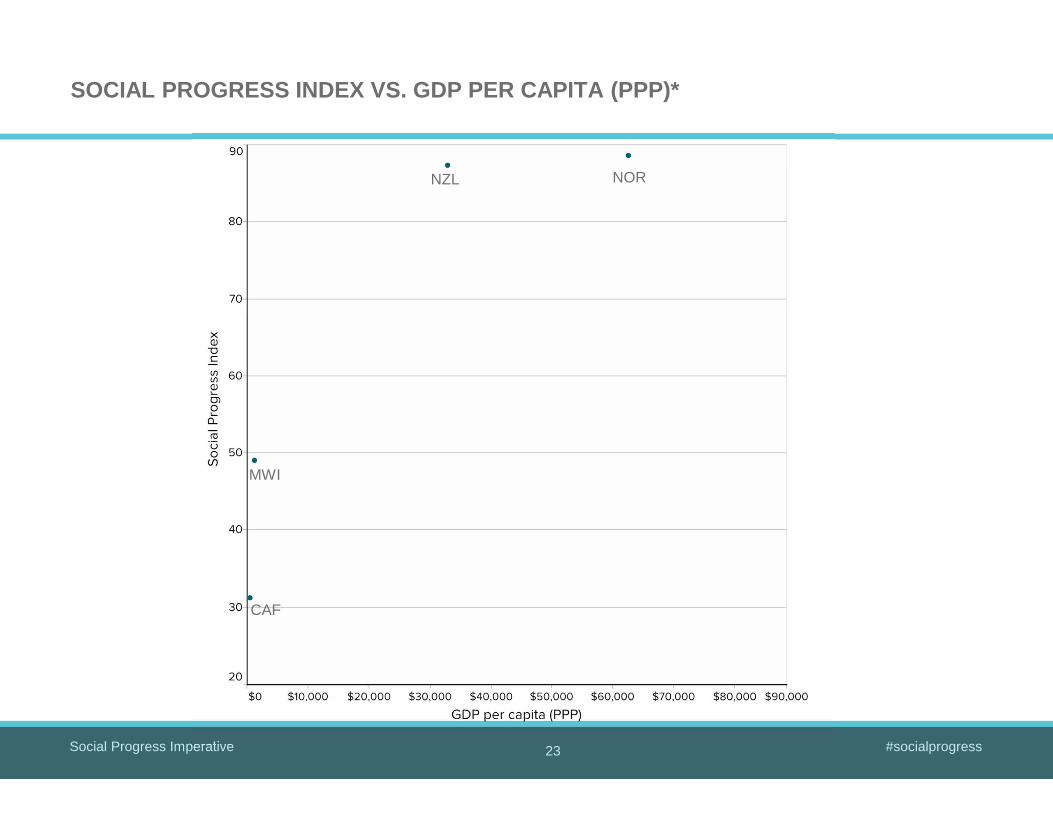
SOCIAL PROGRESS INDEX VS. GDP PER CAPITA (PPP)*
23
NZL
MWI
CAF
NOR
Social Progress Imperative #socialprogress
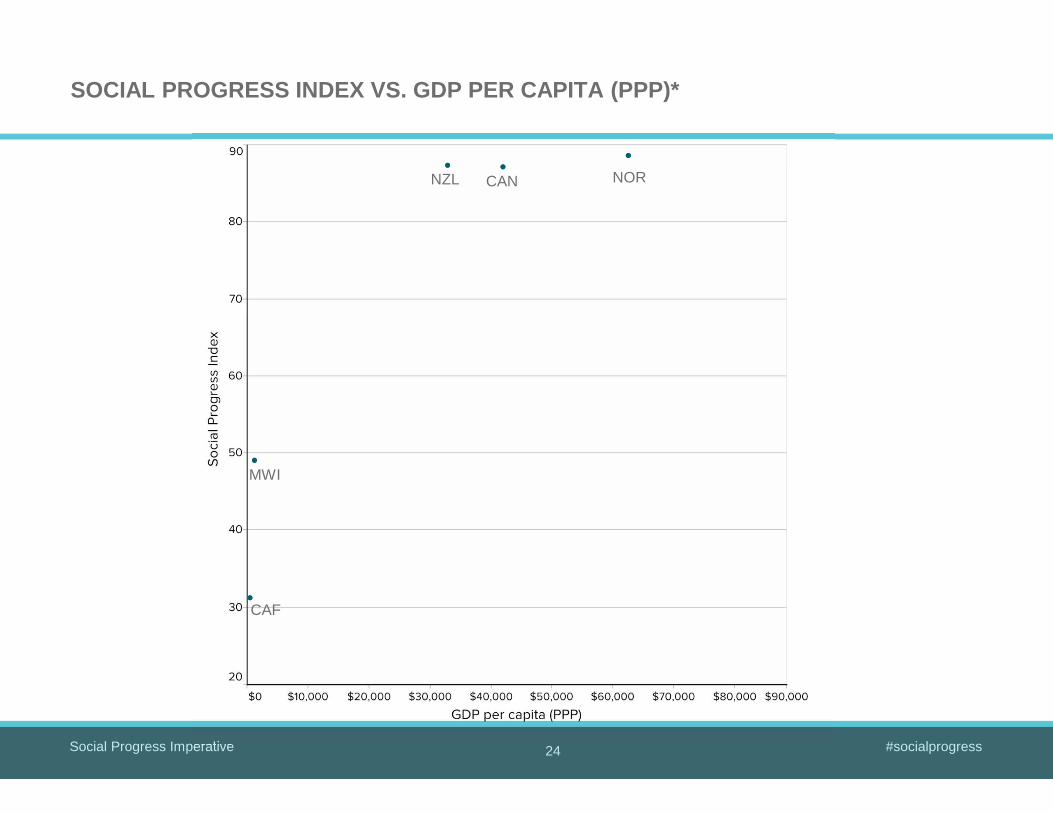
SOCIAL PROGRESS INDEX VS. GDP PER CAPITA (PPP)*
24
NZL CAN
MWI
CAF
NOR
Social Progress Imperative #socialprogress
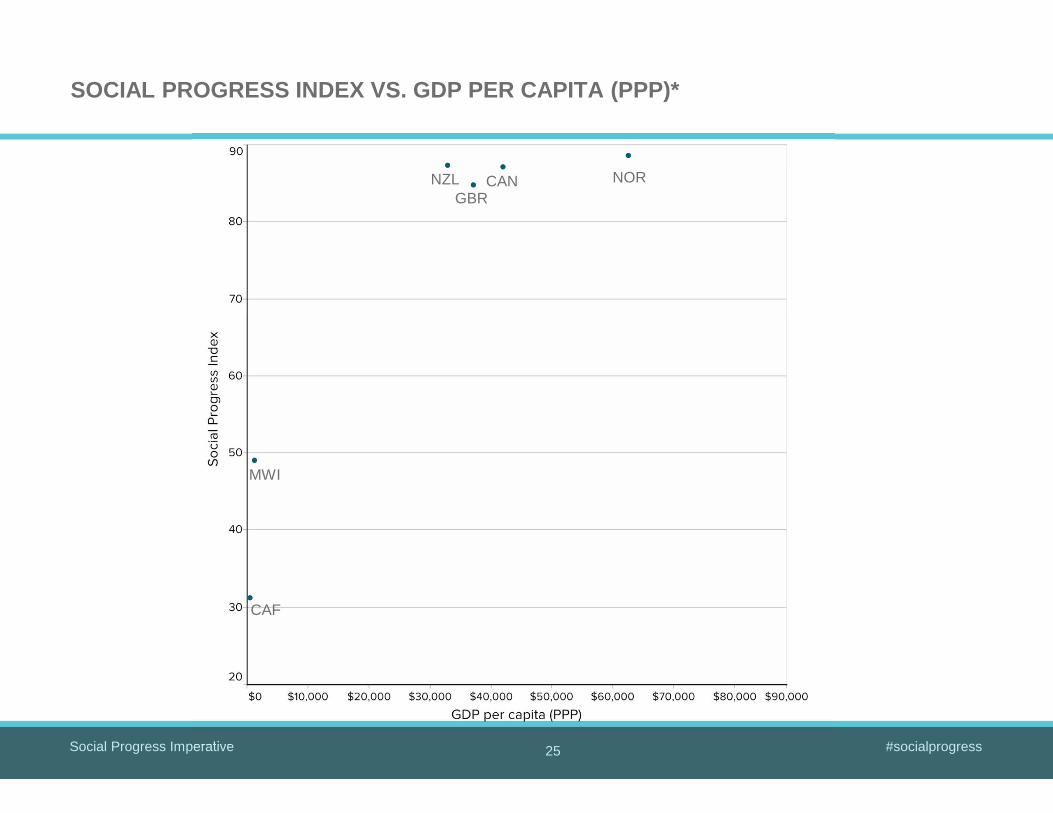
SOCIAL PROGRESS INDEX VS. GDP PER CAPITA (PPP)*
25
NZLGBR
CAN
MWI
CAF
NOR

Social Progress Imperative #socialprogress
SOCIAL PROGRESS INDEX VS. GDP PER CAPITA (PPP)*
26
NZL
USAGBR
CAN
MWI
CAF
NOR
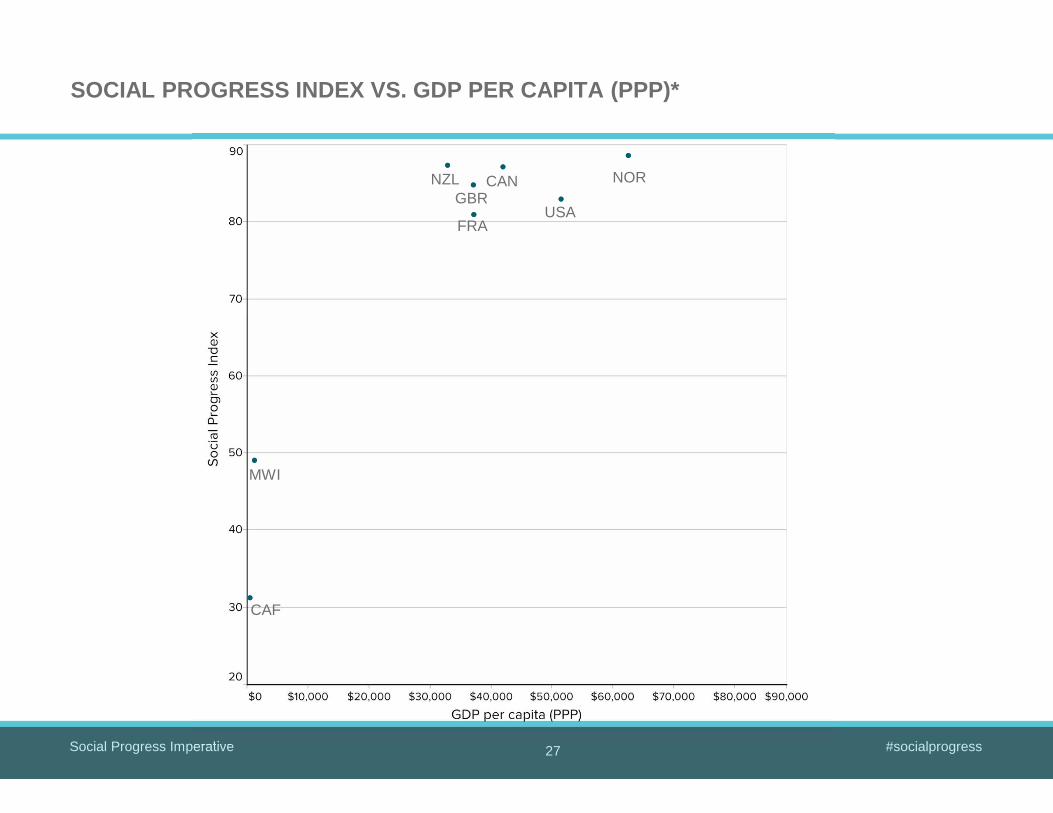
Social Progress Imperative #socialprogress
SOCIAL PROGRESS INDEX VS. GDP PER CAPITA (PPP)*
27
NZL
USAFRA
GBRCAN
MWI
CAF
NOR
Social Progress Imperative #socialprogress
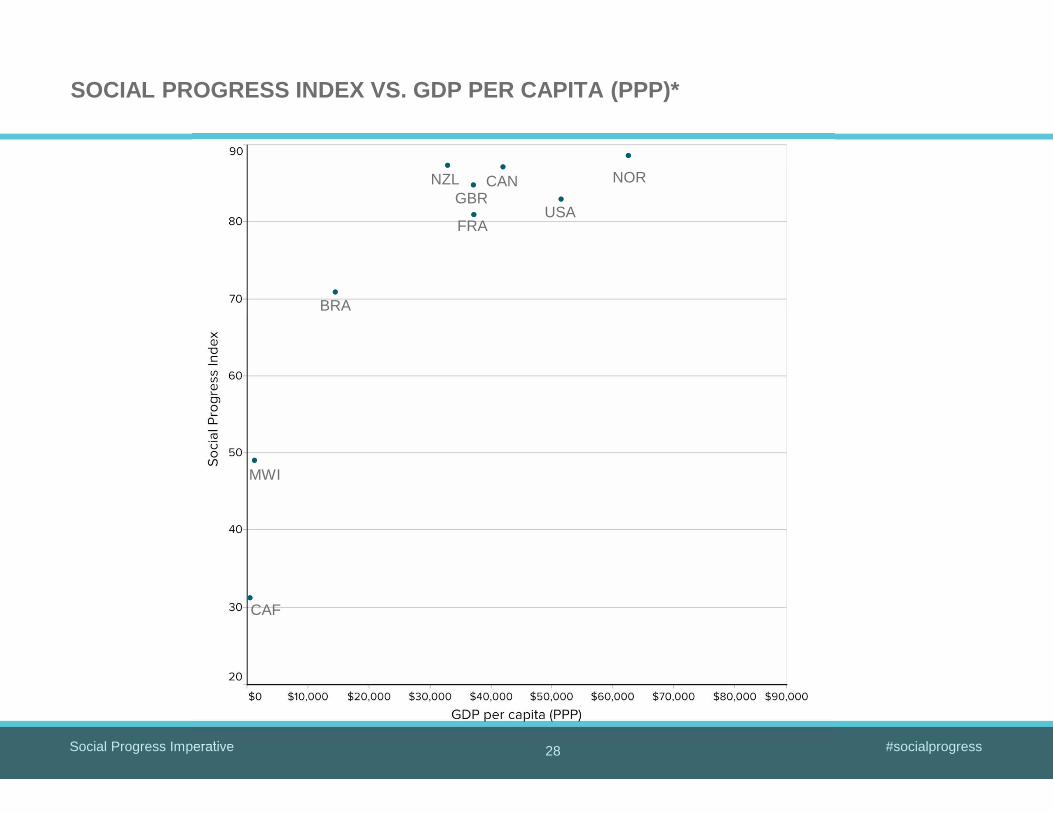
SOCIAL PROGRESS INDEX VS. GDP PER CAPITA (PPP)*
28
NZL
USAFRA
GBRCAN
BRA
MWI
CAF
NOR
Social Progress Imperative #socialprogress
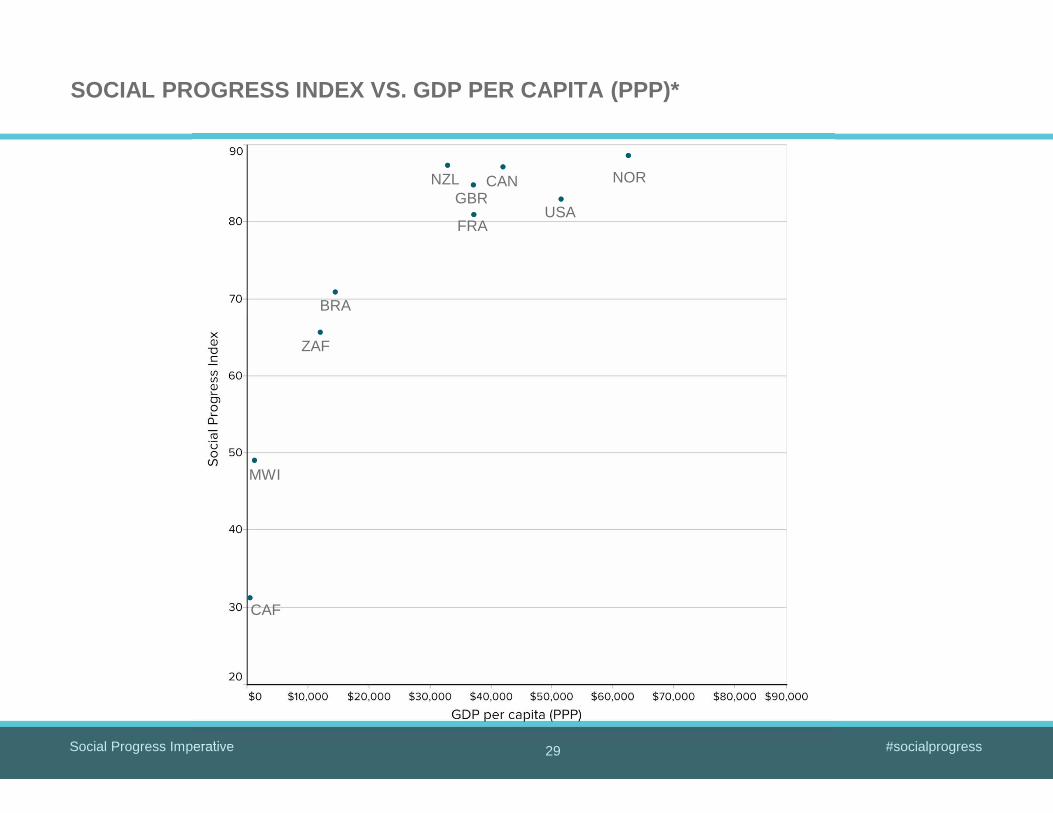
SOCIAL PROGRESS INDEX VS. GDP PER CAPITA (PPP)*
29
NZL
USAFRA
GBRCAN
BRA
ZAF
MWI
CAF
NOR
Social Progress Imperative #socialprogress
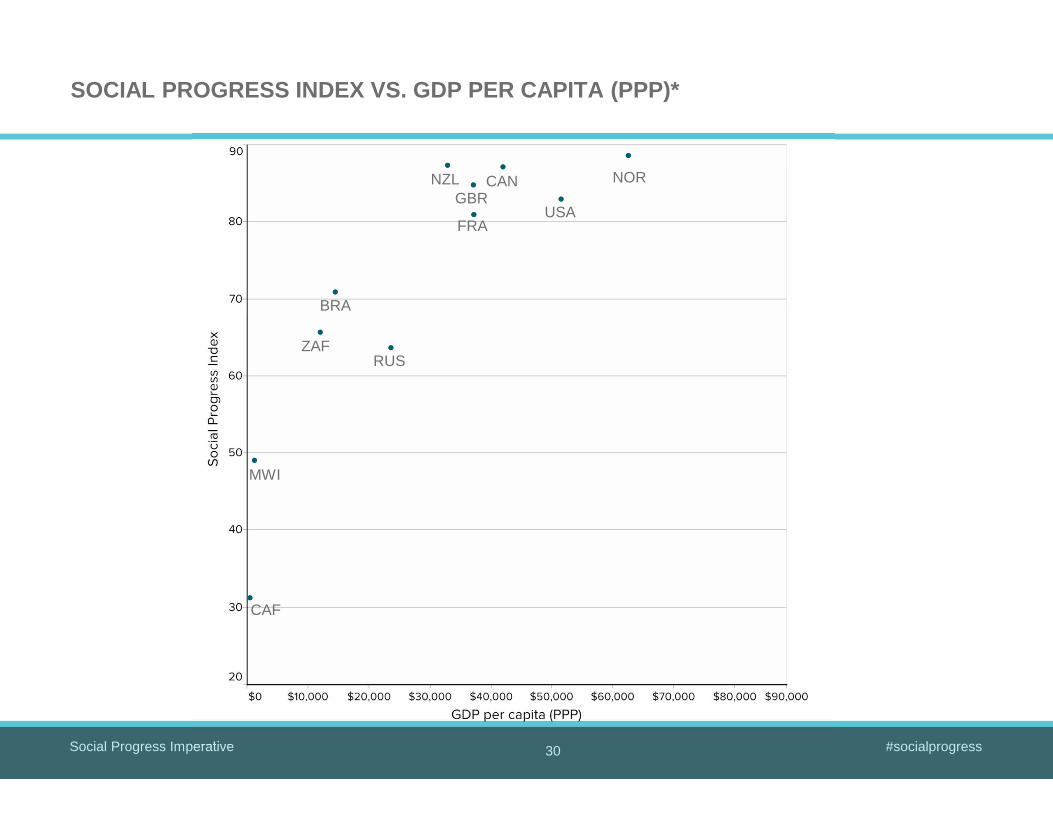
SOCIAL PROGRESS INDEX VS. GDP PER CAPITA (PPP)*
30
NZL
USAFRA
GBRCAN
BRA
RUSZAF
MWI
CAF
NOR
Social Progress Imperative #socialprogress
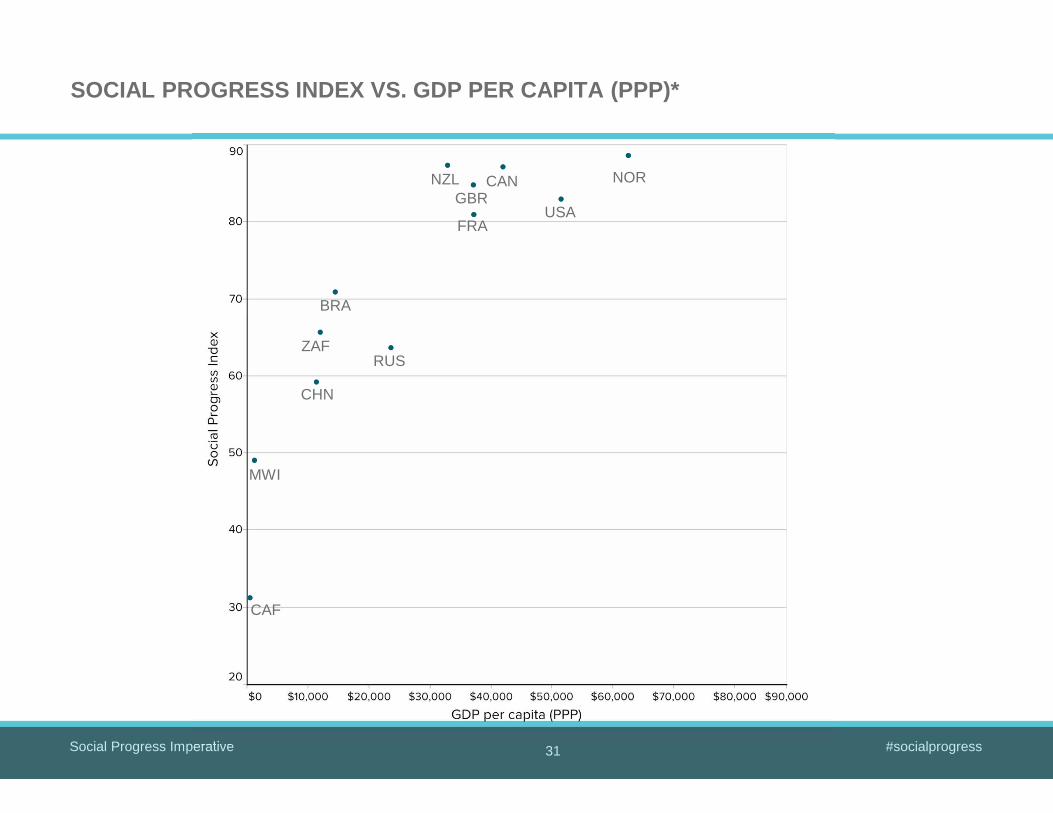
SOCIAL PROGRESS INDEX VS. GDP PER CAPITA (PPP)*
31
NZL
USAFRA
GBRCAN
BRA
RUSZAF
CHN
MWI
CAF
NOR
Social Progress Imperative #socialprogress
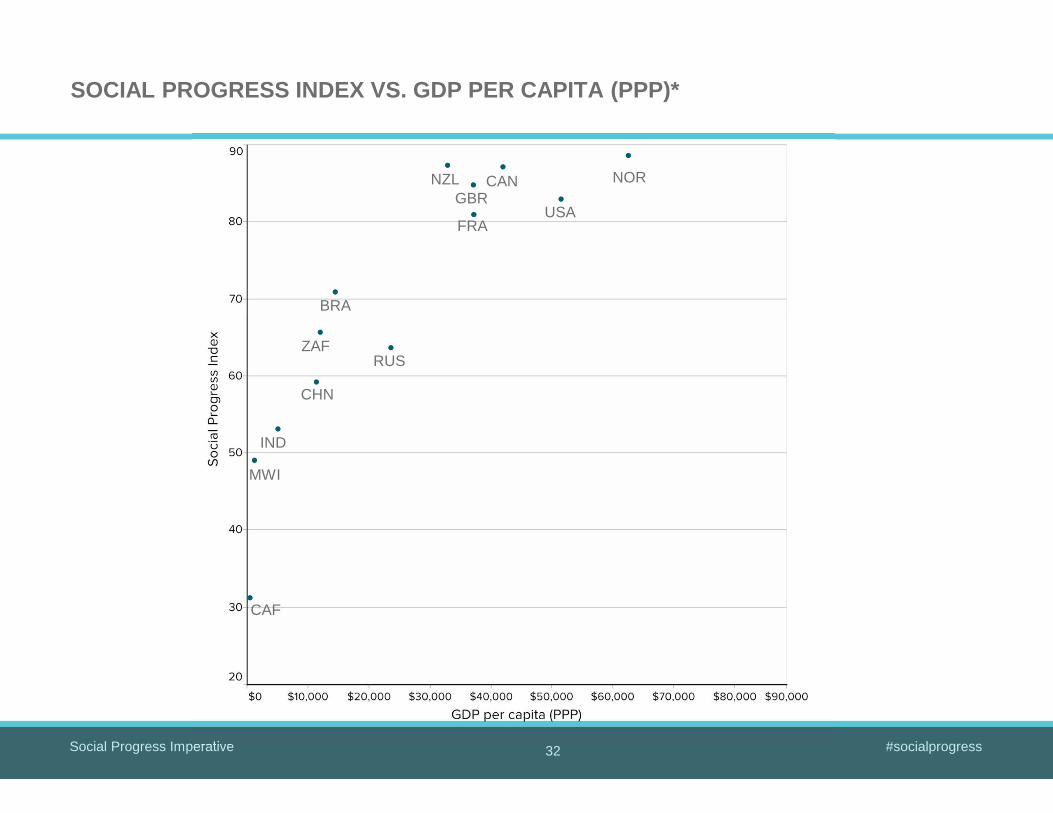
SOCIAL PROGRESS INDEX VS. GDP PER CAPITA (PPP)*
32
NZL
USAFRA
GBRCAN
BRA
RUSZAF
CHN
IND
MWI
CAF
NOR

Social Progress Imperative #socialprogress
SOCIAL PROGRESS INDEX VS. GDP PER CAPITA (PPP)*
33
NZL
KWT
USAFRA
GBRCAN
BRA
RUSZAF
CHN
IND
MWI
CAF
NOR
Social Progress Imperative #socialprogress
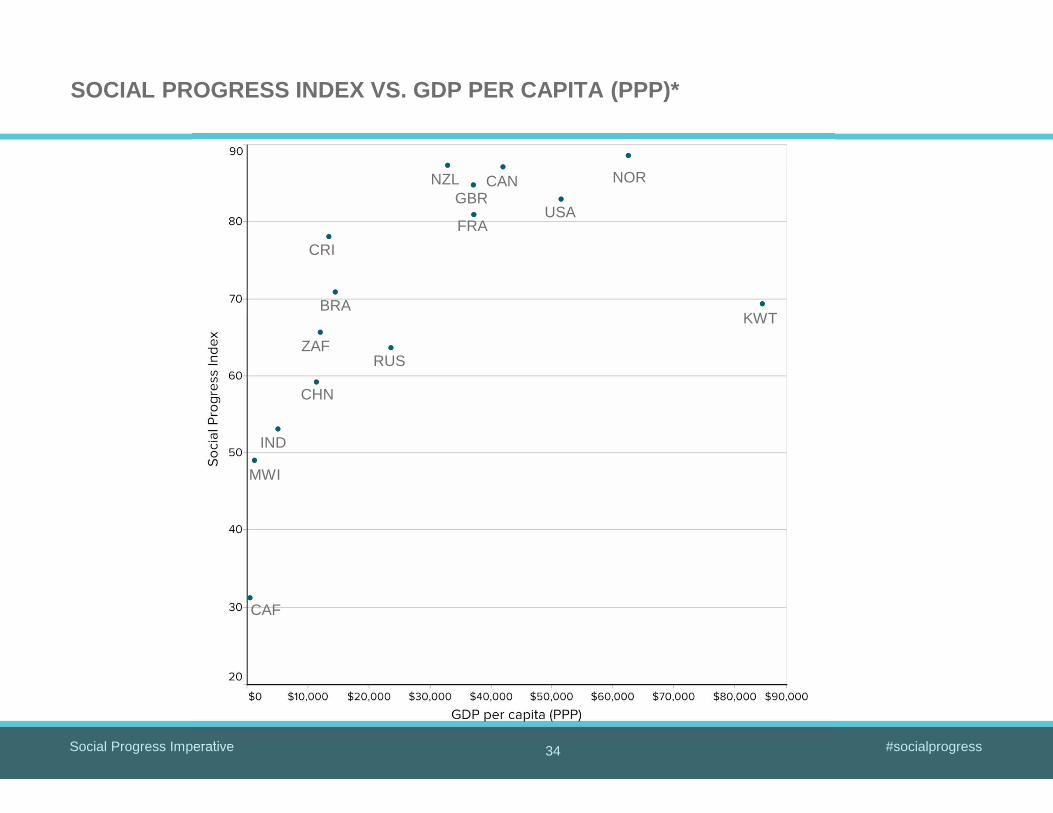
SOCIAL PROGRESS INDEX VS. GDP PER CAPITA (PPP)*
34
NZL
KWT
USAFRA
GBRCAN
CRI
BRA
RUSZAF
CHN
IND
MWI
CAF
NOR
Social Progress Imperative #socialprogress
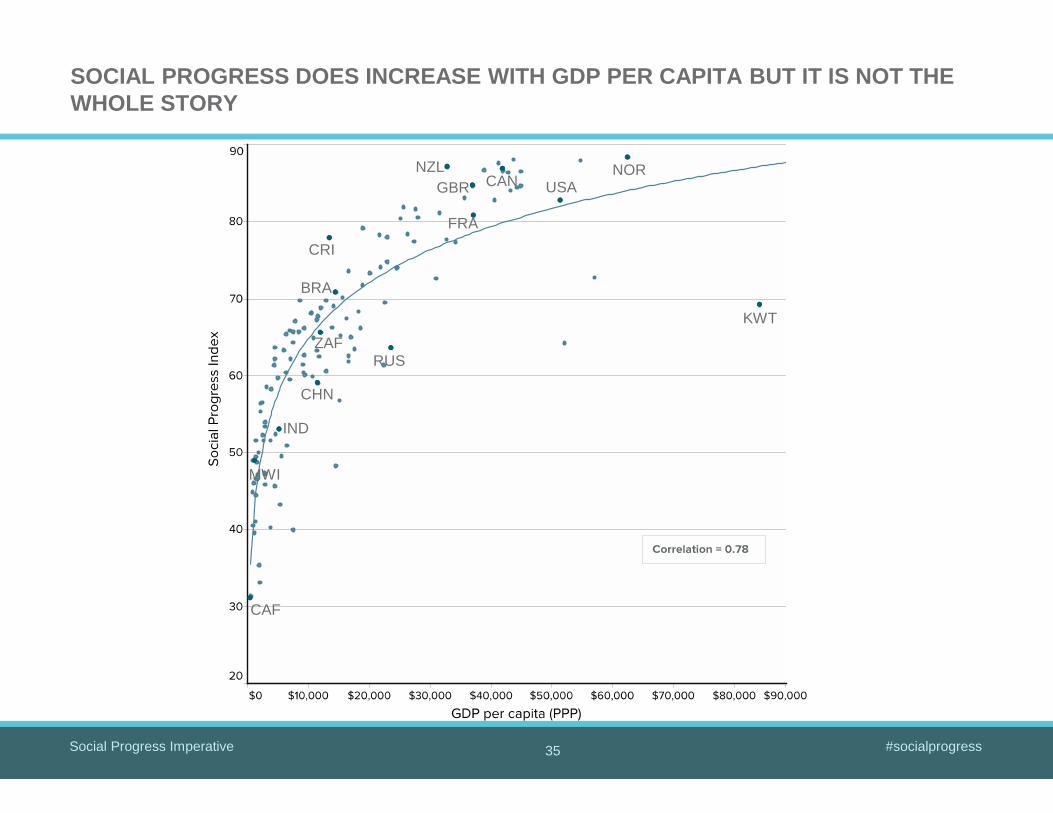
SOCIAL PROGRESS DOES INCREASE WITH GDP PER CAPITA B UT IT IS NOT THE WHOLE STORY
35
KWT
CRI
BRA
ZAF
IND
MWI
CAF
NORUSA
FRA
NZLCANGBR
RUS
CHN
Social Progress Imperative #socialprogress
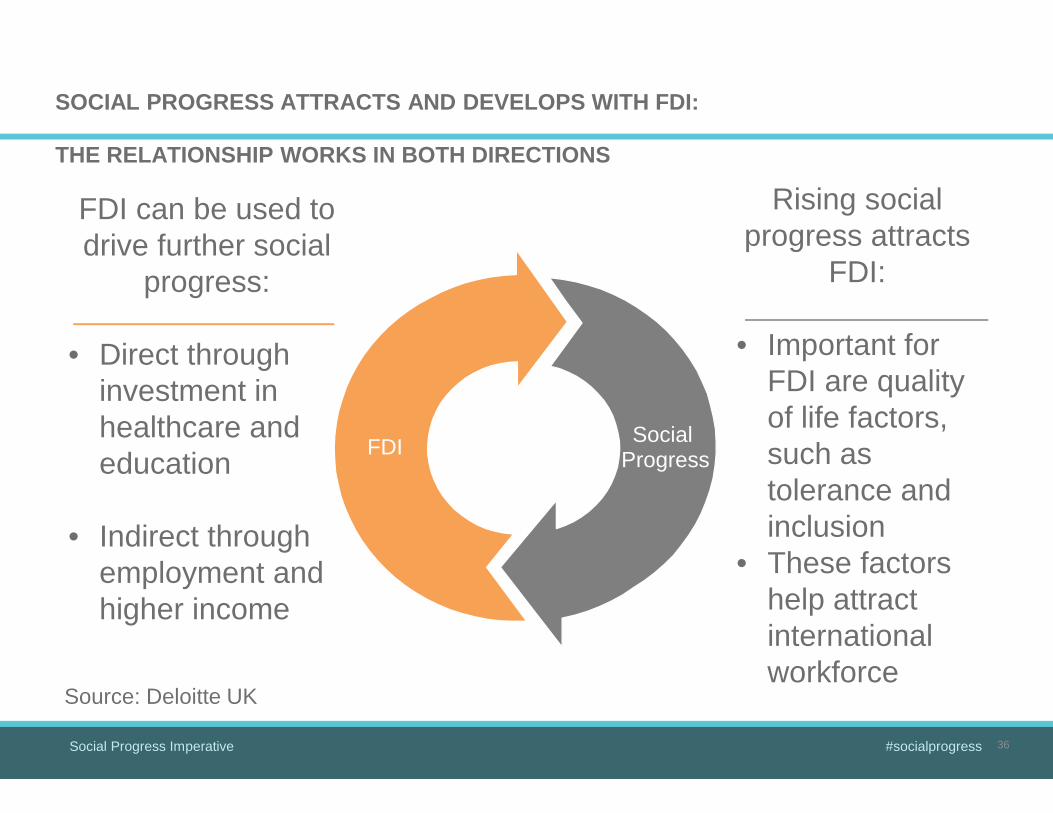
SOCIAL PROGRESS ATTRACTS AND DEVELOPS WITH FDI:
THE RELATIONSHIP WORKS IN BOTH DIRECTIONS
36
Rising social progress attracts foreign direct investment: • Important for FDI are
quality of life factors, such as tolerance and inclusion – help attract international workforce
FDI can be used to drive further social
progress:
• Direct through investment in healthcare and education
• Indirect through employment and higher income
Rising social progress attracts
FDI:
• Important for FDI are quality of life factors, such as tolerance and inclusion
• These factors help attract international workforce
FDI Social Progress
Source: Deloitte UK
Social Progress Imperative #socialprogress 37
SPI rank
SPI score
CountrySPI rank
SPI score
Country SPI rank
SPI score
Country SPI rank
SPI score
Country
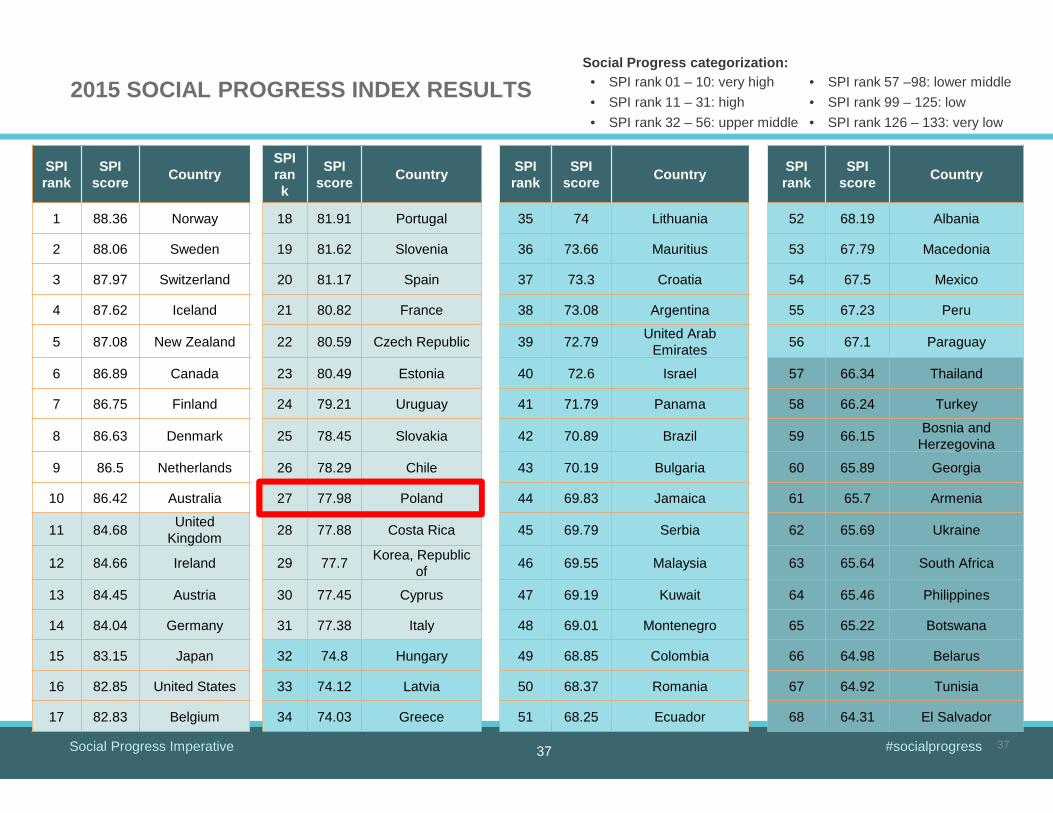
1 88.36 Norway 18 81.91 Portugal 35 74 Lithuania 52 68.19 Albania
2 88.06 Sweden 19 81.62 Slovenia 36 73.66 Mauritius 53 67.79 Macedonia
3 87.97 Switzerland 20 81.17 Spain 37 73.3 Croatia 54 67.5 Mexico
4 87.62 Iceland 21 80.82 France 38 73.08 Argentina 55 67.23 Peru
5 87.08 New Zealand 22 80.59 Czech Republic 39 72.79United Arab
Emirates56 67.1 Paraguay
6 86.89 Canada 23 80.49 Estonia 40 72.6 Israel 57 66.34 Thailand
7 86.75 Finland 24 79.21 Uruguay 41 71.79 Panama 58 66.24 Turkey
8 86.63 Denmark 25 78.45 Slovakia 42 70.89 Brazil 59 66.15Bosnia and
Herzegovina
9 86.5 Netherlands 26 78.29 Chile 43 70.19 Bulgaria 60 65.89 Georgia
10 86.42 Australia 27 77.98 Poland 44 69.83 Jamaica 61 65.7 Armenia
11 84.68United
Kingdom28 77.88 Costa Rica 45 69.79 Serbia 62 65.69 Ukraine
12 84.66 Ireland 29 77.7Korea, Republic
of46 69.55 Malaysia 63 65.64 South Africa
13 84.45 Austria 30 77.45 Cyprus 47 69.19 Kuwait 64 65.46 Philippines
14 84.04 Germany 31 77.38 Italy 48 69.01 Montenegro 65 65.22 Botswana
15 83.15 Japan 32 74.8 Hungary 49 68.85 Colombia 66 64.98 Belarus
16 82.85 United States 33 74.12 Latvia 50 68.37 Romania 67 64.92 Tunisia
17 82.83 Belgium 34 74.03 Greece 51 68.25 Ecuador 68 64.31 El Salvador
Social Progress categorization:• SPI rank 01 – 10: very high
• SPI rank 11 – 31: high
• SPI rank 32 – 56: upper middle
• SPI rank 57 –98: lower middle
• SPI rank 99 – 125: low
• SPI rank 126 – 133: very low
2015 SOCIAL PROGRESS INDEX RESULTS
37
Social Progress Imperative #socialprogress 38
SPI rank
SPI score
CountrySPI rank
SPI score
Country SPI rank
SPI score
Country SPI rank
SPI score
Country
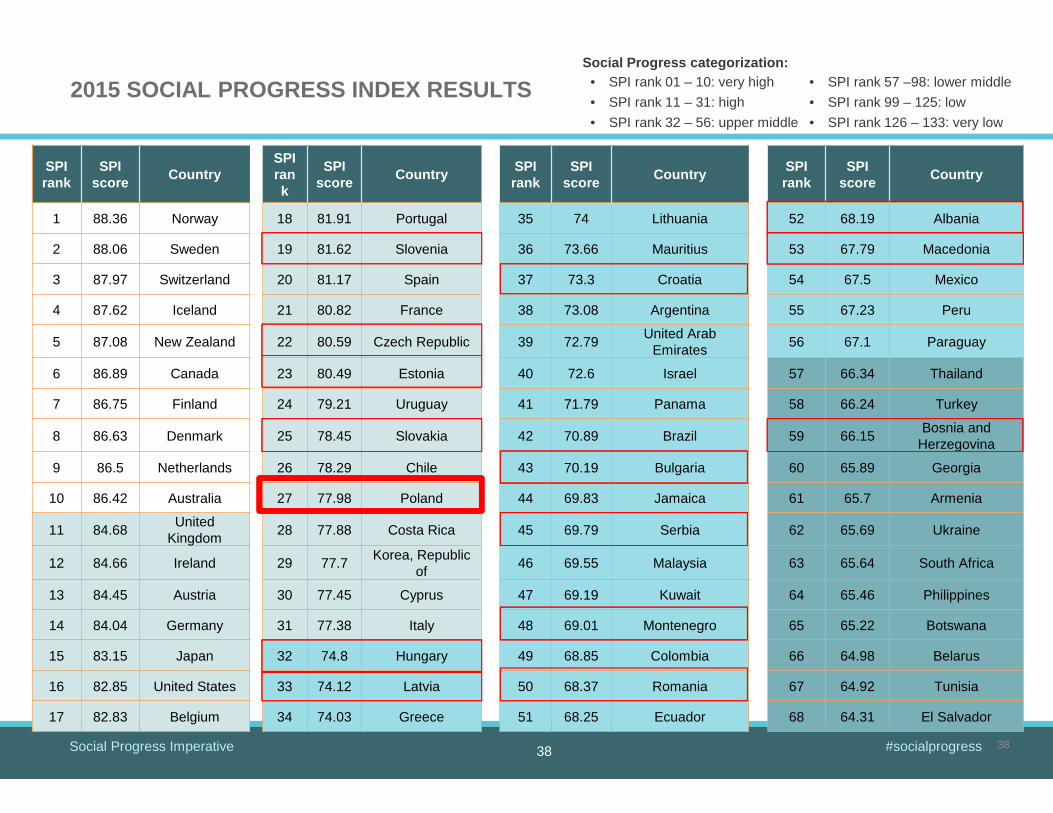
1 88.36 Norway 18 81.91 Portugal 35 74 Lithuania 52 68.19 Albania
2 88.06 Sweden 19 81.62 Slovenia 36 73.66 Mauritius 53 67.79 Macedonia
3 87.97 Switzerland 20 81.17 Spain 37 73.3 Croatia 54 67.5 Mexico
4 87.62 Iceland 21 80.82 France 38 73.08 Argentina 55 67.23 Peru
5 87.08 New Zealand 22 80.59 Czech Republic 39 72.79United Arab
Emirates56 67.1 Paraguay
6 86.89 Canada 23 80.49 Estonia 40 72.6 Israel 57 66.34 Thailand
7 86.75 Finland 24 79.21 Uruguay 41 71.79 Panama 58 66.24 Turkey
8 86.63 Denmark 25 78.45 Slovakia 42 70.89 Brazil 59 66.15Bosnia and
Herzegovina
9 86.5 Netherlands 26 78.29 Chile 43 70.19 Bulgaria 60 65.89 Georgia
10 86.42 Australia 27 77.98 Poland 44 69.83 Jamaica 61 65.7 Armenia
11 84.68United
Kingdom28 77.88 Costa Rica 45 69.79 Serbia 62 65.69 Ukraine
12 84.66 Ireland 29 77.7Korea, Republic
of46 69.55 Malaysia 63 65.64 South Africa
13 84.45 Austria 30 77.45 Cyprus 47 69.19 Kuwait 64 65.46 Philippines
14 84.04 Germany 31 77.38 Italy 48 69.01 Montenegro 65 65.22 Botswana
15 83.15 Japan 32 74.8 Hungary 49 68.85 Colombia 66 64.98 Belarus
16 82.85 United States 33 74.12 Latvia 50 68.37 Romania 67 64.92 Tunisia
17 82.83 Belgium 34 74.03 Greece 51 68.25 Ecuador 68 64.31 El Salvador
Social Progress categorization:• SPI rank 01 – 10: very high
• SPI rank 11 – 31: high
• SPI rank 32 – 56: upper middle
• SPI rank 57 –98: lower middle
• SPI rank 99 – 125: low
• SPI rank 126 – 133: very low
2015 SOCIAL PROGRESS INDEX RESULTS
38
Social Progress Imperative #socialprogress
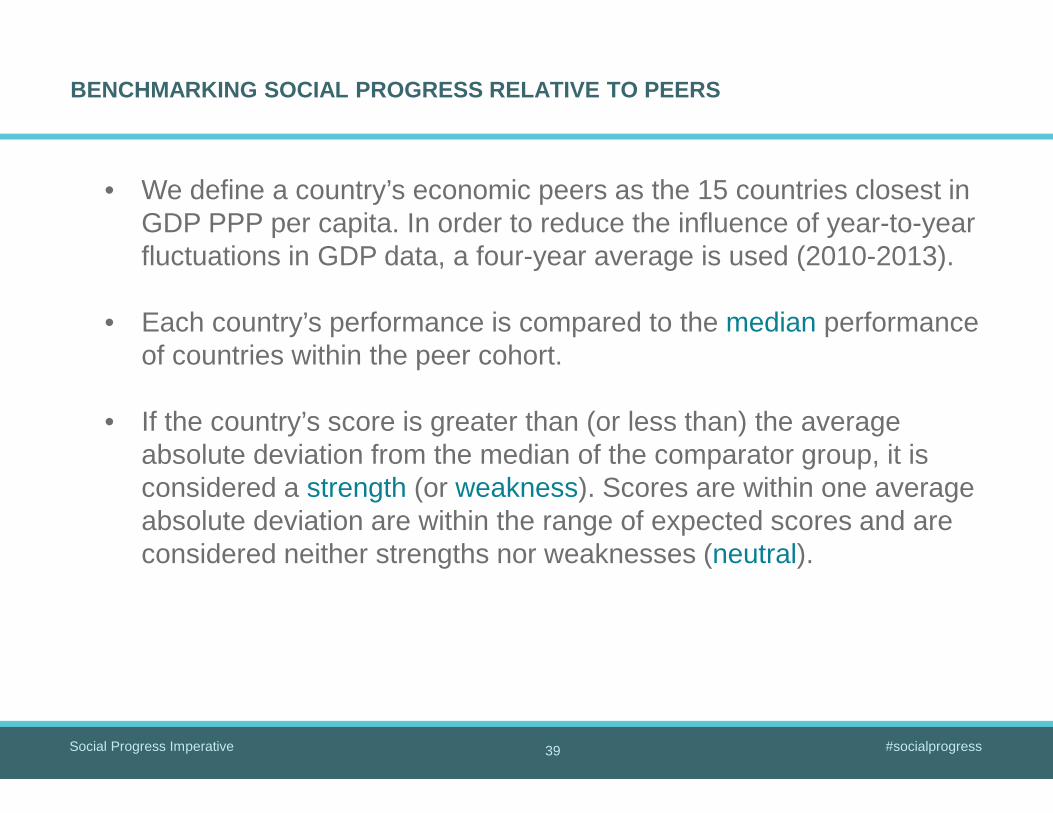
BENCHMARKING SOCIAL PROGRESS RELATIVE TO PEERS
39
• We define a country’s economic peers as the 15 countries closest in GDP PPP per capita. In order to reduce the influence of year-to-year fluctuations in GDP data, a four-year average is used (2010-2013).
• Each country’s performance is compared to the median performance of countries within the peer cohort.
• If the country’s score is greater than (or less than) the average absolute deviation from the median of the comparator group, it is considered a strength (or weakness). Scores are within one average absolute deviation are within the range of expected scores and are considered neither strengths nor weaknesses (neutral).
www.socialprogressimperative.org
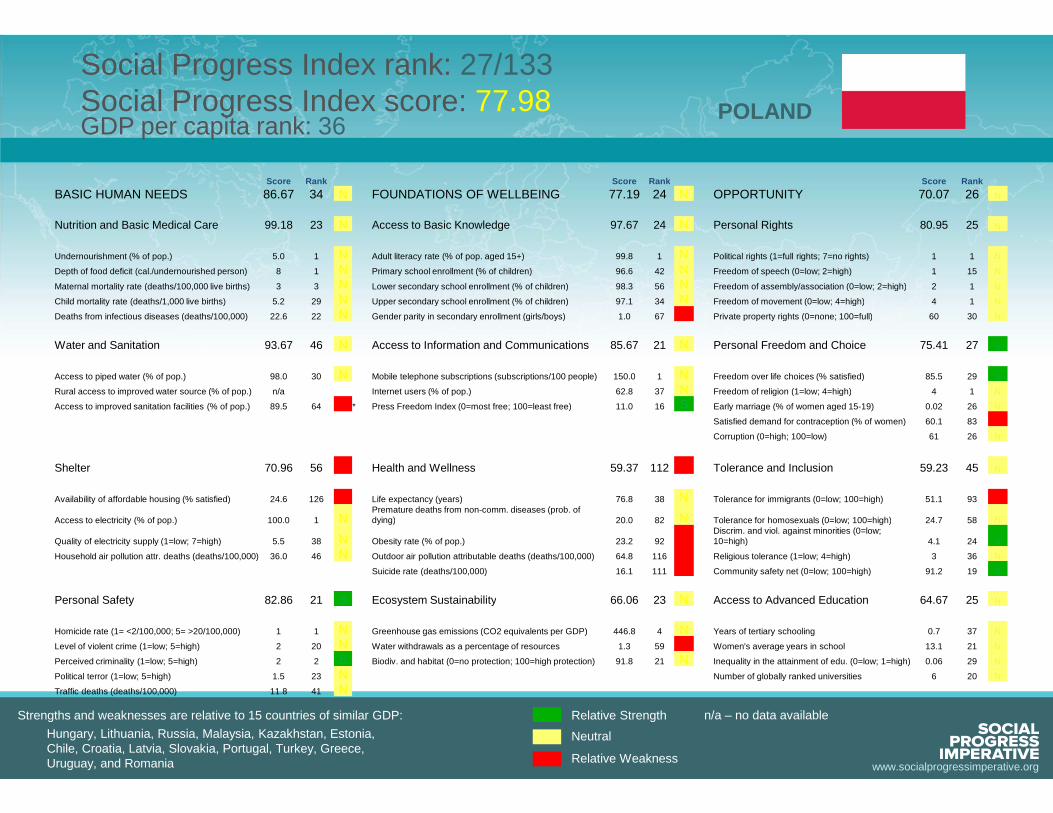
Strengths and weaknesses are relative to 15 countries of similar GDP: Relative Strength n/a – no data available
Neutral
Relative Weakness
POLAND
Score Rank Score Rank Score Rank
BASIC HUMAN NEEDS 86.67 34 N FOUNDATIONS OF WELLBEING 77.19 24 N OPPORTUNITY 70.07 26 N
Nutrition and Basic Medical Care 99.18 23 N Access to Basic Knowledge 97.67 24 N Personal Rights 80.95 25 N
Undernourishment (% of pop.) 5.0 1 N Adult literacy rate (% of pop. aged 15+) 99.8 1 N Political rights (1=full rights; 7=no rights) 1 1 N
Depth of food deficit (cal./undernourished person) 8 1 N Primary school enrollment (% of children) 96.6 42 N Freedom of speech (0=low; 2=high) 1 15 N
Maternal mortality rate (deaths/100,000 live births) 3 3 N Lower secondary school enrollment (% of children) 98.3 56 N Freedom of assembly/association (0=low; 2=high) 2 1 N
Child mortality rate (deaths/1,000 live births) 5.2 29 N Upper secondary school enrollment (% of children) 97.1 34 N Freedom of movement (0=low; 4=high) 4 1 N
Deaths from infectious diseases (deaths/100,000) 22.6 22 N Gender parity in secondary enrollment (girls/boys) 1.0 67 W Private property rights (0=none; 100=full) 60 30 N
Water and Sanitation 93.67 46 N Access to Information and Communications 85.67 21 N Personal Freedom and Choice 75.41 27 S
Access to piped water (% of pop.) 98.0 30 N Mobile telephone subscriptions (subscriptions/100 people) 150.0 1 N Freedom over life choices (% satisfied) 85.5 29 S
Rural access to improved water source (% of pop.) n/a Internet users (% of pop.) 62.8 37 N Freedom of religion (1=low; 4=high) 4 1 N
Access to improved sanitation facilities (% of pop.) 89.5 64 W * Press Freedom Index (0=most free; 100=least free) 11.0 16 S Early marriage (% of women aged 15-19) 0.02 26 N
Satisfied demand for contraception (% of women) 60.1 83 W
Corruption (0=high; 100=low) 61 26 N
Shelter 70.96 56 W Health and Wellness 59.37 112 W Tolerance and Inclusion 59.23 45 N
Availability of affordable housing (% satisfied) 24.6 126 W Life expectancy (years) 76.8 38 N Tolerance for immigrants (0=low; 100=high) 51.1 93 W
Access to electricity (% of pop.) 100.0 1 NPremature deaths from non-comm. diseases (prob. of dying) 20.0 82 N Tolerance for homosexuals (0=low; 100=high) 24.7 58 N
Quality of electricity supply (1=low; 7=high) 5.5 38 N Obesity rate (% of pop.) 23.2 92 WDiscrim. and viol. against minorities (0=low; 10=high) 4.1 24 S
Household air pollution attr. deaths (deaths/100,000) 36.0 46 N Outdoor air pollution attributable deaths (deaths/100,000) 64.8 116 W Religious tolerance (1=low; 4=high) 3 36 N
Suicide rate (deaths/100,000) 16.1 111 W Community safety net (0=low; 100=high) 91.2 19 S
Personal Safety 82.86 21 S Ecosystem Sustainability 66.06 23 N Access to Advanced Education 64.67 25 N
Homicide rate (1= <2/100,000; 5= >20/100,000) 1 1 N Greenhouse gas emissions (CO2 equivalents per GDP) 446.8 4 N Years of tertiary schooling 0.7 37 N
Level of violent crime (1=low; 5=high) 2 20 N Water withdrawals as a percentage of resources 1.3 59 W Women's average years in school 13.1 21 N
Perceived criminality (1=low; 5=high) 2 2 S Biodiv. and habitat (0=no protection; 100=high protection) 91.8 21 N Inequality in the attainment of edu. (0=low; 1=high) 0.06 29 N
Political terror (1=low; 5=high) 1.5 23 N Number of globally ranked universities 6 20 N
Traffic deaths (deaths/100,000) 11.8 41 N
Hungary, Lithuania, Russia, Malaysia, Kazakhstan, Estonia, Chile, Croatia, Latvia, Slovakia, Portugal, Turkey, Greece, Uruguay, and Romania
GDP per capita rank: 36
Social Progress Index rank: 27/133 Social Progress Index score: 77.98
www.socialprogressimperative.org
Strengths and weaknesses are relative to 15 countries of similar GDP: Relative Strength n/a – no data available
Neutral
Relative Weakness
FROM INDEX TO ACTION TO IMPACT
Social Progress Imperative #socialprogress42
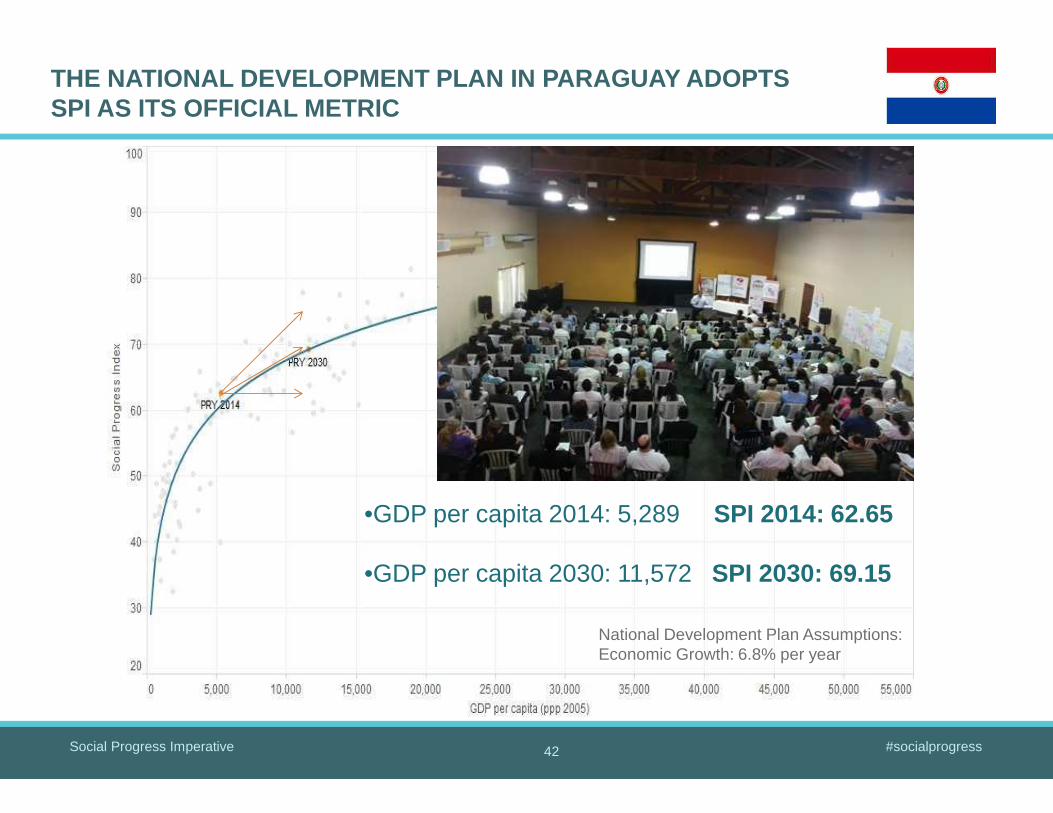
National Development Plan Assumptions:Economic Growth: 6.8% per year
•GDP per capita 2014: 5,289 SPI 2014: 62.65
•GDP per capita 2030: 11,572 SPI 2030: 69.15
THE NATIONAL DEVELOPMENT PLAN IN PARAGUAY ADOPTS SPI AS ITS OFFICIAL METRIC
Social Progress Imperative #socialprogress
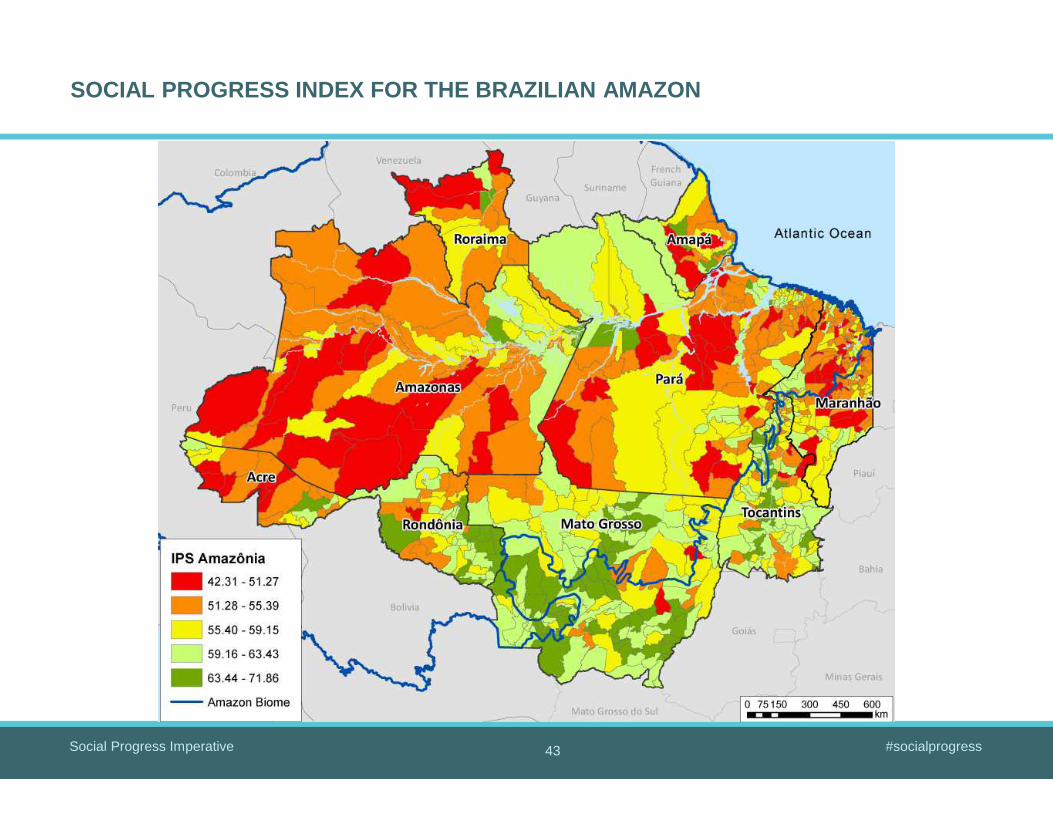
SOCIAL PROGRESS INDEX FOR THE BRAZILIAN AMAZON
43
Social Progress Imperative #socialprogress44
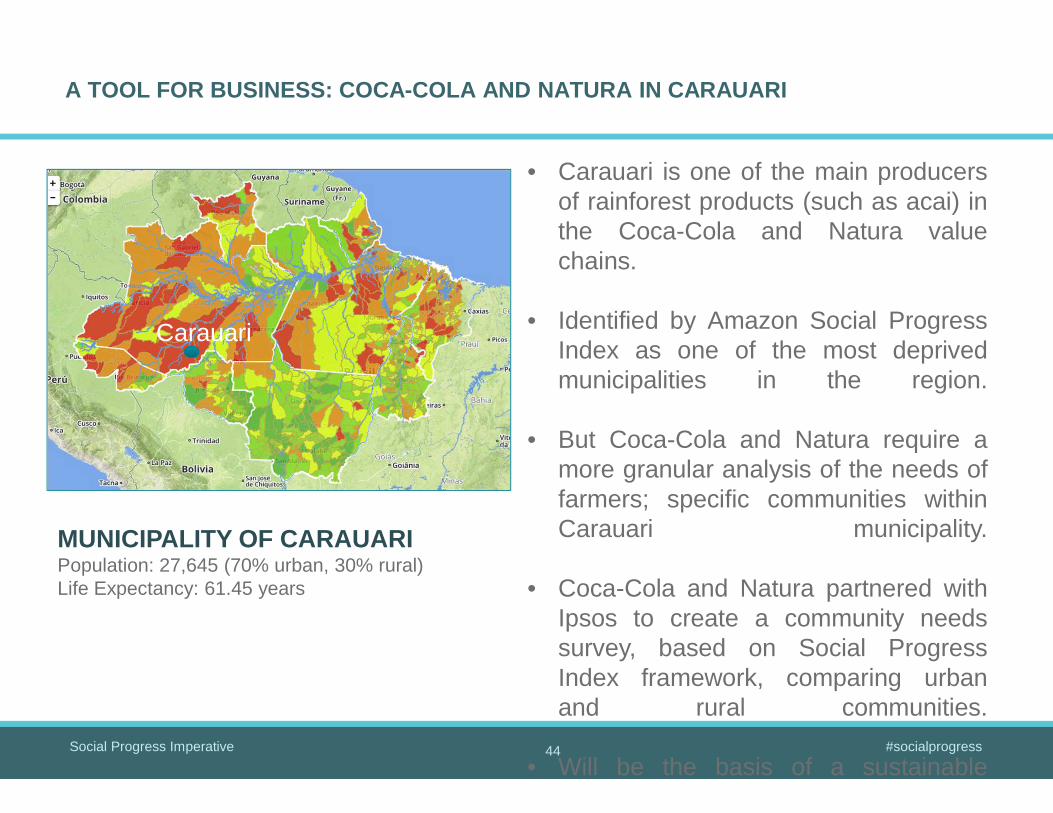
Carauari
MUNICIPALITY OF CARAUARIPopulation: 27,645 (70% urban, 30% rural)Life Expectancy: 61.45 years
• Carauari is one of the main producersof rainforest products (such as acai) inthe Coca-Cola and Natura valuechains.
• Identified by Amazon Social ProgressIndex as one of the most deprivedmunicipalities in the region.
• But Coca-Cola and Natura require amore granular analysis of the needs offarmers; specific communities withinCarauari municipality.
• Coca-Cola and Natura partnered withIpsos to create a community needssurvey, based on Social ProgressIndex framework, comparing urbanand rural communities.
• Will be the basis of a sustainable
A TOOL FOR BUSINESS: COCA-COLA AND NATURA IN CARAUAR I
Social Progress Imperative #socialprogress
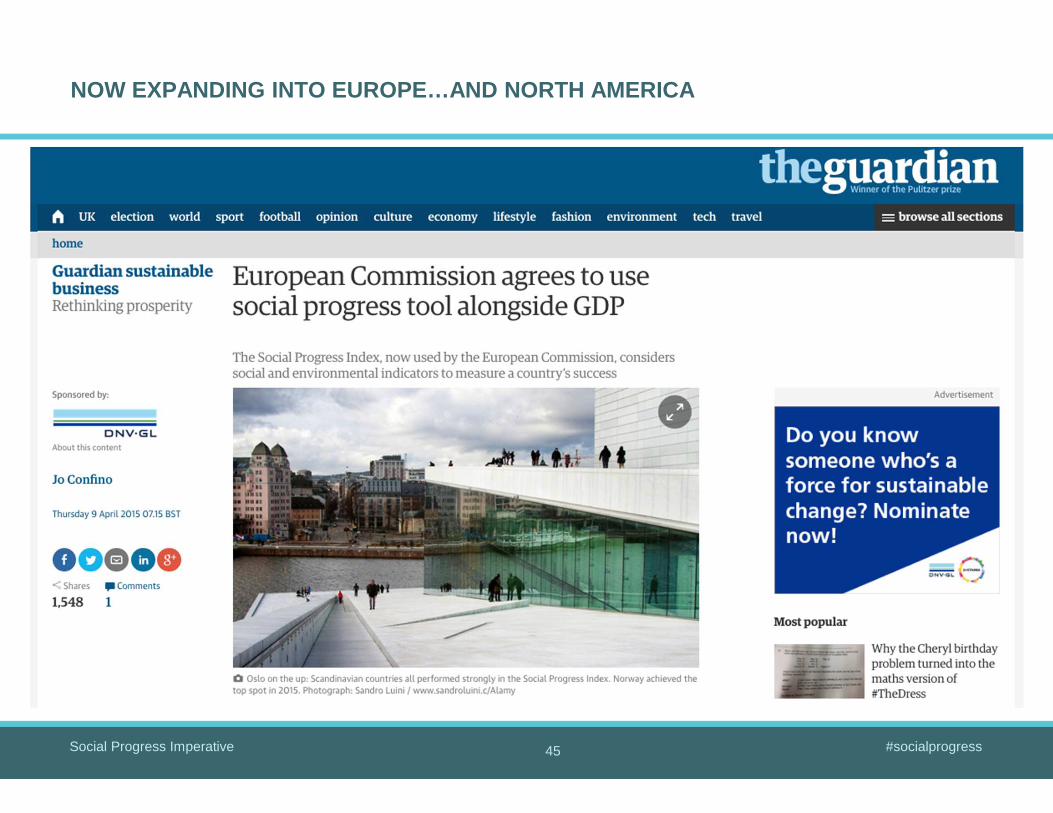
NOW EXPANDING INTO EUROPE…AND NORTH AMERICA
45
Social Progress Imperative #socialprogress
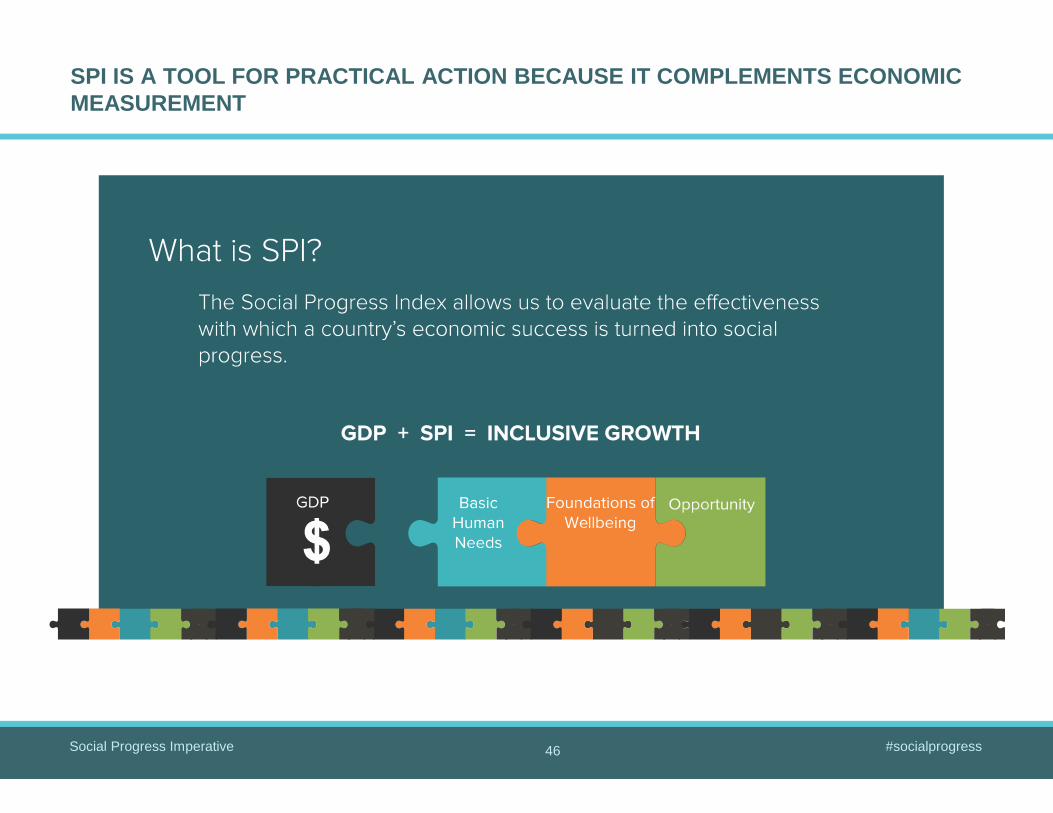
SPI IS A TOOL FOR PRACTICAL ACTION BECAUSE IT COMPLE MENTS ECONOMIC MEASUREMENT
46
Social Progress Imperative #socialprogress
THANK YOU!
@shepleygreen
@socprogress
www.socialprogressimperative.org
47
© 2015 Deloitte Advisory Sp. z o. o. 48
Why do policy-makers and business leaders should drive social progress and economic development?
How can the SPI help them to solve social issues and promotesustainable growth?
Panel discussion
© 2015 Deloitte Advisory Sp. z o. o. 49
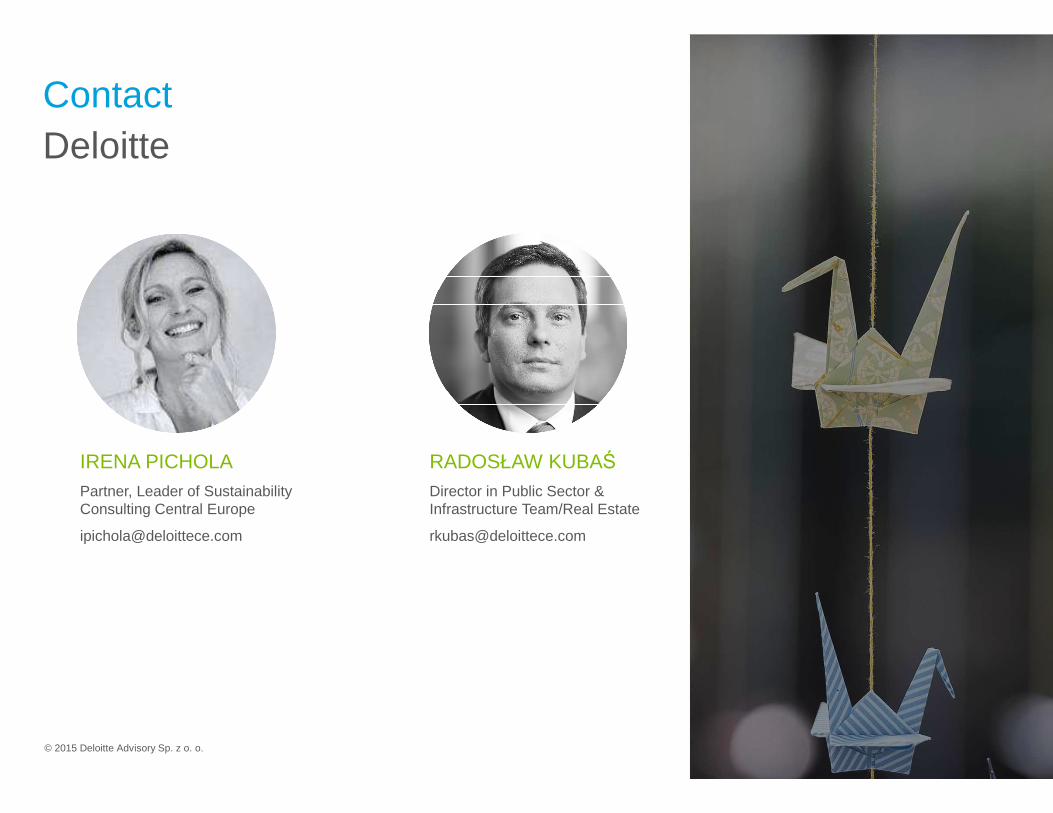
DeloitteContact
IRENA PICHOLAPartner, Leader of SustainabilityConsulting Central Europe
RADOSŁAW KUBAŚDirector in Public Sector & Infrastructure Team/Real Estate


![[57] Istotne punkty tworzenia i spelnienia 1.pdf](https://img.pdfslide.tips/doc/110x75/55cf96fd550346d0338f1d68/57-istotne-punkty-tworzenia-i-spelnienia-1pdf.jpg)