Embed Size (px)
Citation preview

Universities Role in Leadingthe Knowledge Sector:
Evidence from IsraelDr. Tzameret H. Rubin
@ All rights reserved
Samuel Neaman Institute - Technion, Israel Institute of Technology, Haifa 32000, Israel
Prof. Benny Bental●Prof. Dan Peled●
November 2014
Samuel Neaman Institute - Technion, Israel Institute of Technology, Haifa 32000, Israel 1

The bigger picture
Samuel Neaman Institute - Technion, Israel Institute of Technology, Haifa 32000, Israel
We (nations) want to stimulate innovation to create sustainable economic growth, improve citizens wellbeing.
How we do it?Gov. bridges market failures and support long term innovation investments - one of the mechanism doing so is promoting public R&D. This creates knowledge to ‘show the way’ and ‘educate’ the private market by creating outputs such as graduates and knowledge in general (measured in patents, publications etc.)
So??A flourishing R&D in the private sector is it ‘that bad’??
Looks like Israel innovation indicators are leading among OECD countries, so why to question what is going right?
2

A Global Challenge
Samuel Neaman Institute - Technion, Israel Institute of Technology, Haifa 32000, Israel
Israel is not the only country that asks these questions.The National Academy of Science (NAS) conducted a comprehensive review of how the U.S. research universities should face the growing competition, losing its advantage it had enjoyed since World War II. The reduction in gov. support, and technological changes that allows fast growing countries to ‘catch up’ .
3

The Research Scope
Samuel Neaman Institute - Technion, Israel Institute of Technology, Haifa 32000, Israel
The Israeli National Council for Civilian R&D - a consulting gov. body - have assigned the Technion SNI to examine ‘The Israeli research Universities’ role in the national R&D system’.
• Looking at other innovation systems in the world
• Inputs• Outputs• recommendations
4

Samuel Neaman Institute - Technion, Israel Institute of Technology, Haifa 32000, Israel
INPUTS
5

Civilian GERD
Samuel Neaman Institute - Technion, Israel Institute of Technology, Haifa 32000, Israel
6

GERD/GDP
Samuel Neaman Institute - Technion, Israel Institute of Technology, Haifa 32000, Israel
7

Civilian GERD by Performing Sector
Israel
Samuel Neaman Institute - Technion, Israel Institute of Technology, Haifa 32000, Israel
8

GERD by Performing Sector, International comparison, 2011
Samuel Neaman Institute - Technion, Israel Institute of Technology, Haifa 32000, Israel
9
43%
51%
52%
52%
54%
61%
63%
67%
67%
68%
68%
68%
68%
69%
70%
75%
77%
80%
11%
10%
17%
11%
14%
9%
14%
15%
9%
2%
5%
5%
12%
4%
9%
13%
9%
4%
46%
38%
32%
37%
29%
27%
21%
18%
23%
30%
28%
26%
15%
26%
20%
11%
13%
13%
0%
0%
0%
0%
4%
2%
0%
0%
0%
0%
4%
0%
1%
2%
2%
3%
0% 10% 20% 30% 40% 50% 60% 70% 80% 90% 100%
Turkey (9,713)
Canada (24,258)
Norway (4,970)
Netherlands (14,581)
Italy (24,812)
United Kingdom (39,627)
France (51,891)
Germany (91,737)
Belgium (8,719)
Denmark (7,052)
Ireland (3,277)
Austria (9,762)
United States (415,193)
Sweden (13,216)
Finland (7,635)
Korea (53,243)
Japan (140,959)
Israel (9,487)
Business enterprise Government Higher education Private non-profit

Samuel Neaman Institute - Technion, Israel Institute of Technology, Haifa 32000, Israel
Share of GERD Performed by Business Sector
IL vs. other countries
10

Samuel Neaman Institute - Technion, Israel Institute of Technology, Haifa 32000, Israel
11
GERD by Funding Sector, 2009
62%
71%
75%
41%
66%
44%
38%
43%
27%
54%
68%
68%
52%
48%
44%
60%
44%
45%
59%
45%
46%
59%
51%
45%
47%
36%
31%
27%
18%
34%
30%
45%
46%
47%
60%
38%
23%
24%
39%
34%
47%
28%
42%
44%
27%
41%
42%
25%
31%
33%
35%
14%
4%
4%
5%
5%
5%
6%
6%
7%
7%
7%
8%
9%
9%
10%
10%
11%
11%
12%
16%
17%
17%
46%
0% 10% 20% 30% 40% 50% 60% 70% 80% 90% 100%
United States
Korea
Japan
Turkey
Germany
Portugal
New Zealand
Spain
Poland
Singapore
Switzerland
Finland
France
Canada
Norway
Denmark
Italy
Czech Republic
Sweden
Netherlands
Hungary
Belgium
Ireland
United Kingdom
Austria
Israel
Business enterprise Government Higher education Private non-profit Abroad

Samuel Neaman Institute - Technion, Israel Institute of Technology, Haifa 32000, Israel
Universities’ OUTPUTS
12

High Education Systemperformances
Samuel Neaman Institute - Technion, Israel Institute of Technology, Haifa 32000, Israel
• All 7 research Uni. In Israel are in top 500 (ARWU 2013)
• The quality of academic research –ranking among the 40 OECD countries, (top 25% article cited, normalized by the country's GDP), Israel is ranked fourth among the 40 developed countries
• The number of triadic patents per Billion $ GDP: Israel 1.68, OECD average 0.42
13

Methodology I
Samuel Neaman Institute - Technion, Israel Institute of Technology, Haifa 32000, Israel
We wanted to understand if the outputs in the Israeli industries is different than the universities outputs, measured in PCT Patents Applications.
The problem – matching Industry Classification codes ISIC with PCT fields codes.
Solution – using a Lybbert and Zolas concordance - they map the probability of each PCT code to match a specific industry.
We took the universities patents convert them to industry codes, and did the same for private companies patents.
14

Methodology II
Samuel Neaman Institute - Technion, Israel Institute of Technology, Haifa 32000, Israel
Data: we use PATSTAT data looking at European Patent Office (EPO) in the years 1990-2010.
First , we present universities patent data relative to the total patents granted in each of these countries in order to understand the significance of universities activity within its country.
Second, we examine the areas of universities patents in relation to the segments of the business sector in Israel and each of its benchmarked countries
15

16
EPO Patents Applications
0.0%
0.5%
1.0%
1.5%
2.0%
2.5%
0
1000
2000
3000
4000
5000
6000
199
0
199
1
199
2
199
3
199
4
199
5
199
6
199
7
199
8
199
9
200
0
200
1
200
2
200
3
200
4
200
5
200
6
200
7
200
8
200
9
N
u
m
b
e
r
EPO Patent Applications - CH
Switzerland University patent applications
Switzerland Total applications
Switzerland University sector share
0.0%
0.5%
1.0%
1.5%
2.0%
2.5%
3.0%
0
1000
2000
3000
4000
5000
600019
90
199
1
199
2
199
3
199
4
199
5
199
6
199
7
199
8
199
9
200
0
200
1
200
2
200
3
200
4
200
5
200
6
200
7
200
8
200
9
P
e
r
c
e
n
t
N
u
m
b
e
r
EPO Patent Applications - NL
University patent applications Total applications University sector share
0.0%
5.0%
10.0%
15.0%
20.0%
25.0%
0
200
400
600
800
1000
1200
199
0
199
1
199
2
199
3
199
4
199
5
199
6
199
7
199
8
199
9
200
0
200
1
200
2
200
3
200
4
200
5
200
6
200
7
200
8
200
9
P
e
r
c
e
n
t
EPO Patent Applications - IL
University patent applications Total applications
University sector share
We attributed the Israeli significant role of universities in patenting due to the declining government funding of research that 'pushed' the universities to look for other research funding, where patents are used to secure any commercial process.

Samuel Neaman Institute - Technion, Israel Institute of Technology, Haifa 32000, Israel
17
0%
10%
20%
30%
40%
50%
60%
70%
80%
90%
1990-1994 1995-1999 2000-2004 2005-2010
R^2
Val
ue
Switzerland Netherlands Belgium Israel
Correlation Along the YearsBetween a Few Comparable Countries,
by using the Concordance
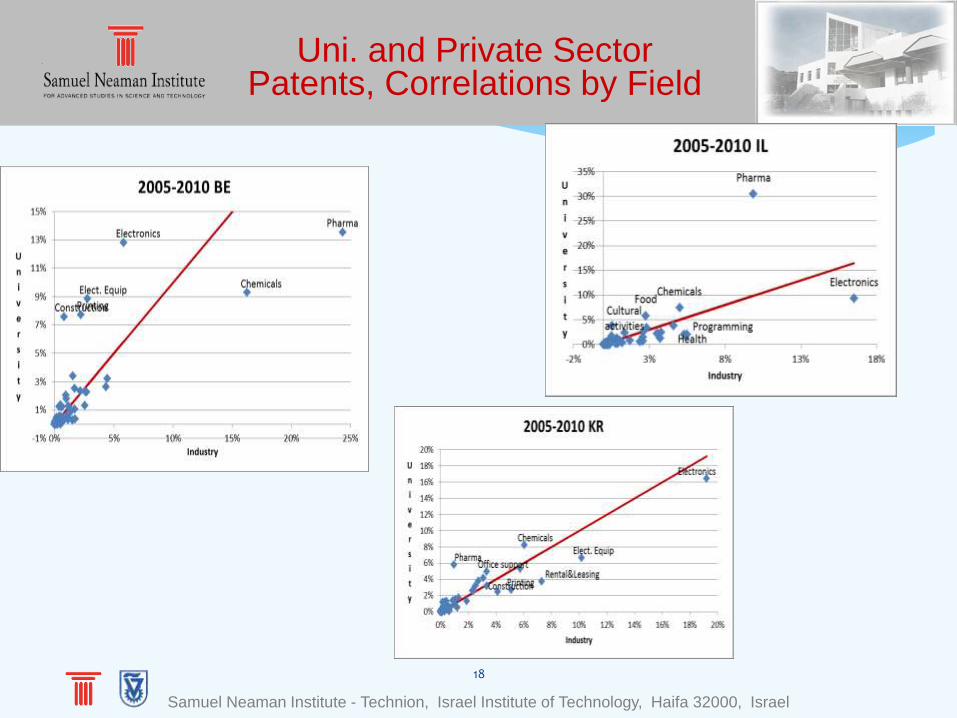
Uni. and Private Sector Patents, Correlations by Field
Samuel Neaman Institute - Technion, Israel Institute of Technology, Haifa 32000, Israel
18

Patents Applications Counts
19
With a dominant private sector in R&D expenditure, if businesses are not aligned with universities fields of research, such gap of knowledge and resources might cause a future problem in the national R&D system in terms of
Graduates The ability to leverage universities knowledge.

The End
Samuel Neaman Institute - Technion, Israel Institute of Technology, Haifa 32000, Israel
20


![Avn15 sheffield[8pp]](https://img.pdfslide.tips/doc/110x75/5790558d1a28ab900c9560f3/avn15-sheffield8pp.jpg)