Embed Size (px)
Citation preview

BUDAPEST STOCK EXCHANGEAnalysis of stock index of an emerging economy
Santosh J K

Introduction
• Stock Index: BUX, Budapest Stock Exchange, Hungary
• Applications utilised: Microsoft Excel 2011, Eviews 7.0
• Significant models: ARIMA(3,1,3), GARCH(2,3) & GARCH(3,2)
• In-sample data: April 01’ 1997 to March 31’ 2009
• Out-sample data: April 01’ 2009 to November 12’ 2013

Time series plot of BUX
0"
5,000"
10,000"
15,000"
20,000"
25,000"
30,000"
35,000"
01/04/1997"
01/04/1998"
01/04/1999"
01/04/2000"
01/04/2001"
01/04/2002"
01/04/2003"
01/04/2004"
01/04/2005"
01/04/2006"
01/04/2007"
01/04/2008"
01/04/2009"
01/04/2010"
01/04/2011"
01/04/2012"
01/04/2013"
BUX$

Data description
0
100
200
300
400
500
600
700
4000 8000 12000 16000 20000 24000 28000
Series: BUXSample 4/01/1997 11/12/2013Observations 4034
Mean 14658.74Median 14695.23Maximum 30118.12Minimum 3775.020Std. Dev. 6833.213Skewness 0.184081Kurtosis 1.560072
Jarque-Bera 371.2852Probability 0.000000
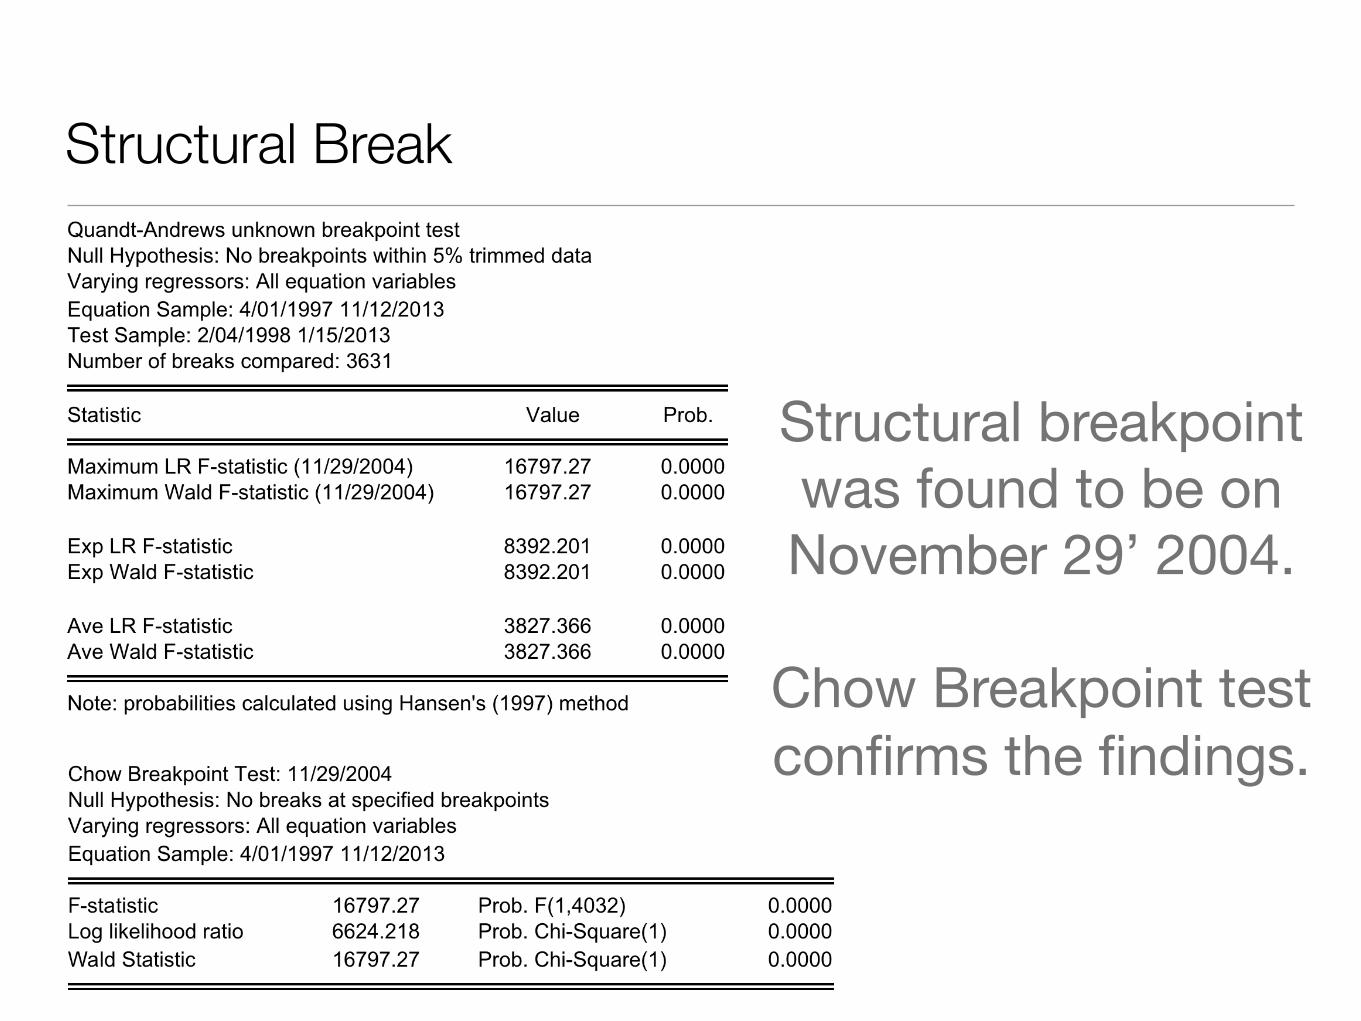
Structural Break
Structural breakpoint was found to be on November 29’ 2004.
Chow Breakpoint test confirms the findings.

Stationarity
Data was found to be stationary for the log returns of the index, as per the ADF - first
difference test.

Time series plot of the log returns of BUX
-.20
-.15
-.10
-.05
.00
.05
.10
.15
97 98 99 00 01 02 03 04 05 06 07 08 09 10 11 12 13
LN(BUX)

ARIMA model
A series of iterations revealed,
ARIMA(3,1,3) to be the best fit
model.

GARCH model
Two models turned out to be highly
significant - GARCH(2,3) & GARCH(3,2).
Of the two, GARCH(2,3)
is relatively better.

GARCH model
The other highly significant GARCH
model.

Log returns of BUX and S&P 500
-.20
-.15
-.10
-.05
.00
.05
.10
.15
97 98 99 00 01 02 03 04 05 06 07 08 09 10 11 12 13
LN(BUX) LN(S&P)

Structural model - Lag order selection
Lag 6 is significant
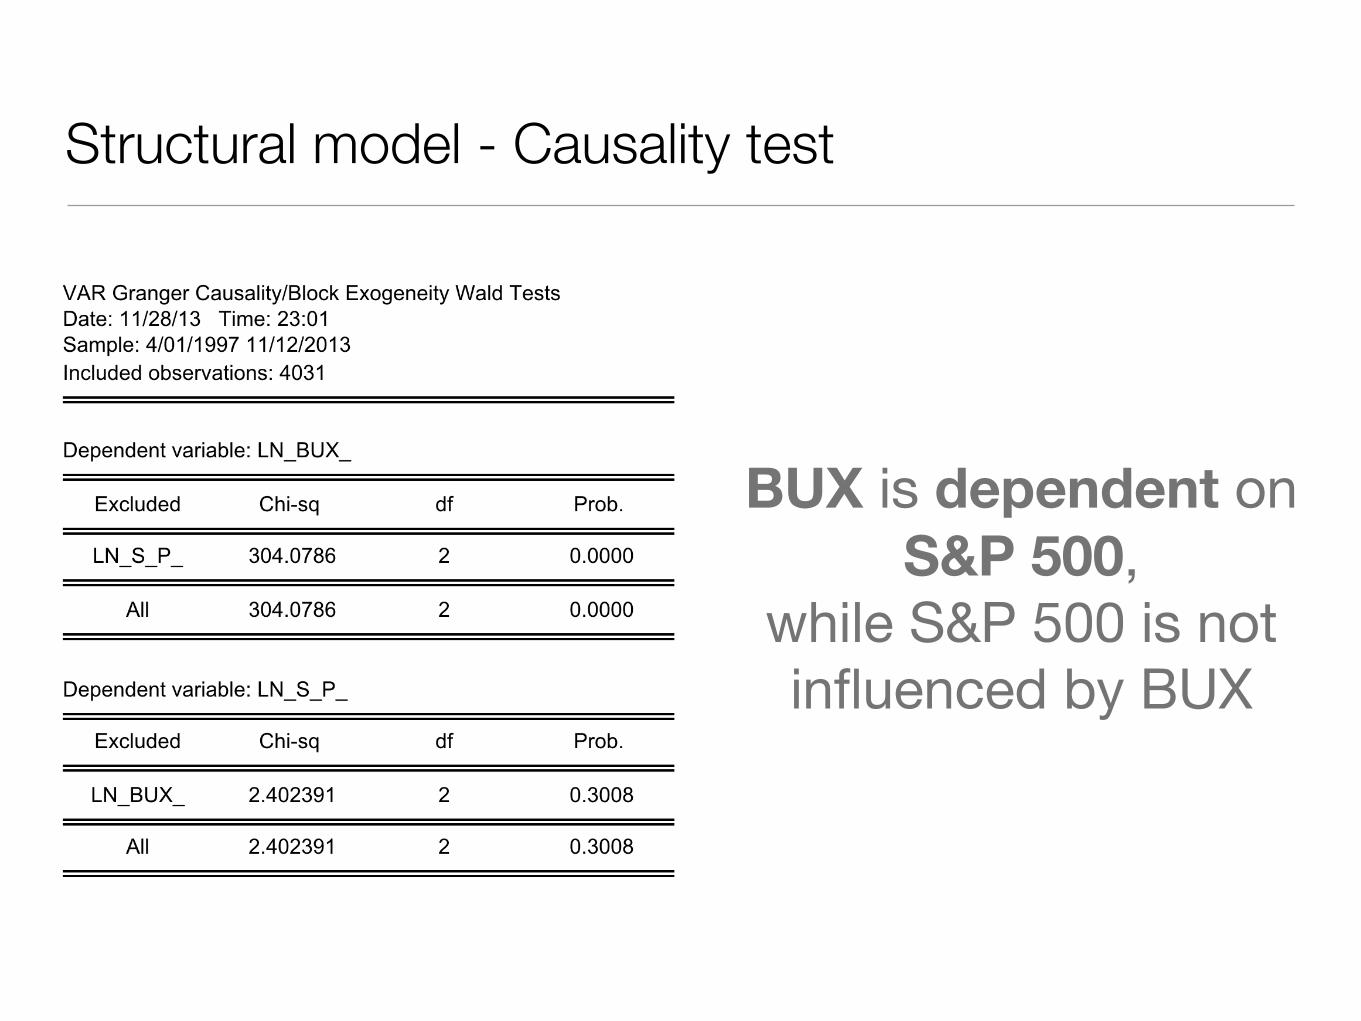
Structural model - Causality test
BUX is dependent on S&P 500,
while S&P 500 is not influenced by BUX

Forecast
-.20
-.15
-.10
-.05
.00
.05
.10
.15
97 98 99 00 01 02 03 04 05 06 07 08 09 10 11 12 13
LN(BUX) LN(BUX) (Baseline)

THANK YOU
Santosh J K