Embed Size (px)
Citation preview
Focus on the Markets The Glass Recycling Perspec8ve
R3 Conference March 29, 2016 Boston, MA
Lynn Bragg President, Glass Packaging Institute www.GPI.org www.UpgradeToGlass.com
Glass … 100% and endlessly recyclable
• A brief look at the North American glass container industry.
• The big picture look into glass recycling: – Why it counts – Challenges – Glass Industry Ini8a8ves to improve supply chain value, market accessibility and transparency, strategic partnerships and best prac8ces.
2
Overview
Glass Containers: Industry Overview
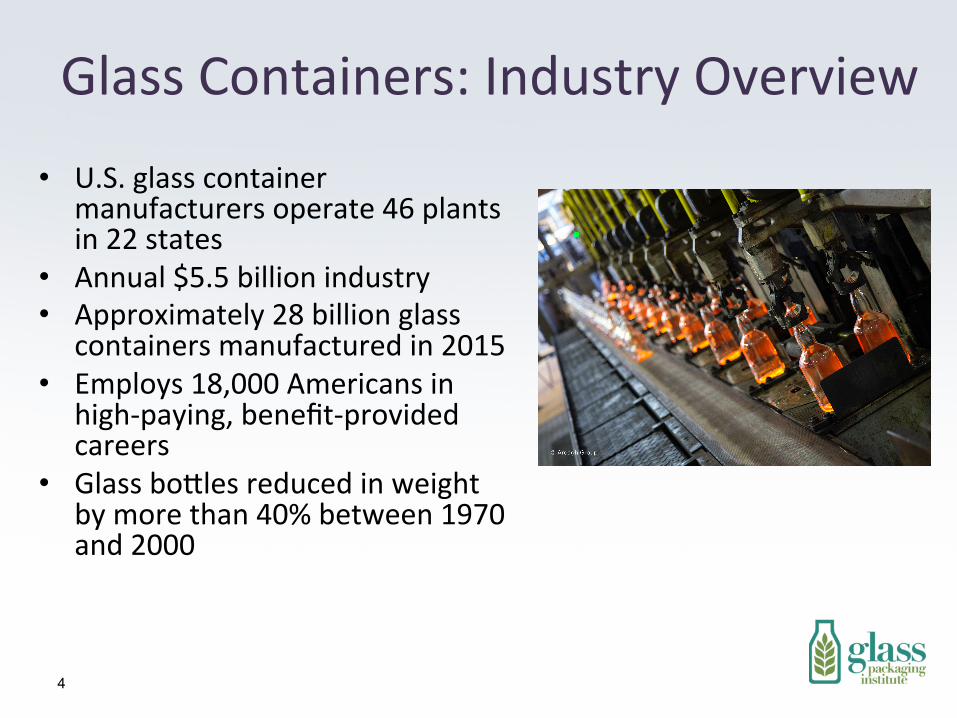
Glass Containers: Industry Overview
• U.S. glass container manufacturers operate 46 plants in 22 states
• Annual $5.5 billion industry • Approximately 28 billion glass
containers manufactured in 2015 • Employs 18,000 Americans in
high-‐paying, benefit-‐provided careers
• Glass boYles reduced in weight by more than 40% between 1970 and 2000
4
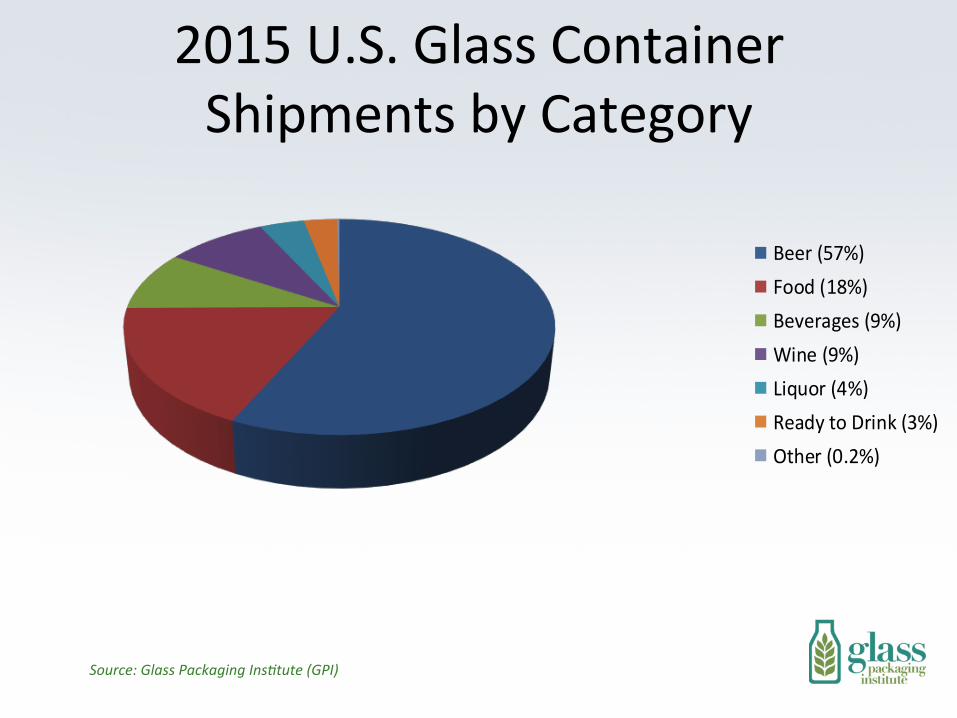
Beer (57%)Food (18%)Beverages (9%)Wine (9%)Liquor (4%)Ready to Drink (3%)Other (0.2%)
2015 U.S. Glass Container Shipments by Category
Source: Glass Packaging Ins3tute (GPI)
Glass Container Recycling
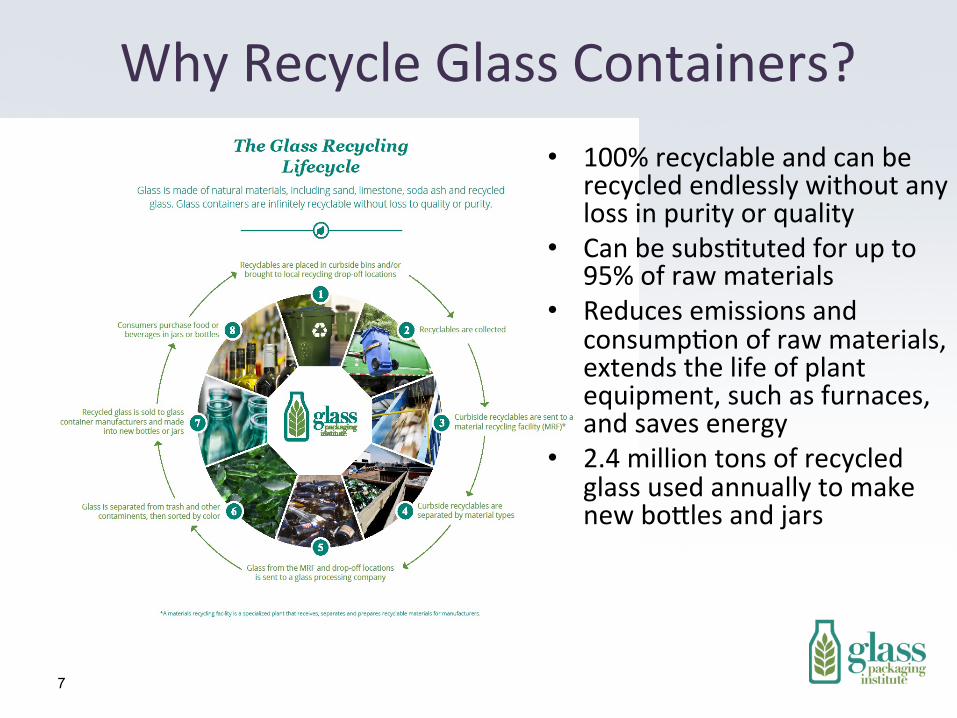
Why Recycle Glass Containers? • 100% recyclable and can be
recycled endlessly without any loss in purity or quality
• Can be subs8tuted for up to 95% of raw materials
• Reduces emissions and consump8on of raw materials, extends the life of plant equipment, such as furnaces, and saves energy
• 2.4 million tons of recycled glass used annually to make new boYles and jars
7
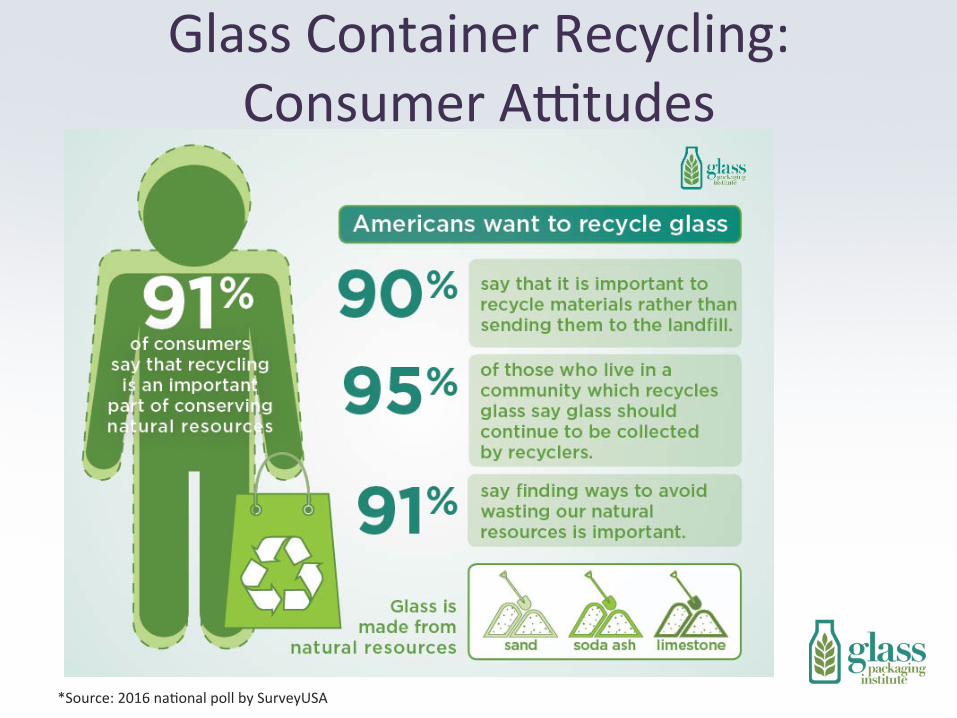
Glass Container Recycling: Consumer A_tudes
*Source: 2016 na8onal poll by SurveyUSA
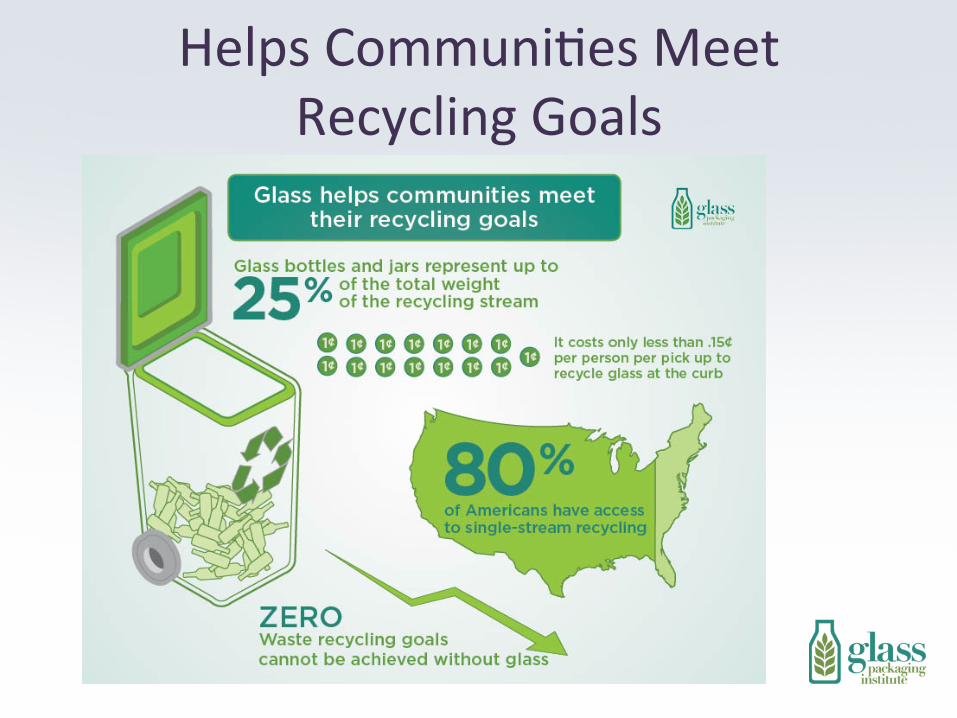
Helps Communi8es Meet Recycling Goals
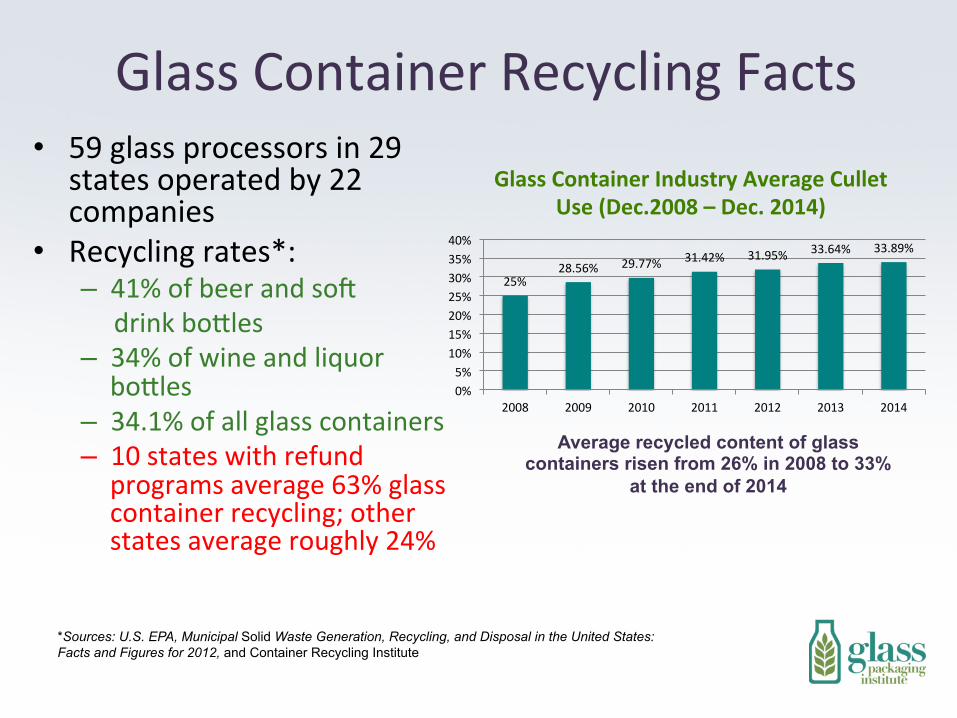
Glass Container Recycling Facts • 59 glass processors in 29
states operated by 22 companies
• Recycling rates*: – 41% of beer and sob drink boYles – 34% of wine and liquor boYles
– 34.1% of all glass containers – 10 states with refund programs average 63% glass container recycling; other states average roughly 24%
*Sources: U.S. EPA, Municipal Solid Waste Generation, Recycling, and Disposal in the United States: Facts and Figures for 2012, and Container Recycling Institute
Average recycled content of glass containers risen from 26% in 2008 to 33%
at the end of 2014
25% 28.56% 29.77% 31.42% 31.95% 33.64% 33.89%
0% 5% 10% 15% 20% 25% 30% 35% 40%
2008 2009 2010 2011 2012 2013 2014
Glass Container Industry Average Cullet Use (Dec.2008 – Dec. 2014)
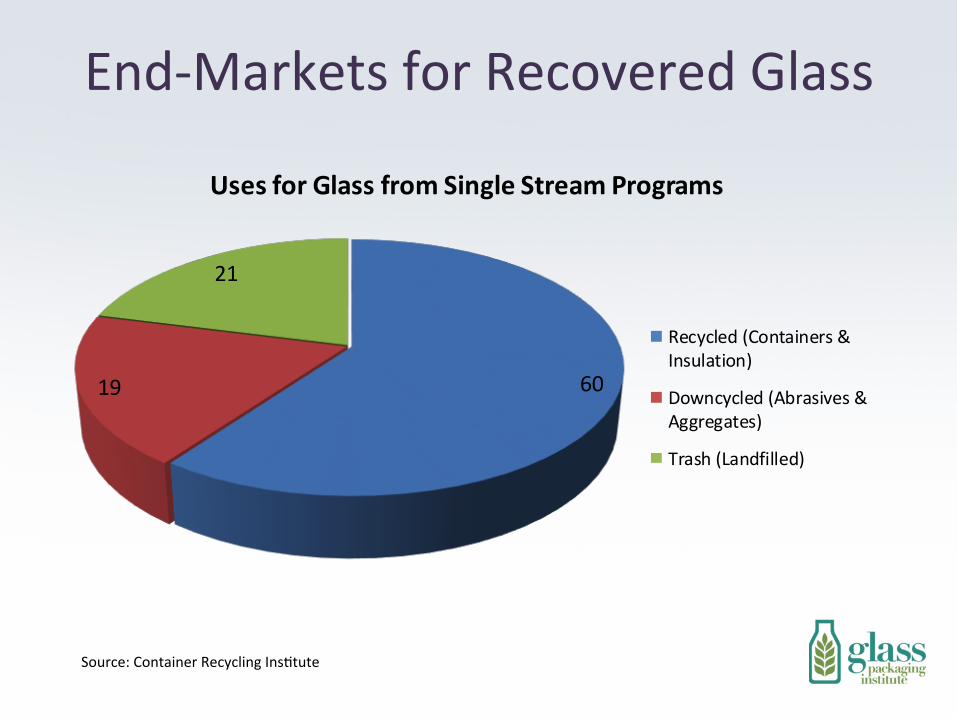
End-‐Markets for Recovered Glass
Source: Container Recycling Ins8tute
6019
21
Uses for Glass from Single Stream Programs
Recycled (Containers &Insulation)
Downcycled (Abrasives &Aggregates)
Trash (Landfilled)
Glass Container Recycling: Challenges

THE PACKAGING STREAM IS EVOLVING
* Lighter, less mass
More units per ton
More Types of Material
Greater percentage of material with less commodity value (glass, increase
some plas8cs like film and PS)
Glass is now a quarter of Single Stream volume in non-deposit states
OLD TON
NEW TON
Single Stream Recycling: Packaging Stream
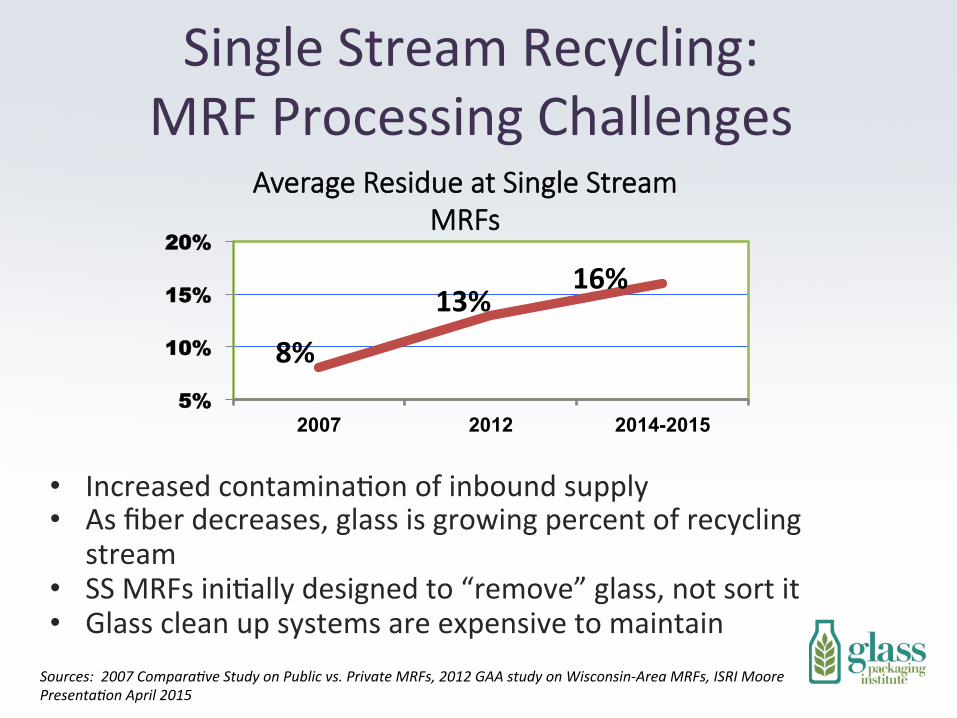
Single Stream Recycling: MRF Processing Challenges
• Increased contamina8on of inbound supply • As fiber decreases, glass is growing percent of recycling
stream • SS MRFs ini8ally designed to “remove” glass, not sort it • Glass clean up systems are expensive to maintain
8%
13% 16%
5%
10%
15%
20%
2007 2012 2014-2015
Average Residue at Single Stream MRFs
Sources: 2007 Compara3ve Study on Public vs. Private MRFs, 2012 GAA study on Wisconsin-‐Area MRFs, ISRI Moore Presenta3on April 2015
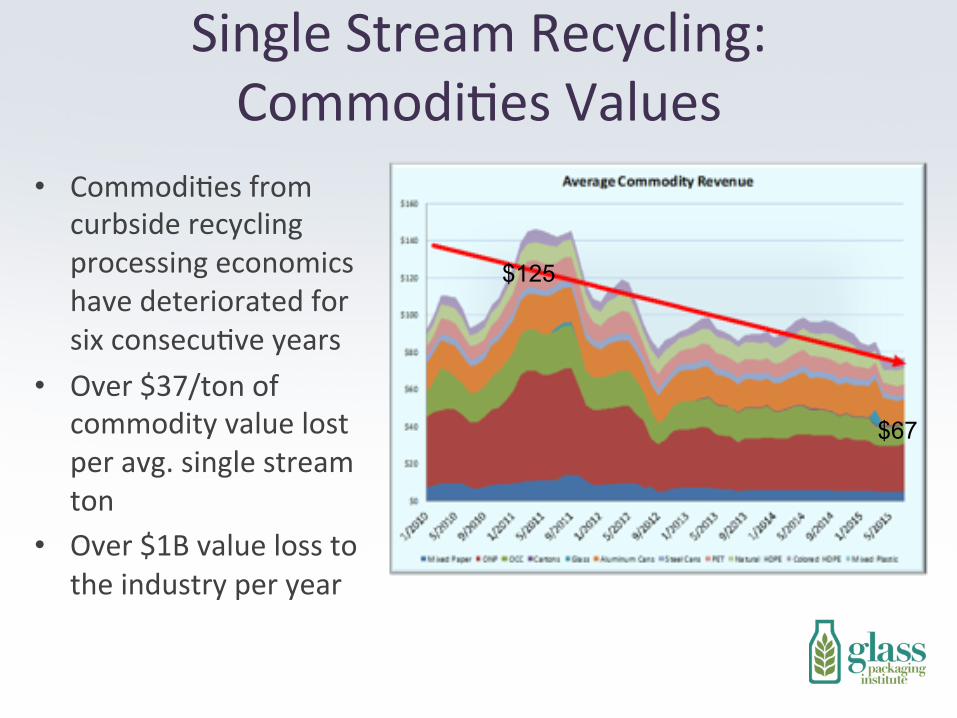
• Commodi8es from curbside recycling processing economics have deteriorated for six consecu8ve years
• Over $37/ton of commodity value lost per avg. single stream ton
• Over $1B value loss to the industry per year
Single Stream Recycling: Commodi8es Values
$125
$67
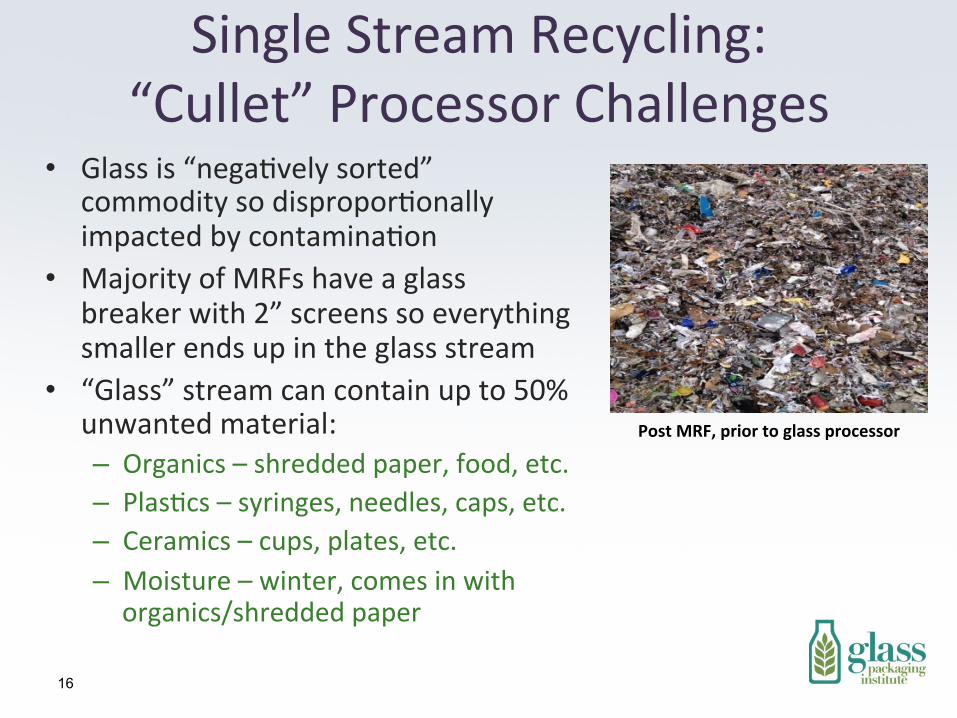
Single Stream Recycling: “Cullet” Processor Challenges
• Glass is “nega8vely sorted” commodity so dispropor8onally impacted by contamina8on
• Majority of MRFs have a glass breaker with 2” screens so everything smaller ends up in the glass stream
• “Glass” stream can contain up to 50% unwanted material: – Organics – shredded paper, food, etc. – Plas8cs – syringes, needles, caps, etc. – Ceramics – cups, plates, etc. – Moisture – winter, comes in with organics/shredded paper
16
Post MRF, prior to glass processor
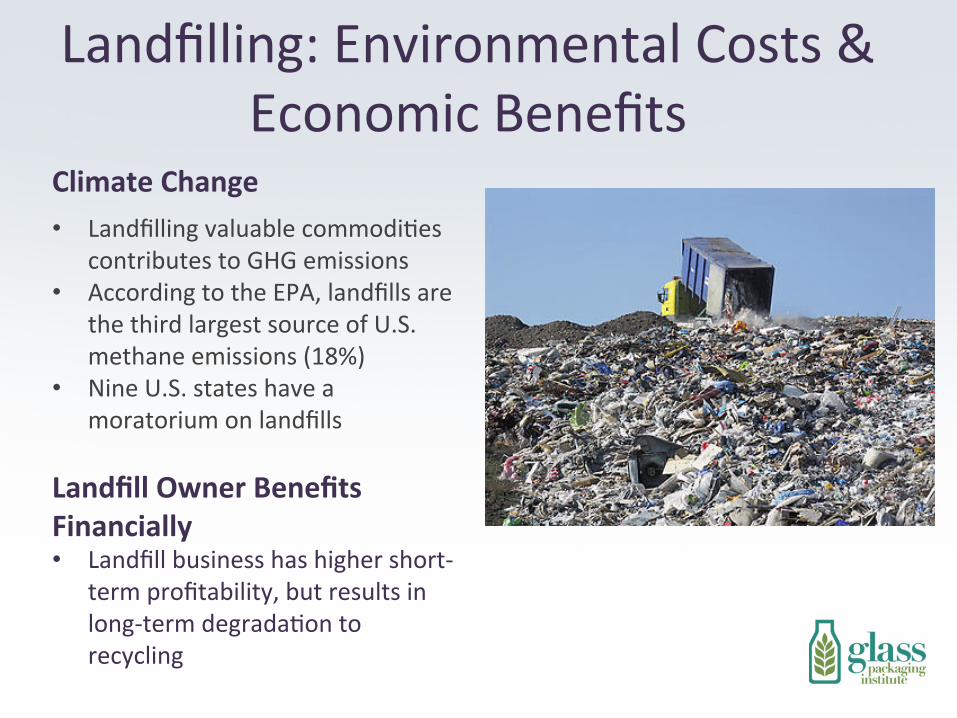
Landfilling: Environmental Costs & Economic Benefits
Climate Change
• Landfilling valuable commodi8es contributes to GHG emissions
• According to the EPA, landfills are the third largest source of U.S. methane emissions (18%)
• Nine U.S. states have a moratorium on landfills
Landfill Owner Benefits Financially • Landfill business has higher short-‐
term profitability, but results in long-‐term degrada8on to recycling
Glass Container Recycling: GPI IniSaSves
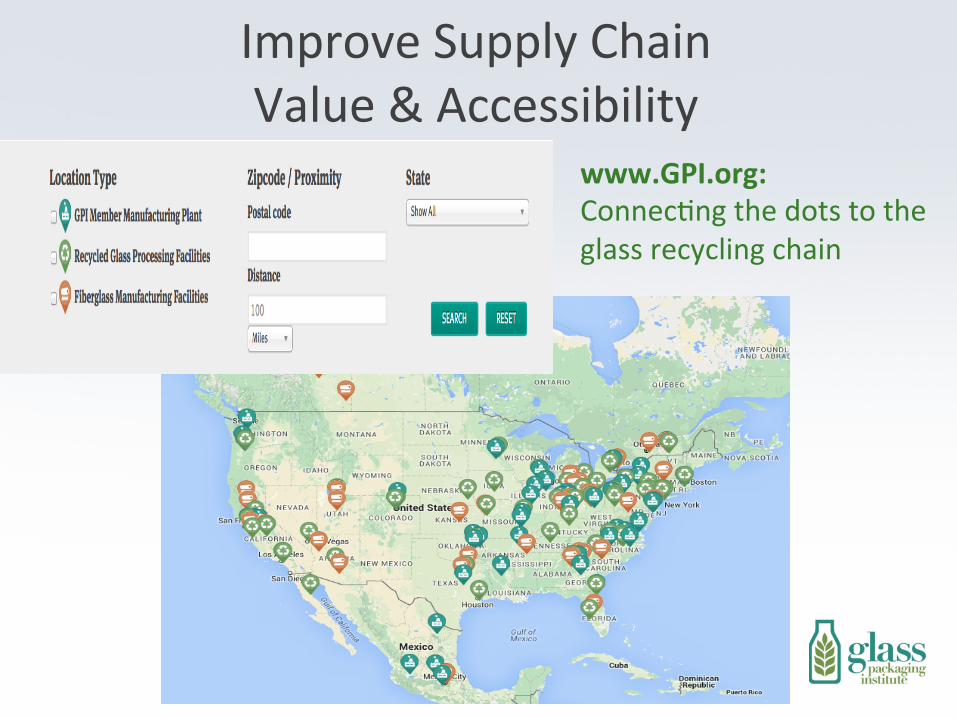
Improve Supply Chain Value & Accessibility
www.GPI.org: Connec8ng the dots to the glass recycling chain
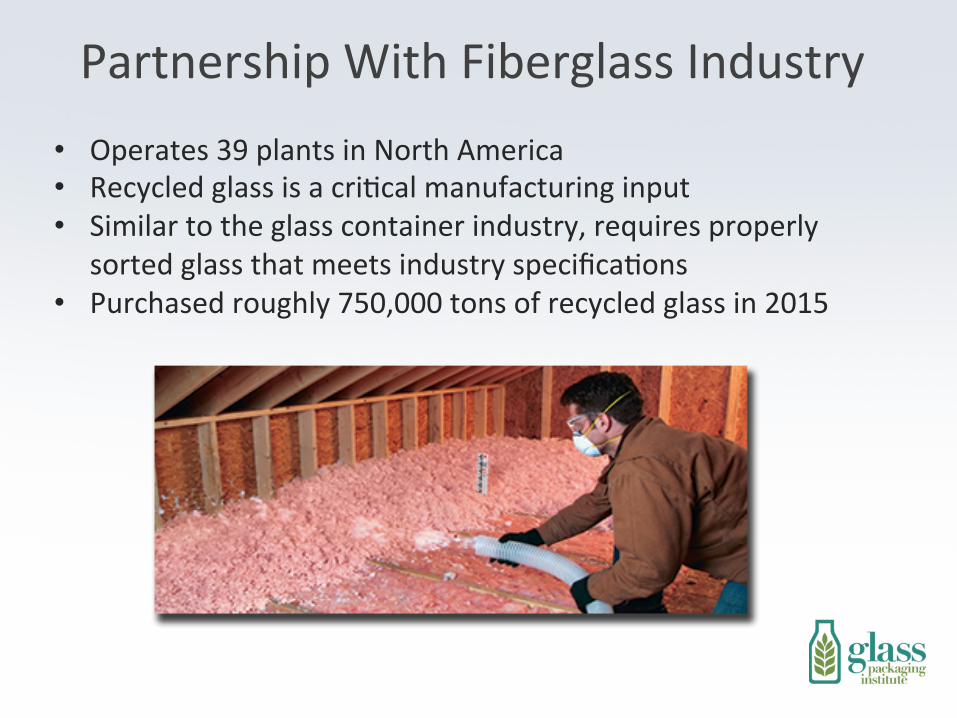
Partnership With Fiberglass Industry • Operates 39 plants in North America • Recycled glass is a cri8cal manufacturing input • Similar to the glass container industry, requires properly
sorted glass that meets industry specifica8ons • Purchased roughly 750,000 tons of recycled glass in 2015
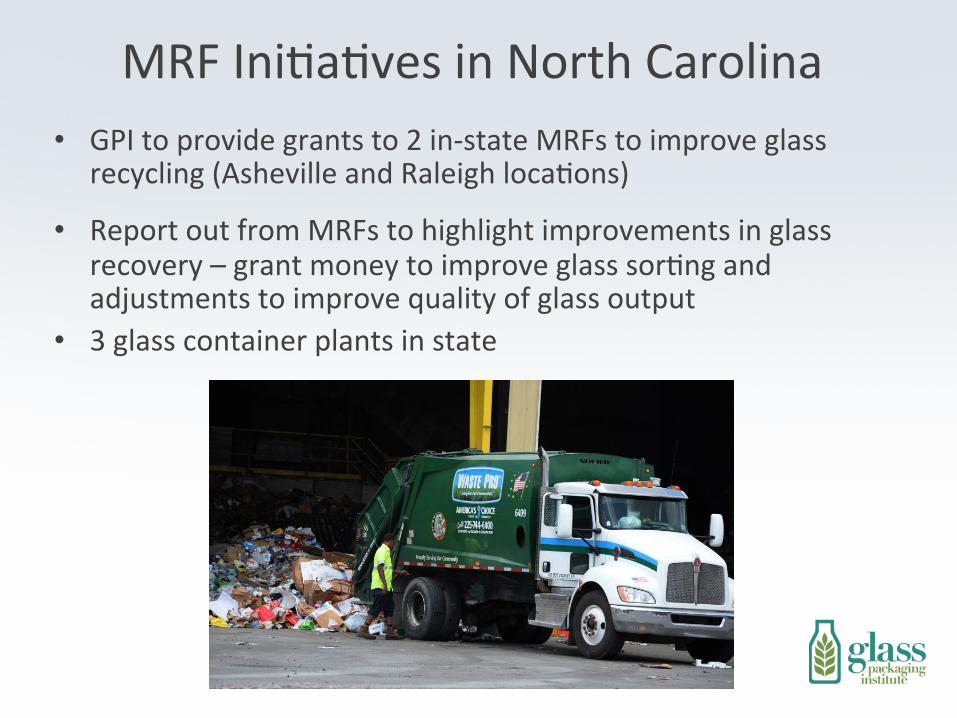
MRF Ini8a8ves in North Carolina • GPI to provide grants to 2 in-‐state MRFs to improve glass
recycling (Asheville and Raleigh loca8ons)
• Report out from MRFs to highlight improvements in glass recovery – grant money to improve glass sor8ng and adjustments to improve quality of glass output
• 3 glass container plants in state
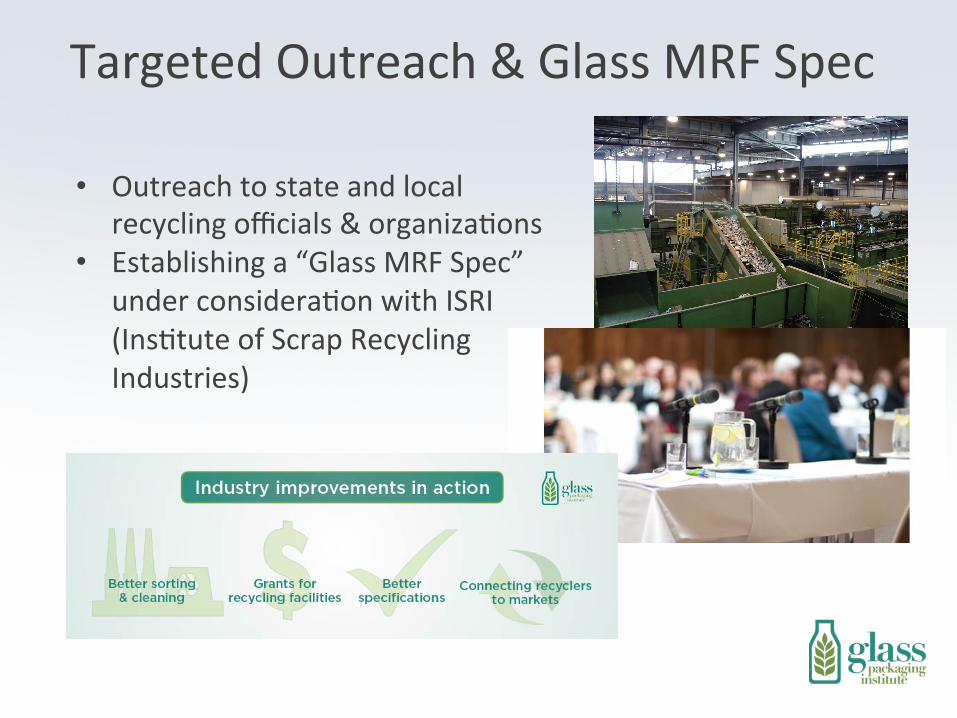
Targeted Outreach & Glass MRF Spec
• Outreach to state and local recycling officials & organiza8ons
• Establishing a “Glass MRF Spec” under considera8on with ISRI (Ins8tute of Scrap Recycling Industries)
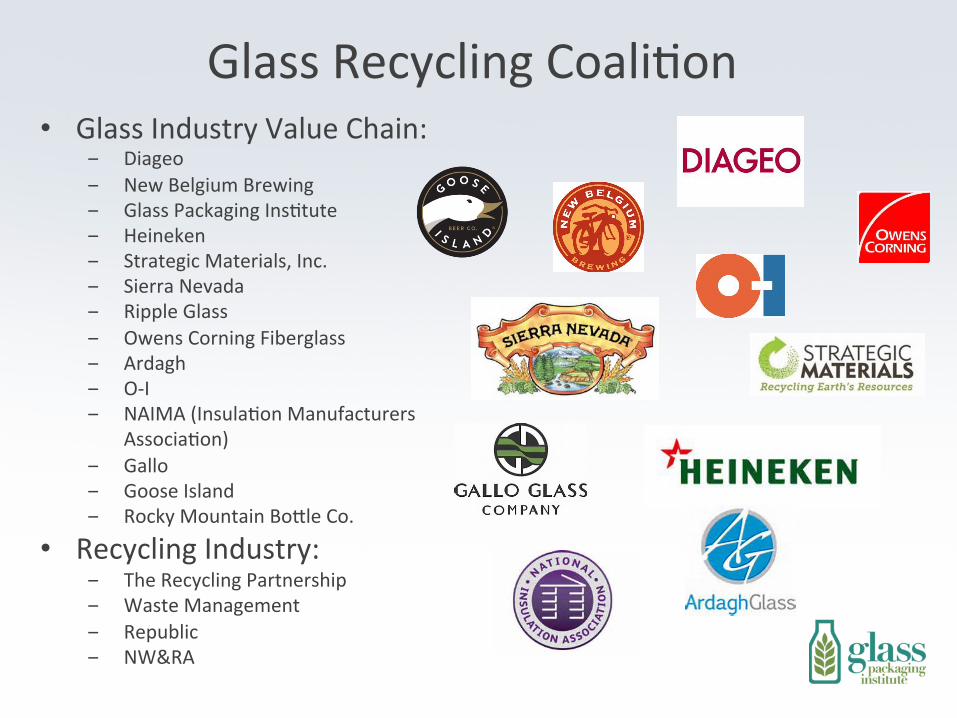
Glass Recycling Coali8on • Glass Industry Value Chain:
‒ Diageo ‒ New Belgium Brewing ‒ Glass Packaging Ins8tute ‒ Heineken ‒ Strategic Materials, Inc. ‒ Sierra Nevada ‒ Ripple Glass ‒ Owens Corning Fiberglass ‒ Ardagh ‒ O-‐I ‒ NAIMA (Insula8on Manufacturers
Associa8on) ‒ Gallo ‒ Goose Island ‒ Rocky Mountain BoYle Co.
• Recycling Industry: ‒ The Recycling Partnership ‒ Waste Management ‒ Republic ‒ NW&RA
THANK YOU! Learn more about GPI and glass
container recycling at www.GPI.org
www.UpgradeToGlass.com or contact [email protected]
Glass … 100% and endlessly recyclable