Embed Size (px)
Citation preview

The production of this presentation has been made possible through a financial contribution from Health Canada, through the
Canadian Partnership Against Cancer
cIQc
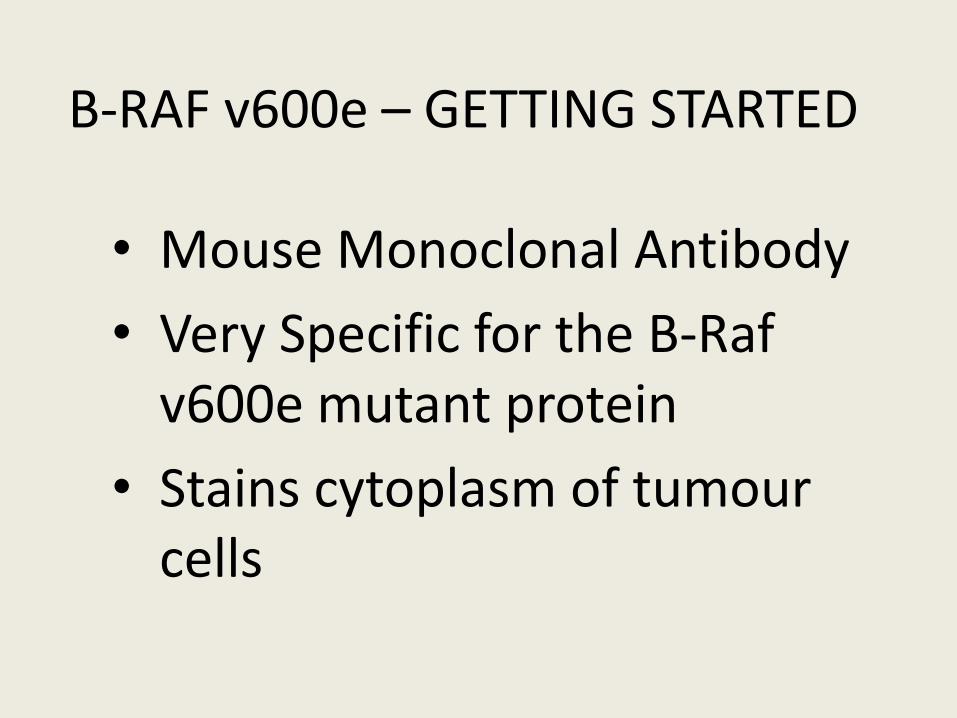
B-RAF v600e – GETTING STARTED
• Mouse Monoclonal Antibody
• Very Specific for the B-Raf v600e mutant protein
• Stains cytoplasm of tumour cells
BRAF V600E
• Mutation is present in numerous cancers
• Colorectal Cancer
• Melanoma
• Papillary Thyroid Caracinoma.
• Brain Cancers
• Lung Cancer
• Hairy Cell Leukemia
STEP 1
• Stain cases with a known B-Raf v600e mutation
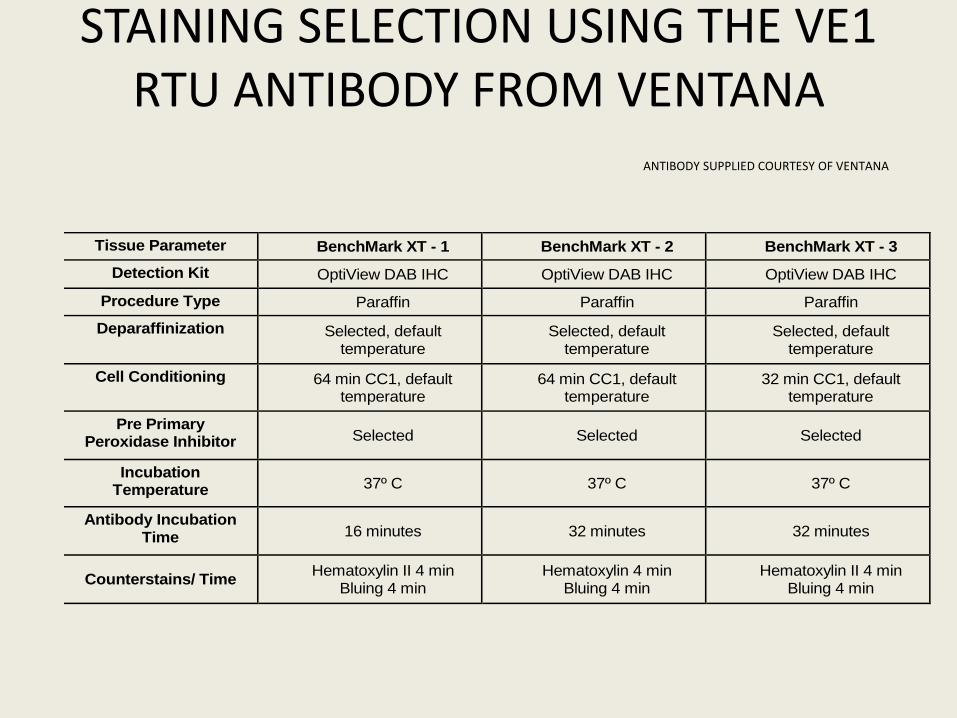
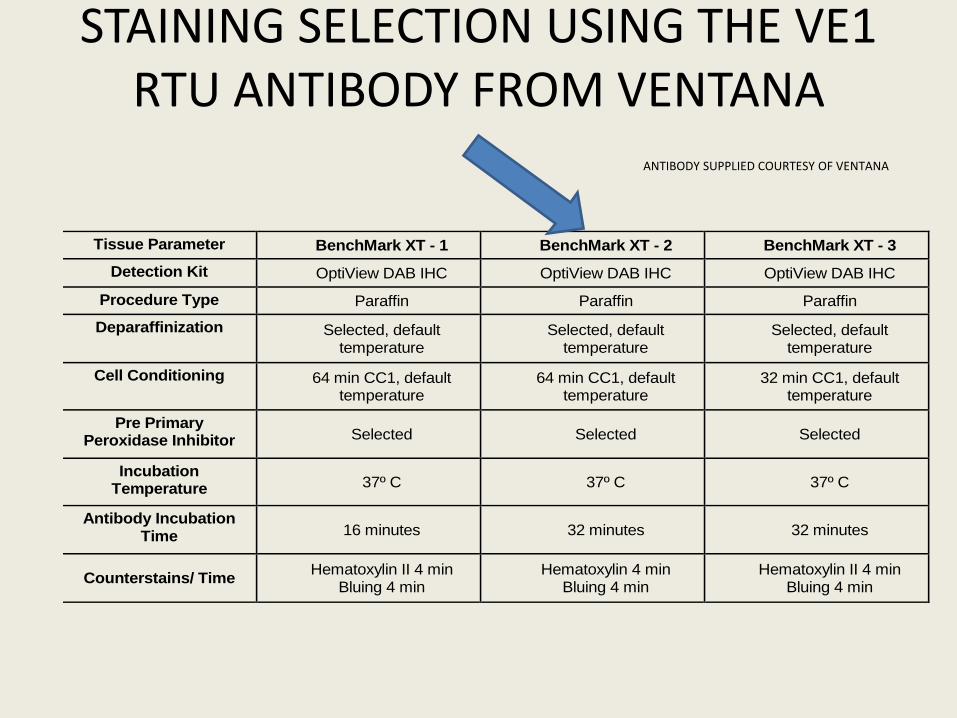
STAINING SELECTION USING THE VE1 RTU ANTIBODY FROM VENTANA
ANTIBODY SUPPLIED COURTESY OF VENTANA
Tissue Parameter BenchMark XT - 1 BenchMark XT - 2 BenchMark XT - 3
Detection Kit OptiView DAB IHC OptiView DAB IHC OptiView DAB IHC
Procedure Type Paraffin Paraffin Paraffin
Deparaffinization Selected, default temperature
Selected, default temperature
Selected, default temperature
Cell Conditioning 64 min CC1, default temperature
64 min CC1, default temperature
32 min CC1, default temperature
Pre Primary Peroxidase Inhibitor Selected Selected Selected
Incubation Temperature 37º C 37º C 37º C
Antibody Incubation Time 16 minutes 32 minutes 32 minutes
Counterstains/ Time Hematoxylin II 4 min
Bluing 4 min Hematoxylin 4 min
Bluing 4 min Hematoxylin II 4 min
Bluing 4 min
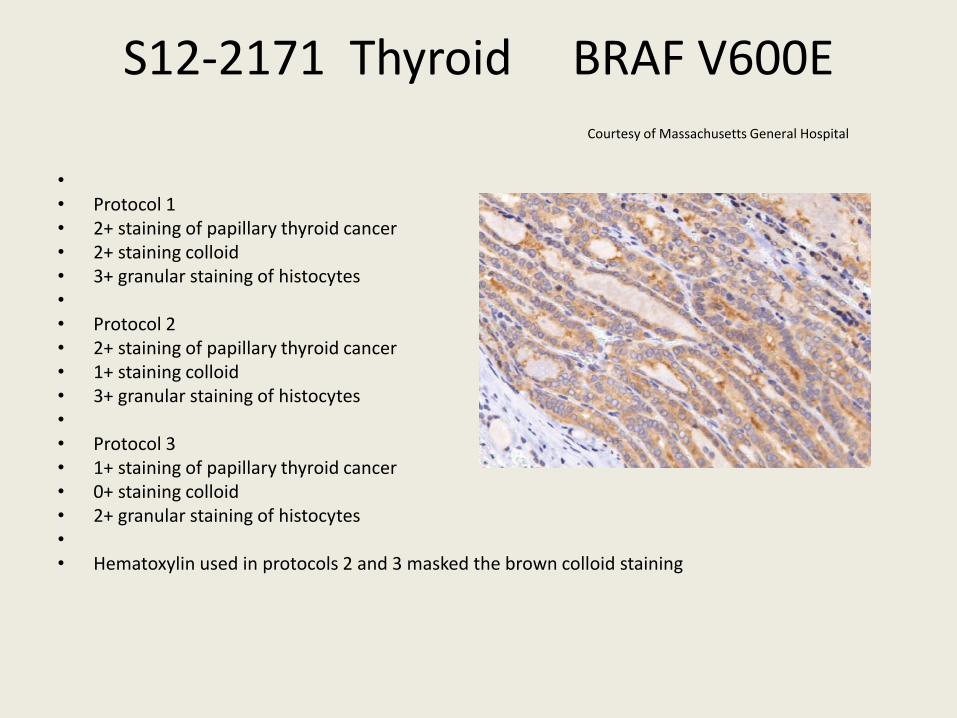
S12-2171 Thyroid BRAF V600E Courtesy of Massachusetts General Hospital
• • Protocol 1 • 2+ staining of papillary thyroid cancer • 2+ staining colloid • 3+ granular staining of histocytes • • Protocol 2 • 2+ staining of papillary thyroid cancer • 1+ staining colloid • 3+ granular staining of histocytes • • Protocol 3 • 1+ staining of papillary thyroid cancer • 0+ staining colloid • 2+ granular staining of histocytes • • Hematoxylin used in protocols 2 and 3 masked the brown colloid staining
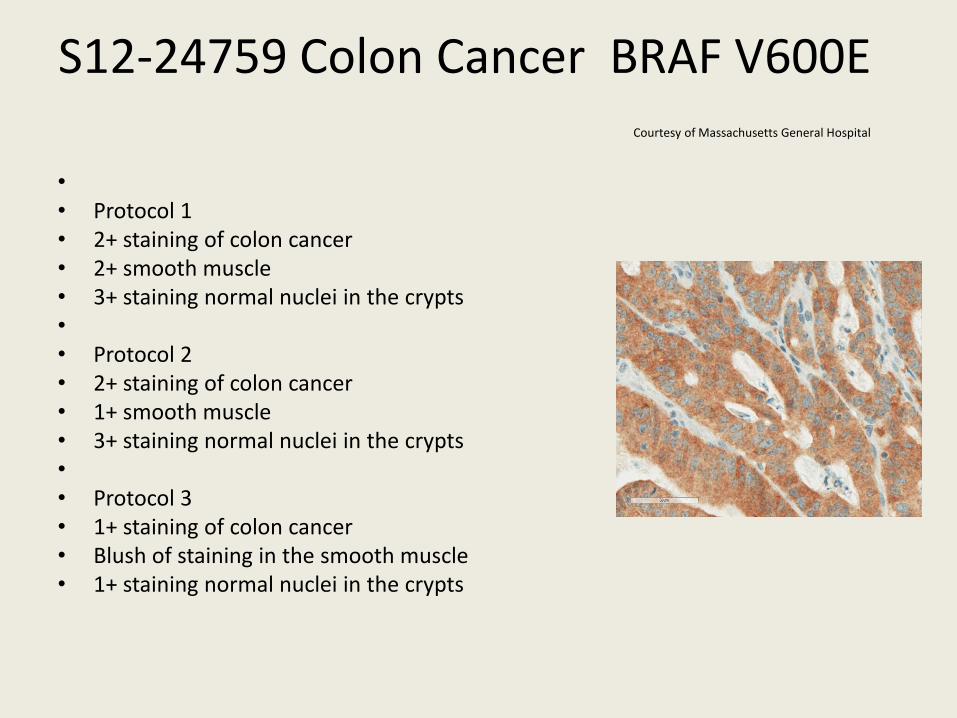
S12-24759 Colon Cancer BRAF V600E Courtesy of Massachusetts General Hospital
• • Protocol 1 • 2+ staining of colon cancer • 2+ smooth muscle • 3+ staining normal nuclei in the crypts • • Protocol 2 • 2+ staining of colon cancer • 1+ smooth muscle • 3+ staining normal nuclei in the crypts • • Protocol 3 • 1+ staining of colon cancer • Blush of staining in the smooth muscle • 1+ staining normal nuclei in the crypts
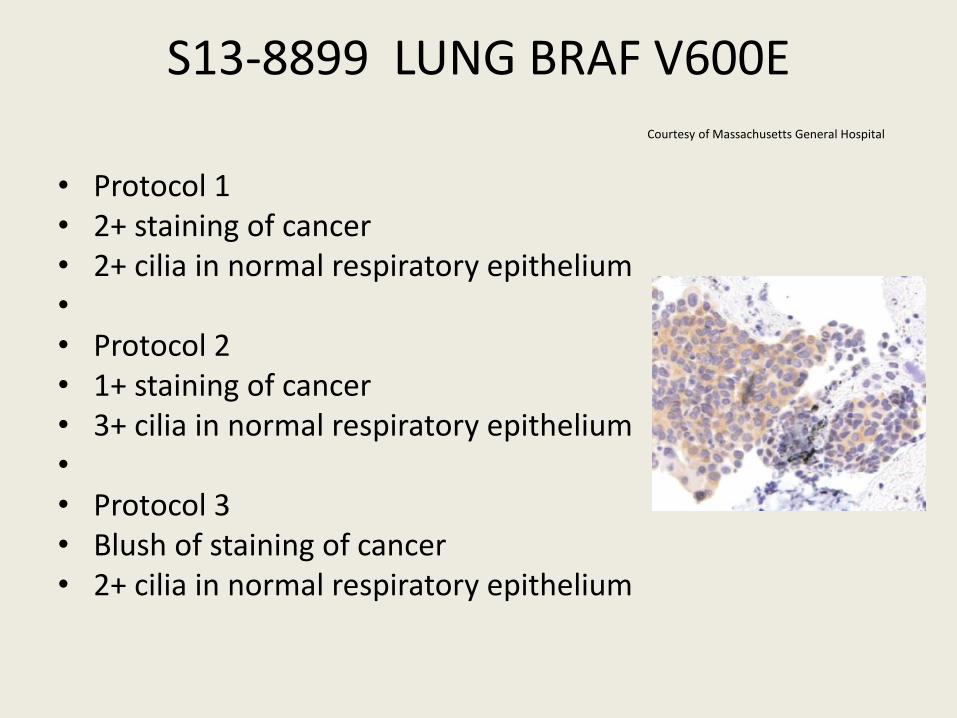
S13-8899 LUNG BRAF V600E Courtesy of Massachusetts General Hospital
• Protocol 1 • 2+ staining of cancer • 2+ cilia in normal respiratory epithelium • • Protocol 2 • 1+ staining of cancer • 3+ cilia in normal respiratory epithelium • • Protocol 3 • Blush of staining of cancer • 2+ cilia in normal respiratory epithelium
STAINING SELECTION USING THE VE1 RTU ANTIBODY FROM VENTANA
ANTIBODY SUPPLIED COURTESY OF VENTANA
Tissue Parameter BenchMark XT - 1 BenchMark XT - 2 BenchMark XT - 3
Detection Kit OptiView DAB IHC OptiView DAB IHC OptiView DAB IHC
Procedure Type Paraffin Paraffin Paraffin
Deparaffinization Selected, default temperature
Selected, default temperature
Selected, default temperature
Cell Conditioning 64 min CC1, default temperature
64 min CC1, default temperature
32 min CC1, default temperature
Pre Primary Peroxidase Inhibitor Selected Selected Selected
Incubation Temperature 37º C 37º C 37º C
Antibody Incubation Time 16 minutes 32 minutes 32 minutes
Counterstains/ Time Hematoxylin II 4 min
Bluing 4 min Hematoxylin 4 min
Bluing 4 min Hematoxylin II 4 min
Bluing 4 min
STEP 2
• Stain an array of a variety of different tumours
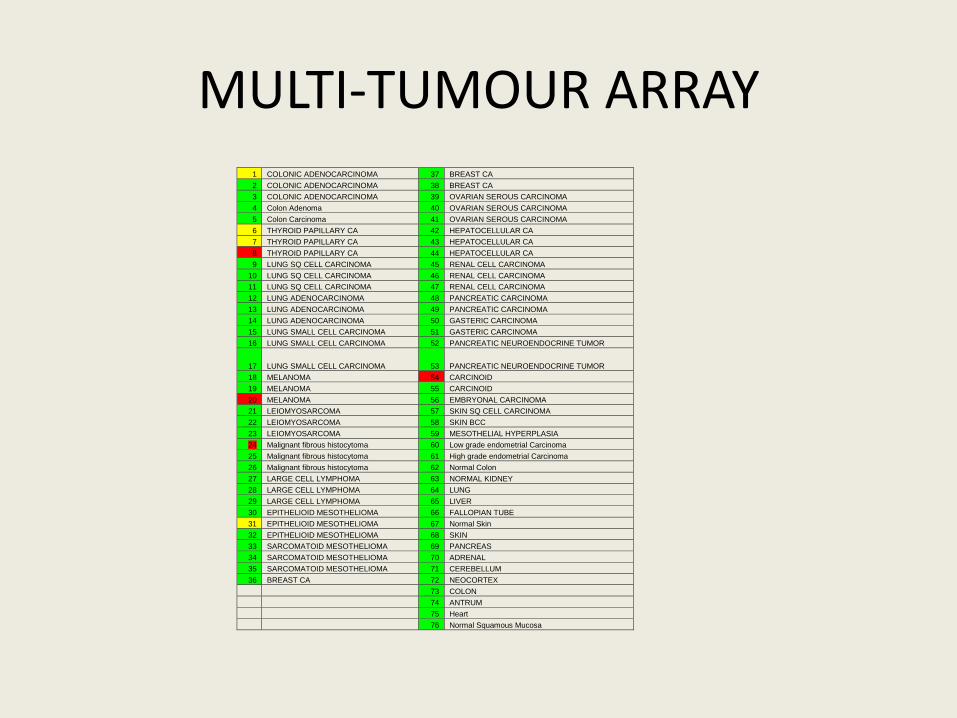
MULTI-TUMOUR ARRAY 1 COLONIC ADENOCARCINOMA 37 BREAST CA
2 COLONIC ADENOCARCINOMA 38 BREAST CA
3 COLONIC ADENOCARCINOMA 39 OVARIAN SEROUS CARCINOMA
4 Colon Adenoma 40 OVARIAN SEROUS CARCINOMA
5 Colon Carcinoma 41 OVARIAN SEROUS CARCINOMA
6 THYROID PAPILLARY CA 42 HEPATOCELLULAR CA
7 THYROID PAPILLARY CA 43 HEPATOCELLULAR CA
8 THYROID PAPILLARY CA 44 HEPATOCELLULAR CA
9 LUNG SQ CELL CARCINOMA 45 RENAL CELL CARCINOMA
10 LUNG SQ CELL CARCINOMA 46 RENAL CELL CARCINOMA
11 LUNG SQ CELL CARCINOMA 47 RENAL CELL CARCINOMA
12 LUNG ADENOCARCINOMA 48 PANCREATIC CARCINOMA
13 LUNG ADENOCARCINOMA 49 PANCREATIC CARCINOMA
14 LUNG ADENOCARCINOMA 50 GASTERIC CARCINOMA
15 LUNG SMALL CELL CARCINOMA 51 GASTERIC CARCINOMA
16 LUNG SMALL CELL CARCINOMA 52 PANCREATIC NEUROENDOCRINE TUMOR
17 LUNG SMALL CELL CARCINOMA 53 PANCREATIC NEUROENDOCRINE TUMOR
18 MELANOMA 54 CARCINOID
19 MELANOMA 55 CARCINOID
20 MELANOMA 56 EMBRYONAL CARCINOMA
21 LEIOMYOSARCOMA 57 SKIN SQ CELL CARCINOMA
22 LEIOMYOSARCOMA 58 SKIN BCC
23 LEIOMYOSARCOMA 59 MESOTHELIAL HYPERPLASIA
24 Malignant fibrous histocytoma 60 Low grade endometrial Carcinoma
25 Malignant fibrous histocytoma 61 High grade endometrial Carcinoma
26 Malignant fibrous histocytoma 62 Normal Colon
27 LARGE CELL LYMPHOMA 63 NORMAL KIDNEY
28 LARGE CELL LYMPHOMA 64 LUNG
29 LARGE CELL LYMPHOMA 65 LIVER
30 EPITHELIOID MESOTHELIOMA 66 FALLOPIAN TUBE
31 EPITHELIOID MESOTHELIOMA 67 Normal Skin
32 EPITHELIOID MESOTHELIOMA 68 SKIN
33 SARCOMATOID MESOTHELIOMA 69 PANCREAS
34 SARCOMATOID MESOTHELIOMA 70 ADRENAL
35 SARCOMATOID MESOTHELIOMA 71 CEREBELLUM
36 BREAST CA 72 NEOCORTEX
73 COLON
74 ANTRUM
75 Heart
76 Normal Squamous Mucosa
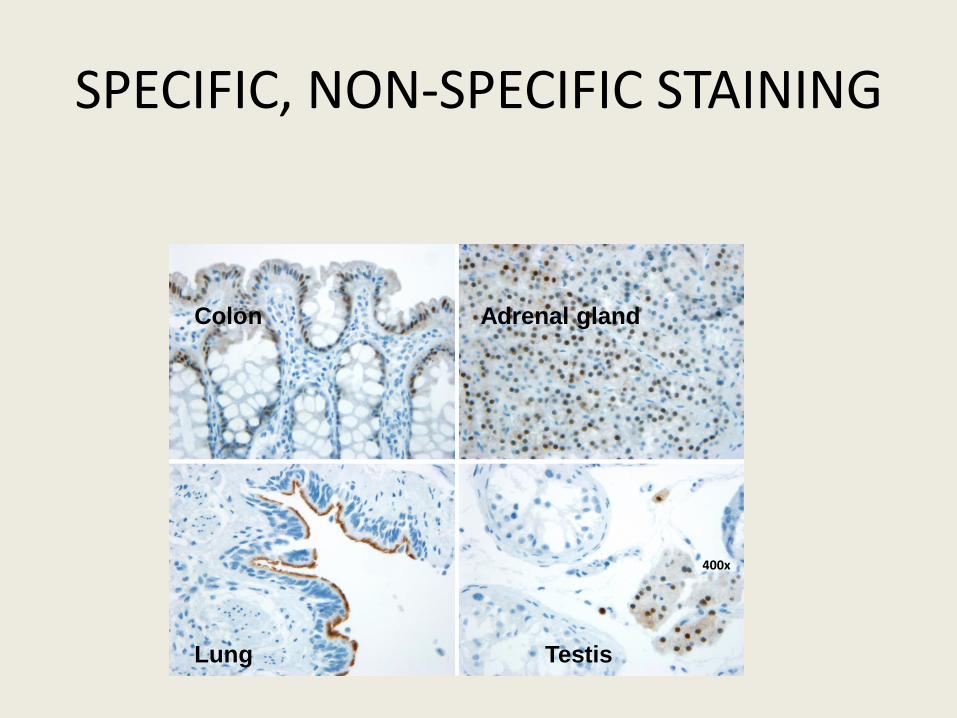
Colon Adrenal gland
Lung Testis
400x
SPECIFIC, NON-SPECIFIC STAINING
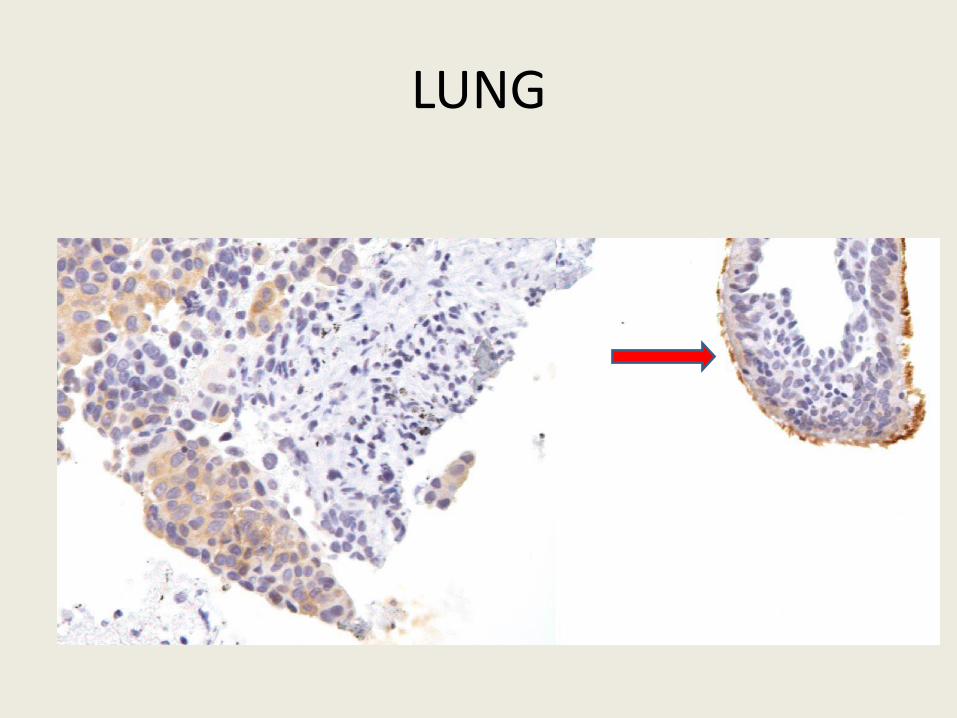
LUNG
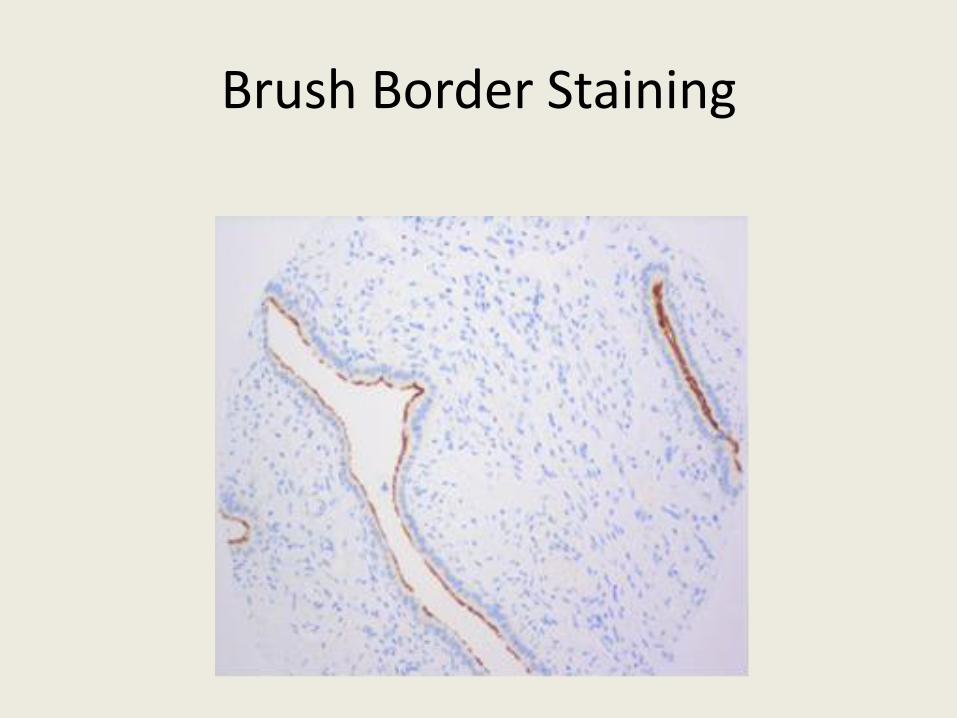
Brush Border Staining
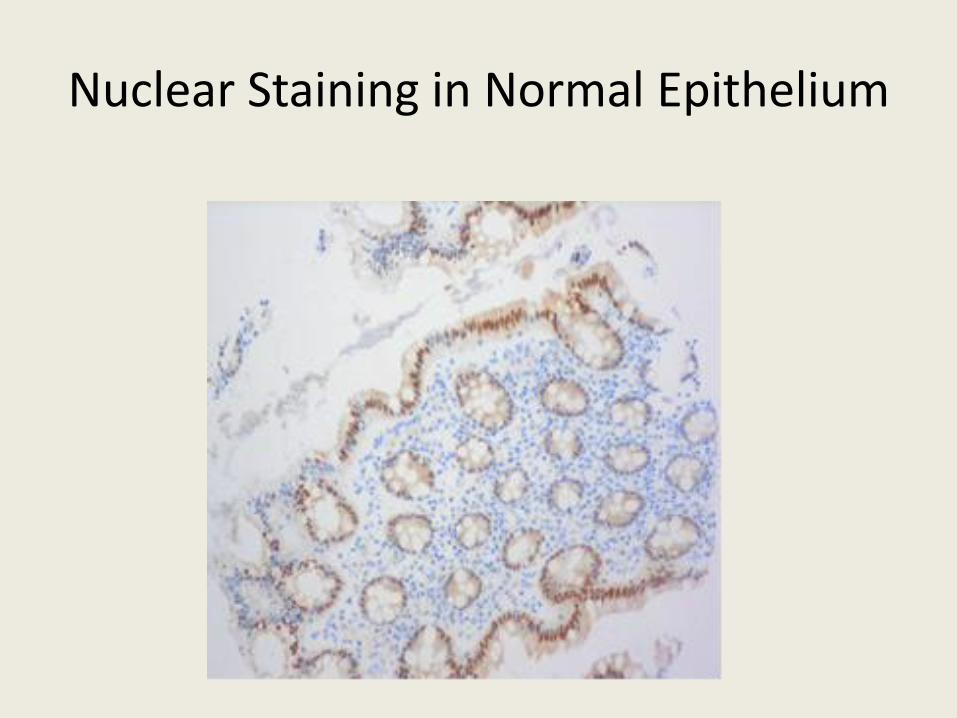
Nuclear Staining in Normal Epithelium
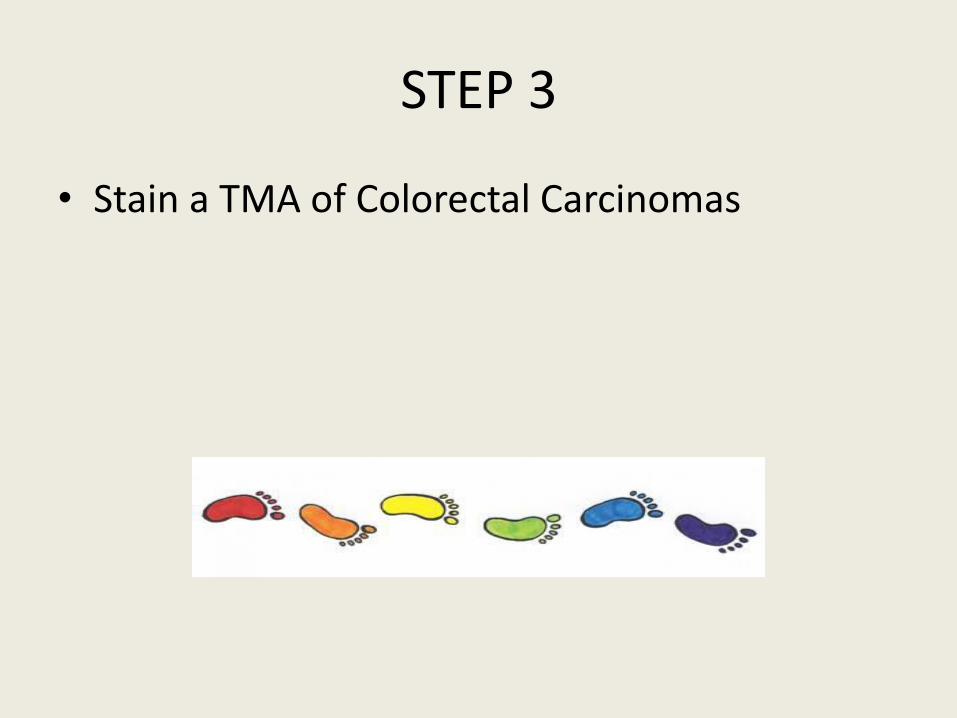
STEP 3
• Stain a TMA of Colorectal Carcinomas
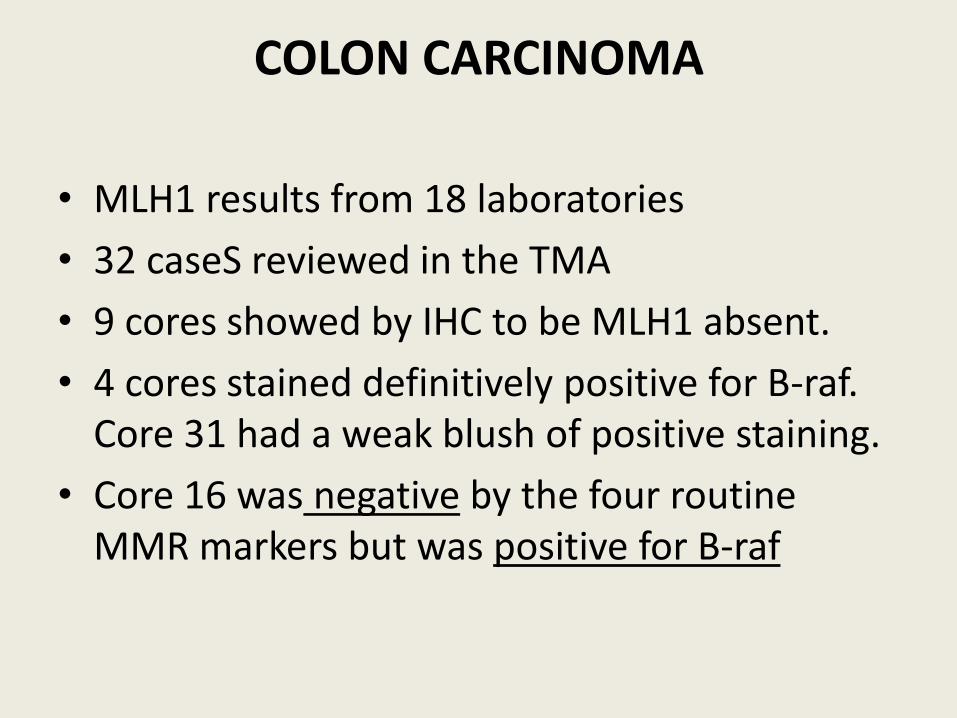
COLON CARCINOMA
• MLH1 results from 18 laboratories
• 32 caseS reviewed in the TMA
• 9 cores showed by IHC to be MLH1 absent.
• 4 cores stained definitively positive for B-raf. Core 31 had a weak blush of positive staining.
• Core 16 was negative by the four routine MMR markers but was positive for B-raf
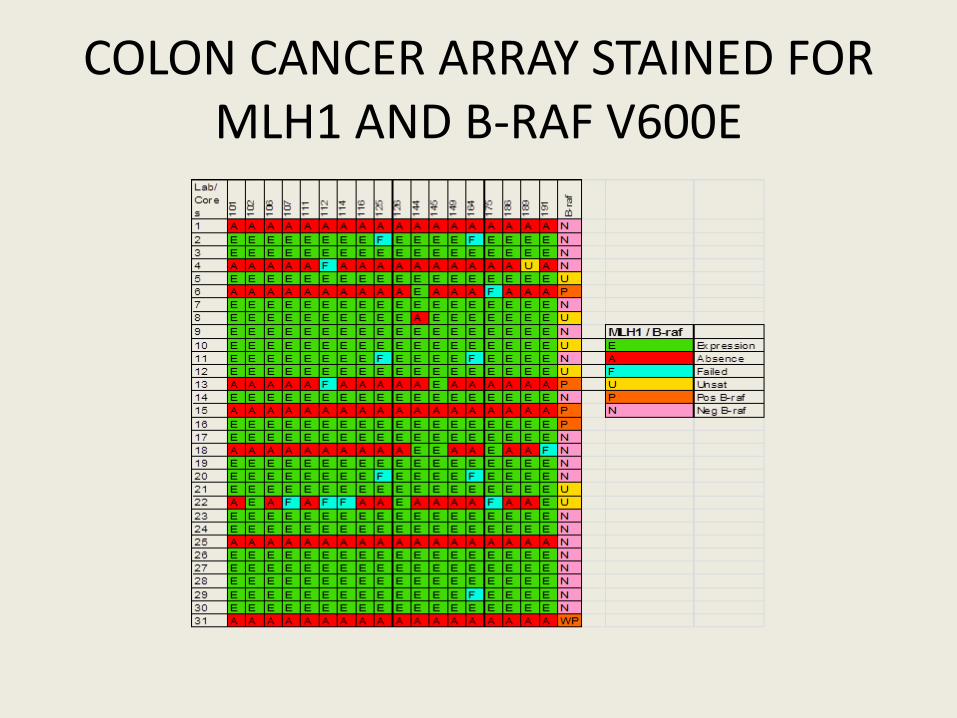
COLON CANCER ARRAY STAINED FOR MLH1 AND B-RAF V600E
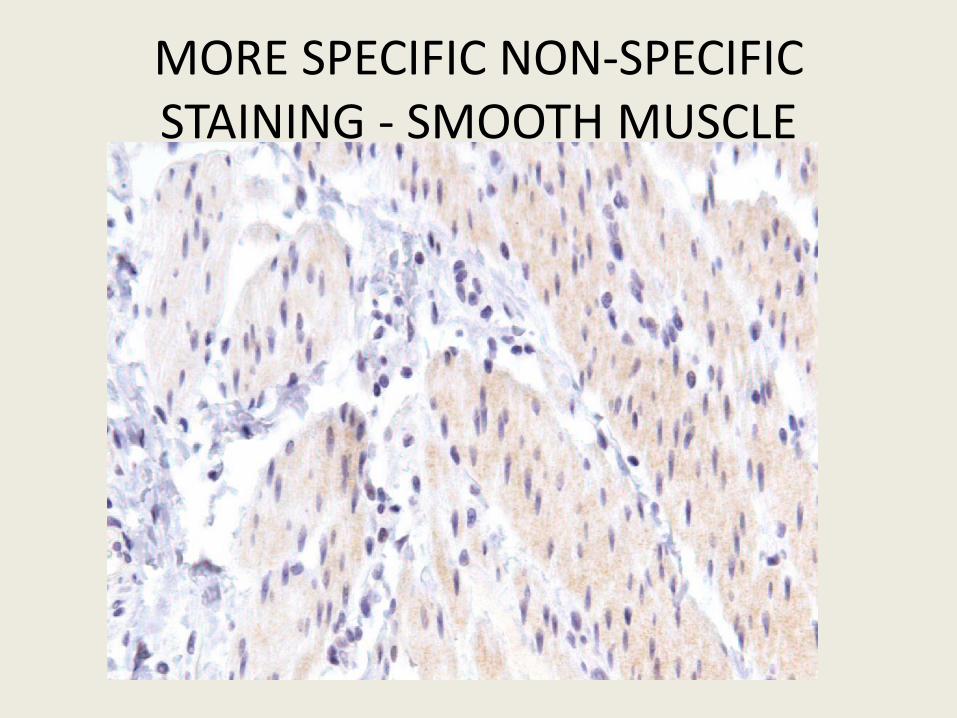
MORE SPECIFIC NON-SPECIFIC STAINING - SMOOTH MUSCLE
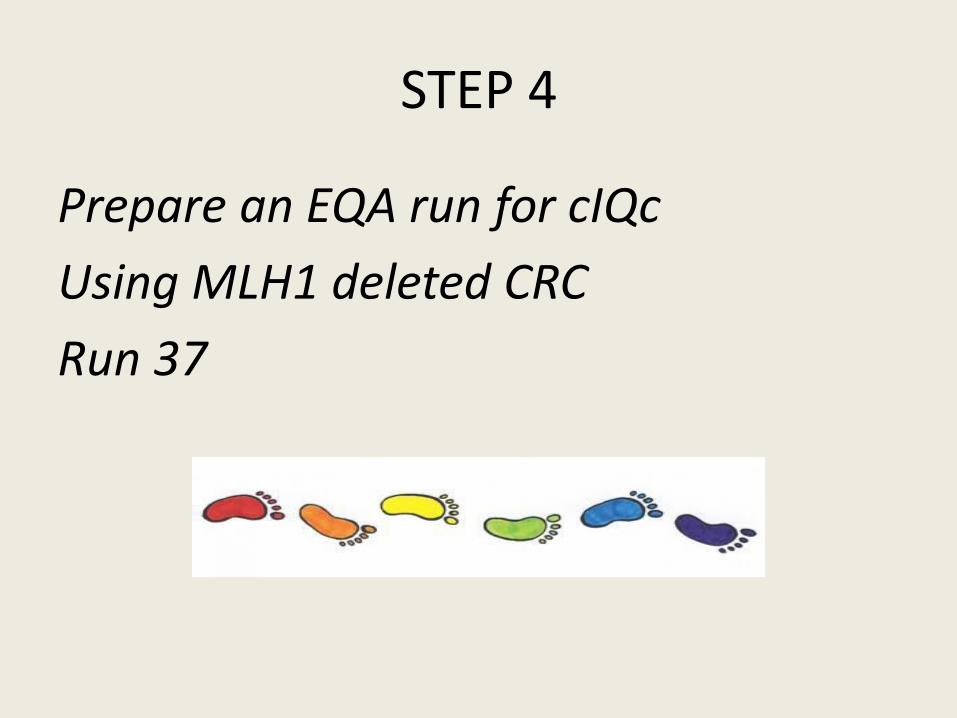
STEP 4
Prepare an EQA run for cIQc
Using MLH1 deleted CRC
Run 37
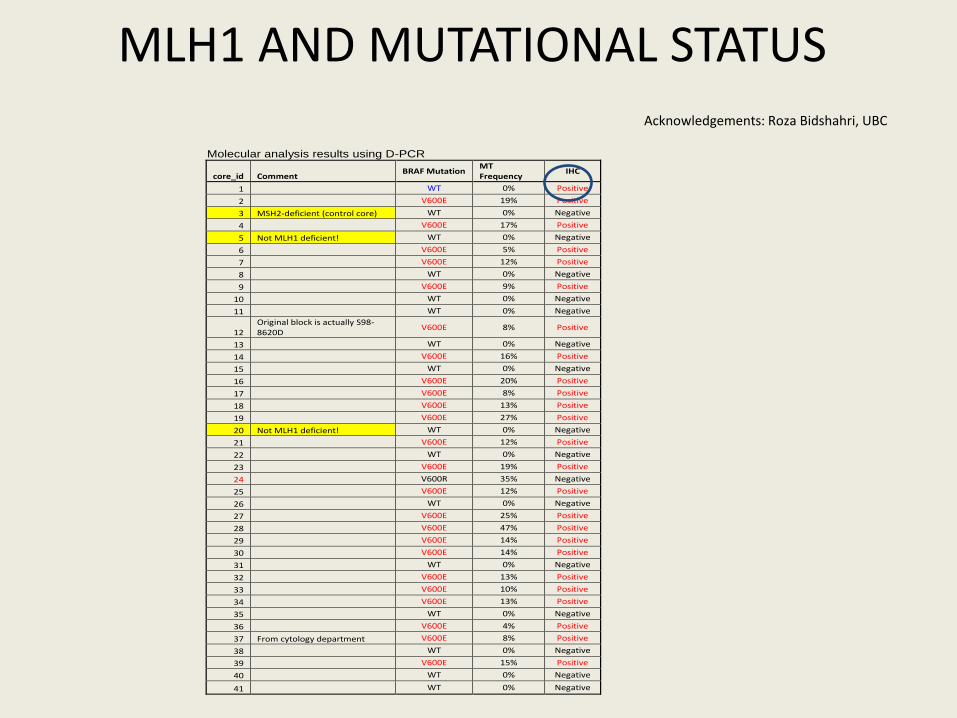
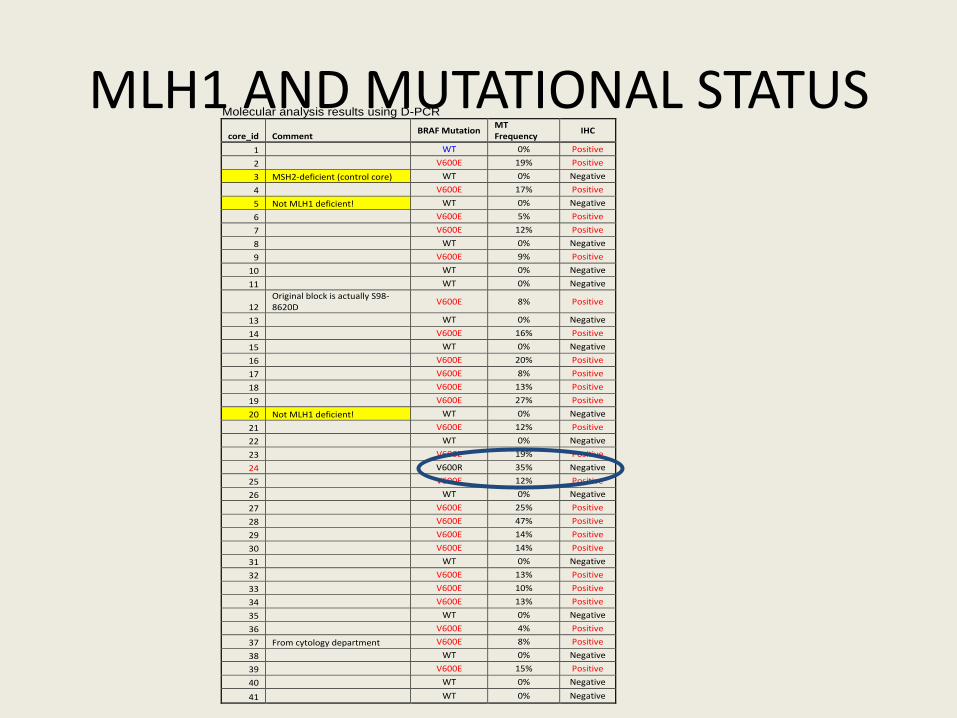
MLH1 AND MUTATIONAL STATUS
Acknowledgements: Roza Bidshahri, UBC
Molecular analysis results using D-PCR
core_id Comment BRAF Mutation
MT Frequency
IHC
1 WT 0% Positive
2 V600E 19% Positive
3 MSH2-deficient (control core) WT 0% Negative
4 V600E 17% Positive
5 Not MLH1 deficient! WT 0% Negative
6 V600E 5% Positive
7 V600E 12% Positive
8 WT 0% Negative
9 V600E 9% Positive
10 WT 0% Negative
11 WT 0% Negative
12 Original block is actually S98-8620D
V600E 8% Positive
13 WT 0% Negative
14 V600E 16% Positive
15 WT 0% Negative
16 V600E 20% Positive
17 V600E 8% Positive
18 V600E 13% Positive
19 V600E 27% Positive
20 Not MLH1 deficient! WT 0% Negative
21 V600E 12% Positive
22 WT 0% Negative
23 V600E 19% Positive
24 V600R 35% Negative
25 V600E 12% Positive
26 WT 0% Negative
27 V600E 25% Positive
28 V600E 47% Positive
29 V600E 14% Positive
30 V600E 14% Positive
31 WT 0% Negative
32 V600E 13% Positive
33 V600E 10% Positive
34 V600E 13% Positive
35 WT 0% Negative
36 V600E 4% Positive
37 From cytology department V600E 8% Positive
38 WT 0% Negative
39 V600E 15% Positive
40 WT 0% Negative
41 WT 0% Negative
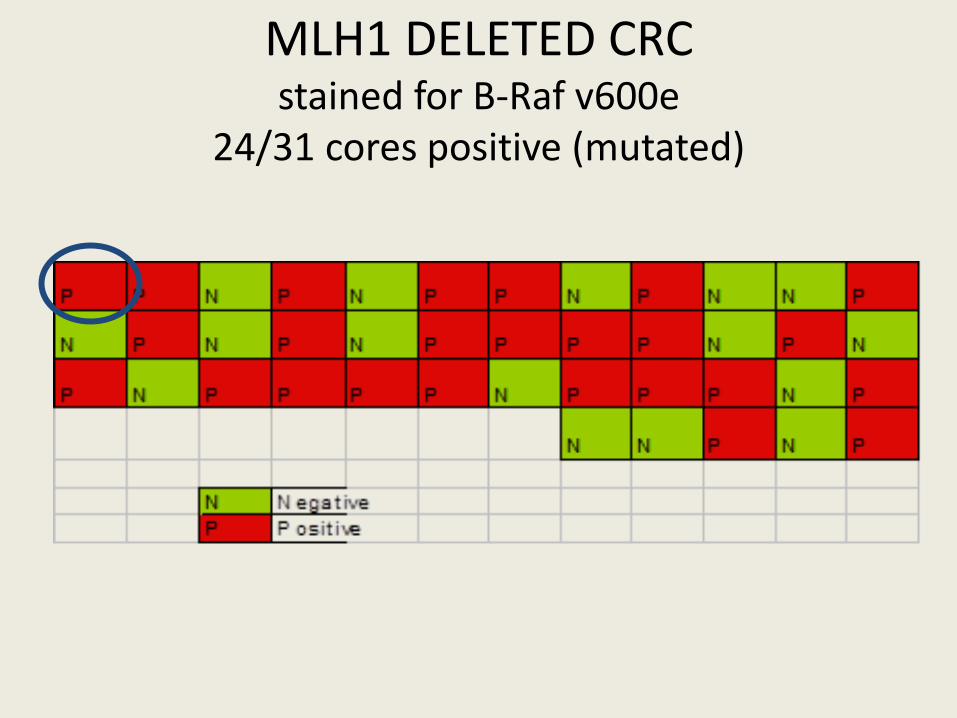
MLH1 DELETED CRC stained for B-Raf v600e
24/31 cores positive (mutated)
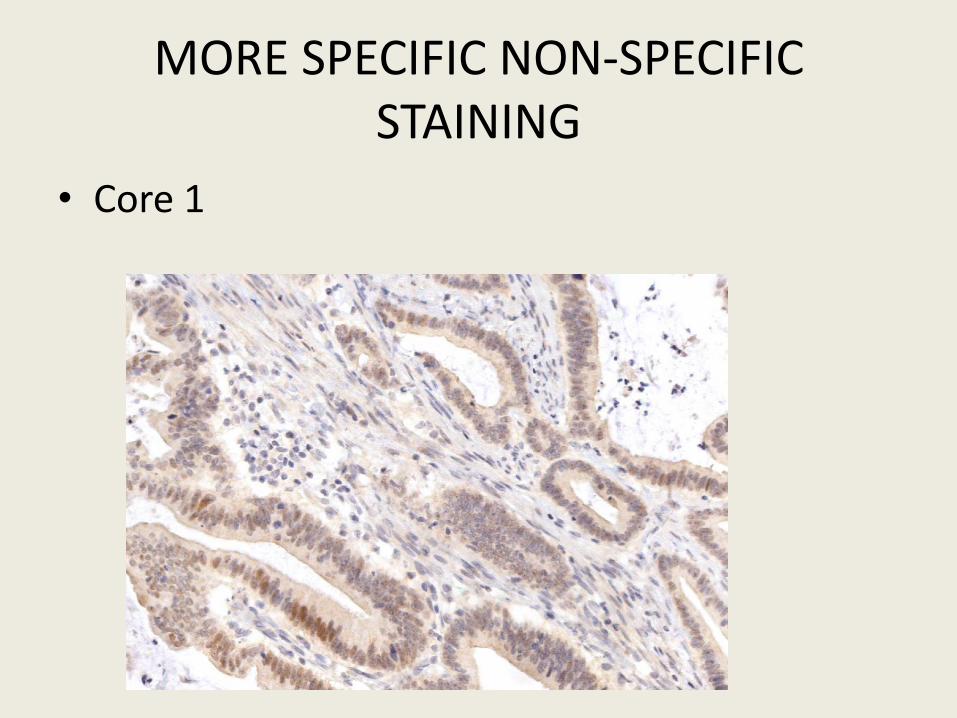
MORE SPECIFIC NON-SPECIFIC STAINING
• Core 1
MLH1 AND MUTATIONAL STATUS Molecular analysis results using D-PCR
core_id Comment BRAF Mutation
MT Frequency
IHC
1 WT 0% Positive
2 V600E 19% Positive
3 MSH2-deficient (control core) WT 0% Negative
4 V600E 17% Positive
5 Not MLH1 deficient! WT 0% Negative
6 V600E 5% Positive
7 V600E 12% Positive
8 WT 0% Negative
9 V600E 9% Positive
10 WT 0% Negative
11 WT 0% Negative
12 Original block is actually S98-8620D
V600E 8% Positive
13 WT 0% Negative
14 V600E 16% Positive
15 WT 0% Negative
16 V600E 20% Positive
17 V600E 8% Positive
18 V600E 13% Positive
19 V600E 27% Positive
20 Not MLH1 deficient! WT 0% Negative
21 V600E 12% Positive
22 WT 0% Negative
23 V600E 19% Positive
24 V600R 35% Negative
25 V600E 12% Positive
26 WT 0% Negative
27 V600E 25% Positive
28 V600E 47% Positive
29 V600E 14% Positive
30 V600E 14% Positive
31 WT 0% Negative
32 V600E 13% Positive
33 V600E 10% Positive
34 V600E 13% Positive
35 WT 0% Negative
36 V600E 4% Positive
37 From cytology department V600E 8% Positive
38 WT 0% Negative
39 V600E 15% Positive
40 WT 0% Negative
41 WT 0% Negative
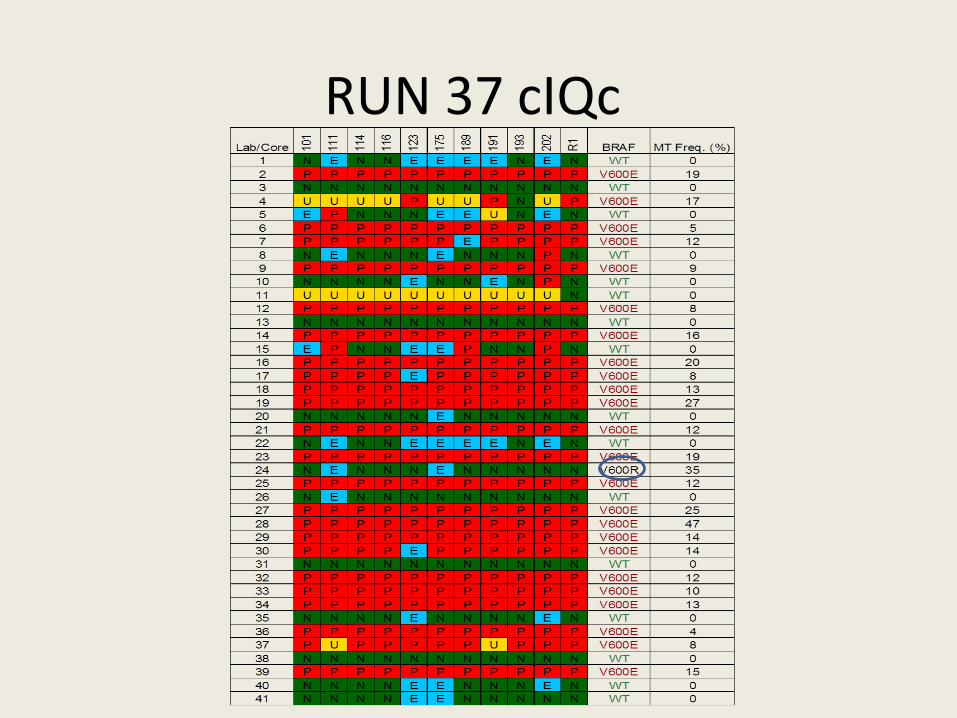
RUN 37 cIQc
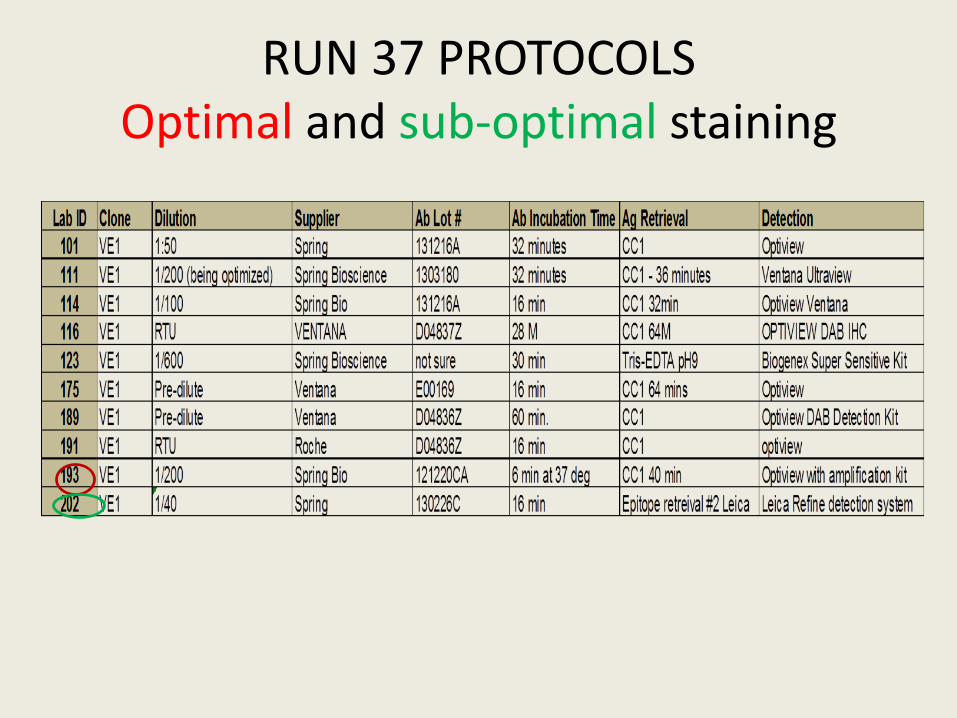
RUN 37 PROTOCOLS Optimal and sub-optimal staining
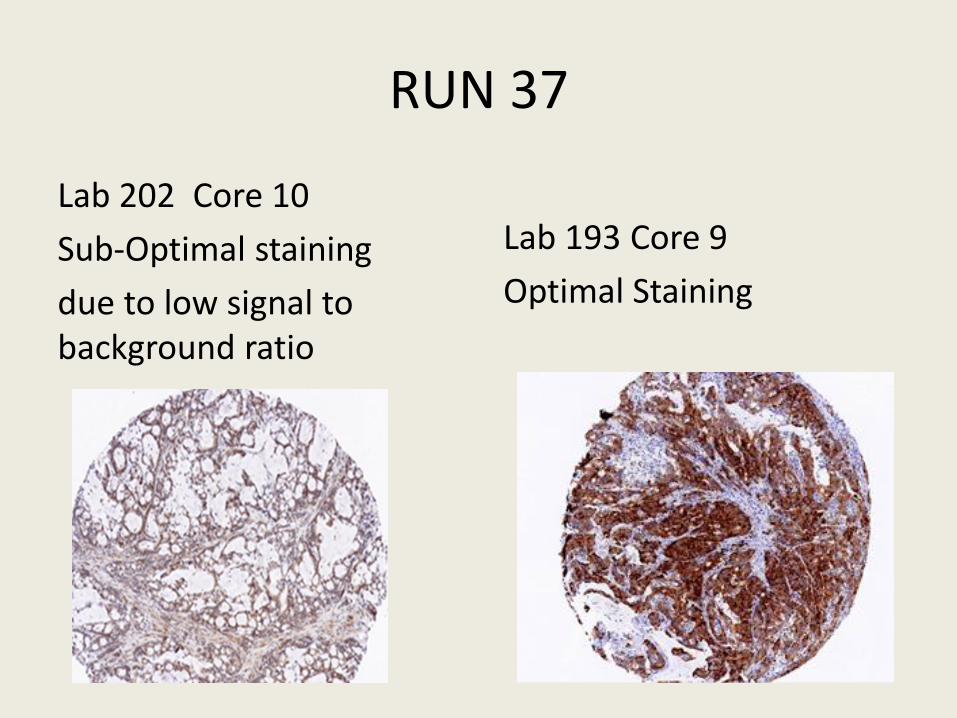
RUN 37
Lab 202 Core 10
Sub-Optimal staining
due to low signal to background ratio
Lab 193 Core 9
Optimal Staining
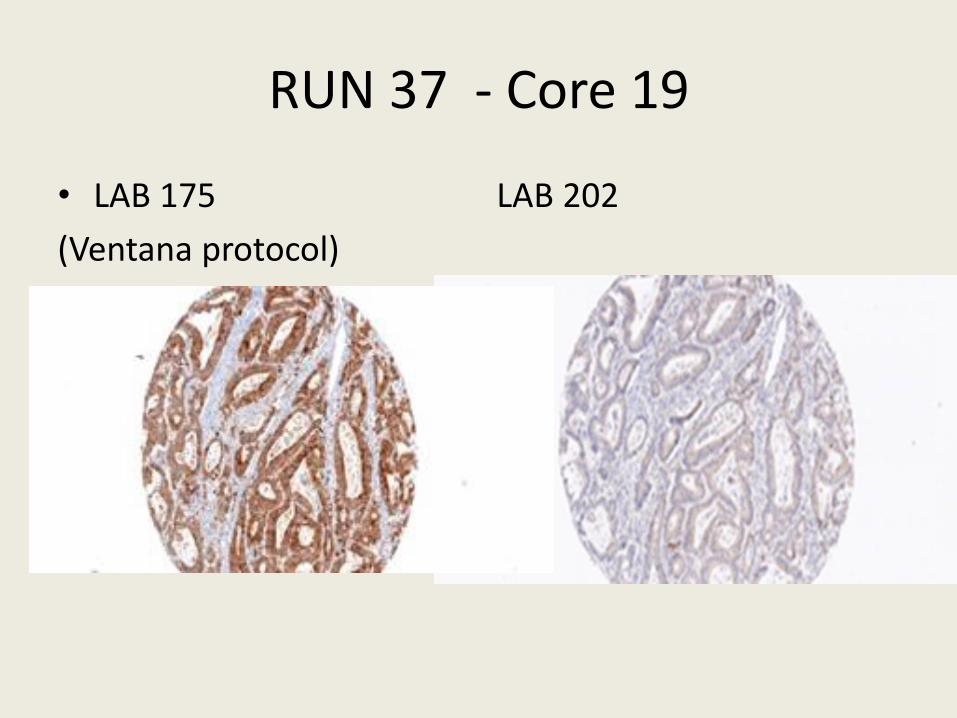
RUN 37 - Core 19
• LAB 175
(Ventana protocol)
LAB 202
RUN 37
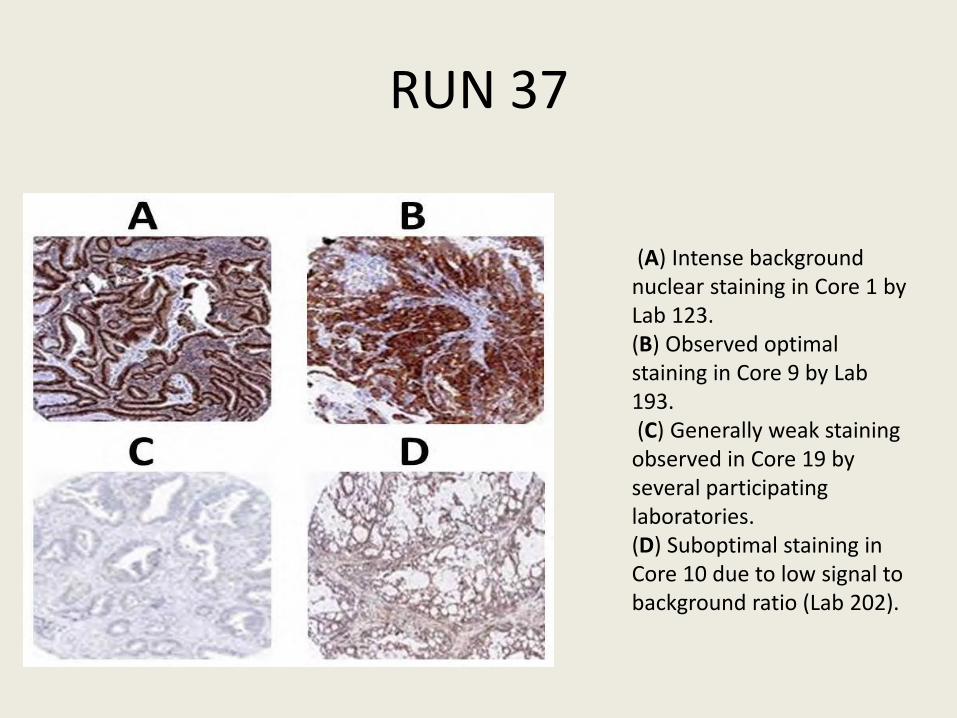
(A) Intense background nuclear staining in Core 1 by Lab 123. (B) Observed optimal staining in Core 9 by Lab 193. (C) Generally weak staining observed in Core 19 by several participating laboratories. (D) Suboptimal staining in Core 10 due to low signal to background ratio (Lab 202).
STEP 5
• Collaboration with Horizon Diagnostics and Visiopharm.
• Develop calibration standards
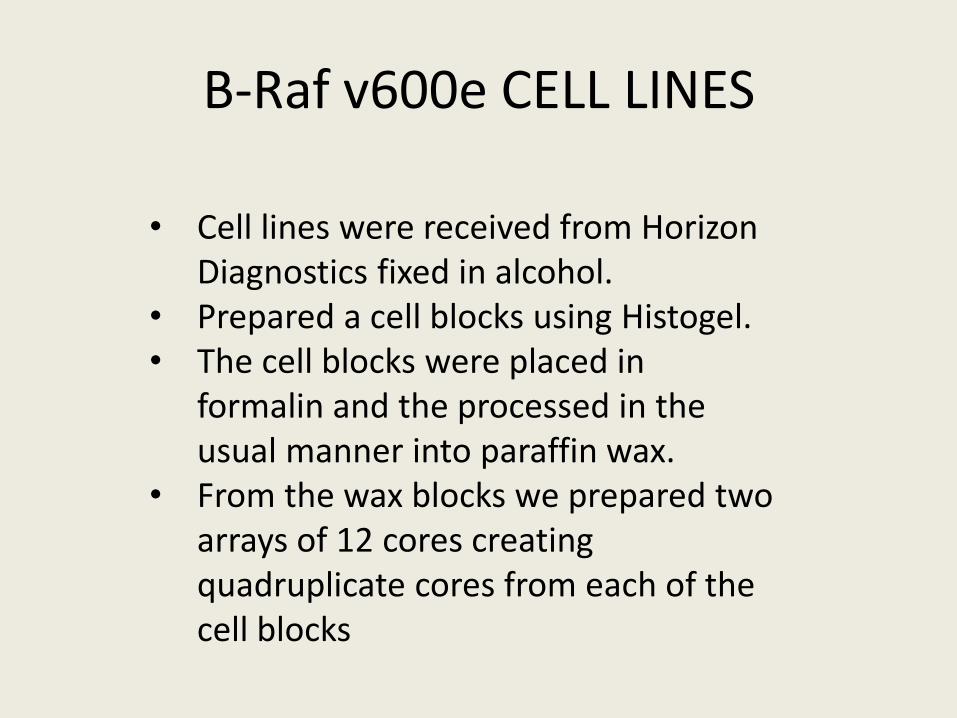
B-Raf v600e CELL LINES
• Cell lines were received from Horizon Diagnostics fixed in alcohol.
• Prepared a cell blocks using Histogel. • The cell blocks were placed in
formalin and the processed in the usual manner into paraffin wax.
• From the wax blocks we prepared two arrays of 12 cores creating quadruplicate cores from each of the cell blocks
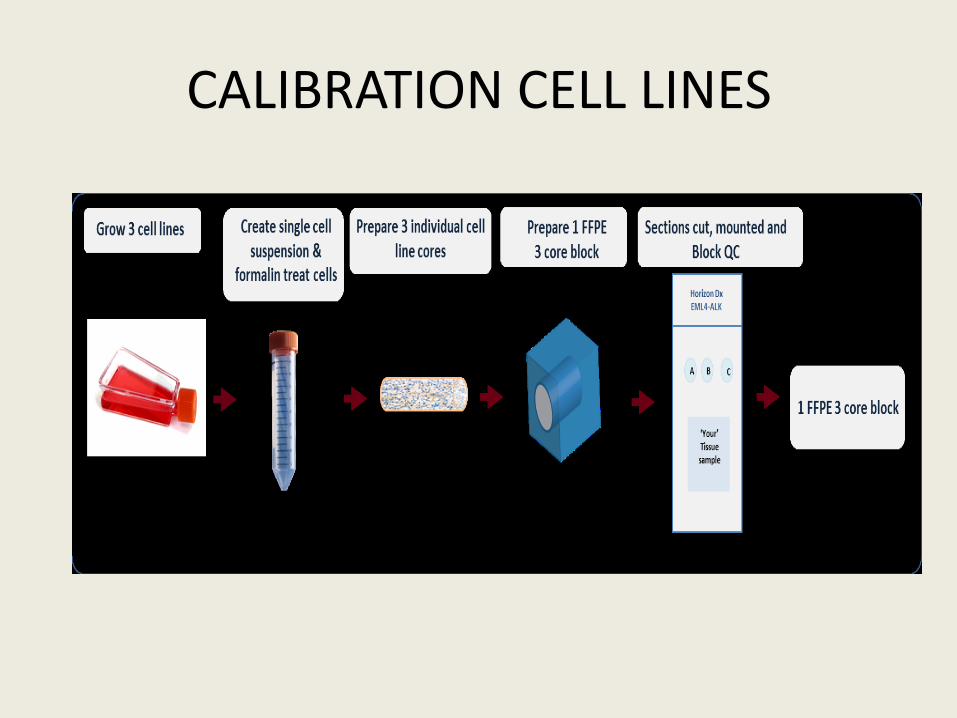
CALIBRATION CELL LINES
Research Use Only
35
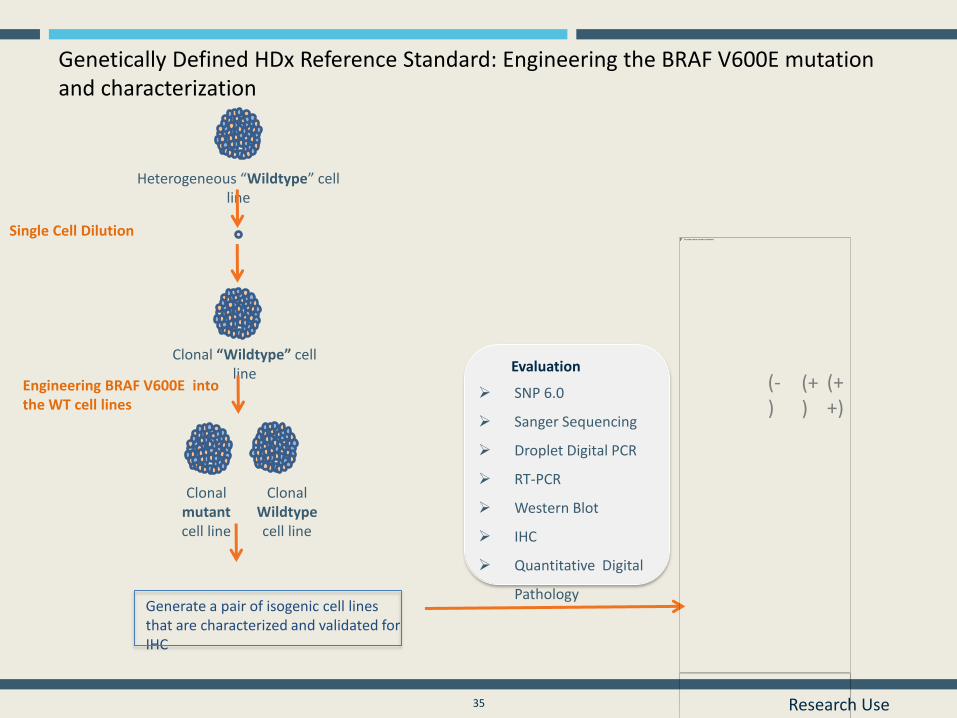
Genetically Defined HDx Reference Standard: Engineering the BRAF V600E mutation and characterization
Single Cell Dilution
Heterogeneous “Wildtype” cell line
Clonal “Wildtype” cell line
Generate a pair of isogenic cell lines that are characterized and validated for IHC
Clonal mutant cell line
Clonal Wildtype cell line
Evaluation
SNP 6.0
Sanger Sequencing
Droplet Digital PCR
RT-PCR
Western Blot
IHC
Quantitative Digital
Pathology
Engineering BRAF V600E into the WT cell lines
(-)
(+)
(++)
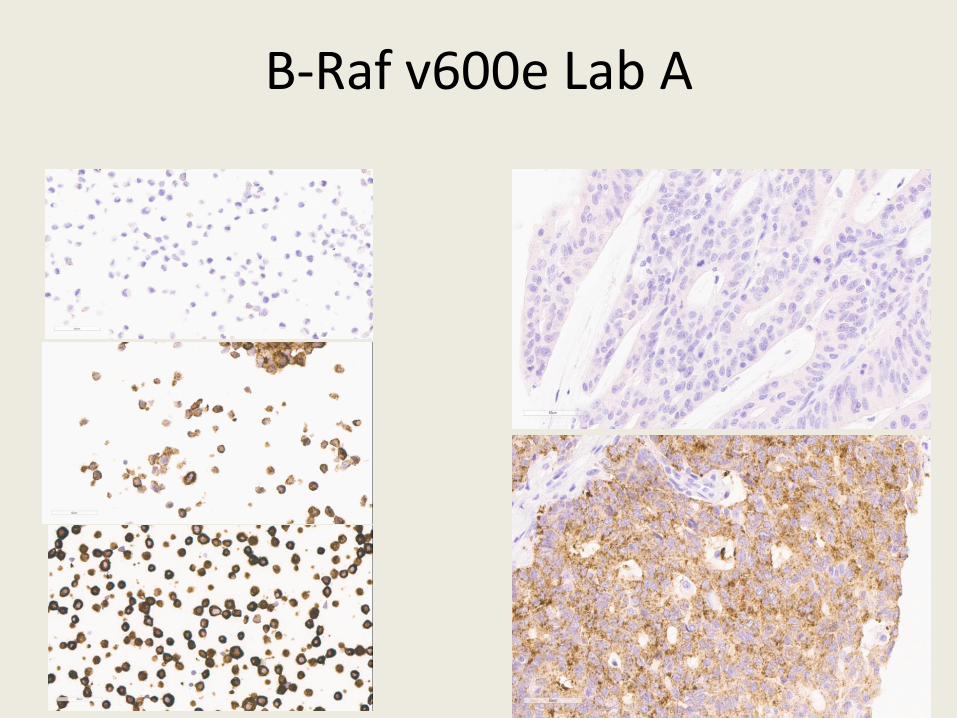
B-Raf v600e Lab A
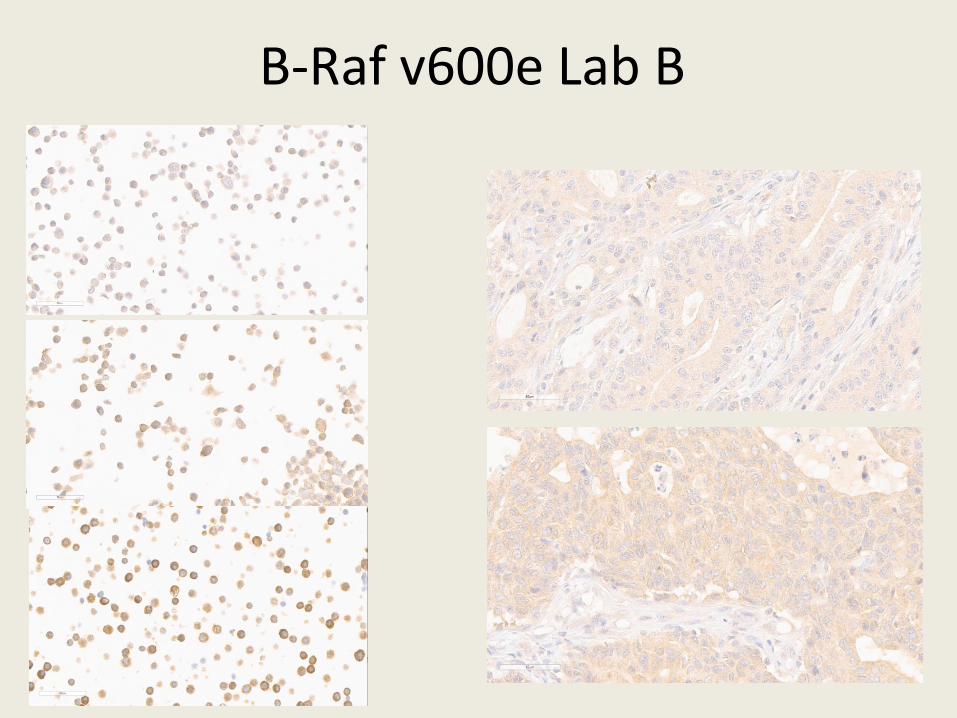
B-Raf v600e Lab B
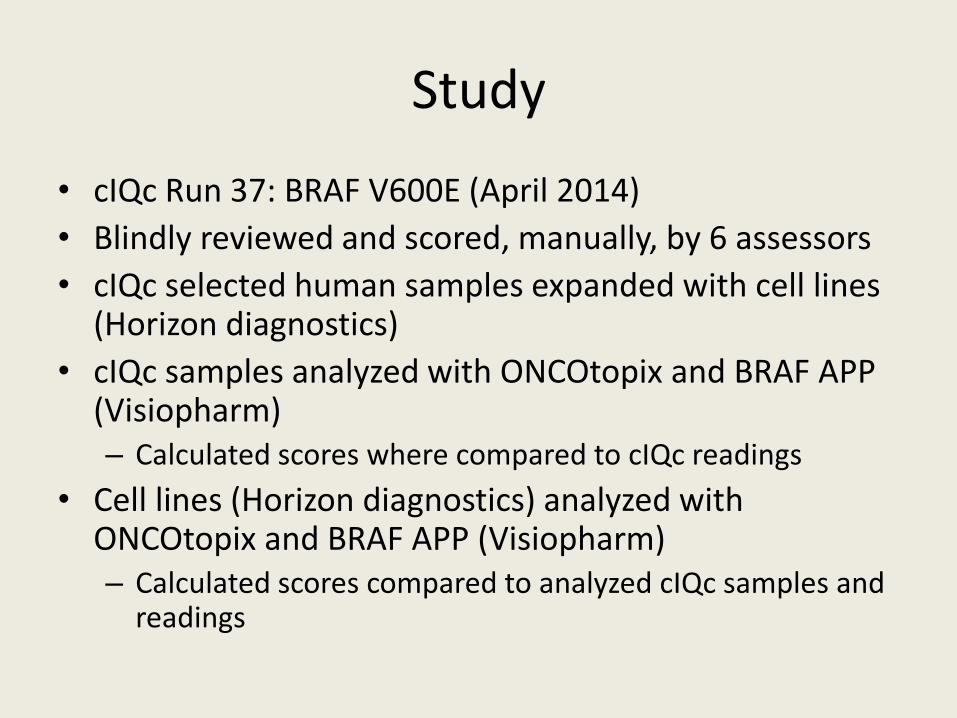
Study
• cIQc Run 37: BRAF V600E (April 2014)
• Blindly reviewed and scored, manually, by 6 assessors
• cIQc selected human samples expanded with cell lines (Horizon diagnostics)
• cIQc samples analyzed with ONCOtopix and BRAF APP (Visiopharm) – Calculated scores where compared to cIQc readings
• Cell lines (Horizon diagnostics) analyzed with ONCOtopix and BRAF APP (Visiopharm) – Calculated scores compared to analyzed cIQc samples and
readings
TMA layout
12
11
10
9 8 7 6 5 4 3 2 1
13
14
15
16
17
18
19
20
21
22
23
24
36
35
34
33
32
31
30
29
28
27
26
25
37
38
39
40
41
N
P1
P2
P3
N
P1
P2
P3
N
P1
P2
P3
cIQc Human samples
Cell Lines (Horizon diagnostics)
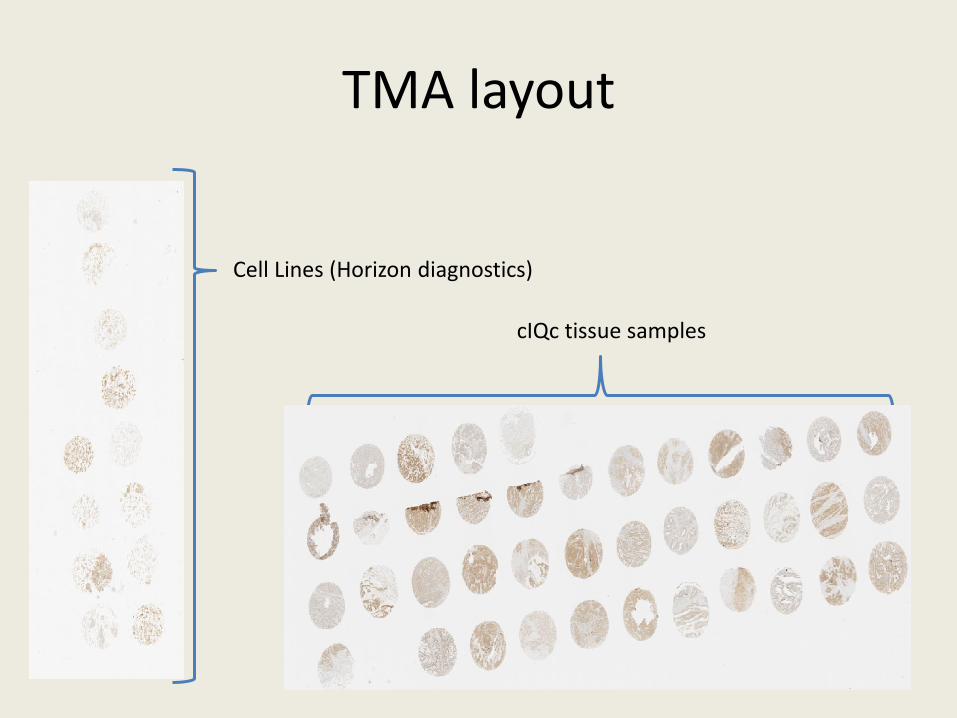
TMA layout
cIQc tissue samples
Cell Lines (Horizon diagnostics)
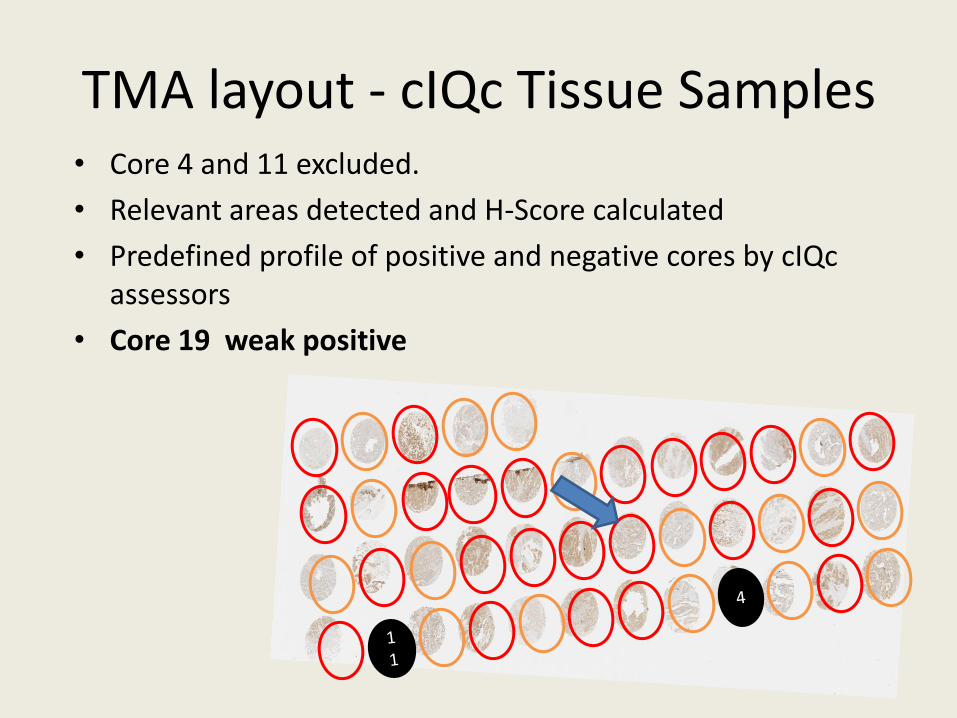
TMA layout - cIQc Tissue Samples • Core 4 and 11 excluded.
• Relevant areas detected and H-Score calculated
• Predefined profile of positive and negative cores by cIQc assessors
• Core 19 weak positive
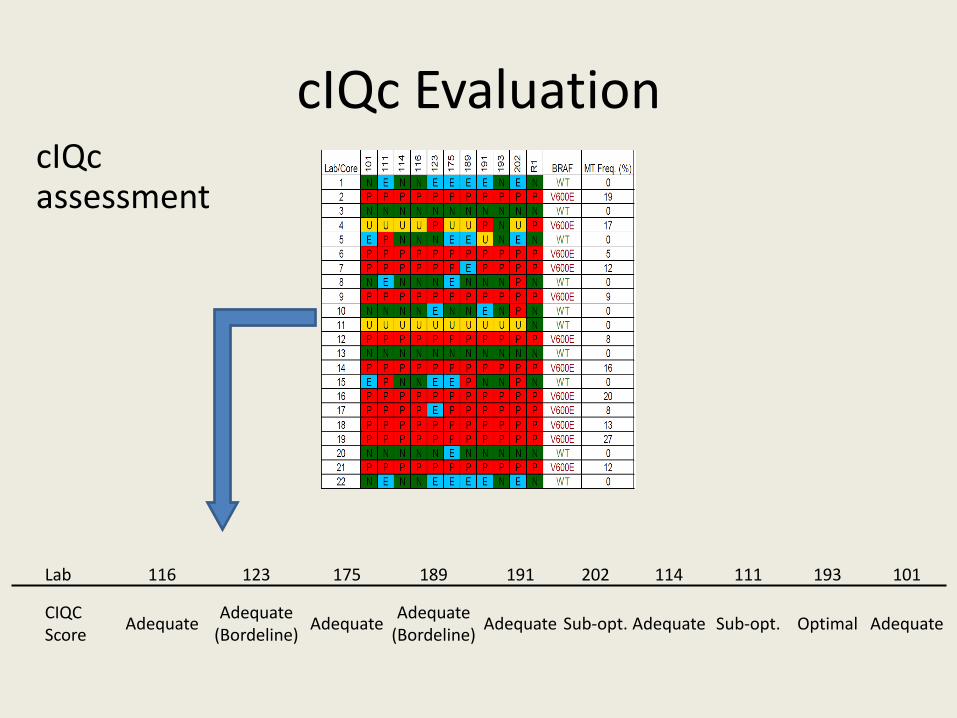
cIQc Evaluation
Lab 116 123 175 189 191 202 114 111 193 101
CIQC Score
Adequate Adequate
(Bordeline) Adequate
Adequate (Bordeline)
Adequate Sub-opt. Adequate Sub-opt. Optimal Adequate
cIQc assessment
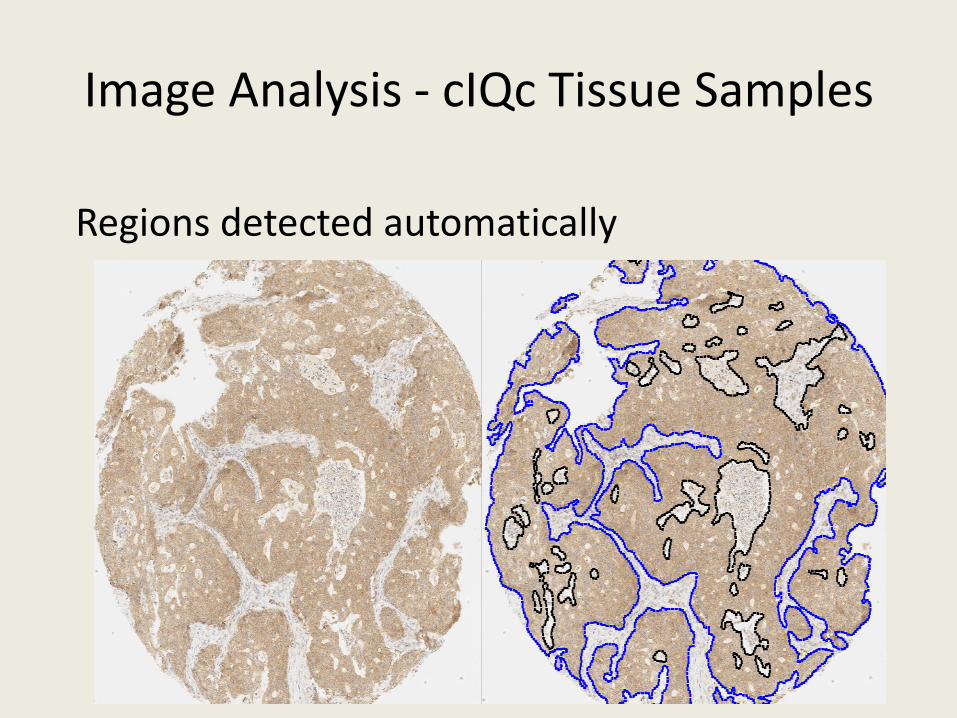
Image Analysis - cIQc Tissue Samples
Regions detected automatically
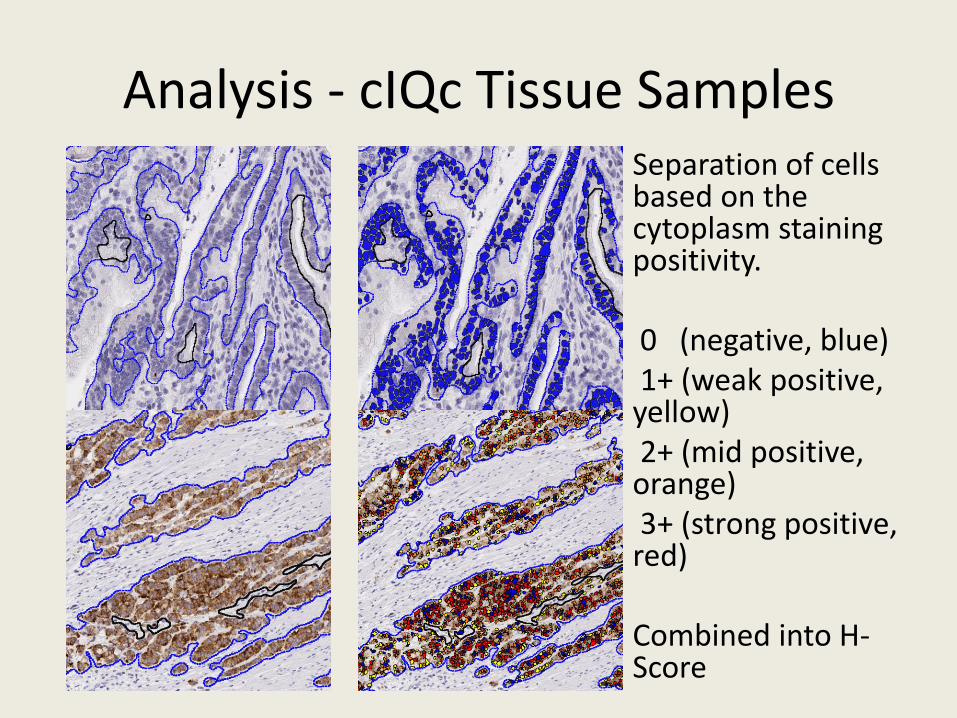
Analysis - cIQc Tissue Samples Separation of cells based on the cytoplasm staining positivity. 0 (negative, blue) 1+ (weak positive, yellow) 2+ (mid positive, orange) 3+ (strong positive, red) Combined into H-Score
0
50
100
150
200
250
300
20 22 40 10 41 24 1 3 19 21 33 29 25 17 7 12 16 18 9 14
Lab 193 - Optimal
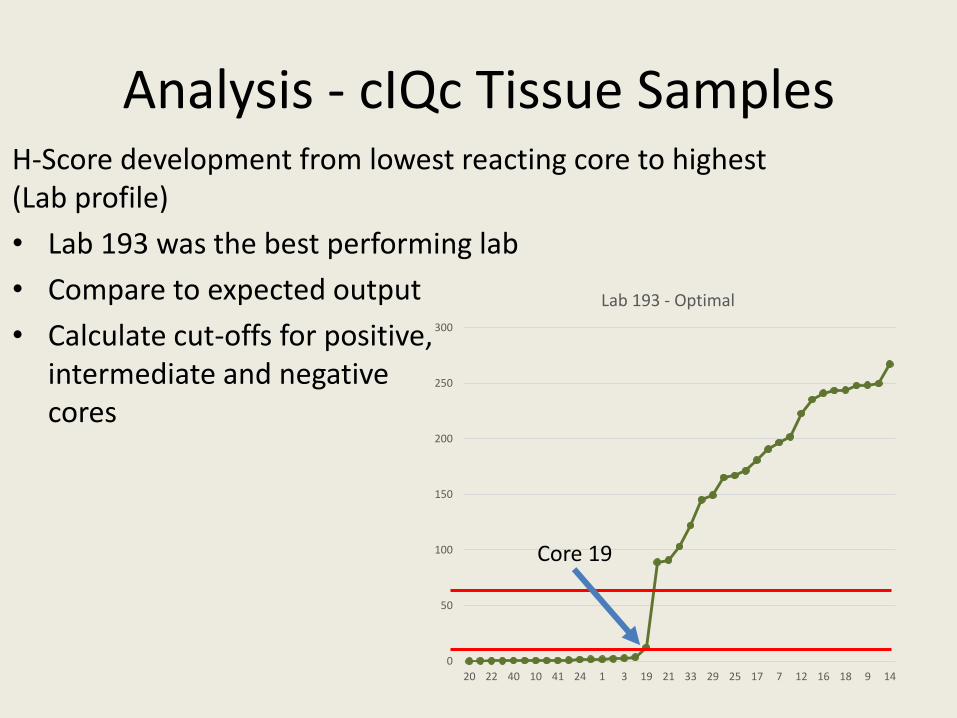
Analysis - cIQc Tissue Samples H-Score development from lowest reacting core to highest (Lab profile)
• Lab 193 was the best performing lab
• Compare to expected output
• Calculate cut-offs for positive, intermediate and negative cores
Core 19
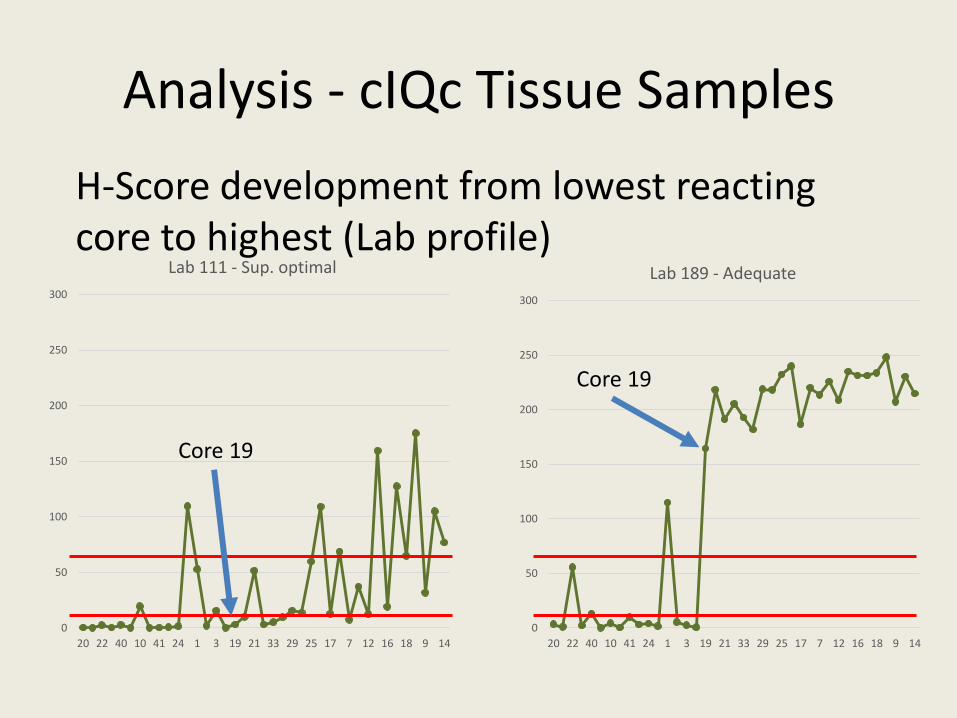
Analysis - cIQc Tissue Samples
H-Score development from lowest reacting core to highest (Lab profile)
0
50
100
150
200
250
300
20 22 40 10 41 24 1 3 19 21 33 29 25 17 7 12 16 18 9 14
Lab 111 - Sup. optimal
Core 19
0
50
100
150
200
250
300
20 22 40 10 41 24 1 3 19 21 33 29 25 17 7 12 16 18 9 14
Lab 189 - Adequate
Core 19
Lab 116 123 175 189 191 202 114 111 193 101
TISSUE
Percent agreement
79.5% 61.5% 71.8% 87.2% 54.1% 43.6% 61.5% 52.6% 97.4% 64.1%
Score Adequate Adequate Adequate Adequate Adequate Sub-opt.
Borderline
Sub-opt. Optimal Adequate
CIQC Score Adequate
Adequate /Borderline
Adequate Adequate
/Borderline Adequate Sub-opt. Adequate Sub-opt. Optimal Adequate
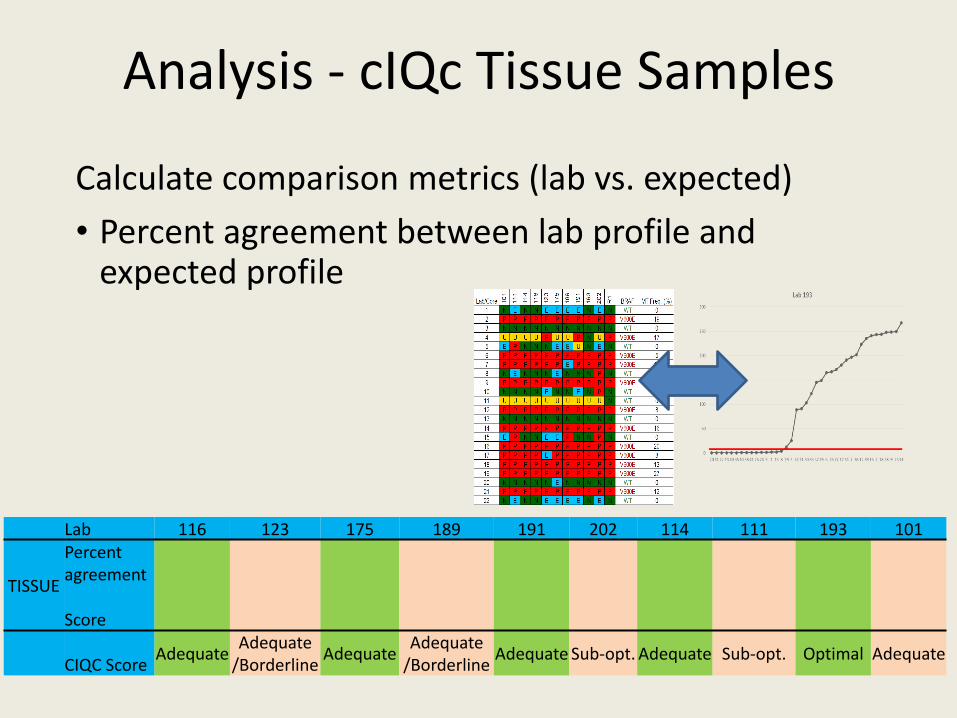
Analysis - cIQc Tissue Samples
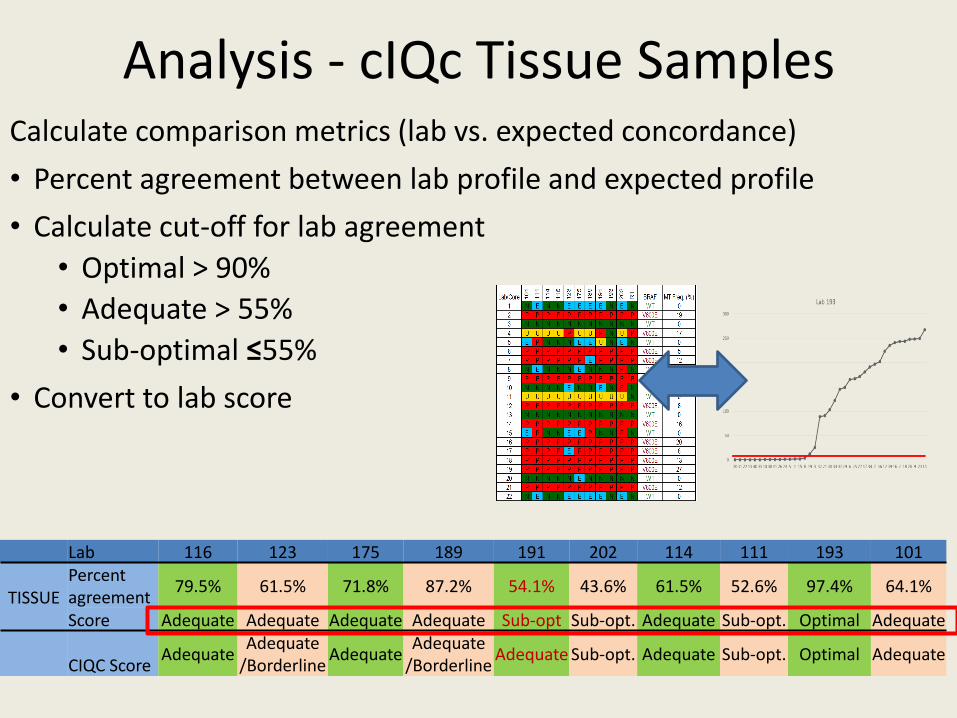
Calculate comparison metrics (lab vs. expected)
• Percent agreement between lab profile and expected profile
Analysis - cIQc Tissue Samples Calculate comparison metrics (lab vs. expected concordance)
• Percent agreement between lab profile and expected profile
• Calculate cut-off for lab agreement
Lab 116 123 175 189 191 202 114 111 193 101
TISSUE
Percent agreement
79.5% 61.5% 71.8% 87.2% 54.1% 43.6% 61.5% 52.6% 97.4% 64.1%
Score Adequate Adequate Adequate Adequate Adequate Sub-opt.
Borderline
Sub-opt.
Optimal Adequate
CIQC Score Adequate
Adequate /Borderline
Adequate Adequate
/Borderline Adequate Sub-opt. Adequate
Sub-opt.
Optimal Adequate
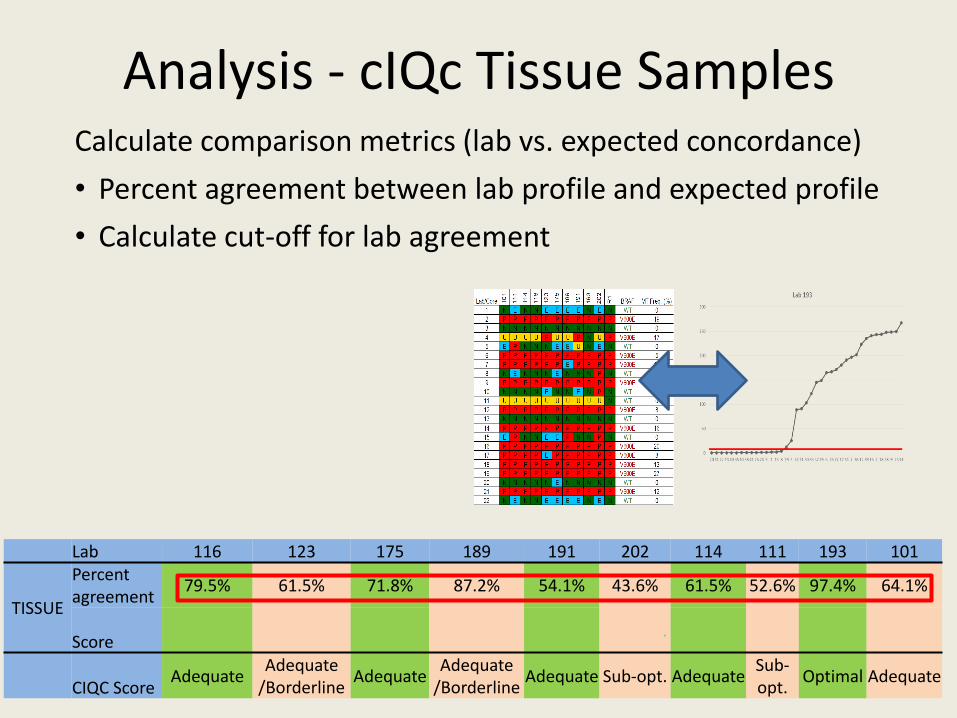
Analysis - cIQc Tissue Samples Calculate comparison metrics (lab vs. expected concordance)
• Percent agreement between lab profile and expected profile
• Calculate cut-off for lab agreement
• Optimal > 90%
• Adequate > 55%
• Sub-optimal ≤55%
• Convert to lab score
Lab 116 123 175 189 191 202 114 111 193 101
TISSUE Percent agreement
79.5% 61.5% 71.8% 87.2% 54.1% 43.6% 61.5% 52.6% 97.4% 64.1%
Score Adequate Adequate Adequate Adequate Sub-opt Sub-opt. Adequate Sub-opt. Optimal Adequate
CIQC Score Adequate
Adequate /Borderline
Adequate Adequate
/Borderline Adequate Sub-opt. Adequate Sub-opt. Optimal Adequate
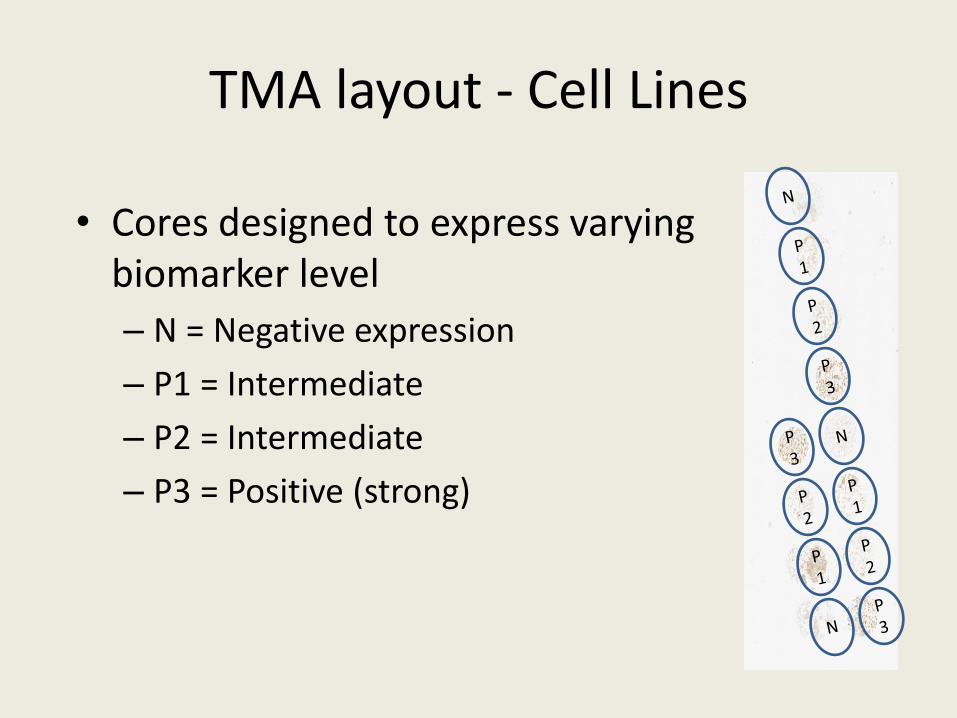
TMA layout - Cell Lines
• Cores designed to express varying biomarker level
– N = Negative expression
– P1 = Intermediate
– P2 = Intermediate
– P3 = Positive (strong)
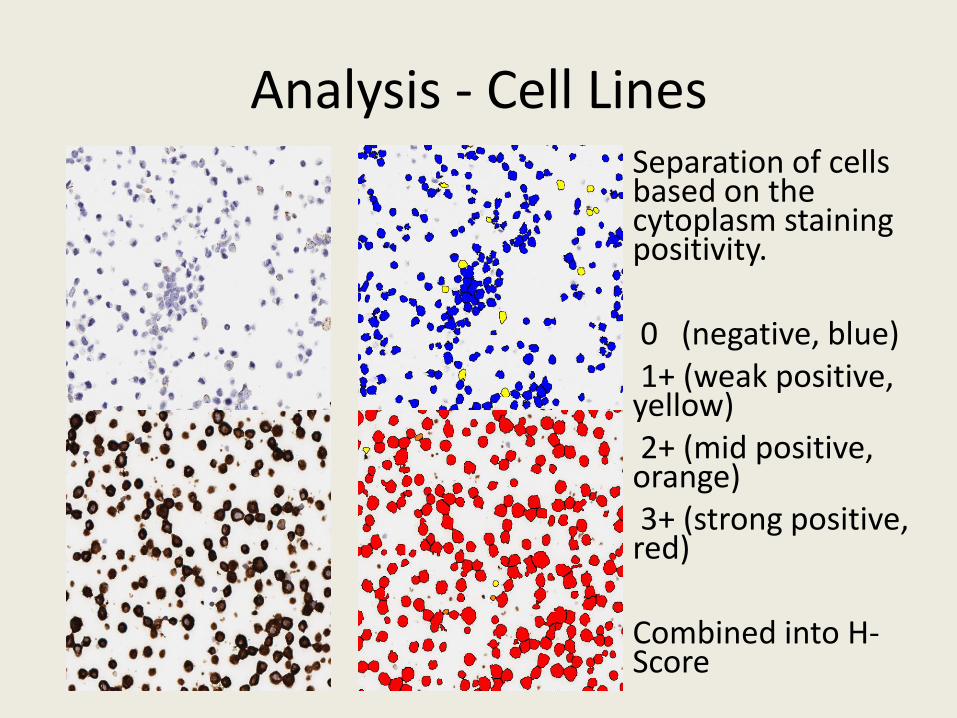
Analysis - Cell Lines Separation of cells based on the cytoplasm staining positivity. 0 (negative, blue) 1+ (weak positive, yellow) 2+ (mid positive, orange) 3+ (strong positive, red) Combined into H-Score
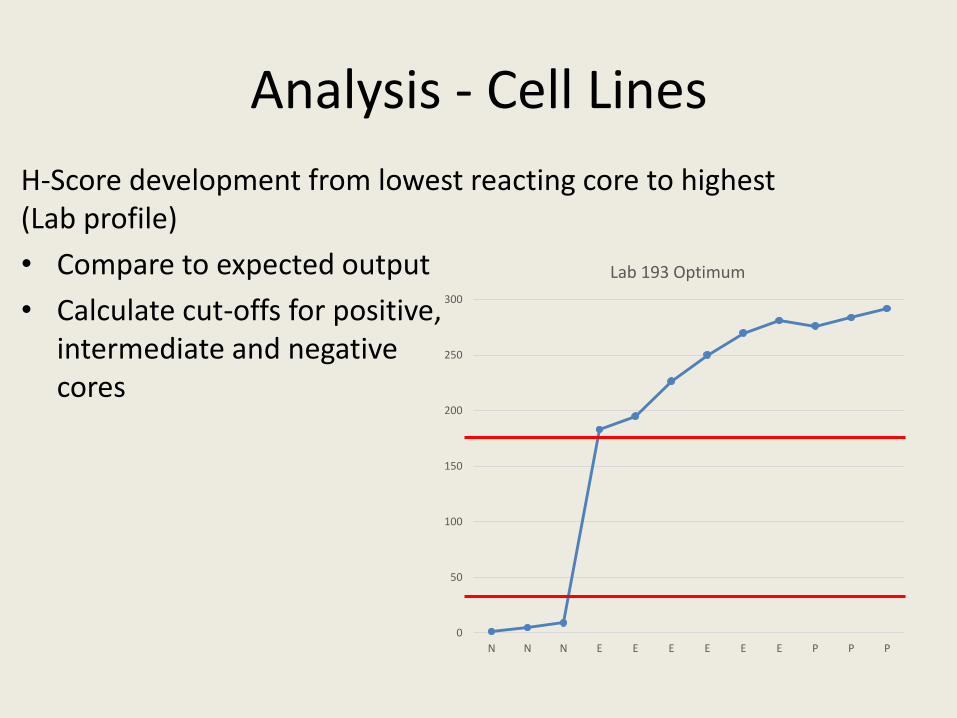
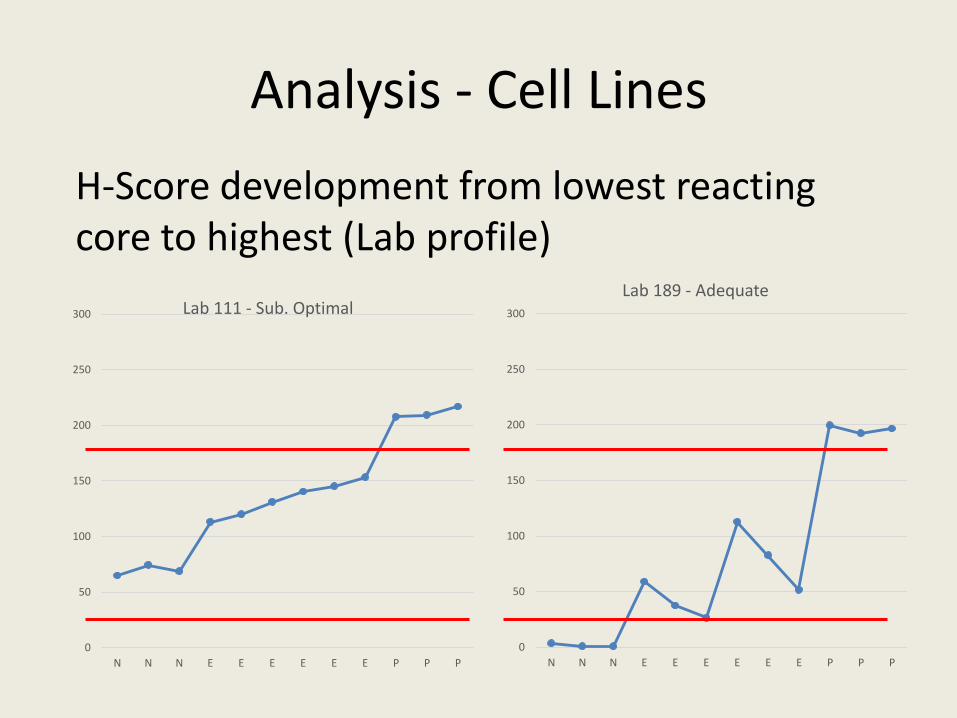
Analysis - Cell Lines
H-Score development from lowest reacting core to highest (Lab profile)
• Compare to expected output
• Calculate cut-offs for positive, intermediate and negative cores
0
50
100
150
200
250
300
N N N E E E E E E P P P
Lab 193 Optimum
Analysis - Cell Lines
H-Score development from lowest reacting core to highest (Lab profile)
0
50
100
150
200
250
300
N N N E E E E E E P P P
Lab 111 - Sub. Optimal
0
50
100
150
200
250
300
N N N E E E E E E P P P
Lab 189 - Adequate
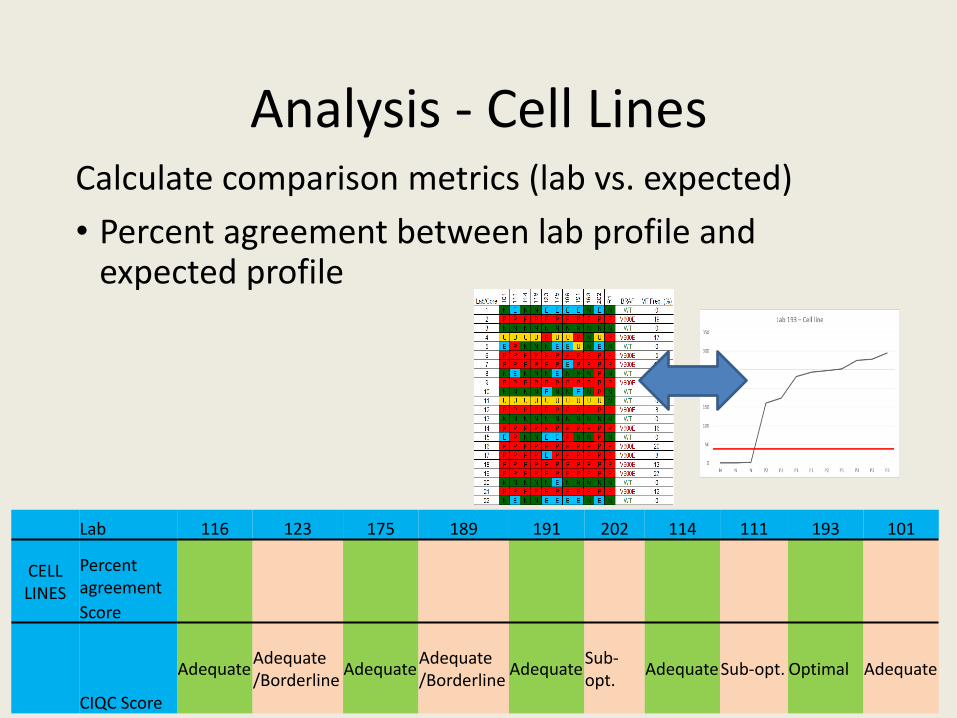
Analysis - Cell Lines Calculate comparison metrics (lab vs. expected)
• Percent agreement between lab profile and expected profile
Lab 116 123 175 189 191 202 114 111 193 101
CELL LINES
Percent agreement
50% 42% 83% 50% 50% 33% 42% 25% 100%
Score
CIQC Score
Adequate Adequate /Borderline
Adequate Adequate /Borderline
Adequate Sub-opt.
Adequate Sub-opt. Optimal Adequate
Analysis - Cell Lines Calculate comparison metrics (lab vs. expected)
• Percent agreement between lab profile and expected profile
• Calculate cut-off for lab agreement
Lab 116 123 175 189 191 202 114 111 193 101
CELL LINES
Percent agreement
50% 42% 83% 50% 50% 33% 42% 25% 100%
Score
CIQC Score Adequate
Adequate (Bordeline)
Adequate Adequate (Bordeline)
Adequate Sub-opt.
Adequate Sub-opt. Optimal Adequate
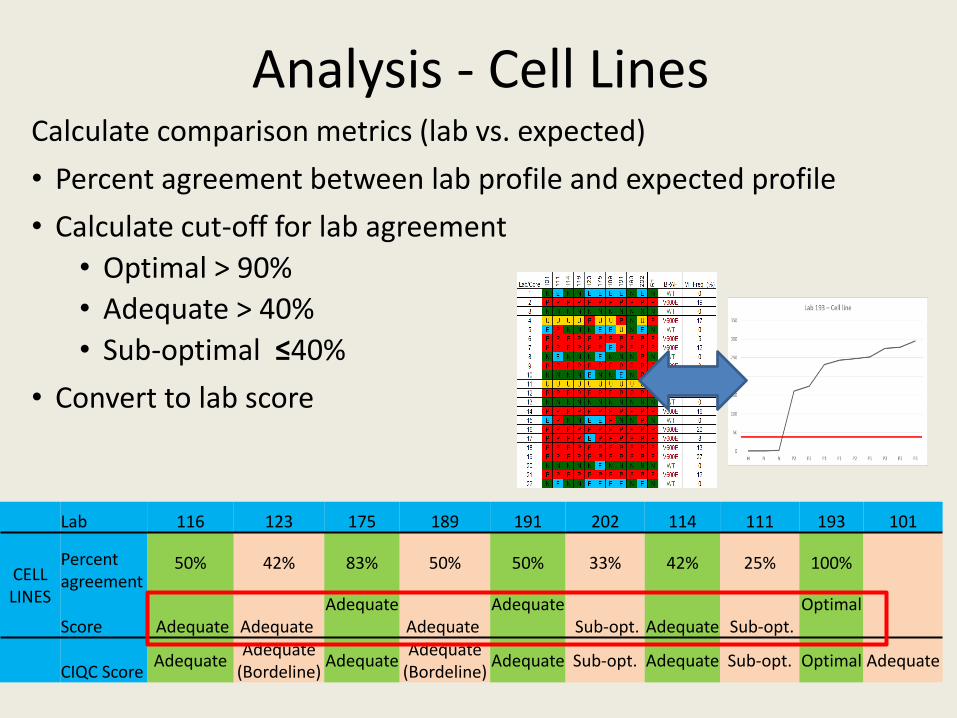
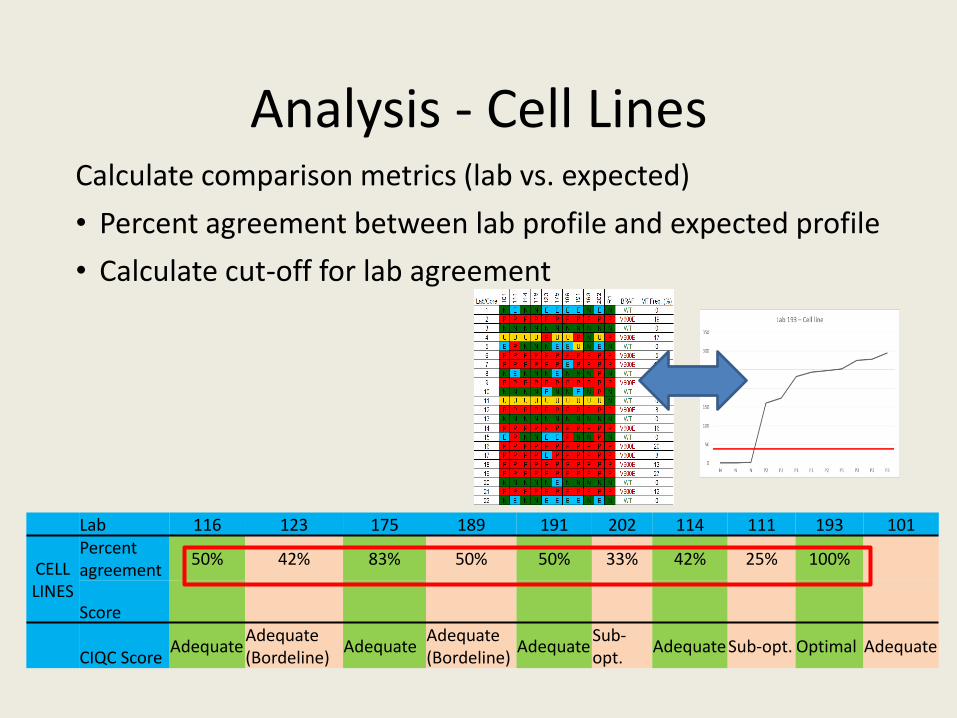
Analysis - Cell Lines Calculate comparison metrics (lab vs. expected)
• Percent agreement between lab profile and expected profile
• Calculate cut-off for lab agreement
• Optimal > 90%
• Adequate > 40%
• Sub-optimal ≤40%
• Convert to lab score
Lab 116 123 175 189 191 202 114 111 193 101
CELL LINES
Percent agreement
50% 42% 83% 50% 50% 33% 42% 25% 100%
Score Adequate Adequate Adequate
Adequate Adequate
Sub-opt. Adequate Sub-opt. Optimal
CIQC Score Adequate
Adequate (Bordeline)
Adequate Adequate
(Bordeline) Adequate Sub-opt. Adequate Sub-opt. Optimal Adequate
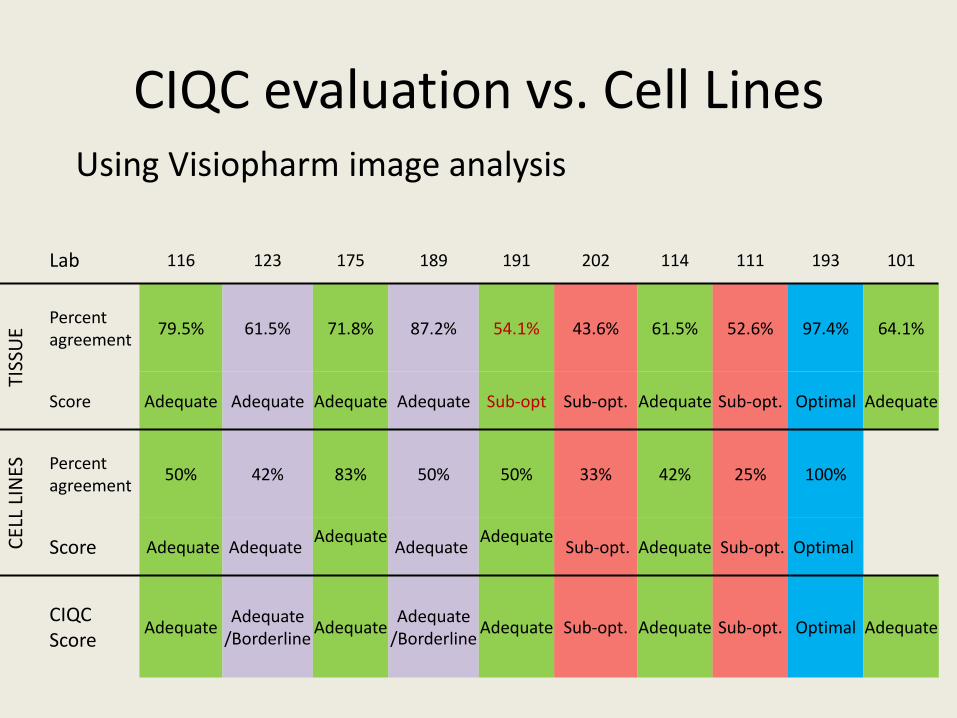
CIQC evaluation vs. Cell Lines
Lab 116 123 175 189 191 202 114 111 193 101
TISS
UE
Percent agreement
79.5% 61.5% 71.8% 87.2% 54.1% 43.6% 61.5% 52.6% 97.4% 64.1%
Score Adequate Adequate Adequate Adequate Sub-opt Sub-opt. Adequate Sub-opt. Optimal Adequate
CEL
L LI
NES
Percent agreement
50% 42% 83% 50% 50% 33% 42% 25% 100%
Score Adequate Adequate Adequate
Adequate
Adequate
Sub-opt. Adequate Sub-opt. Optimal
CIQC Score
Adequate Adequate
/Borderline Adequate
Adequate /Borderline
Adequate Sub-opt. Adequate Sub-opt. Optimal Adequate
Using Visiopharm image analysis
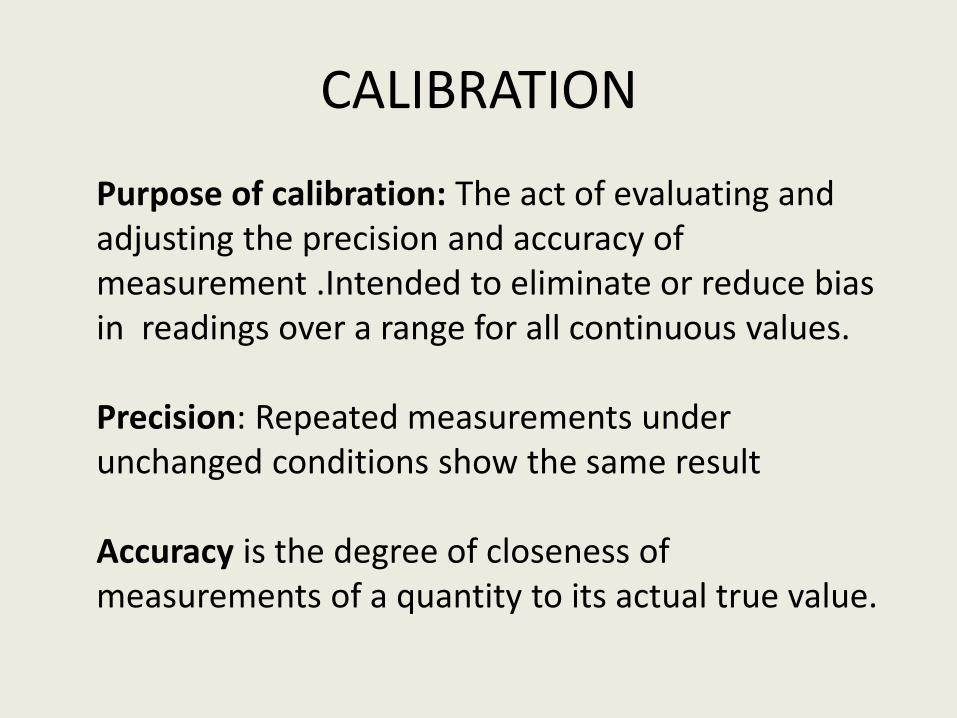
CALIBRATION
Purpose of calibration: The act of evaluating and adjusting the precision and accuracy of measurement .Intended to eliminate or reduce bias in readings over a range for all continuous values. Precision: Repeated measurements under unchanged conditions show the same result Accuracy is the degree of closeness of measurements of a quantity to its actual true value.
Research Use Only
62
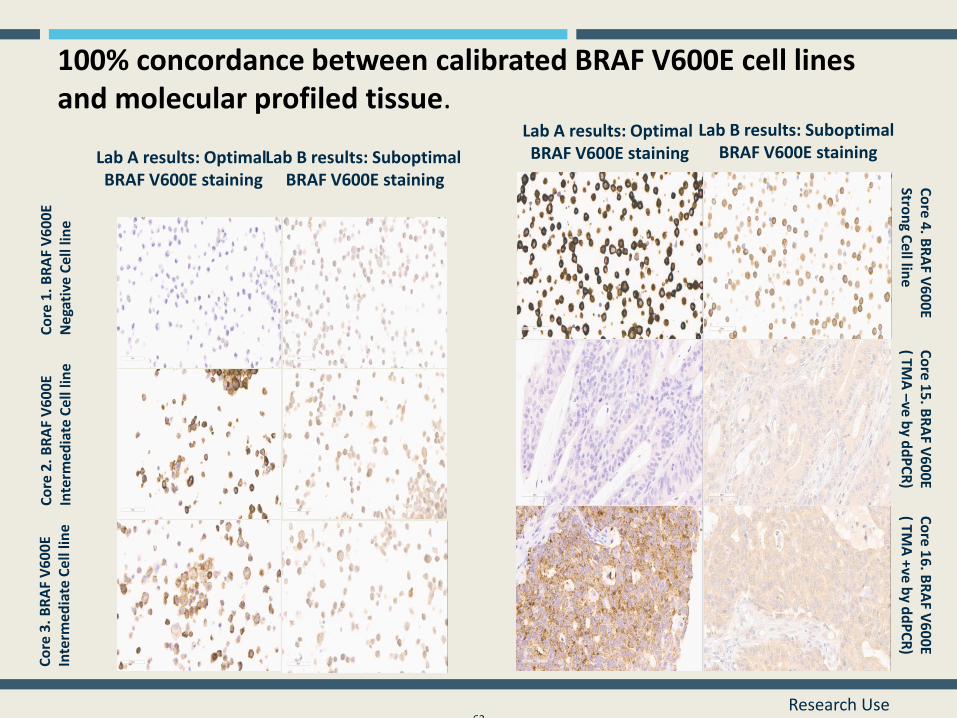
100% concordance between calibrated BRAF V600E cell lines and molecular profiled tissue.
Lab A results: Optimal BRAF V600E staining
Co
re 1
. B
RA
F V
60
0E
N
ega
tive
Ce
ll lin
e
Co
re 4. B
RA
F V6
00
E Stro
ng C
ell lin
e
Co
re 15
. BR
AF V
60
0E
( TM
A –ve b
y dd
PC
R)
Lab B results: Suboptimal BRAF V600E staining
Co
re 2
. B
RA
F V
60
0E
In
term
edia
te C
ell
line
Co
re 3
. B
RA
F V
60
0E
In
term
edia
te C
ell
line
Co
re 16
. BR
AF V
60
0E
( TMA
+ve b
y dd
PC
R)
Lab A results: Optimal BRAF V600E staining
Lab B results: Suboptimal BRAF V600E staining
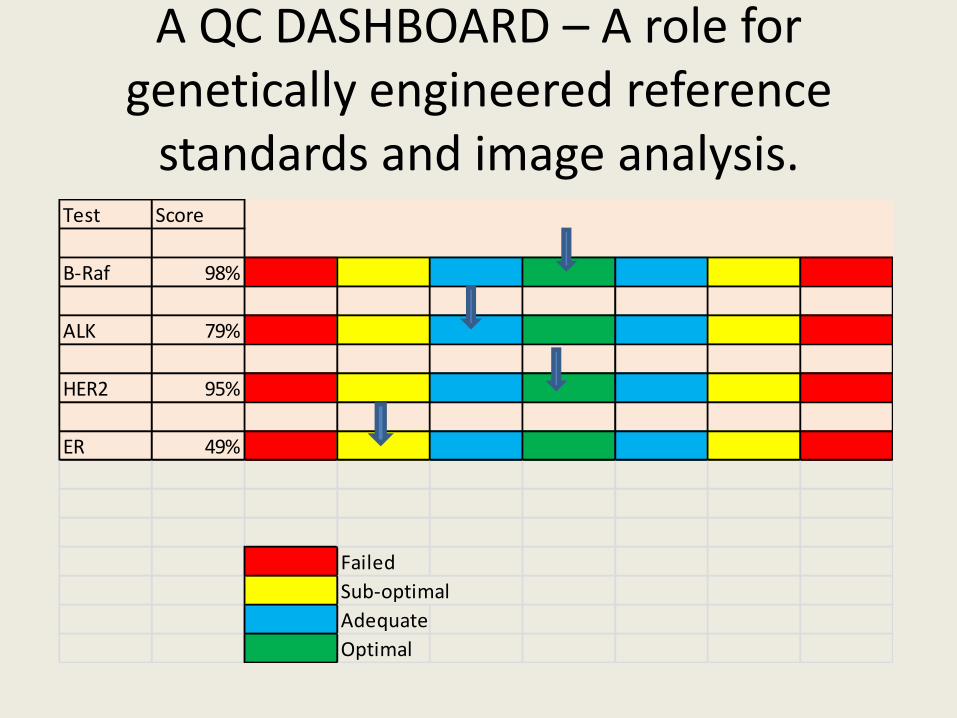
A QC DASHBOARD – A role for genetically engineered reference
standards and image analysis. Test Score
B-Raf 98%
ALK 79%
HER2 95%
ER 49%
Failed
Sub-optimal
Adequate
Optimal

A QC DASHBOARD – A role for genetically engineered reference
standards and image analysis.
B-Raf v600e Analysis
Deanna Johnson, Lions Gate Hospital
Farah Patell-Socha, Horizon
Martin Kristensson, Visiopharm
Roza Bidshahri, UBC
Katerina Dvorak, Ventana Medical Systems


E Torlakovic MD, B Gilks MD, J Won PhD and J Garratt RT
Department of Pathology, Vancouver General Hospital, Vancouver,
BC, Canada
Department of Pathology and Laboratory Medicine, University of
British Columbia, Canada.
Canadian Immunohistochemistry Quality Control (CIQC) and
Canadian Association of Pathologists, Canada. Department of Laboratory Medicine and Pathobiology, University of
Toronto, Canada
The Canadian External Quality Assurance Program for Immunohistochemistry: an initiative of Canadian
Immunohistochemistry Quality Control (cIQc) and Canadian Association of Pathologists (CAP) National Standards
Committee/Immunohistochemistry