Embed Size (px)
Citation preview

1
Corporate Presentation
August, 2013

History and Business Model
3
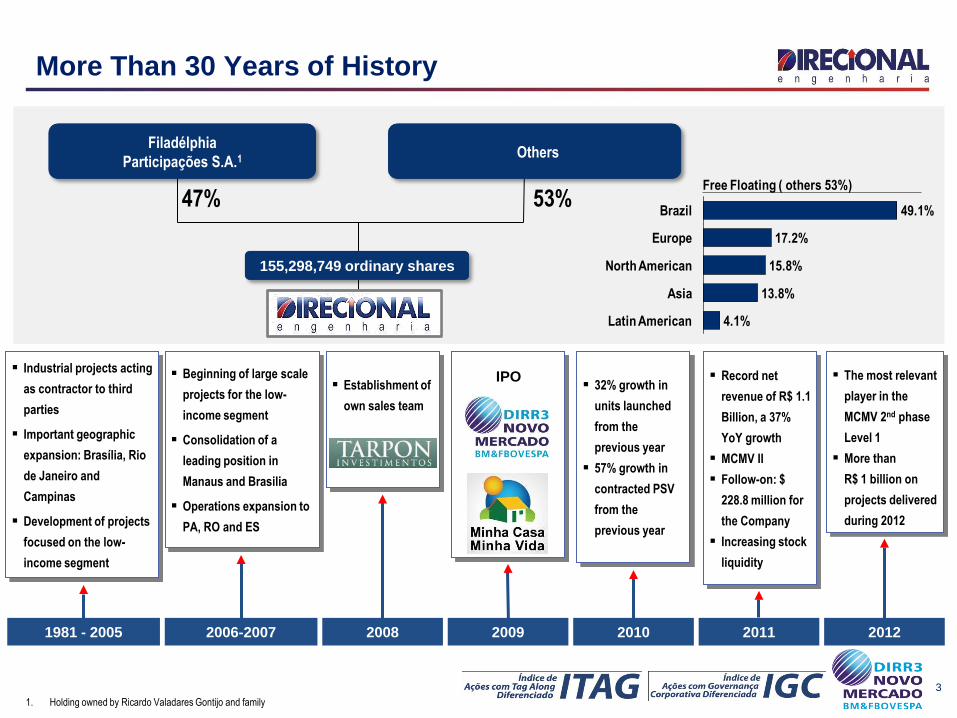
More Than 30 Years of History
47%
Filadélphia
Participações S.A.1 Others
53%
155,298,749 ordinary shares
1. Holding owned by Ricardo Valadares Gontijo and family
Industrial projects acting
as contractor to third
parties
Important geographic
expansion: Brasília, Rio
de Janeiro and
Campinas
Development of projects
focused on the low-
income segment
Beginning of large scale
projects for the low-
income segment
Consolidation of a
leading position in
Manaus and Brasilia
Operations expansion to
PA, RO and ES
IPO 32% growth in
units launched
from the
previous year
57% growth in
contracted PSV
from the
previous year
Establishment of
own sales team
1981 - 2005 2006-2007 2008 2009 2010 2011
Record net
revenue of R$ 1.1
Billion, a 37%
YoY growth
MCMV II
Follow-on: $
228.8 million for
the Company
Increasing stock
liquidity
The most relevant
player in the
MCMV 2nd phase
Level 1
More than
R$ 1 billion on
projects delivered
during 2012
2012
Latin American
Asia 13.8%
North American
4.1%
Europe
15.8%
Brazil
17.2%
49.1%
Free Floating ( others 53%)
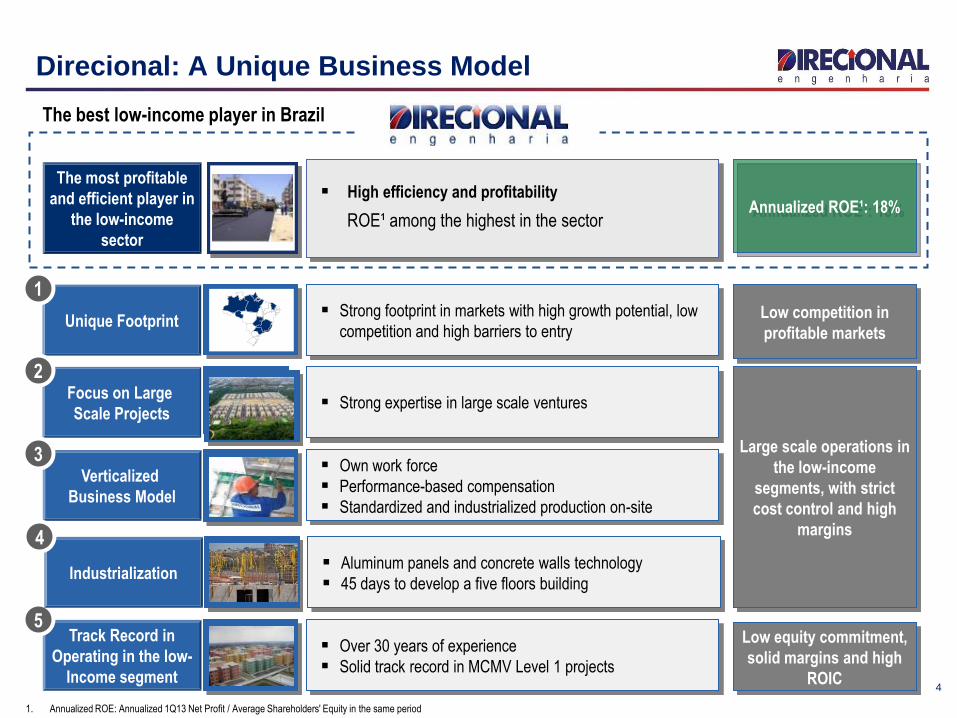
Unique Footprint Strong footprint in markets with high growth potential, low
competition and high barriers to entry Low competition in
profitable markets
Track Record in
Operating in the low-
Income segment
Over 30 years of experience
Solid track record in MCMV Level 1 projects
Low equity commitment,
solid margins and high
ROIC
Focus on Large
Scale Projects
Verticalized
Business Model
Strong expertise in large scale ventures
Own work force
Performance-based compensation
Standardized and industrialized production on-site
Large scale operations in
the low-income
segments, with strict
cost control and high
margins
4
Direcional: A Unique Business Model
The most profitable
and efficient player in
the low-income
sector
‘’’’
High efficiency and profitability
ROE¹ among the highest in the sector
1
2
3
5
Annualized ROE¹: 18%
1. Annualized ROE: Annualized 1Q13 Net Profit / Average Shareholders' Equity in the same period
The best low-income player in Brazil
Industrialization Aluminum panels and concrete walls technology
45 days to develop a five floors building
4
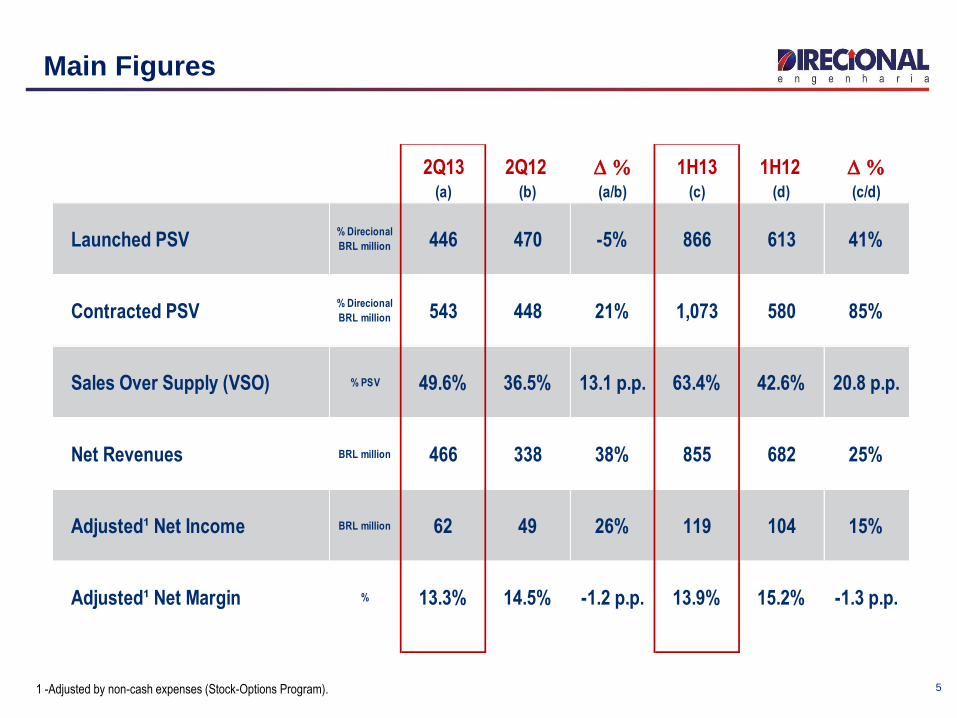
Main Figures
5 1 -Adjusted by non-cash expenses (Stock-Options Program).
2Q13 2Q12 D % 1H13 1H12 D %(a) (b) (a/b) (c) (d) (c/d)
Launched PSV% Direcional
BRL million 446 470 -5% 866 613 41%
Contracted PSV% Direcional
BRL million 543 448 21% 1,073 580 85%
Sales Over Supply (VSO) % PSV 49.6% 36.5% 13.1 p.p. 63.4% 42.6% 20.8 p.p.
Net Revenues BRL million 466 338 38% 855 682 25%
Adjusted¹ Net Income BRL million 62 49 26% 119 104 15%
Adjusted¹ Net Margin % 13.3% 14.5% -1.2 p.p. 13.9% 15.2% -1.3 p.p.
6
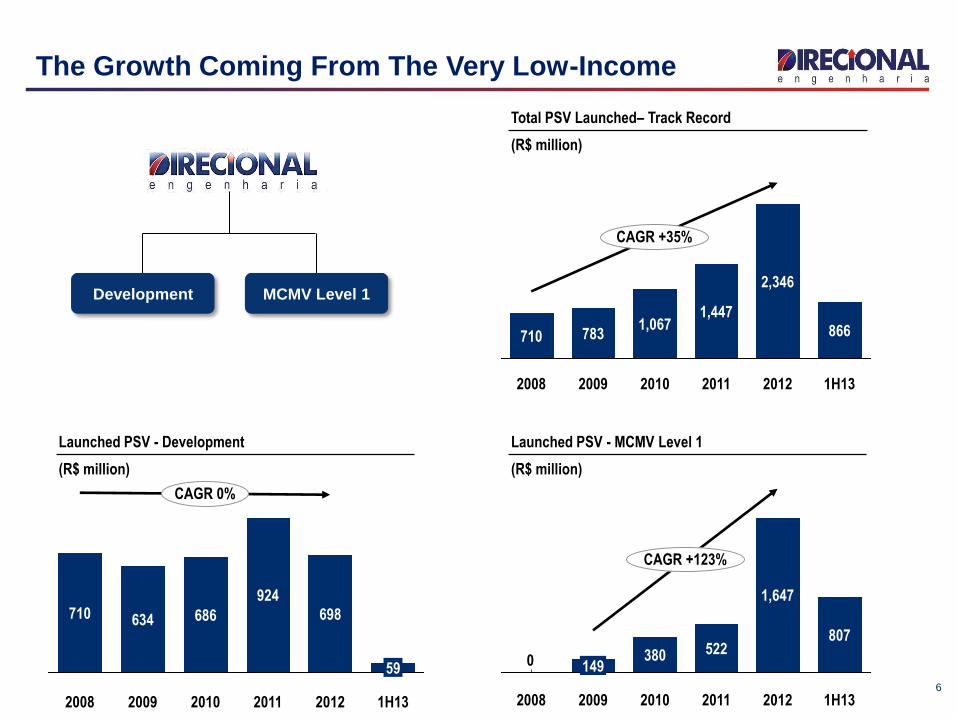
The Growth Coming From The Very Low-Income
Total PSV Launched– Track Record
(R$ million)
CAGR +35%
1H13
866
2012
2,346
2011
1,447
2010
1,067
2009
783
2008
710
Development MCMV Level 1
Launched PSV - MCMV Level 1
(R$ million)
686
2009
634
2008
710
CAGR 0%
1H13
59
2012
698
2011
924
2010
Launched PSV - Development
(R$ million)
0 380
CAGR +123%
1H13
807
2012
1,647
2011
522
2010 2009
149
2008
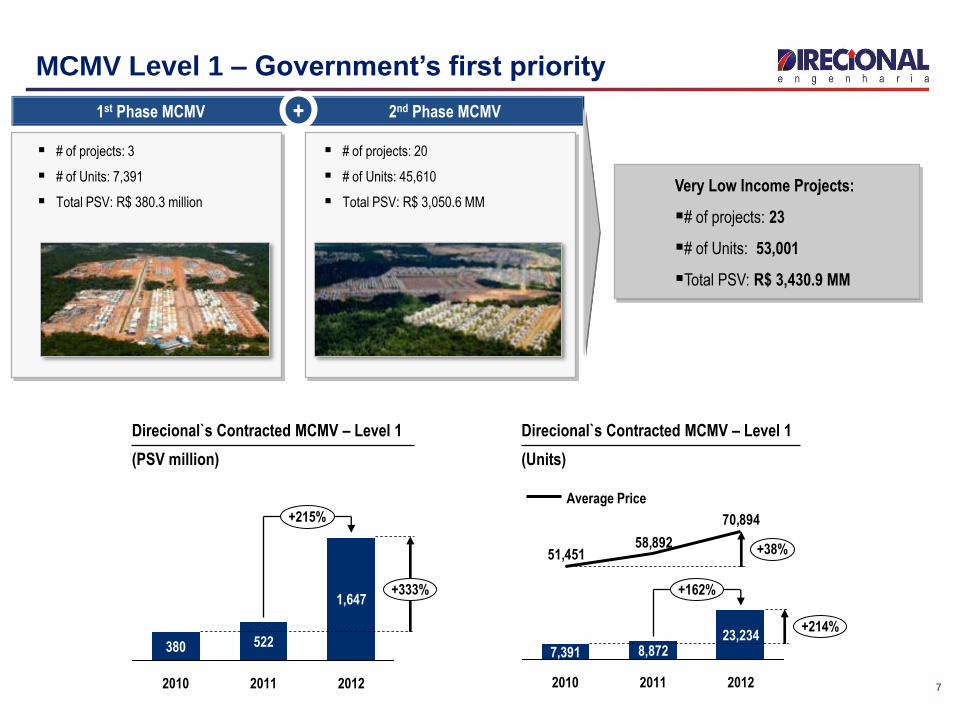
Very Low Income Projects:
# of projects: 23
# of Units: 53,001
Total PSV: R$ 3,430.9 MM
7
MCMV Level 1 – Government’s first priority
1st Phase MCMV 2nd Phase MCMV
# of projects: 3
# of Units: 7,391
Total PSV: R$ 380.3 million
# of projects: 20
# of Units: 45,610
Total PSV: R$ 3,050.6 MM
+
Direcional`s Contracted MCMV – Level 1
(PSV million)
Direcional`s Contracted MCMV – Level 1
(Units)
+215%
+333%
2012 2011
1,647
522
2010
380
70,894
58,89251,451
2010
7,391
+214%
+162%
+38%
2012
23,234
2011
8,872
Average Price
8
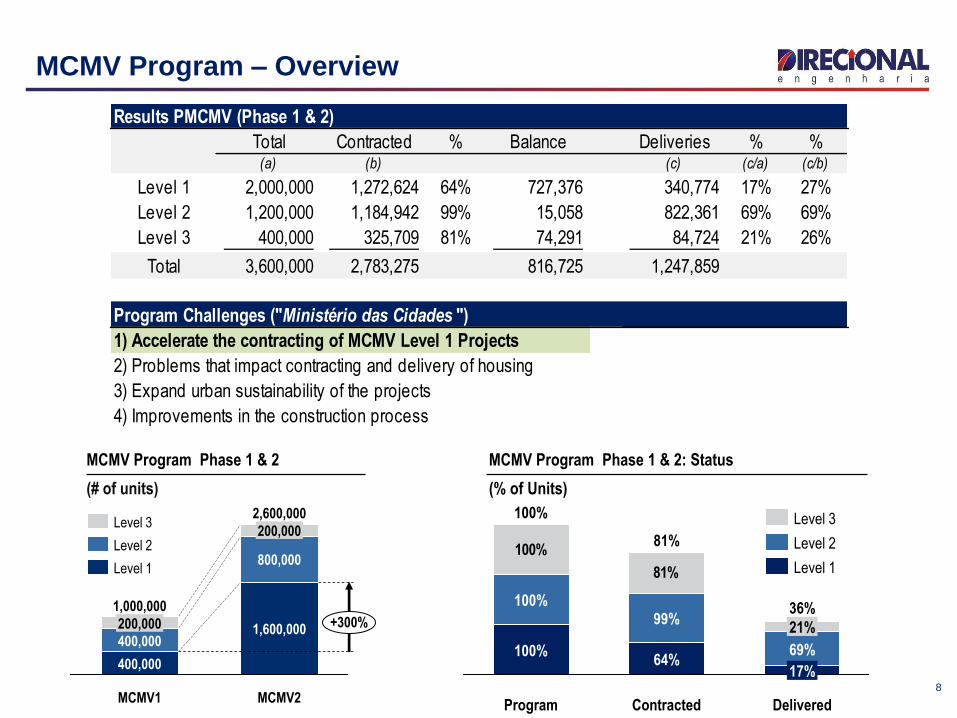
100%
81%
Delivered
36%
17%
69%
21%
Contracted
81%
64%
99%
Program
100%
100%
100%
Level 1
Level 2
Level 3
MCMV Program – Overview
2,600,000
+300%
MCMV2
1,600,000
800,000
200,000
MCMV1
1,000,000
400,000
400,000
200,000
Level 1
Level 2
Level 3
MCMV Program Phase 1 & 2
(# of units)
MCMV Program Phase 1 & 2: Status
(% of Units)
Results PMCMV (Phase 1 & 2)
Total Contracted % Balance Deliveries % %(a) (b) (c) (c/a) (c/b)
Level 1 2,000,000 1,272,624 64% 727,376 340,774 17% 27%
Level 2 1,200,000 1,184,942 99% 15,058 822,361 69% 69%
Level 3 400,000 325,709 81% 74,291 84,724 21% 26%
Total 3,600,000 2,783,275 816,725 1,247,859
Program Challenges ("Ministério das Cidades ")
1) Accelerate the contracting of MCMV Level 1 Projects
2) Problems that impact contracting and delivery of housing
3) Expand urban sustainability of the projects
4) Improvements in the construction process
9
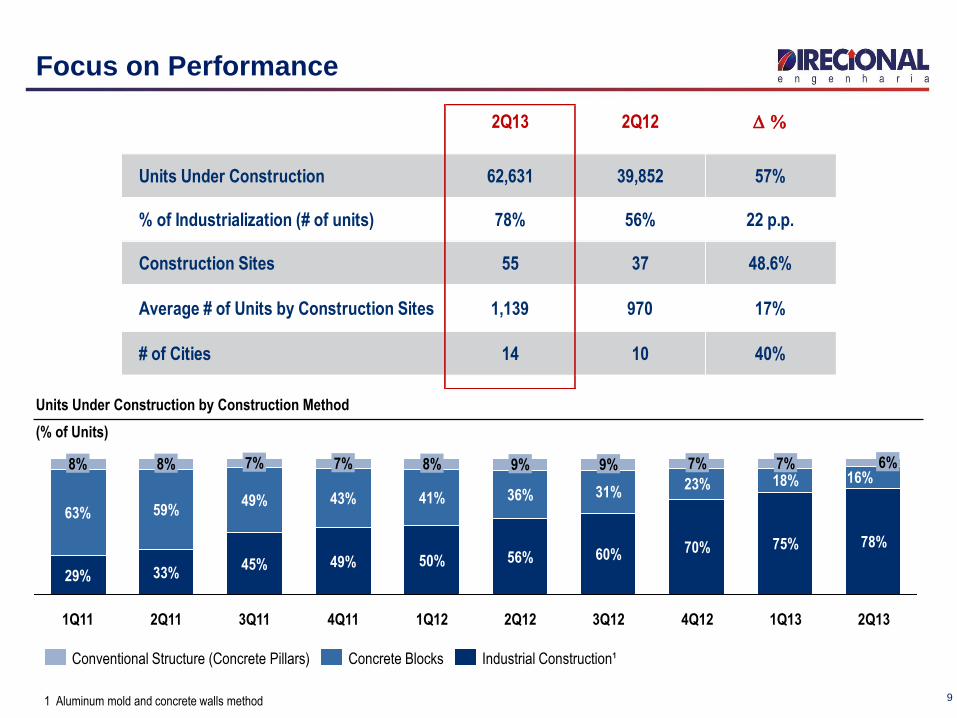
Focus on Performance
36%
9%
1Q12
50%
41%
60%
31%
9%
2Q12
56%
8%
4Q11
49%
43%
7%
3Q11
45%
49%
7%
2Q11
33%
59%
8%
1Q11
29%
63%
8%
1Q13
75%
18% 7%
4Q12
70%
23%
7%
3Q12 2Q13
6% 16%
78%
Units Under Construction by Construction Method
(% of Units)
1 Aluminum mold and concrete walls method
Industrial Construction¹ Concrete Blocks Conventional Structure (Concrete Pillars)
2Q13 2Q12 D %
Units Under Construction 62,631 39,852 57%
% of Industrialization (# of units) 78% 56% 22 p.p.
Construction Sites 55 37 48.6%
Average # of Units by Construction Sites 1,139 970 17%
# of Cities 14 10 40%
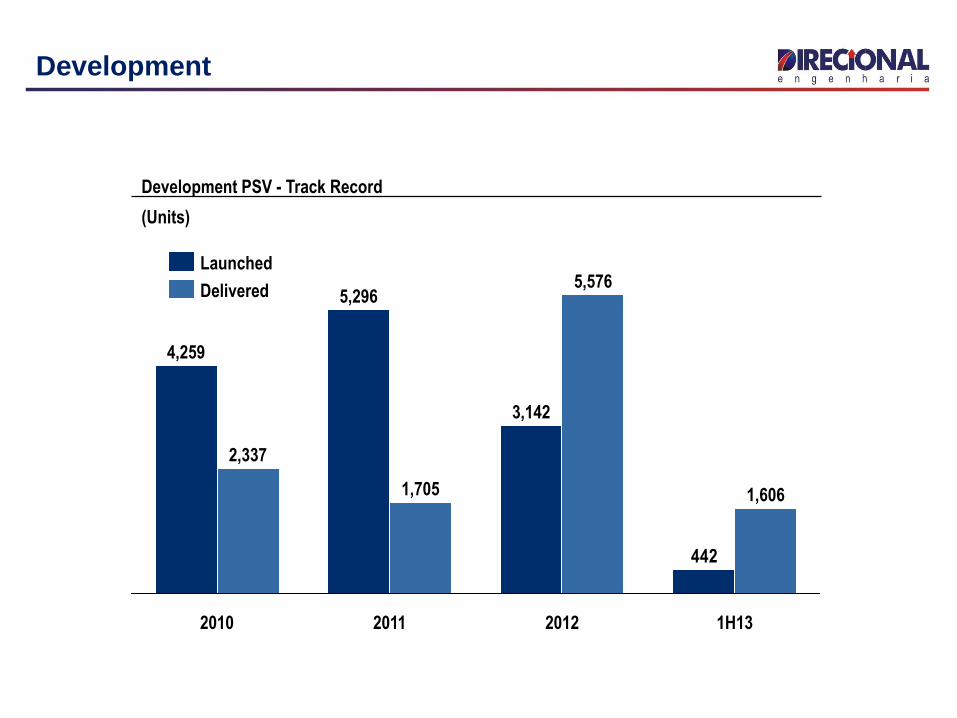
Development
Development PSV - Track Record
(Units)
442
2,337
4,259
1H13
1,606
2012
5,576
3,142
2011
1,705
5,296
2010
Delivered
Launched
Operating Highlights
11
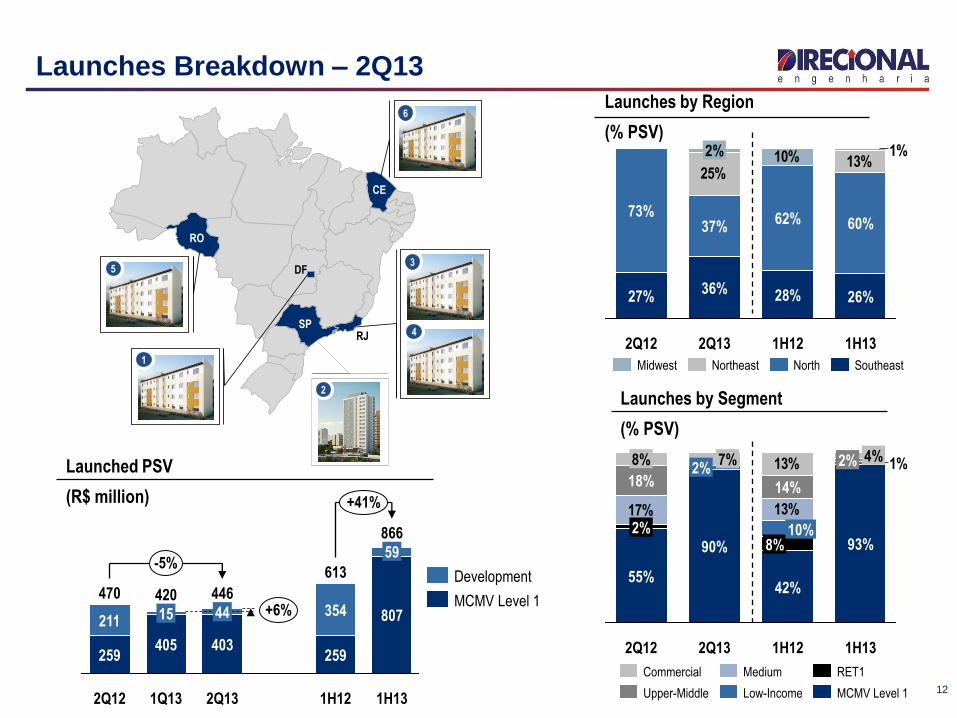
Launches Breakdown – 2Q13
12
Launches by Segment
(% PSV)
Launches by Region
(% PSV)
10% 13%25%
1%
1H13
26%
60%
1H12
28%
62%
2Q13
36%
37%
2%
2Q12
27%
73%
Southeast North Northeast Midwest
1%
13%17%
13%
1H13
93%
2% 4%
1H12
42%
8% 10%
14%
2Q13
90%
2% 7%
2Q12
55%
2%
18%
8%
MCMV Level 1
RET1
Low-Income
Medium
Upper-Middle
Commercial
Launched PSV
(R$ million)
+41%
-5%
2Q12
470
259
211
1H12
613
259
354
2Q13
446
403
44
1Q13
420
405
15 +6%
1H13
866
807
59
MCMV Level 1
Development
RO
RJSP
4
DF
CE
35
6
1
2
13
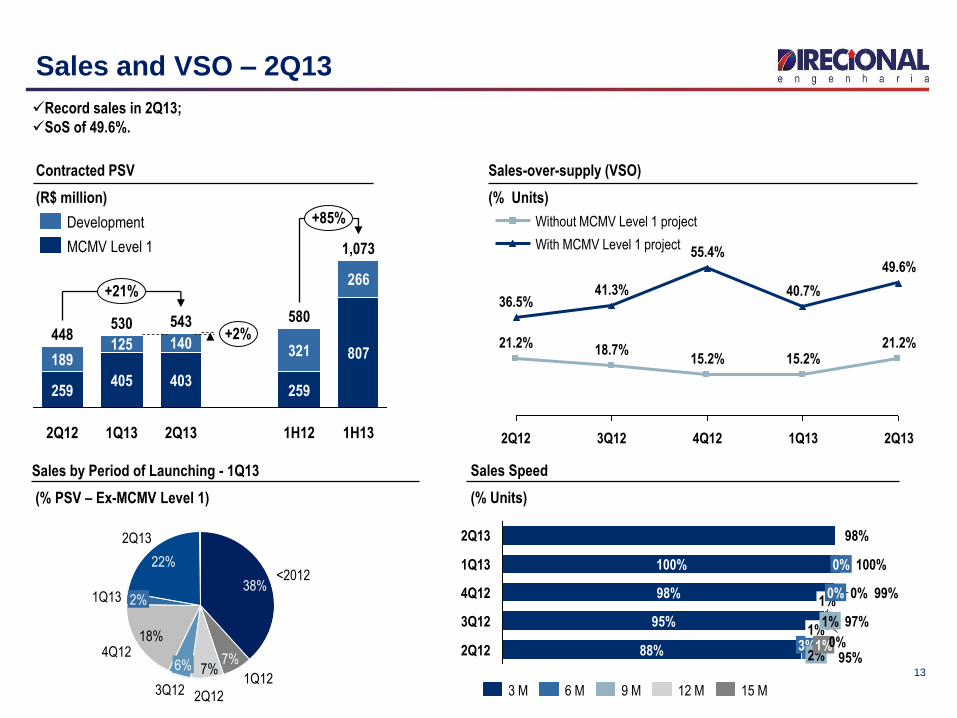
Sales and VSO – 2Q13
2Q13
49.6%
21.2%
1Q13
40.7%
15.2%
4Q12
55.4%
15.2%
3Q12
41.3%
18.7%
2Q12
36.5%
21.2%
With MCMV Level 1 project
Without MCMV Level 1 project
2Q12 95%
88% 3% 2%
1% 1%
3Q12 97% 95%
1%
1%
0%
4Q12 99% 98% 0% 0%
1Q13 100% 100% 0%
2Q13 98%
3 M 6 M 9 M 12 M 15 M
Sales by Period of Launching - 1Q13
(% PSV – Ex-MCMV Level 1)
7%
2Q13
22%
1Q13 2%
4Q12 18%
3Q12
6%
2Q12
1Q12
7%
<2012 38%
Contracted PSV
(R$ million)
Sales-over-supply (VSO)
(% Units)
Sales Speed
(% Units)
Record sales in 2Q13;
SoS of 49.6%.
543
403
140
1Q13
530
405
125
2Q12
448
259
807
266
1H12
580
259
+85%
+21%
+2%
1H13
1,073
321
2Q13
189
MCMV Level 1
Development

14
Land Bank
58,5% are large scale projects (over 1,000 units)
76,6% are eligible for the MCMV Program
77,4% were acquired by physical or financial Swap
Average acquisition price of 9,5% over PSV
R$ 6.6 Billion
60,702 units
Land Bank by Segment
(% PSV)
Land Bank Track Record in 1Q13
(R$ million in PSV)
293159 6,549 -101
2Q13 Launches
33
Review of
Assumptions
Acquired
Land Bank
1Q13
6,448
Land Bank by Region
(% PSV)
Type of Payment
(1Q13 – % PSV)
58.9% Cash 41.1% Swap
RET
6%
Low-Income
39%
Upper-Middle 12%
Medium 39%
Commercial 4%
ES2%
AM15%
MG42%
RO2%
SP8%
PA9%
DF21%
GO1%
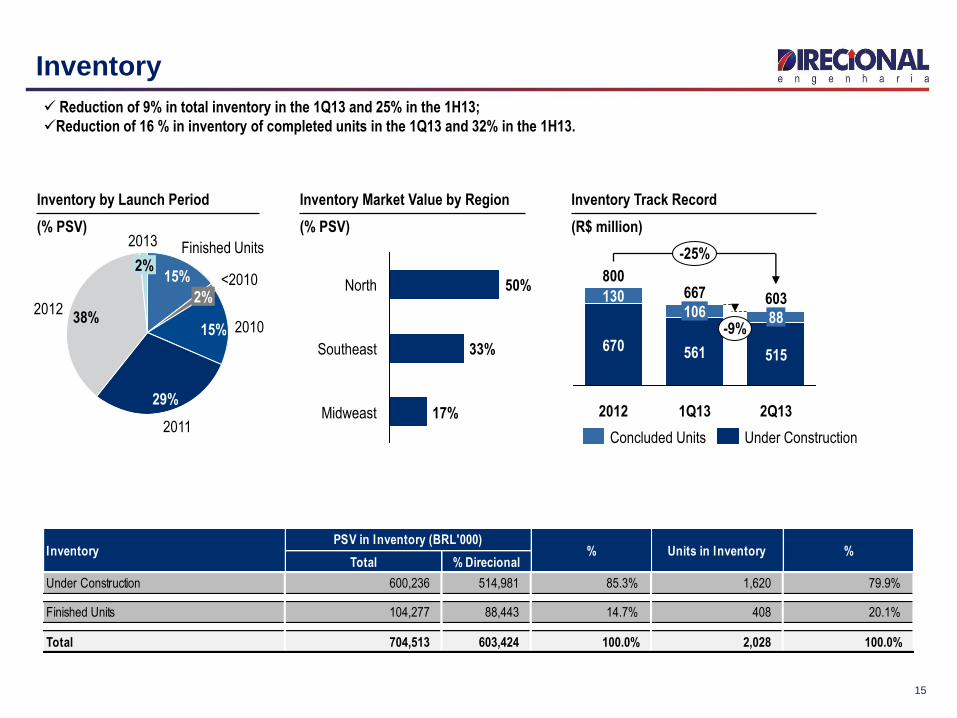
15
Inventory
Reduction of 9% in total inventory in the 1Q13 and 25% in the 1H13;
Reduction of 16 % in inventory of completed units in the 1Q13 and 32% in the 1H13.
2013
2%
2012 38%
2011
29%
2010 15%
<2010 2%
Finished Units
15%
Midweast 17%
Southeast 33%
North 50% 603
-9%
-25%
2Q13
515
88
1Q13
667
561
106
2012
800
670
130
Under Construction Concluded Units
Inventory Market Value by Region
(% PSV)
Inventory by Launch Period
(% PSV)
Inventory Track Record
(R$ million)
Total % Direcional
Under Construction 600,236 514,981 85.3% 1,620 79.9%
Finished Units 104,277 88,443 14.7% 408 20.1%
Total 704,513 603,424 100.0% 2,028 100.0%
InventoryPSV in Inventory (BRL'000)
% Units in Inventory %

Financial Highlights
16
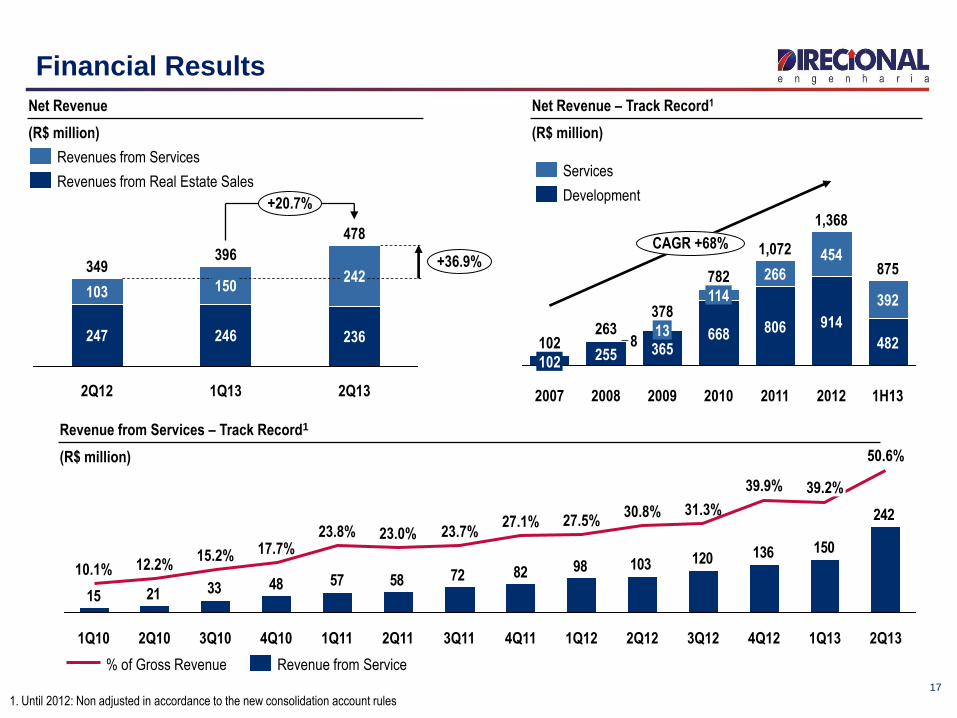
17
Financial Results
478
+36.9%
+20.7%
2Q13
236
242
1Q13
396
246
150
2Q12
349
247
103
Net Revenue
(R$ million)
8
CAGR +68%
1H13
875
482
392
2012
1,368
914
454
2011
1,072
806
266
2010
782
668
114
2009
378
365 13
2008
263
255
2007
102
102
Net Revenue – Track Record1
(R$ million)
Development
Services
Revenue from Services – Track Record1
(R$ million)
242
150136120103988272585748332115
2Q13
50.6%
1Q13
39.2%
4Q12
39.9%
3Q12
31.3%
2Q12
30.8%
1Q12
27.5%
4Q11
27.1%
3Q11
23.7%
2Q11
23.0%
1Q11
23.8%
4Q10
17.7%
3Q10
15.2%
2Q10
12.2%
1Q10
10.1%
Revenue from Service % of Gross Revenue
Revenues from Real Estate Sales
Revenues from Services
1. Until 2012: Non adjusted in accordance to the new consolidation account rules
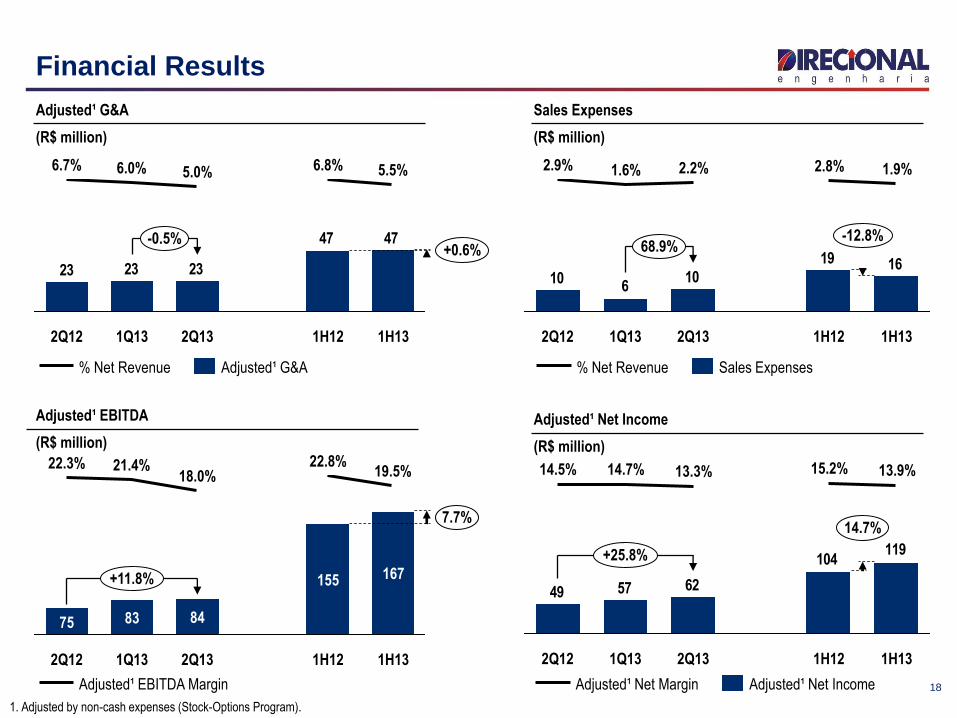
18
Financial Results
1. Adjusted by non-cash expenses (Stock-Options Program).
Adjusted¹ G&A
(R$ million)
Sales Expenses
(R$ million)
4747
232323
-0.5% +0.6%
1H13
5.5%
1H12
6.8%
2Q13
5.0%
1Q13
6.0%
2Q12
6.7%
1619
106
10
68.9% -12.8%
1H13
1.9%
1H12
2.8%
2Q13
2.2%
1Q13
1.6%
2Q12
2.9%
Sales Expenses % Net Revenue Adjusted¹ G&A % Net Revenue
+11.8%
7.7%
1H13
167
19.5%
1H12
155
22.8%
2Q13
84
18.0%
1Q13
83
21.4%
2Q12
75
22.3%
Adjusted¹ EBITDA Margin
Adjusted¹ EBITDA
(R$ million)
119104
625749
14.7%
1H13
13.9%
1H12
15.2%
2Q13
13.3%
1Q13
14.7%
2Q12
14.5%
+25.8%
Adjusted¹ Net Income
(R$ million)
Adjusted¹ Net Income Adjusted¹ Net Margin
19
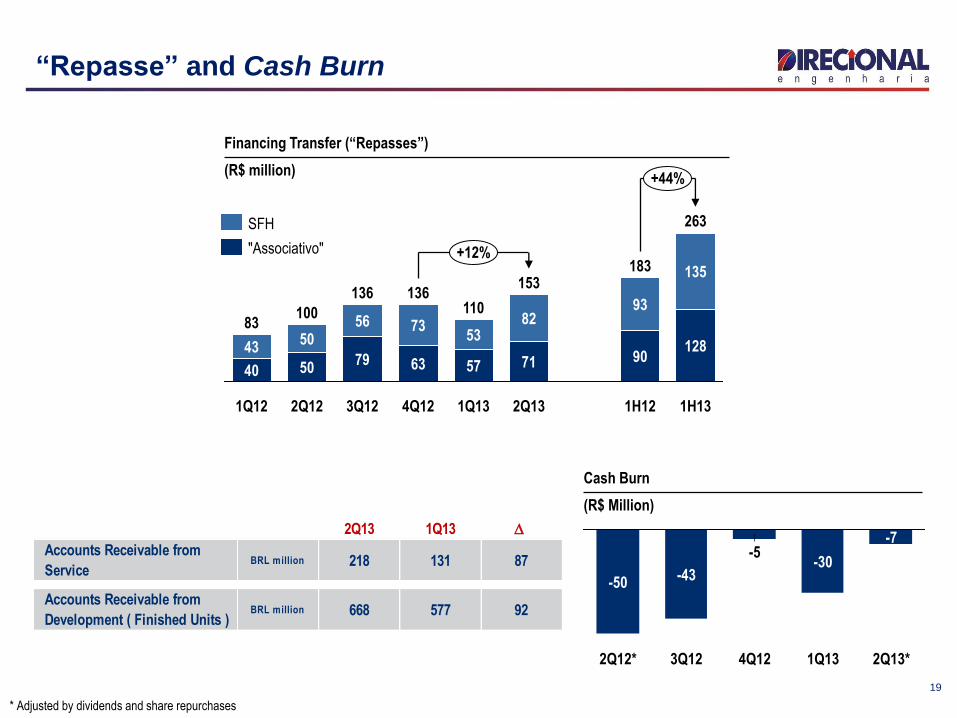
“Repasse” and Cash Burn
Financing Transfer (“Repasses”)
(R$ million)
57
53
4Q12
136
63
73
3Q12
136
79
56
2Q12
100
50
93
1Q12
83
40
43
2Q13
153
71
82
1Q13
110
+12%
+44%
1H13
263
128
135
1H12
183
90 50
"Associativo"
SFH
-7
2Q13* 1Q13
-30
4Q12
-5
3Q12
-43
2Q12*
-50
Cash Burn
(R$ Million)
* Adjusted by dividends and share repurchases
2Q13 1Q13 D
Accounts Receivable from
ServiceBRL million 218 131 87
Accounts Receivable from
Development ( Finished Units )BRL million 668 577 92
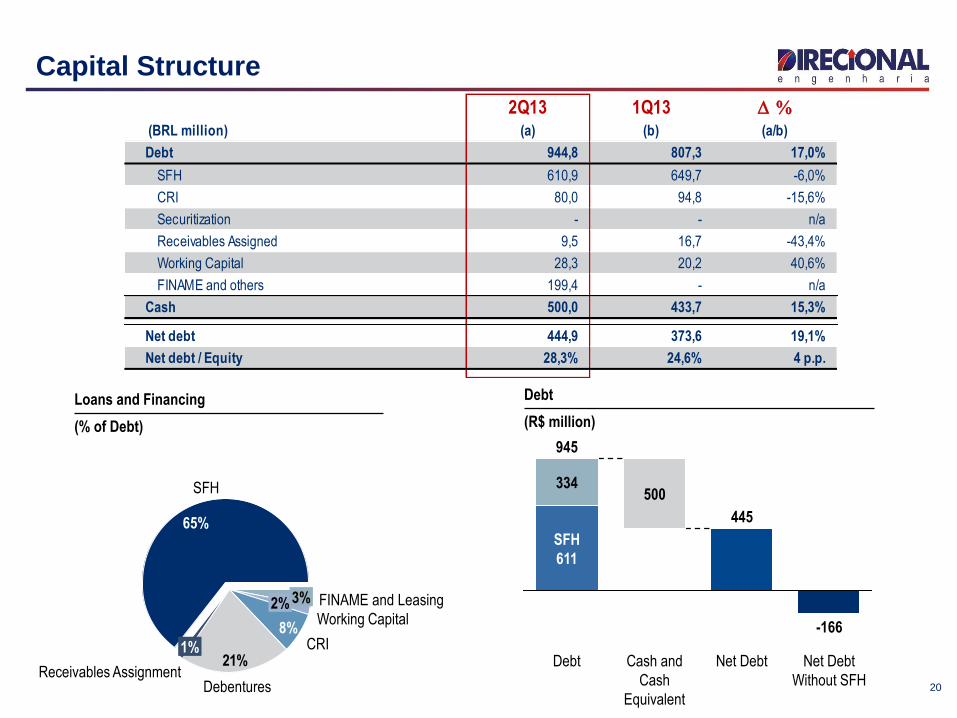
2Q13 1Q13 D %
(BRL million) (a) (b) (a/b)
Debt 944,8 807,3 17,0%
SFH 610,9 649,7 -6,0%
CRI 80,0 94,8 -15,6%
Securitization - - n/a
Receivables Assigned 9,5 16,7 -43,4%
Working Capital 28,3 20,2 40,6%
FINAME and others 199,4 - n/a
Cash 500,0 433,7 15,3%
Net debt 444,9 373,6 19,1%
Net debt / Equity 28,3% 24,6% 4 p.p.
20
Capital Structure
Net Debt
Without SFH
-166
Net Debt
445
Cash and
Cash
Equivalent
500
Debt
945
SFH
611
334
Debt
(R$ million)
21%Receivables Assignment
1%
Debentures
CRI 8%
Working Capital 2% FINAME and Leasing 3%
SFH
65%
Loans and Financing
(% of Debt)
21
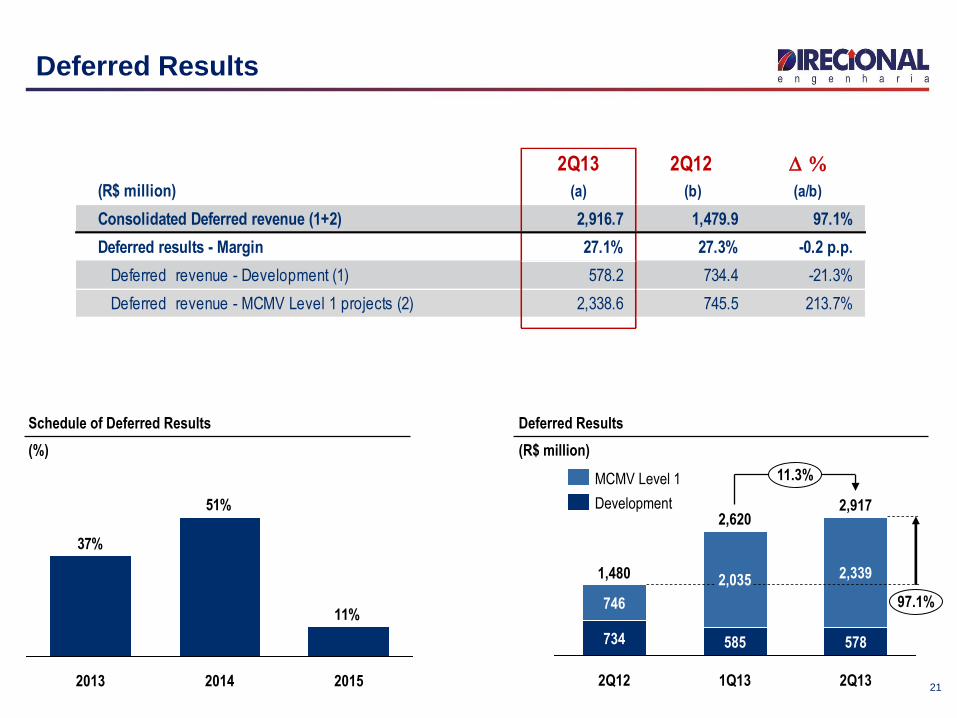
Deferred Results
Schedule of Deferred Results
(%)
11%
51%
37%
2013 2015 2014
Deferred Results
(R$ million)
2,917
97.1%
11.3%
2Q13
578
2,339
1Q13
2,620
585
2,035
2Q12
1,480
734
746
Development
MCMV Level 1
2Q13 2Q12 D %
(R$ million) (a) (b) (a/b)
Consolidated Deferred revenue (1+2) 2,916.7 1,479.9 97.1%
Deferred results - Margin 27.1% 27.3% -0.2 p.p.
Deferred revenue - Development (1) 578.2 734.4 -21.3%
Deferred revenue - MCMV Level 1 projects (2) 2,338.6 745.5 213.7%
22
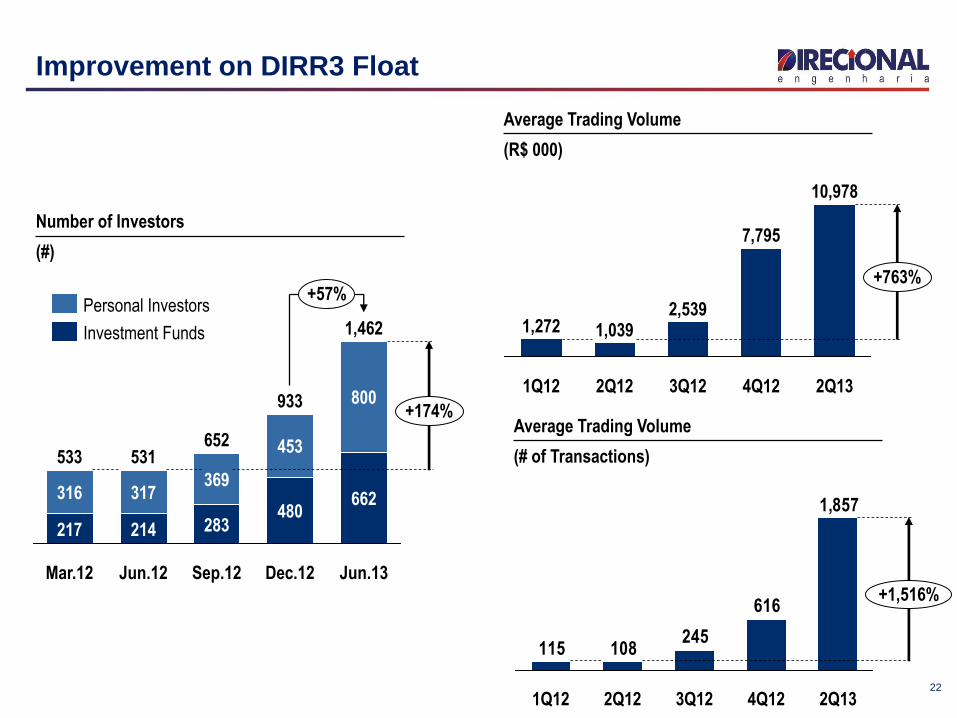
Improvement on DIRR3 Float
Number of Investors
(#)
+57%
1,462
+174%
Jun.13
662
800
Dec.12
933
480
453
Sep.12
652
283
369
Jun.12
531
214
317
Mar.12
533
217
316
Investment Funds
Personal Investors
10,978
+763%
2Q13 4Q12
7,795
3Q12
2,539
2Q12
1,039
1Q12
1,272
Average Trading Volume
(# of Transactions)
Average Trading Volume
(R$ 000)
1,857
616
245108115
+1,516%
2Q13 4Q12 3Q12 2Q12 1Q12
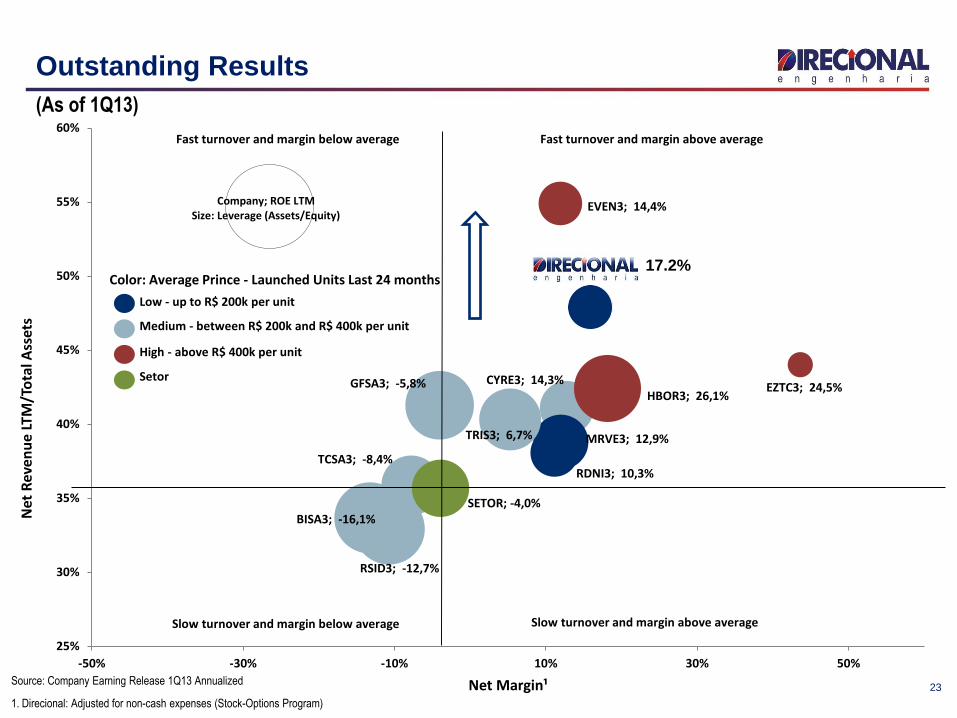
BISA3; -16,1%
CYRE3; 14,3%
EVEN3; 14,4%
EZTC3; 24,5%GFSA3; -5,8%HBOR3; 26,1%
MRVE3; 12,9%
DIRR3 17,2%
RDNI3; 10,3%
RSID3; -12,7%
TCSA3; -8,4%
SETOR; -4,0%
TRIS3; 6,7%
25%
30%
35%
40%
45%
50%
55%
60%
-50% -30% -10% 10% 30% 50%
Net
Re
ven
ue
LTM
/To
tal A
sset
s
Net Margin¹
Slow turnover and margin above averageSlow turnover and margin below average
Fast turnover and margin below average Fast turnover and margin above average
Company; ROE LTMSize: Leverage (Assets/Equity)
Color: Average Prince - Launched Units Last 24 months
Low - up to R$ 200k per unit
Medium - between R$ 200k and R$ 400k per unit
High - above R$ 400k per unit
Setor
1. Direcional: Adjusted for non-cash expenses (Stock-Options Program)
23
Outstanding Results
17.2%
Source: Company Earning Release 1Q13 Annualized
(As of 1Q13)
Appendix
24
25
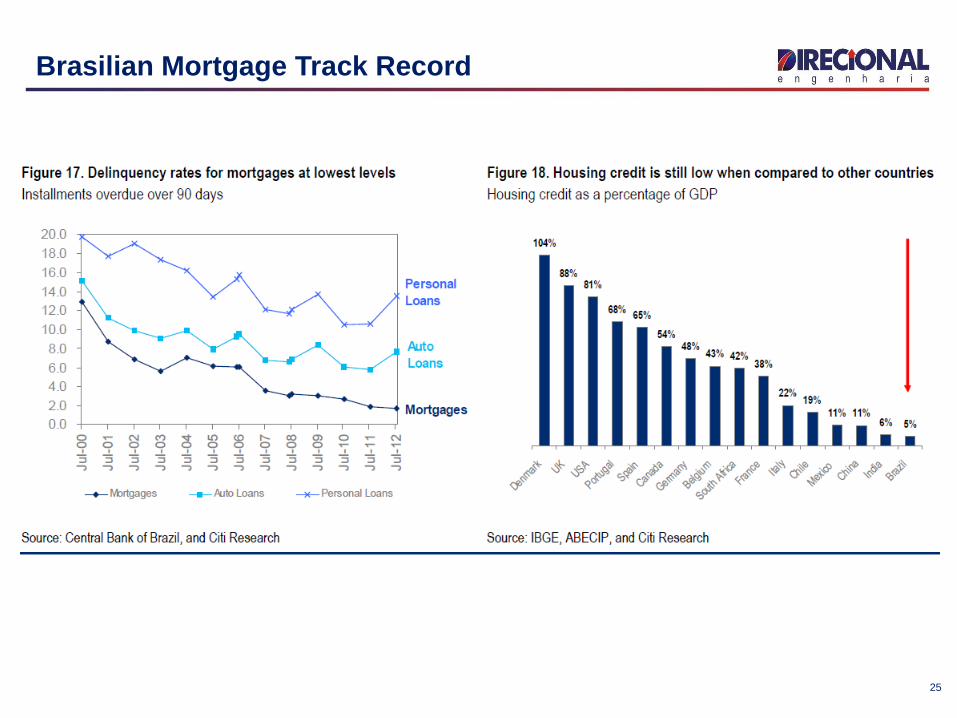
Brasilian Mortgage Track Record
26
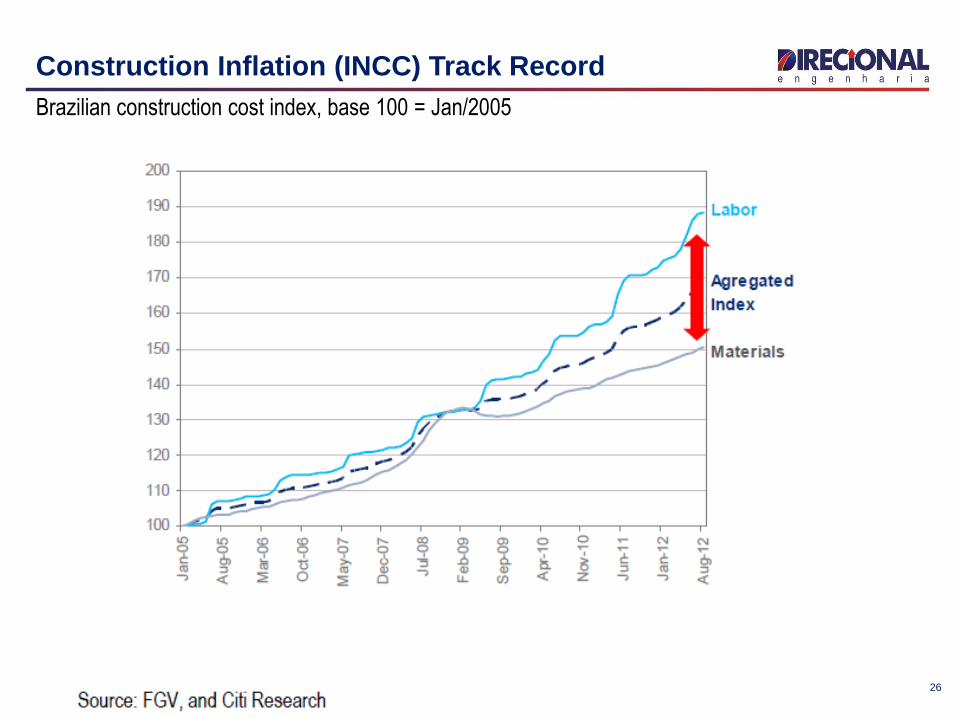
Construction Inflation (INCC) Track Record
Brazilian construction cost index, base 100 = Jan/2005
27
Contacts
Carlos Wollenweber CFO | IR Officer
Paulo Sousa IR Analyst
Luiz Felipe Almeida IR Analyst
www.direcional.com.b/ir
(55 31) 3214-6200
(55 31) 3214-6450