Embed Size (px)
Citation preview
Q2 2016 EARNINGS REVIEW
FORWARD LOOKING STATEMENTS
The following investor presentation contains certain forward-looking
information within the meaning of applicable securities laws relating, but
not limited, to Canadian Pacific’s operations, priorities and plans,
anticipated financial performance, business prospects, planned capital
expenditures, programs and strategies. This forward-looking information
also includes, but is not limited to, statements concerning expectations,
beliefs, plans, goals, objectives, assumptions and statements about
possible future events, conditions, and results of operations or
performance.
Forward-looking information may contain statements with words such as
“anticipate”, “believe”, “expect”, “plan” or similar words suggesting future
outcomes.
Undue reliance should not be placed on forward-looking information as
actual results may differ materially from the forward-looking information.
Forward-looking information is not a guarantee of future performance.
By its nature, CP’s forward-looking information involves numerous
assumptions, inherent risks and uncertainties that could cause actual
results to differ materially from the forward-looking information, including
but not limited to the following factors: changes in business strategies;
general North American and global economic, credit and business
conditions; risks in agricultural production such as weather conditions and
insect populations; the availability and price of energy commodities; the
effects of competition and pricing pressures; industry capacity; shifts in
market demand; inflation; changes in laws and regulations, including
regulation of rates; changes in taxes and tax rates; potential increases in
maintenance and operating costs; uncertainties of investigations,
proceedings or other types of claims and litigation; labour disputes; risks
and liabilities arising from derailments; transportation of dangerous
goods; timing of completion of capital and maintenance projects; currency
and interest rate fluctuations; effects of changes in market conditions and
discount rates on the financial position of pension plans and including
long-term floating rate notes; and investments, various events that could
disrupt operations, including severe weather, droughts, floods,
avalanches and earthquakes as well as security threats and
governmental response to them, and technological changes.
The foregoing list of factors is not exhaustive. These and other factors
are detailed from time to time in reports filed by CP with securities
regulators in Canada and the United States. Reference should be made
to “Management’s Discussion and Analysis of Financial Condition and
Results of Operations” in CP’s annual and quarterly reports filed on Form
10-K and 10-Q, respectively.
Forward-looking information is based on current expectations, estimates
and projections and it is possible that predictions, forecasts, projections,
and other forms of forward-looking information will not be achieved by CP.
Except as required by law, CP undertakes no obligation to update publicly
or otherwise revise any forward-looking information, whether as a result
of new information, future events or otherwise.
NOTE ON NON-GAAP MEASURES
Except where noted, all figures are in millions of Canadian dollars.
Financial information is prepared in accordance with accounting
principles generally accepted in the United States of America (U.S.
GAAP), unless otherwise noted.
CP presents non-GAAP earnings information in this presentation to
provide a basis for evaluating underlying earnings trends that can be
compared with the prior period's results.
It should be noted that CP’s non-GAAP earnings as described in this
presentation, have no standardized meanings and are not defined by
U.S. GAAP and, therefore, are unlikely to be comparable to similar
measures presented by other companies.
For further information regarding non-GAAP measures see the
Non-GAAP Measures supplement to the press release on our website
at www.cpr.ca.

E. HUNTER HARRISON
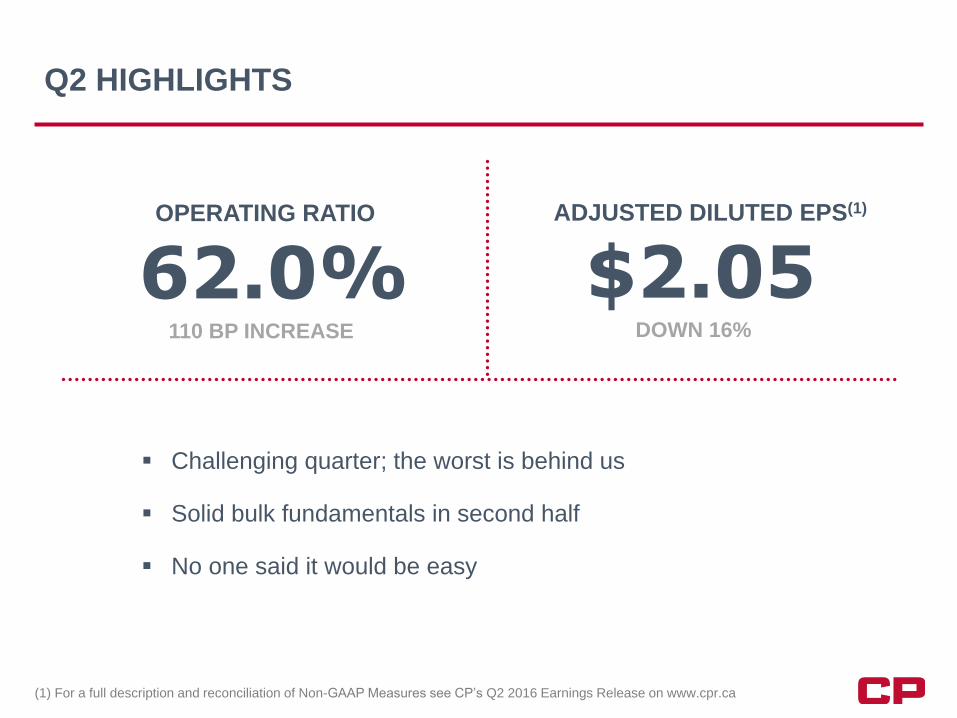
Q2 HIGHLIGHTS
110 BP INCREASE
62.0% DOWN 16%
$2.05
(1) For a full description and reconciliation of Non-GAAP Measures see CP’s Q2 2016 Earnings Release on www.cpr.ca
Challenging quarter; the worst is behind us
Solid bulk fundamentals in second half
No one said it would be easy
ADJUSTED DILUTED EPS(1) OPERATING RATIO

KEITH CREEL
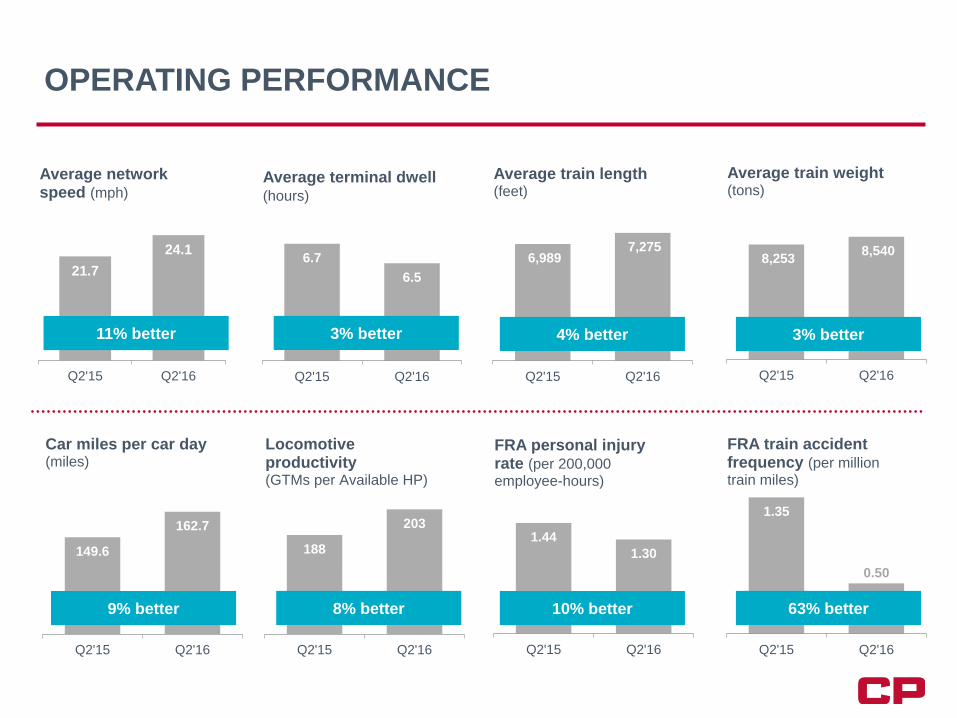
1.44
1.30
Q2'15 Q2'16
FRA personal injury rate (per 200,000 employee-hours)
1.35
0.50
Q2'15 Q2'16
FRA train accident frequency (per million train miles)
188
203
Q2'15 Q2'16
Locomotive productivity (GTMs per Available HP)
149.6
162.7
Q2'15 Q2'16
Car miles per car day (miles)
8,253 8,540
Q2'15 Q2'16
Average train weight (tons)
6,989 7,275
Q2'15 Q2'16
Average train length (feet)
6.7
6.5
Q2'15 Q2'16
Average terminal dwell (hours)
OPERATING PERFORMANCE
21.7
24.1
Q2'15 Q2'16
Average network speed (mph)
9% better 8% better 10% better 63% better
11% better 3% better 4% better 3% better
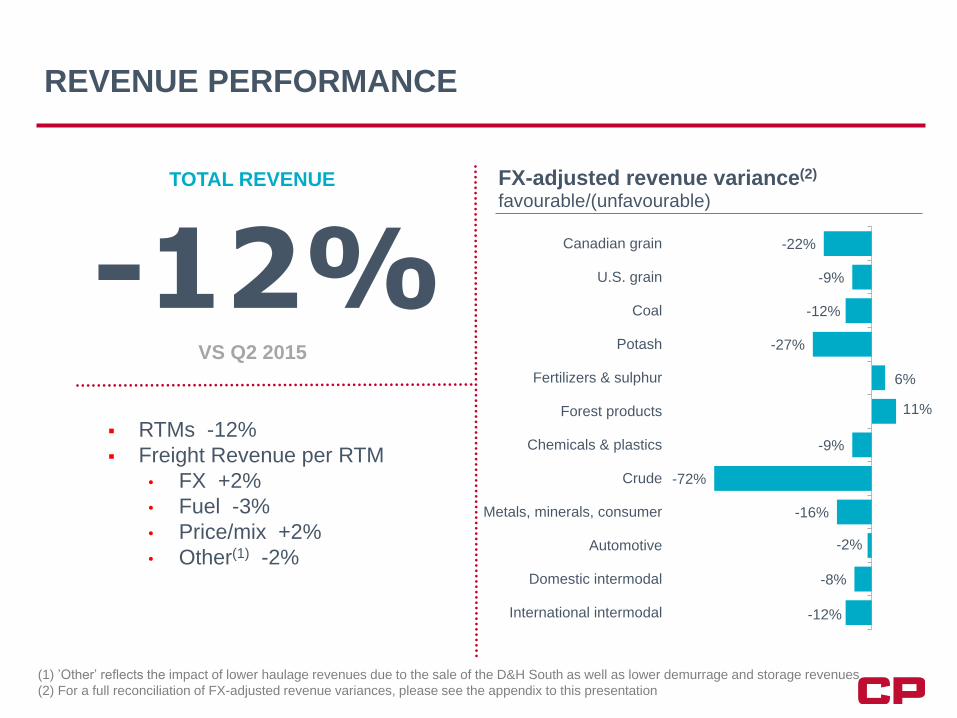
REVENUE PERFORMANCE
-22%
-9%
-12%
-27%
6%
11%
-9%
-72%
-16%
-2%
-8%
-12%
Canadian grain
U.S. grain
Coal
Potash
Fertilizers & sulphur
Forest products
Chemicals & plastics
Crude
Metals, minerals, consumer
Automotive
Domestic intermodal
International intermodal
FX-adjusted revenue variance(2)
favourable/(unfavourable) TOTAL REVENUE
-12% VS Q2 2015
(1) ’Other’ reflects the impact of lower haulage revenues due to the sale of the D&H South as well as lower demurrage and storage revenues
(2) For a full reconciliation of FX-adjusted revenue variances, please see the appendix to this presentation
RTMs -12%
Freight Revenue per RTM
• FX +2%
• Fuel -3%
• Price/mix +2%
• Other(1) -2%
MARK ERCEG
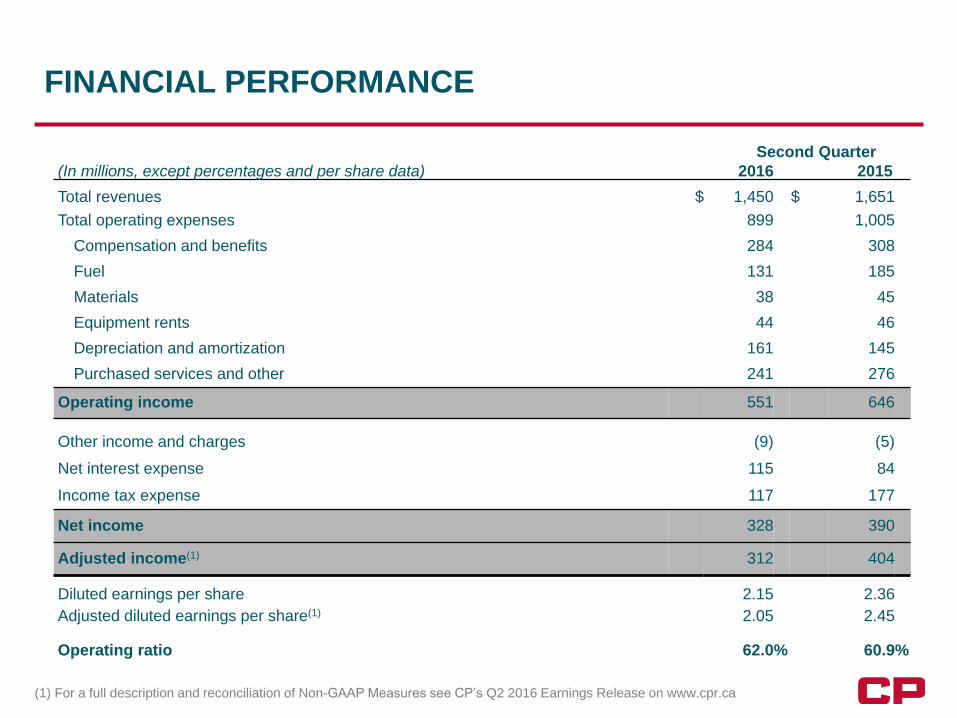
Second Quarter
(In millions, except percentages and per share data) 2016 2015
Total revenues $ 1,450 $ 1,651
Total operating expenses 899 1,005
Compensation and benefits 284 308
Fuel 131 185
Materials 38 45
Equipment rents 44 46
Depreciation and amortization 161 145
Purchased services and other 241 276
Operating income 551 646
Other income and charges (9) (5)
Net interest expense 115 84
Income tax expense 117 177
Net income 328 390
Adjusted income(1) 312 404
Diluted earnings per share 2.15 2.36
Adjusted diluted earnings per share(1) 2.05 2.45
Operating ratio 62.0 % 60.9 %
(1) For a full description and reconciliation of Non-GAAP Measures see CP’s Q2 2016 Earnings Release on www.cpr.ca
FINANCIAL PERFORMANCE

E. HUNTER HARRISON

APPENDIX
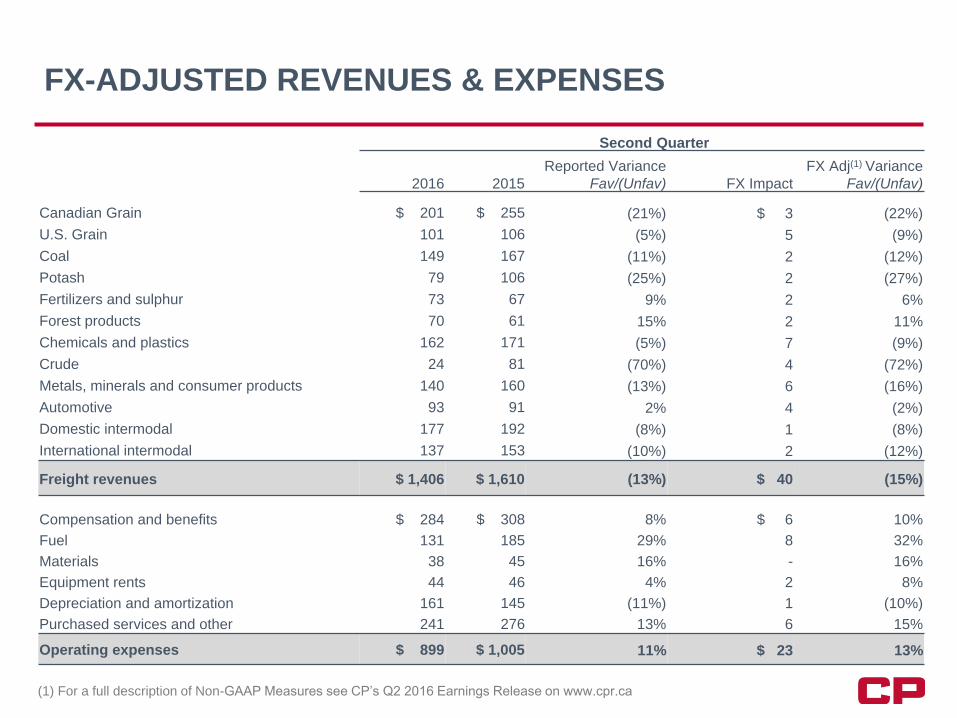
Second Quarter
2016 2015
Reported Variance
Fav/(Unfav) FX Impact
FX Adj(1) Variance
Fav/(Unfav)
Canadian Grain $ 201 $ 255 (21%) $ 3 (22%)
U.S. Grain 101 106 (5%) 5 (9%)
Coal 149 167 (11%) 2 (12%)
Potash 79 106 (25%) 2 (27%)
Fertilizers and sulphur 73 67 9% 2 6%
Forest products 70 61 15% 2 11%
Chemicals and plastics 162 171 (5%) 7 (9%)
Crude 24 81 (70%) 4 (72%)
Metals, minerals and consumer products 140 160 (13%) 6 (16%)
Automotive 93 91 2% 4 (2%)
Domestic intermodal 177 192 (8%) 1 (8%)
International intermodal 137 153 (10%) 2 (12%)
Freight revenues $ 1,406 $ 1,610 (13%) $ 40 (15%)
Compensation and benefits $ 284 $ 308 8% $ 6 10%
Fuel 131 185 29% 8 32%
Materials 38 45 16% - 16%
Equipment rents 44 46 4% 2 8%
Depreciation and amortization 161 145 (11%) 1 (10%)
Purchased services and other 241 276 13% 6 15%
Operating expenses $ 899 $ 1,005 11% $ 23 13%
(1) For a full description of Non-GAAP Measures see CP’s Q2 2016 Earnings Release on www.cpr.ca
FX-ADJUSTED REVENUES & EXPENSES
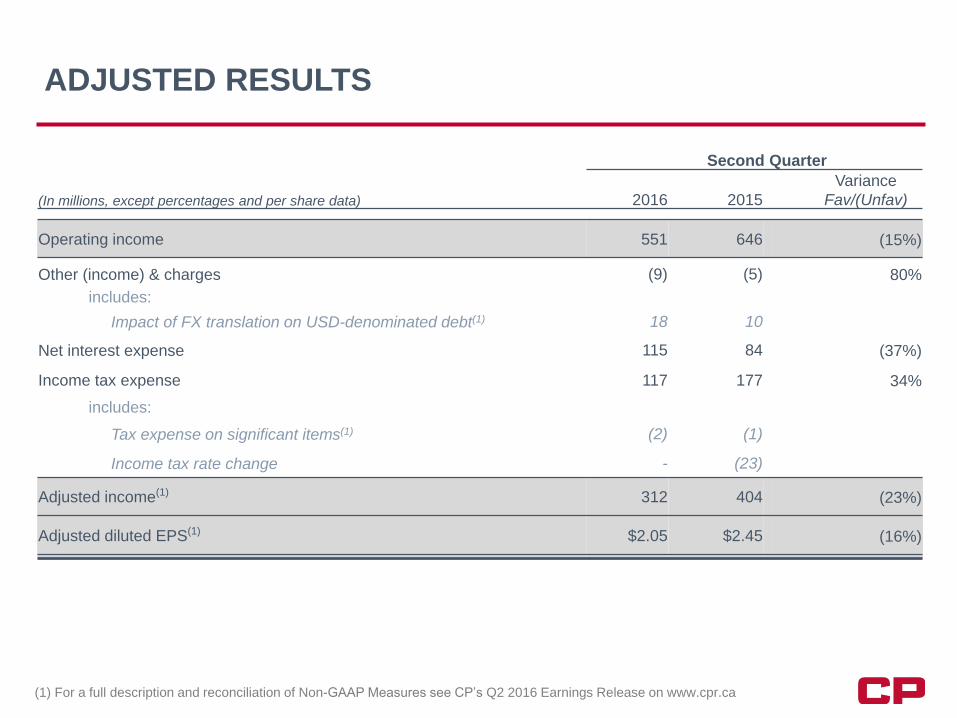
Second Quarter
(In millions, except percentages and per share data) 2016 2015
Variance
Fav/(Unfav)
Operating income 551 646 (15%)
Other (income) & charges (9) (5) 80%
includes:
Impact of FX translation on USD-denominated debt(1) 18 10
Net interest expense 115 84 (37%)
Income tax expense 117 177 34%
includes:
Tax expense on significant items(1) (2) (1)
Income tax rate change - (23)
Adjusted income(1) 312 404 (23%)
Adjusted diluted EPS(1) $2.05 $2.45 (16%)
ADJUSTED RESULTS
(1) For a full description and reconciliation of Non-GAAP Measures see CP’s Q2 2016 Earnings Release on www.cpr.ca
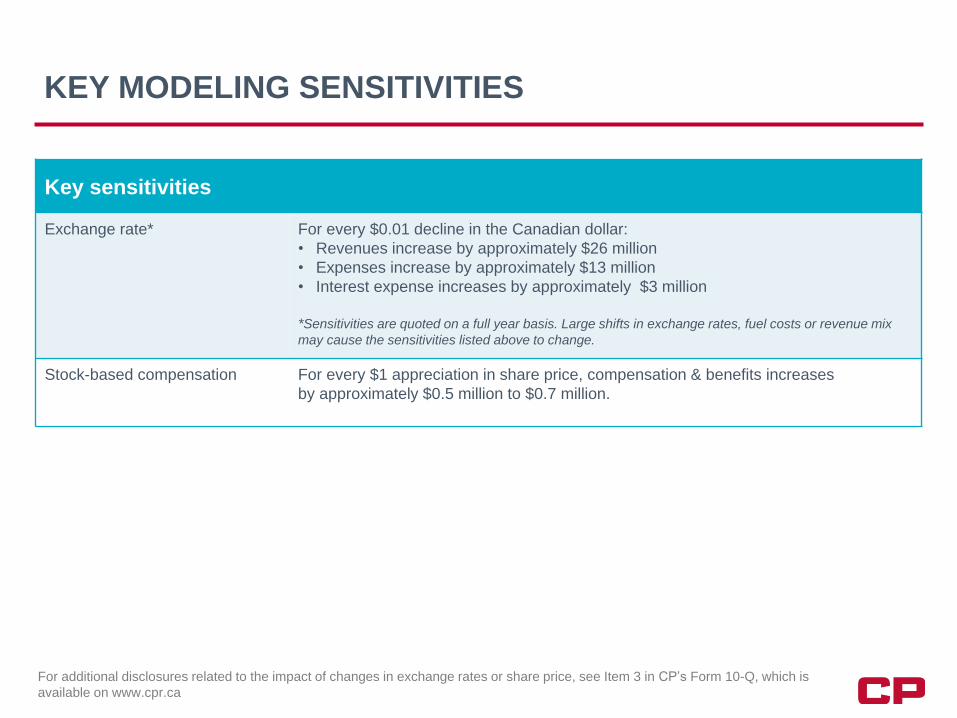
KEY MODELING SENSITIVITIES
Key sensitivities
Exchange rate*
For every $0.01 decline in the Canadian dollar:
• Revenues increase by approximately $26 million
• Expenses increase by approximately $13 million
• Interest expense increases by approximately $3 million
*Sensitivities are quoted on a full year basis. Large shifts in exchange rates, fuel costs or revenue mix
may cause the sensitivities listed above to change.
Stock-based compensation For every $1 appreciation in share price, compensation & benefits increases
by approximately $0.5 million to $0.7 million.
For additional disclosures related to the impact of changes in exchange rates or share price, see Item 3 in CP’s Form 10-Q, which is
available on www.cpr.ca


![Q2 FY16 Investor Presentation [Company Update]](https://img.pdfslide.tips/doc/110x75/577ca4cd1a28abea748b45f8/q2-fy16-investor-presentation-company-update.jpg)


![DNO Q2 2010 Presentation[1]](https://img.pdfslide.tips/doc/110x75/577d36791a28ab3a6b932f8d/dno-q2-2010-presentation1.jpg)