Embed Size (px)
Citation preview
SECONDQUARTER 2016July 21, 2016
Tele2 AB
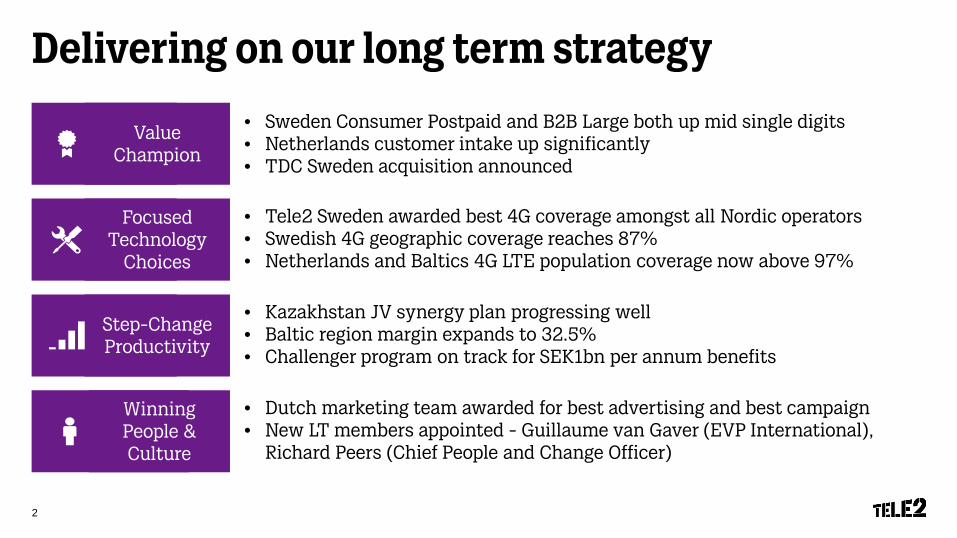
Delivering on our long term strategy
Winning People & Culture
Value Champion
Step-Change Productivity
Focused Technology
Choices
• Tele2 Sweden awarded best 4G coverage amongst all Nordic operators• Swedish 4G geographic coverage reaches 87%• Netherlands and Baltics 4G LTE population coverage now above 97%
• Sweden Consumer Postpaid and B2B Large both up mid single digits• Netherlands customer intake up significantly• TDC Sweden acquisition announced
• Kazakhstan JV synergy plan progressing well• Baltic region margin expands to 32.5% • Challenger program on track for SEK1bn per annum benefits
2
• Dutch marketing team awarded for best advertising and best campaign• New LT members appointed - Guillaume van Gaver (EVP International),
Richard Peers (Chief People and Change Officer)
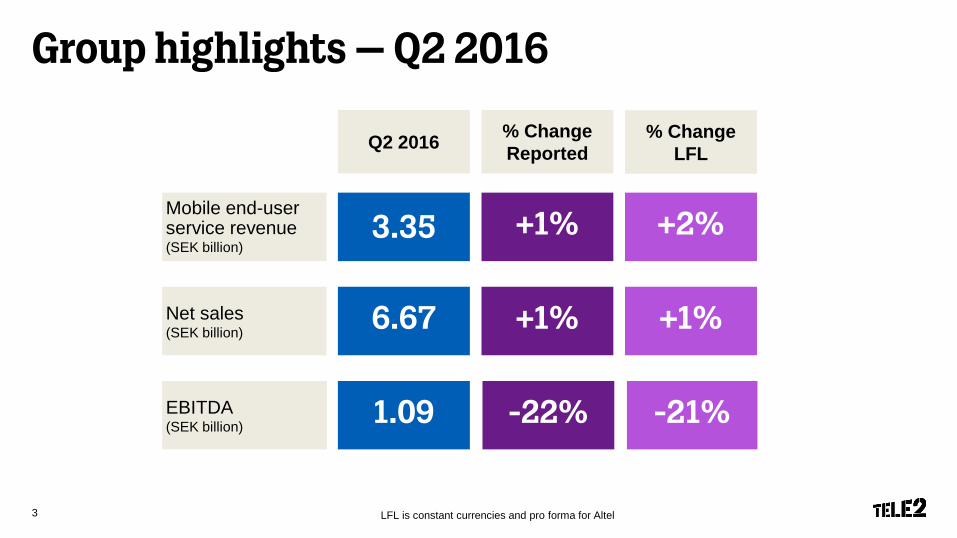
Group highlights – Q2 2016
3
Q2 2016 % Change Reported
LFL is constant currencies and pro forma for Altel
% ChangeLFL
Mobile end-user service revenue(SEK billion)
3.35 +1% +2%
EBITDA(SEK billion) 1.09 -22% -21%
Net sales(SEK billion) 6.67 +1% +1%
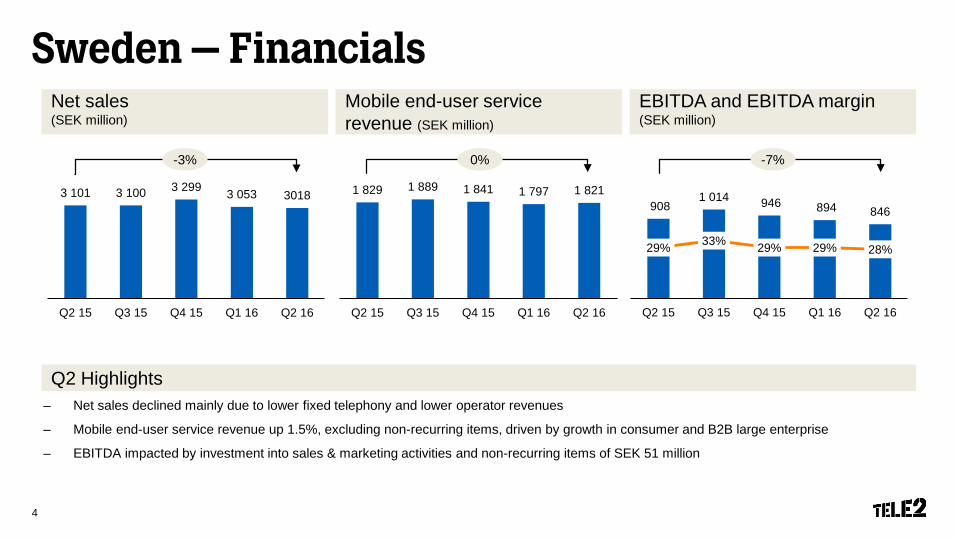
Sweden – FinancialsNet sales(SEK million)
Mobile end-user servicerevenue (SEK million)
Q2 Highlights
EBITDA and EBITDA margin(SEK million)
1 829 1 889 1 841 1 797 1 821
Q2 15 Q3 15 Q4 15 Q1 16 Q2 160
200
400
600
800
1 000
1 200
1 400
1 600
1 800
2 000
9081 014 946 894 846
29% 33% 29% 29% 28%
0%
10%
20%
30%
40%
50%
60%
Q2 15 Q3 15 Q4 15 Q1 16 Q2 160
200
400
600
800
1 000
1 2003 101 3 100 3 299 3 053 3018
Q2 15 Q3 15 Q4 15 Q1 16 Q2 160
500
1 000
1 500
2 000
2 500
3 000
3 500
0%-3% -7%
4
– Net sales declined mainly due to lower fixed telephony and lower operator revenues
– Mobile end-user service revenue up 1.5%, excluding non-recurring items, driven by growth in consumer and B2B large enterprise
– EBITDA impacted by investment into sales & marketing activities and non-recurring items of SEK 51 million
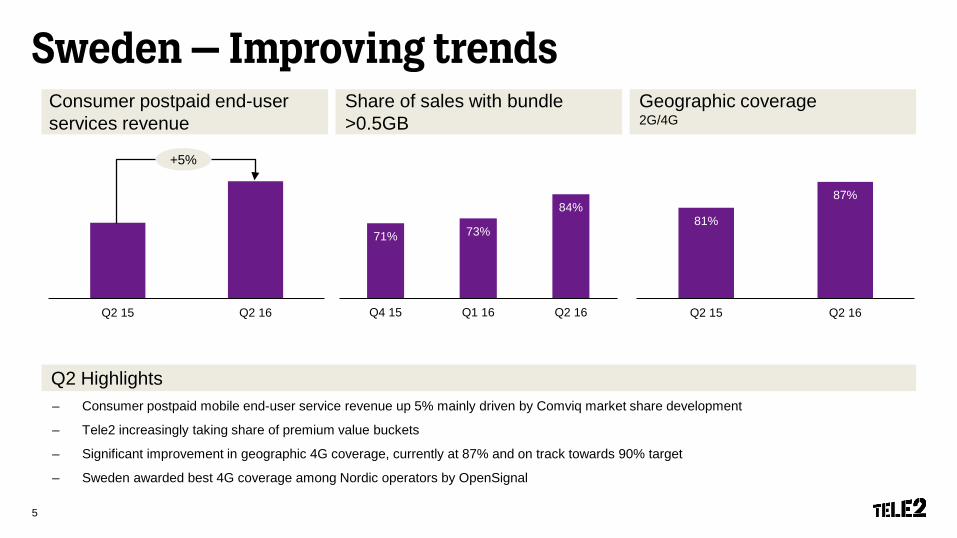
Sweden – Improving trendsConsumer postpaid end-user services revenue
Share of sales with bundle >0.5GB
– Consumer postpaid mobile end-user service revenue up 5% mainly driven by Comviq market share development
– Tele2 increasingly taking share of premium value buckets
– Significant improvement in geographic 4G coverage, currently at 87% and on track towards 90% target
– Sweden awarded best 4G coverage among Nordic operators by OpenSignal
Q2 Highlights
Geographic coverage2G/4G
Q2 15 Q2 16
71% 73%
84%
Q4 15 Q1 16 Q2 16
+5%
5
81%
87%
Q2 15 Q2 16
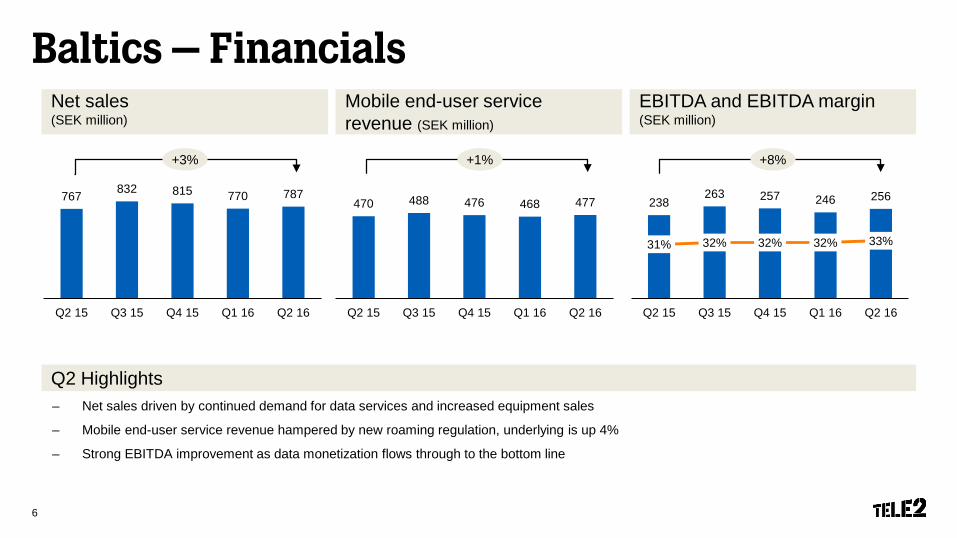
Baltics – Financials
Q2 Highlights
6
Net sales(SEK million)
EBITDA and EBITDA margin(SEK million)
Mobile end-user service revenue (SEK million)
470 488 476 468 477
Q2 15 Q3 15 Q4 15 Q1 16 Q2 160
100
200
300
400
500
600
238263 257 246 256
31% 32% 32% 32% 33%
0%
10%
20%
30%
40%
50%
60%
Q2 15 Q3 15 Q4 15 Q1 16 Q2 160
50
100
150
200
250
300767 832 815 770 787
Q2 15 Q3 15 Q4 15 Q1 16 Q2 160
100
200
300
400
500
600
700
800
900
– Net sales driven by continued demand for data services and increased equipment sales
– Mobile end-user service revenue hampered by new roaming regulation, underlying is up 4%
– Strong EBITDA improvement as data monetization flows through to the bottom line
+1%+3% +8%
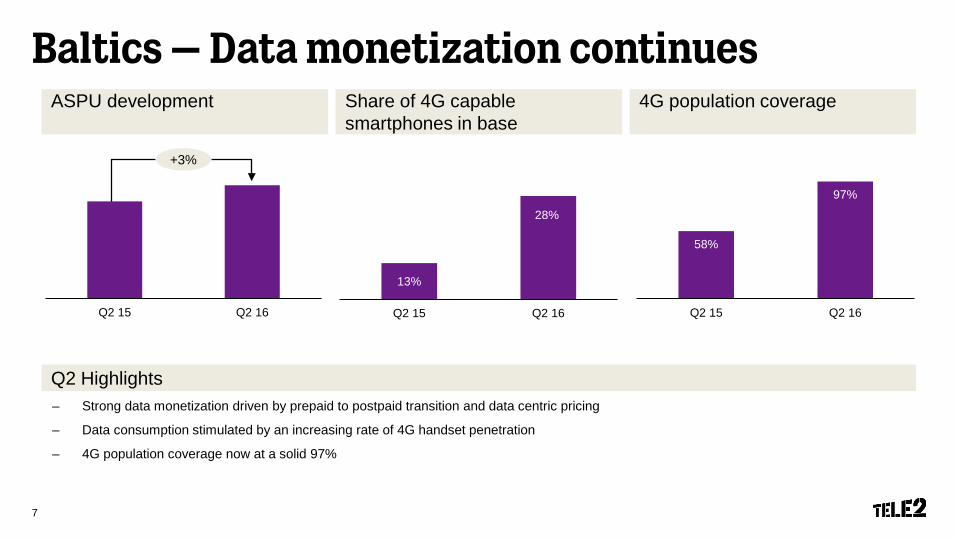
Baltics – Data monetization continues
7
ASPU development Share of 4G capable smartphones in base
Q2 Highlights
4G population coverage
– Strong data monetization driven by prepaid to postpaid transition and data centric pricing
– Data consumption stimulated by an increasing rate of 4G handset penetration
– 4G population coverage now at a solid 97%
58%
97%
Q2 15 Q2 16Q2 15 Q2 16
13%
28%
Q2 15 Q2 16
+3%
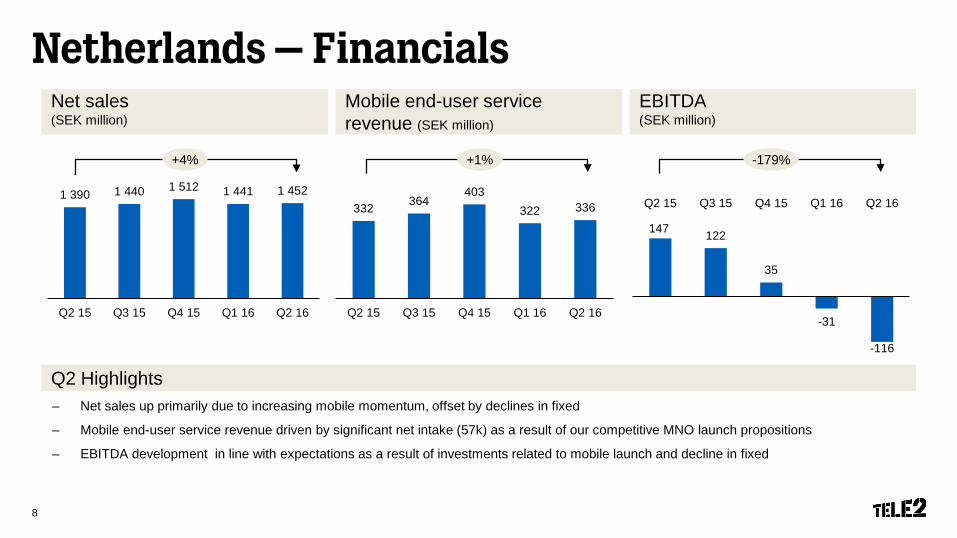
Netherlands – Financials
Q2 Highlights– Net sales up primarily due to increasing mobile momentum, offset by declines in fixed
– Mobile end-user service revenue driven by significant net intake (57k) as a result of our competitive MNO launch propositions
– EBITDA development in line with expectations as a result of investments related to mobile launch and decline in fixed
8
Net sales(SEK million)
EBITDA (SEK million)
Mobile end-user service revenue (SEK million)
332 364403
322 336
Q2 15 Q3 15 Q4 15 Q1 16 Q2 160
50
100
150
200
250
300
350
400
450
147 122
35
-31
-116
Q2 15 Q3 15 Q4 15 Q1 16 Q2 16
-120
-70
-20
30
80
130
180
1 390 1 440 1 512 1 441 1 452
Q2 15 Q3 15 Q4 15 Q1 16 Q2 160
200
400
600
800
1 000
1 200
1 400
1 600
+1%+4% -179%
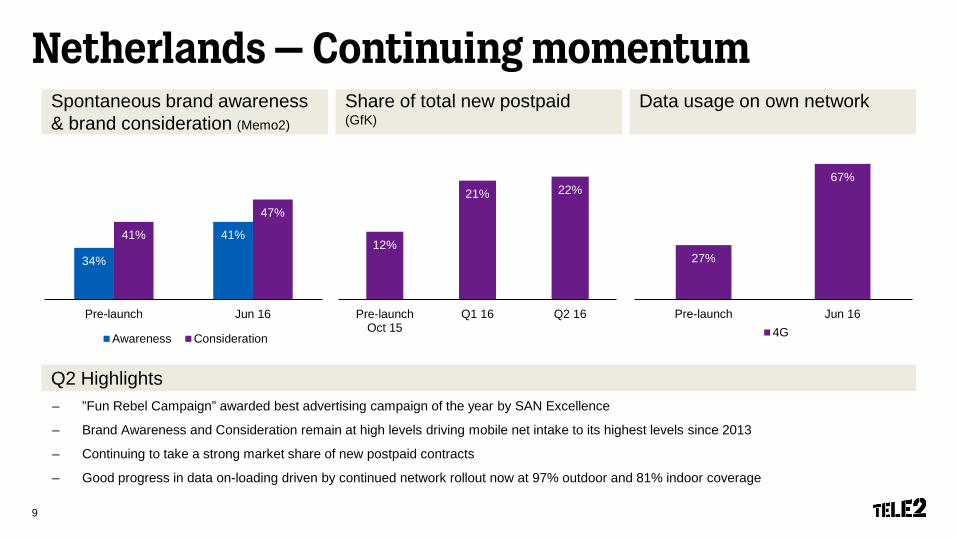
Netherlands – Continuing momentumSpontaneous brand awareness & brand consideration (Memo2)
Share of total new postpaid(GfK)
Data usage on own network
Q2 Highlights– ”Fun Rebel Campaign” awarded best advertising campaign of the year by SAN Excellence
– Brand Awareness and Consideration remain at high levels driving mobile net intake to its highest levels since 2013
– Continuing to take a strong market share of new postpaid contracts
– Good progress in data on-loading driven by continued network rollout now at 97% outdoor and 81% indoor coverage
9
27%
67%
Pre-launch Jun 164G
34%
41%41%
47%
Pre-launch Jun 16
Awareness Consideration
12%
21% 22%
Pre-launchOct 15
Q1 16 Q2 16
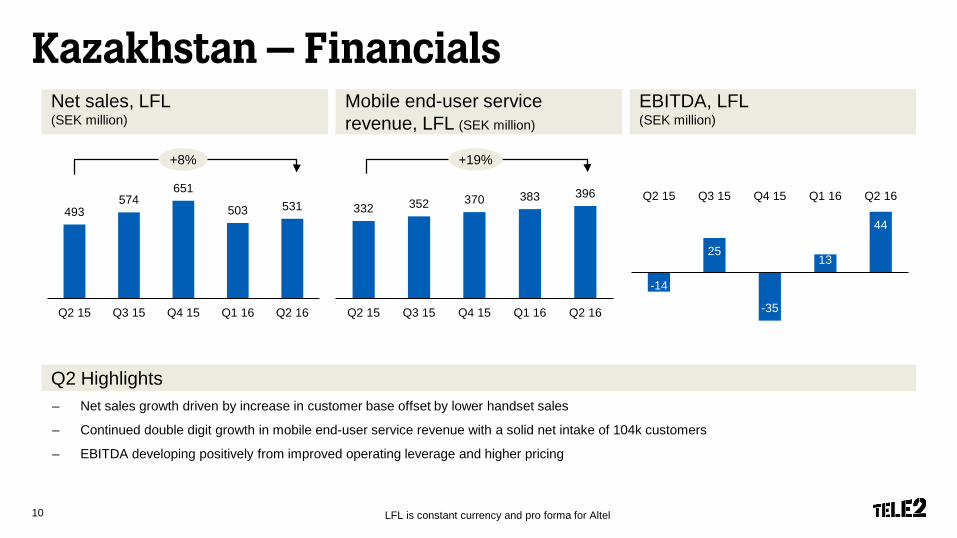
– Net sales growth driven by increase in customer base offset by lower handset sales
– Continued double digit growth in mobile end-user service revenue with a solid net intake of 104k customers
– EBITDA developing positively from improved operating leverage and higher pricing
Kazakhstan – Financials
10
Q2 Highlights
LFL is constant currency and pro forma for Altel
Net sales, LFL (SEK million)
EBITDA, LFL (SEK million)
Mobile end-user service revenue, LFL (SEK million)
332 352 370 383 396
Q2 15 Q3 15 Q4 15 Q1 16 Q2 160
50
100
150
200
250
300
350
400
450
-14
25
-35
13
44
Q2 15 Q3 15 Q4 15 Q1 16 Q2 16
-35
-25
-15
-5
5
15
25
35
45493574
651
503 531
Q2 15 Q3 15 Q4 15 Q1 16 Q2 160
100
200
300
400
500
600
700
+19%+8%
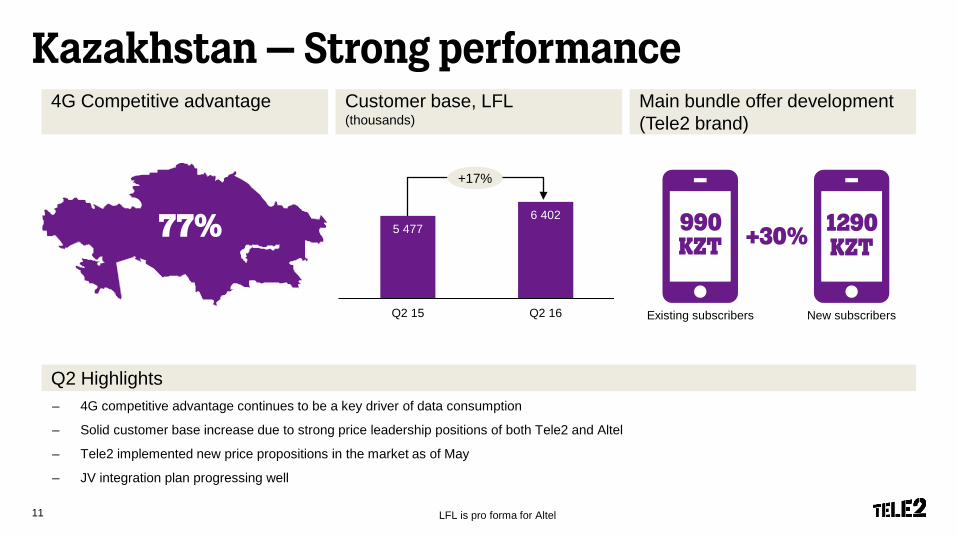
Kazakhstan – Strong performanceCustomer base, LFL(thousands)
Main bundle offer development (Tele2 brand)
Q2 Highlights
11
4G Competitive advantage
LFL is pro forma for Altel
– 4G competitive advantage continues to be a key driver of data consumption
– Solid customer base increase due to strong price leadership positions of both Tele2 and Altel
– Tele2 implemented new price propositions in the market as of May
– JV integration plan progressing well
5 4776 402
Q2 15 Q2 16 Existing subscribers New subscribers
990 1290KZT KZT+30%
+17%
77%
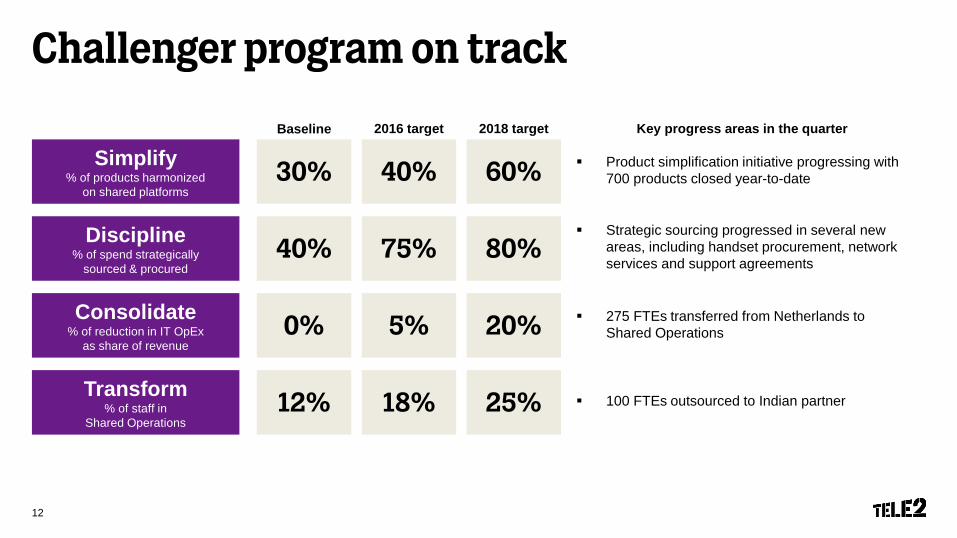
Challenger program on track
Simplify% of products harmonized
on shared platforms
Discipline% of spend strategically
sourced & procured
Consolidate% of reduction in IT OpEx
as share of revenue
Transform% of staff in
Shared Operations
2016 target 2018 targetBaseline
30% 40% 60%
40% 75% 80%
0% 5% 20%
12% 18% 25%
Key progress areas in the quarter
Strategic sourcing progressed in several new areas, including handset procurement, network services and support agreements
275 FTEs transferred from Netherlands to Shared Operations
100 FTEs outsourced to Indian partner
Product simplification initiative progressing with 700 products closed year-to-date
12

Financial Overview
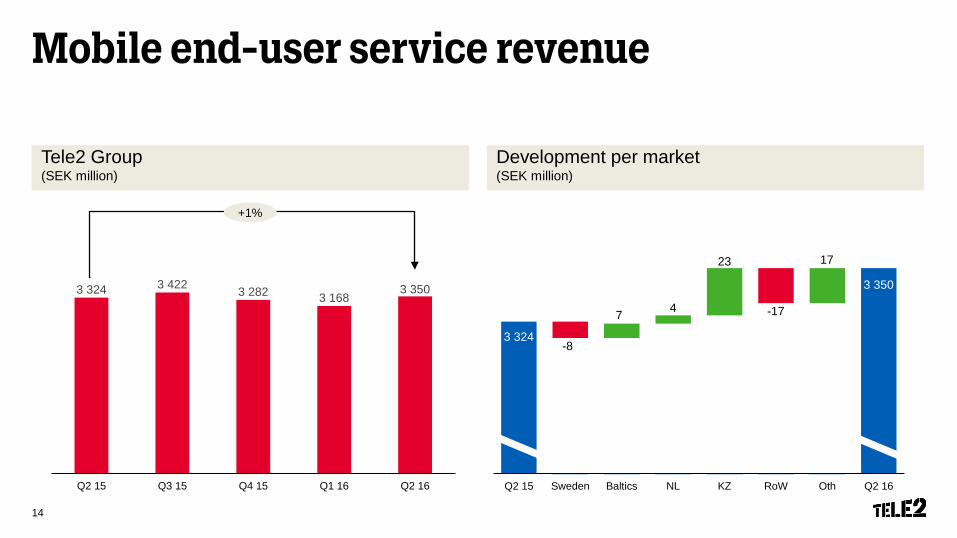
3 324
3 350
-8
7 4
23
-17
Q2 15 Sweden Baltics NL KZ RoW Oth Q2 16
Mobile end-user service revenue
Tele2 Group(SEK million)
14
3 324 3 422 3 282 3 1683 350
Q2 15 Q3 15 Q4 15 Q1 16 Q2 16
+1%
Development per market(SEK million)
17
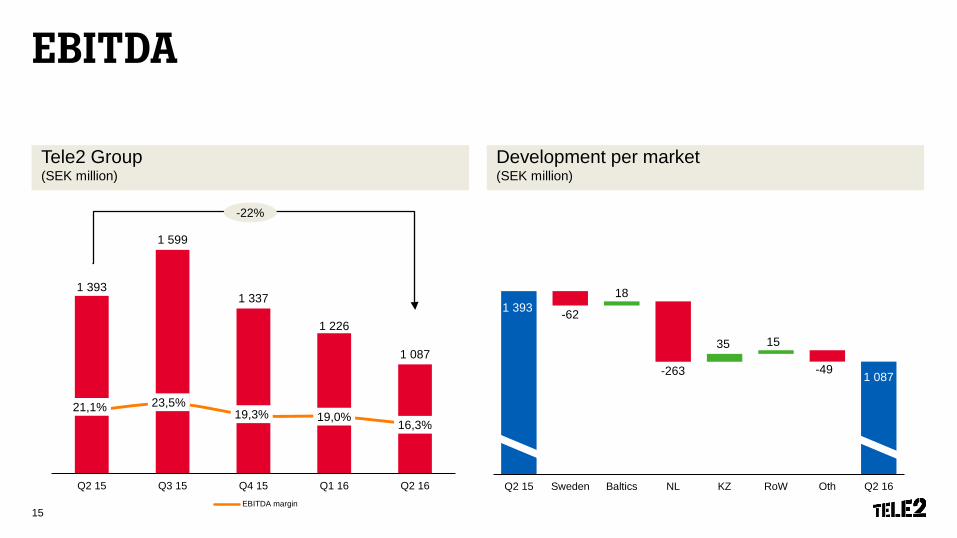
1 393
1 087
-62
18
-263
35 15
-49
Q2 15 Sweden Baltics NL KZ RoW Oth Q2 16
EBITDA
Tele2 Group(SEK million)
15
1 393
1 599
1 337
1 226
1 087
21,1% 23,5%19,3% 19,0%
16,3%
600
800
1000
1200
1400
1600
1800
Q2 15 Q3 15 Q4 15 Q1 16 Q2 160,00%
10,00%
20,00%
30,00%
40,00%
50,00%
60,00%
70,00%
80,00%
90,00%
EBITDA margin
-22%
Development per market(SEK million)
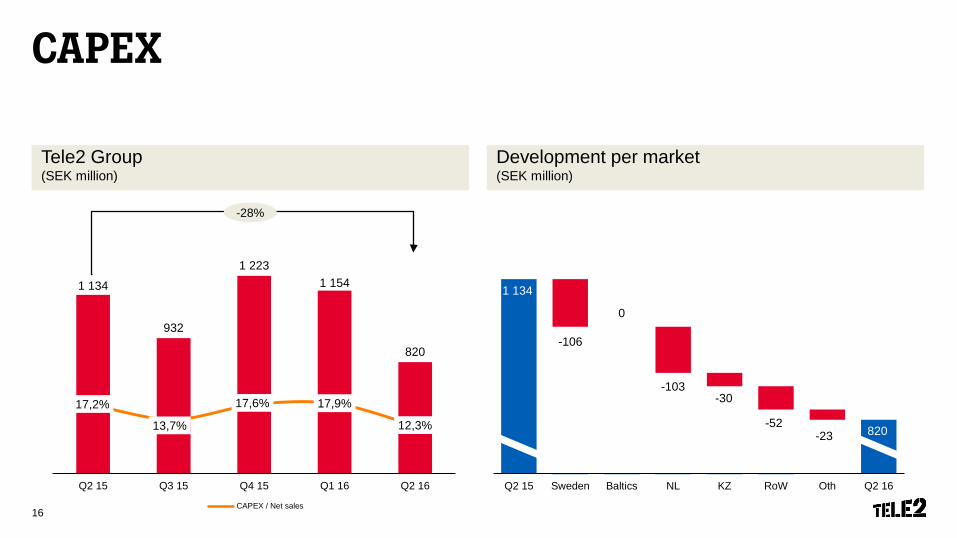
CAPEX
Tele2 Group(SEK million)
16
1 134
932
1 2231 154
820
17,2%
13,7%
17,6% 17,9%
12,3%
300
500
700
900
1 100
1 300
Q2 15 Q3 15 Q4 15 Q1 16 Q2 160,00%
10,00%
20,00%
30,00%
40,00%
50,00%
60,00%
CAPEX / Net sales
-28%
Development per market(SEK million)
1 134
820
-106
0
-103-30
-52-23
Q2 15 Sweden Baltics NL KZ RoW Oth Q2 16
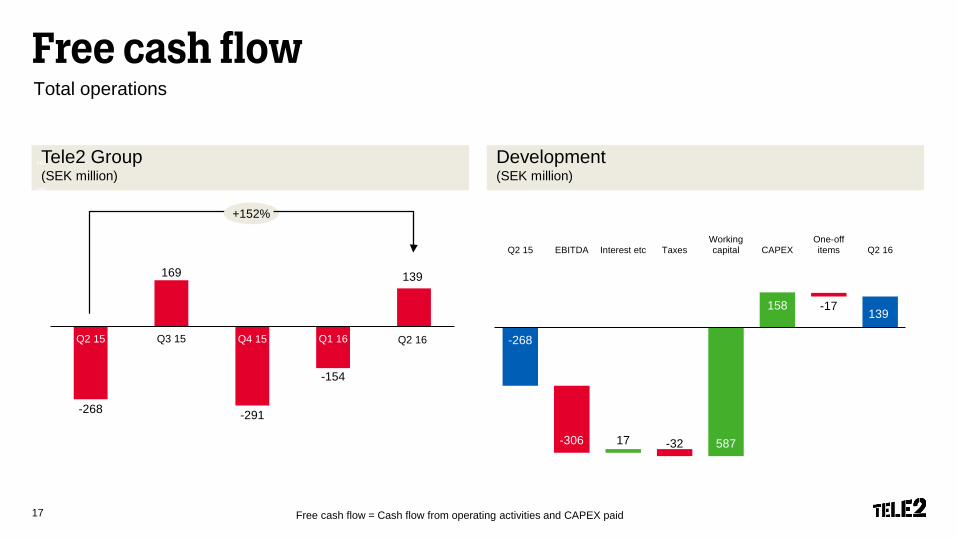
Free cash flowTotal operations
Tele2 Group(SEK million)
Development (SEK million)
Free cash flow = Cash flow from operating activities and CAPEX paid17
-268
169
-291
-154
139
-400
-300
-200
-100
0
100
200
300
400
500
600
Q2 15 Q3 15 Q4 15 Q1 16 Q2 16
139
-268
-306 17 -32 587
158 -17
Q2 15 EBITDA Interest etc TaxesWorkingcapital CAPEX
One-offitems Q2 16
+152%
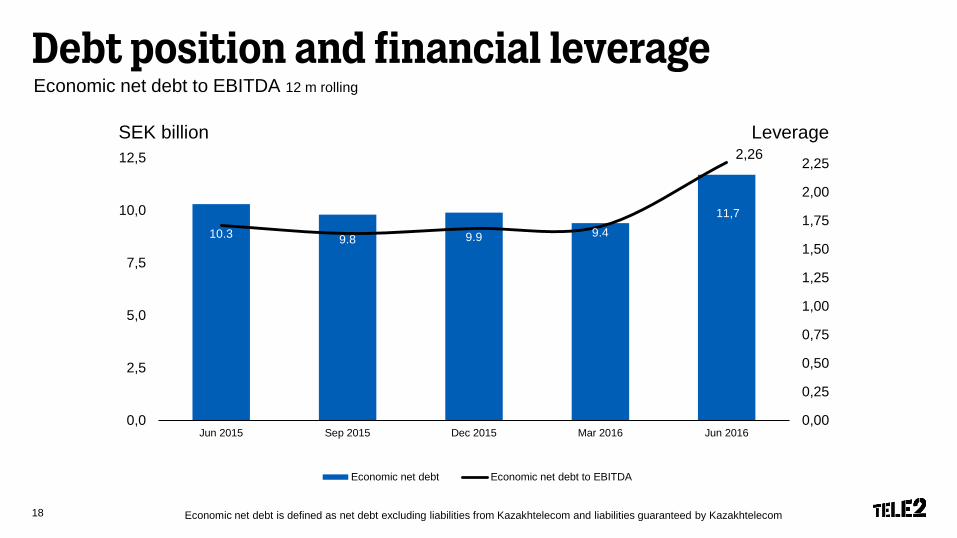
Debt position and financial leverageEconomic net debt to EBITDA 12 m rolling
18
10.3 9.8 9.9 9.411,7
0,00
0,25
0,50
0,75
1,00
1,25
1,50
1,75
2,00
2,25
0,0
2,5
5,0
7,5
10,0
12,5
Jun 2015 Sep 2015 Dec 2015 Mar 2016 Jun 2016
Economic net debt Economic net debt to EBITDA
Economic net debt is defined as net debt excluding liabilities from Kazakhtelecom and liabilities guaranteed by Kazakhtelecom
2,26LeverageSEK billion
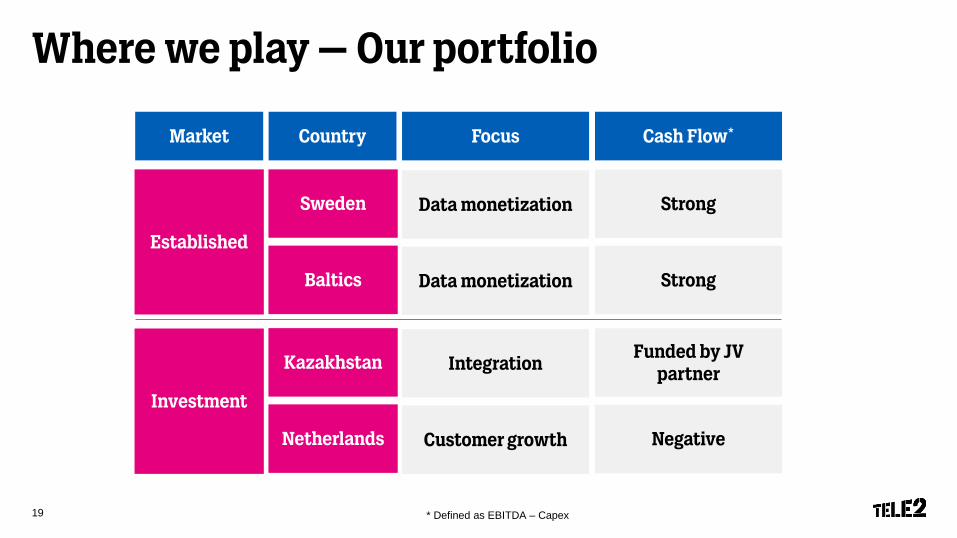
Where we play – Our portfolio
19 * Defined as EBITDA – Capex
Country Focus Cash Flow*Market
Sweden Data monetization Strong
Baltics Data monetization Strong
Established
Kazakhstan IntegrationFunded by JV
partner
Netherlands Customer growth Negative
Investment
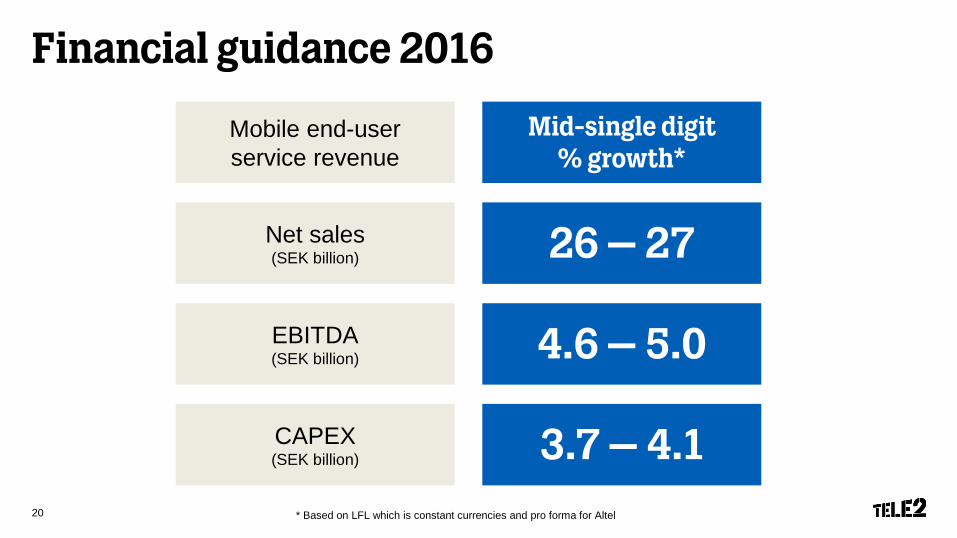
Financial guidance 2016
* Based on LFL which is constant currencies and pro forma for Altel20
Net sales(SEK billion)
EBITDA(SEK billion)
26 – 27
4.6 – 5.0
CAPEX(SEK billion) 3.7 – 4.1
Mobile end-user service revenue
Mid-single digit % growth*
Summary
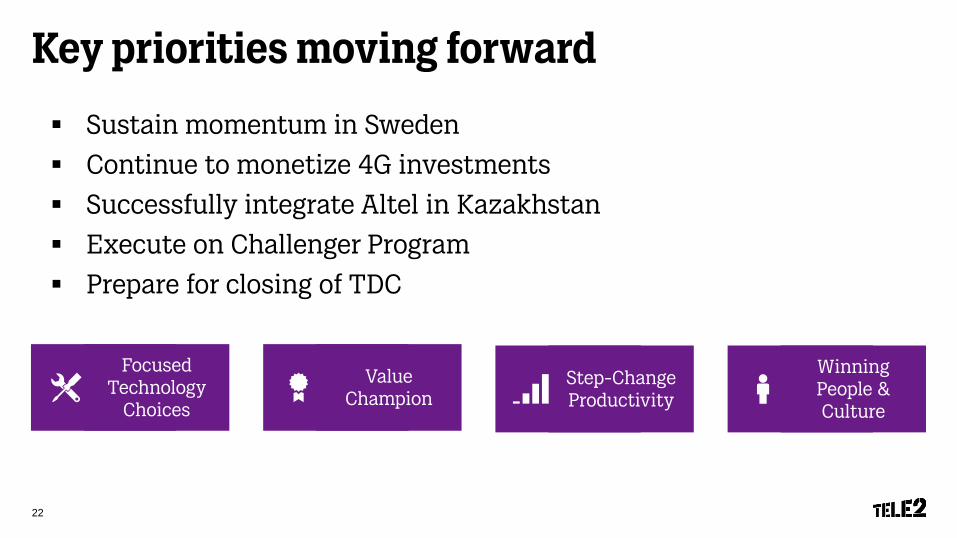
Key priorities moving forward
Sustain momentum in Sweden
Continue to monetize 4G investments
Successfully integrate Altel in Kazakhstan
Execute on Challenger Program
Prepare for closing of TDC
22
Winning People & Culture
Value Champion
Step-Change Productivity
Focused Technology
Choices
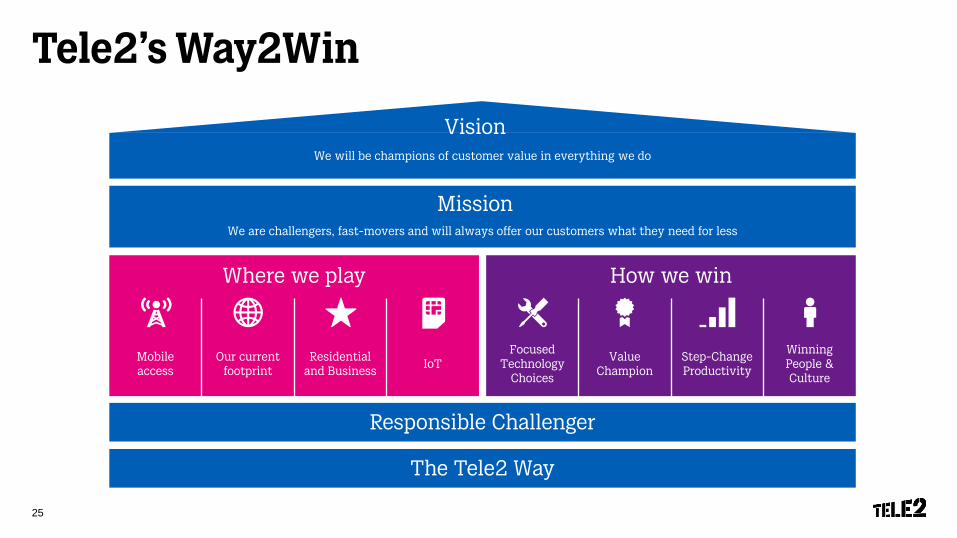
Tele2’s Way2Win
The Tele2 Way
We are challengers, fast-movers and will always offer our customers what they need for less
We will be champions of customer value in everything we do
How we win
Focused Technology
Choices
Value Champion
Step-Change Productivity
Winning People & Culture
Vision
Mission
Where we play
Mobile access
Our current footprint
Residential and Business
IoT
Responsible Challenger
25
THEEND


![Q2 FY16 Investor Presentation [Company Update]](https://img.pdfslide.tips/doc/110x75/577ca4cd1a28abea748b45f8/q2-fy16-investor-presentation-company-update.jpg)