Embed Size (px)
Citation preview
Results for 1-6/2015August 20, 2015

20.8.2015 2
Q2 in BriefA Strong Performance
Occupancy remained strong at 94.1* (93.5)%
Net sales up 11.3% & EBITDA up 17.8%
EBITDA margin at 56.4 (53.3)%
Service revenues up 18.1%
Non-recurring income of EUR 5.4 million
Strong cash of EUR 98.7 million*) 10,000 m² under renovation and 8,500 m² of unoccupied but rented space
20.8.2015 3
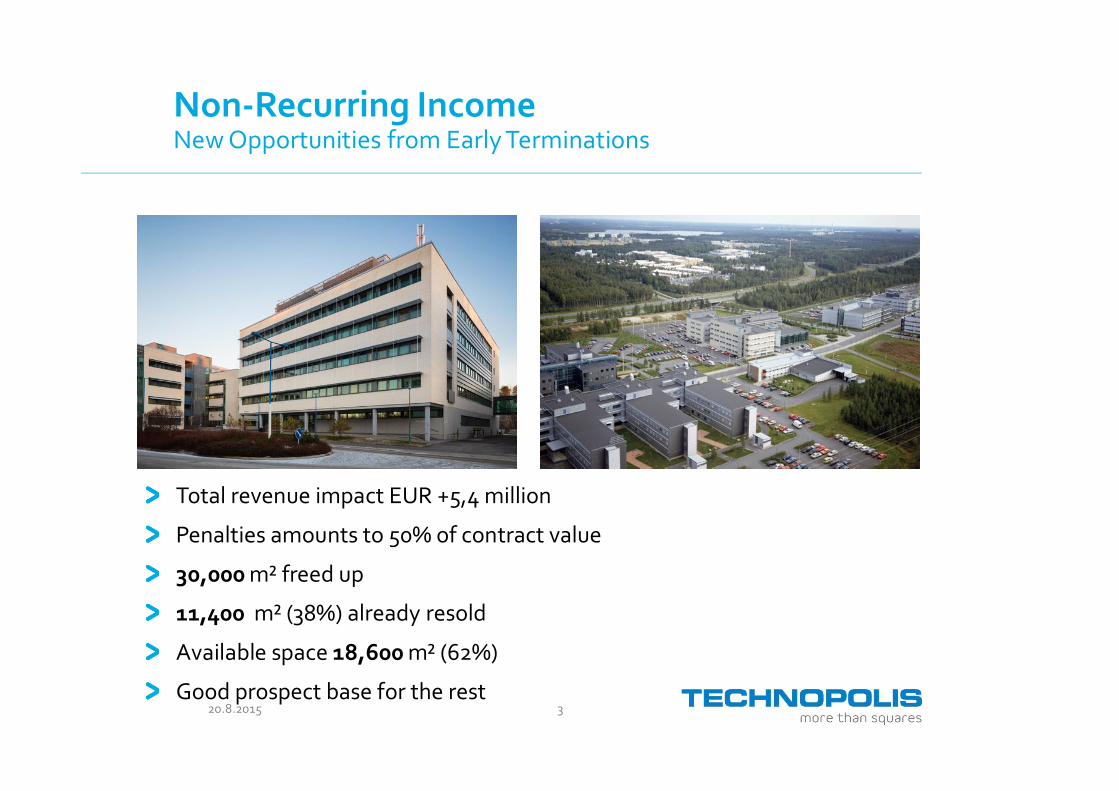
Non-Recurring IncomeNew Opportunities from Early Terminations
Total revenue impact EUR +5,4 million
Penalties amounts to 50% of contract value
30,000 m² freed up
11,400 m² (38%) already resold
Available space 18,600 m² (62%)
Good prospect base for the rest

20.8.2015 4
Changes in Fair ValuesModernization & Concept Program Now Complete
Modernization program now complete & will no longer negatively impact fair values
Direct correlation with OCR, customer satisfaction, sales & earnings demonstrated
Investments in infra & concept will continue but will be FV neutral or positive
MarketYieldRelated
OccupancyAssumption
Modernization Projects inProgress
Total
Finland 3.3 0.6 -15.6 0.5 -12.1
Baltic Rim -0.7 -0.2 -3.1 5.9 5.3
Scandinavia 1.2 - -2.4 - -2.7
Total 3.8 0.4 -21.1 1.4 -9.5Changes in EUR million

20.8.2015 5
Concept Investments
Concept investments of EUR 4.9 million in since 2014
Covers restaurants, public areas, signage, conference space, receptions etc.
Minimum standards key to creation of authentic chain operation & scaleadvantages
Before After
Campus: Ohjelmakaari 10 , Jyväskylä, Finland

20.8.2015 6
Group Financial Occupancy
80%
85%
90%
95%
100%10 Yr. Avg.
94.8%Q2/1594.1%
20.8.2015 7
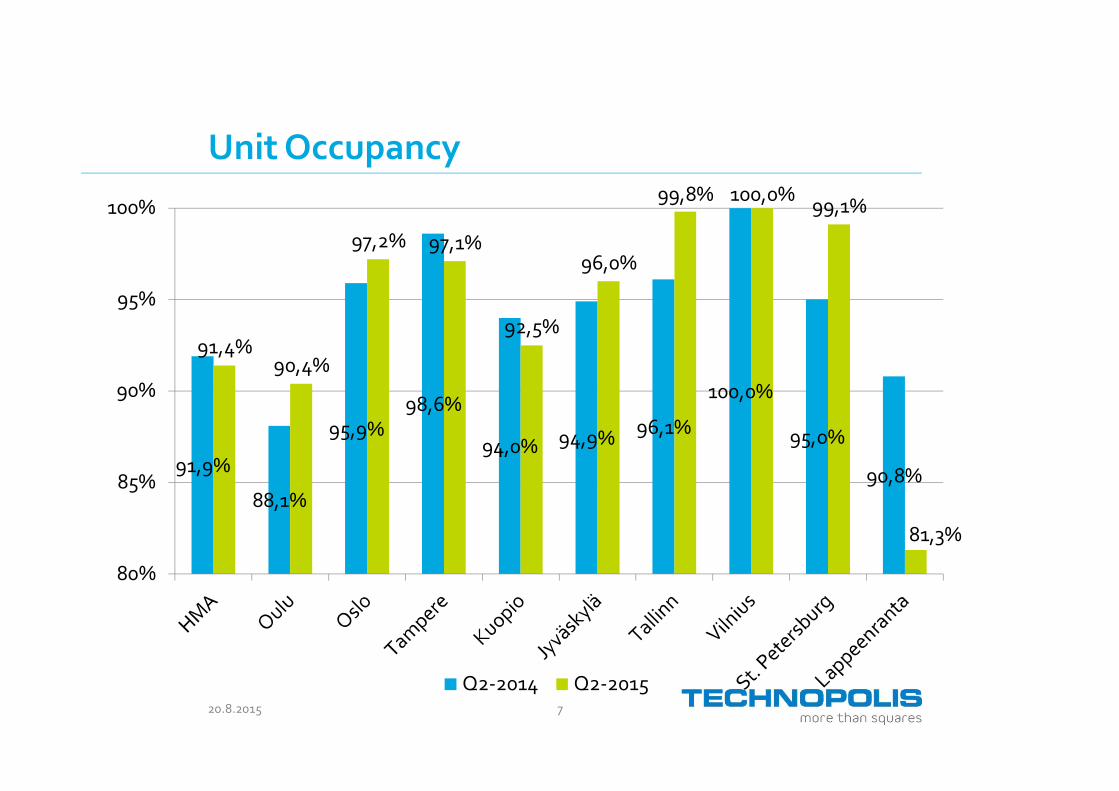
Unit Occupancy
91,9%
88,1%
95,9%98,6%
94,0% 94,9% 96,1%
100,0%
95,0%
90,8%
91,4%90,4%
97,2% 97,1%
92,5%
96,0%
99,8% 100,0% 99,1%
81,3%
80%
85%
90%
95%
100%
Q2-2014 Q2-2015
20.8.2015 8
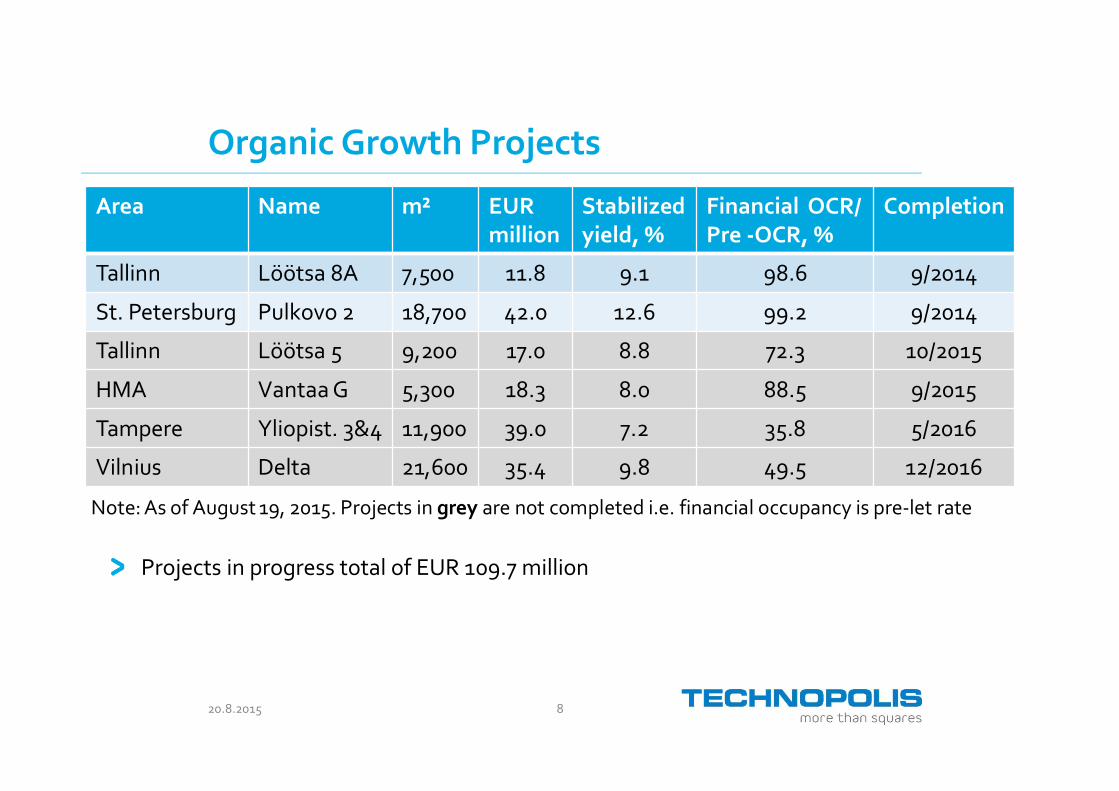
Area Name m² EURmillion
Stabilizedyield, %
Financial OCR/Pre -OCR, %
Completion
Tallinn Löötsa 8A 7,500 11.8 9.1 98.6 9/2014
St. Petersburg Pulkovo 2 18,700 42.0 12.6 99.2 9/2014
Tallinn Löötsa 5 9,200 17.0 8.8 72.3 10/2015
HMA Vantaa G 5,300 18.3 8.0 88.5 9/2015
Tampere Yliopist. 3&4 11,900 39.0 7.2 35.8 5/2016
Vilnius Delta 21,600 35.4 9.8 49.5 12/2016
Organic Growth Projects
Projects in progress total of EUR 109.7 million
Note: As of August 19, 2015. Projects in grey are not completed i.e. financial occupancy is pre-let rate
20.8.2015 9
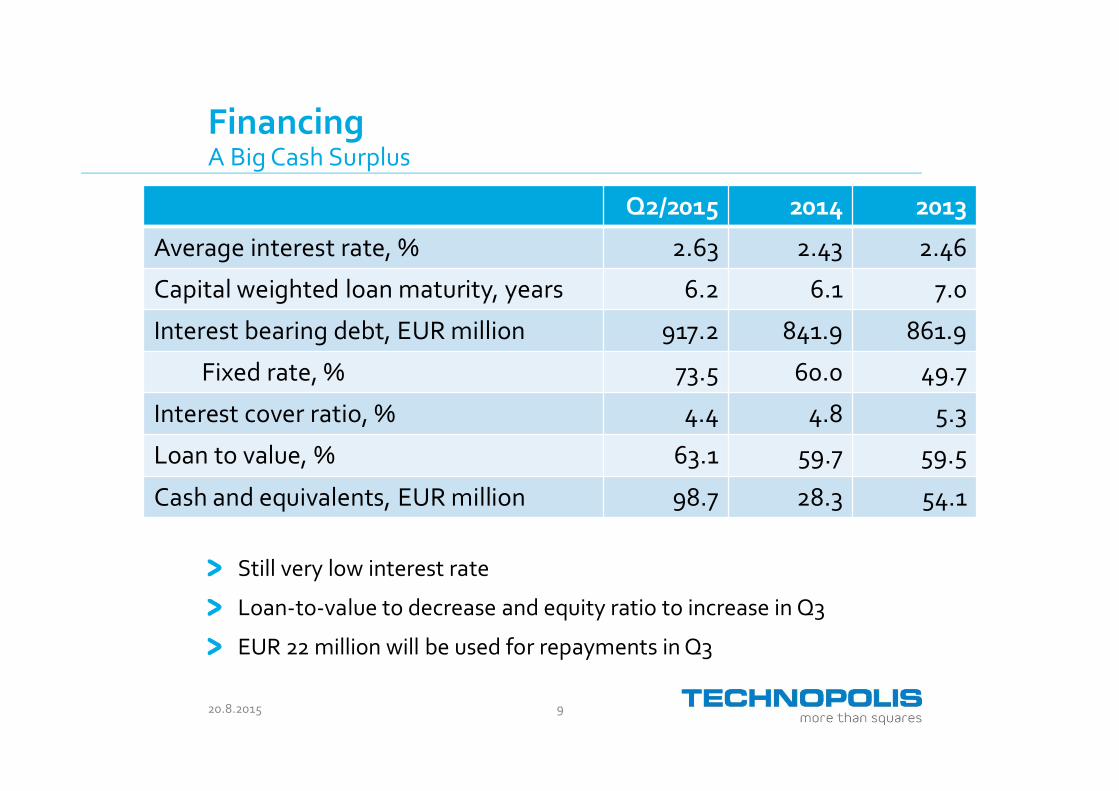
FinancingA Big Cash Surplus
Q2/2015 2014 2013
Average interest rate, % 2.63 2.43 2.46
Capital weighted loan maturity, years 6.2 6.1 7.0
Interest bearing debt, EUR million 917.2 841.9 861.9
Fixed rate, % 73.5 60.0 49.7
Interest cover ratio, % 4.4 4.8 5.3
Loan to value, % 63.1 59.7 59.5
Cash and equivalents, EUR million 98.7 28.3 54.1
Still very low interest rate
Loan-to-value to decrease and equity ratio to increase in Q3
EUR 22 million will be used for repayments in Q3
20.8.2015 10
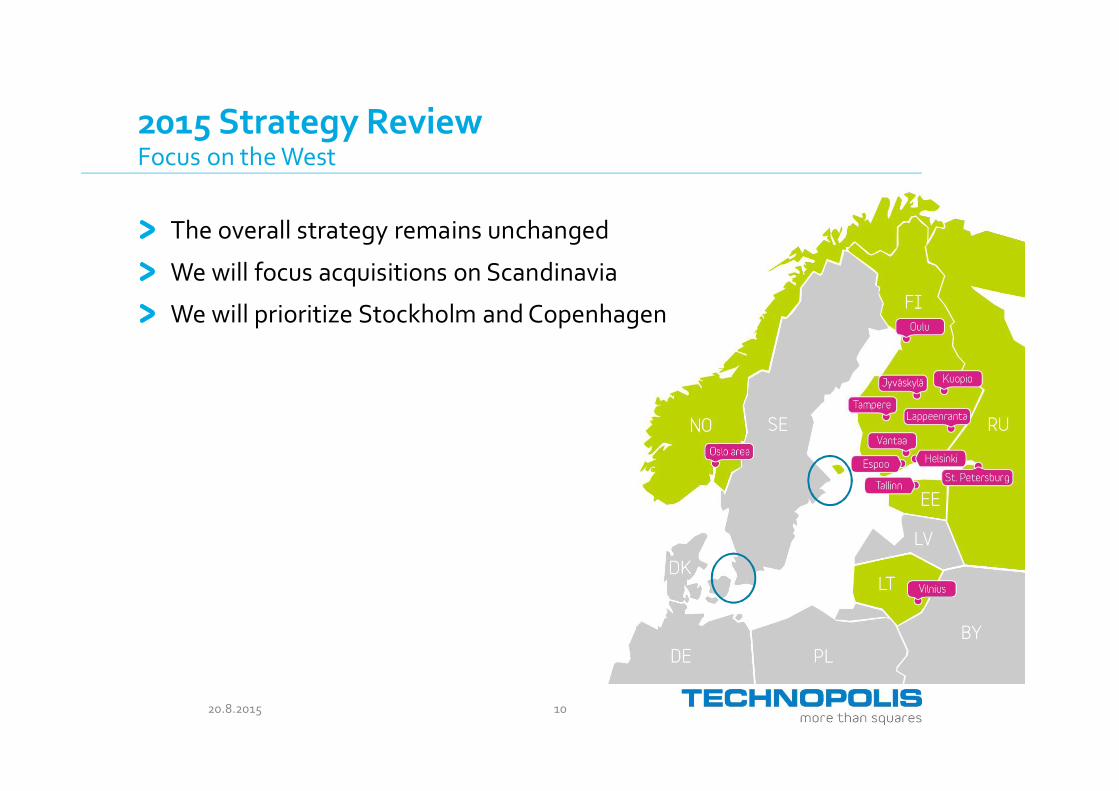
2015 Strategy ReviewFocus on the West
The overall strategy remains unchanged
We will focus acquisitions on Scandinavia
We will prioritize Stockholm and Copenhagen
20.8.2015 11
2015-2020 Strategic Financial Targets
Average net sales and EBITDA 10% p.a. (previously 15%)
Service penetration at least 15% by 2020 (2014 penetration: 10.5%)*
5.5% return on capital employed p.a. (previously 6%)
Equity ratio above 35% over the cycle (unchanged)* Like-for-like
20.8.2015 12
Looking Ahead
2015 growth guidance:
On June 12, 2015, the company updated its 2015 growth forecast, callingfor net sales to grow 4-6% and EBITDA to grow 5-7%.
We’re sticking with this guidance for now.
Appendices: Additional Data
20.8.2015 14
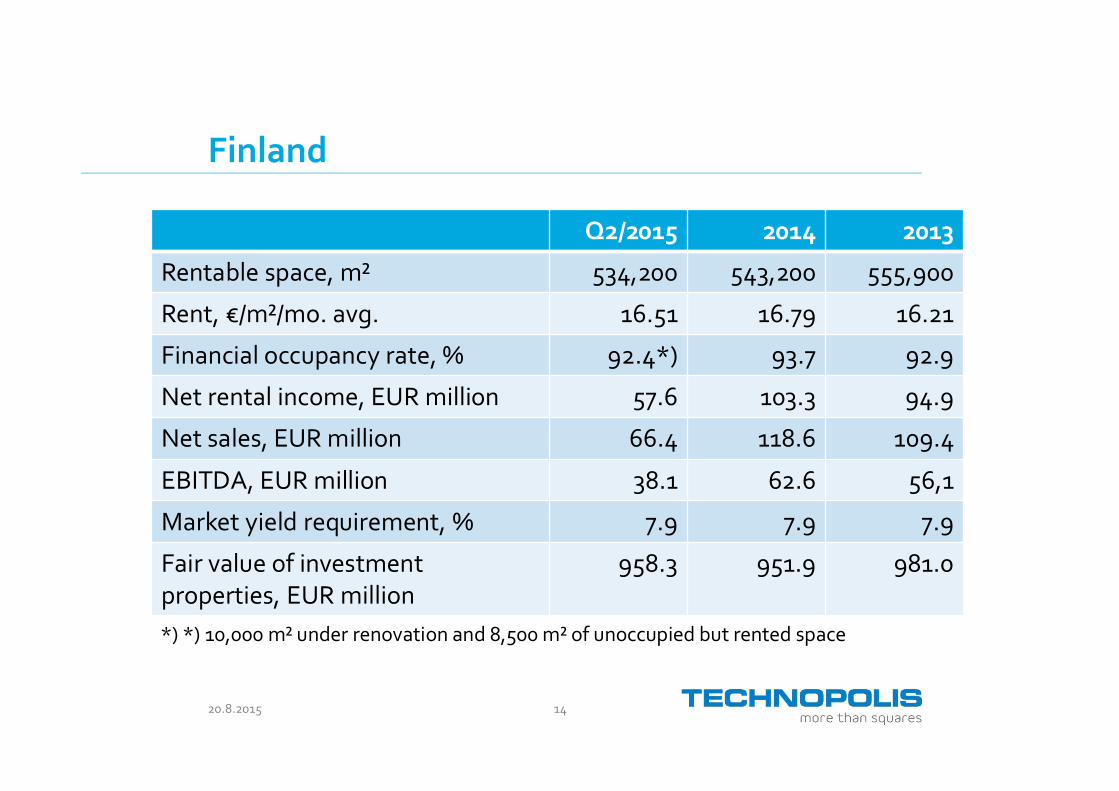
Finland
Q2/2015 2014 2013
Rentable space, m² 534,200 543,200 555,900
Rent, €/m²/mo. avg. 16.51 16.79 16.21
Financial occupancy rate, % 92.4*) 93.7 92.9
Net rental income, EUR million 57.6 103.3 94.9
Net sales, EUR million 66.4 118.6 109.4
EBITDA, EUR million 38.1 62.6 56,1
Market yield requirement, % 7.9 7.9 7.9
Fair value of investmentproperties, EUR million
958.3 951.9 981.0
*) *) 10,000 m² under renovation and 8,500 m² of unoccupied but rented space

20.8.2015 15
Baltic Rim
Q2/2015 2014 2013
Rentable space, m² 139,100 135,800 119,500
Rent, €/m²/mo. avg.*) 14.42 14.00 15.04
Financial occupancy rate, % 99.6 98.4 99.1
Net rental income, EUR million 12.5 23.6 15.3
Net sales, EUR million 13.2 24.9 15.9
EBITDA, EUR million 7.1 13.4 7.6
Market yield requirement, % 8.9 8.7 9.0
Fair value of investmentproperties, EUR million
245.1 224.7 212.4

20.8.2015 16
Scandinavia
Q2/2015 2014 2013 *)
Rentable space, m² 64,800 63,000 71,400
Rent, €/m²/mo. avg. 22.05 22.03 21.16
Financial occupancy rate, % 97.2 95.6 89.5
Net rental income, EUR million 9.1 18.0 1.0
Net sales, EUR million 9.5 18.2 1.0
EBITDA, EUR million 4.9 12.0 0.6
Market yield requirement, % 6.3 6.4 6.5
Fair value of investmentproperties, EUR million
207.1 201.8 217.0
*) December 11-31, 2013
20.8.2015 17
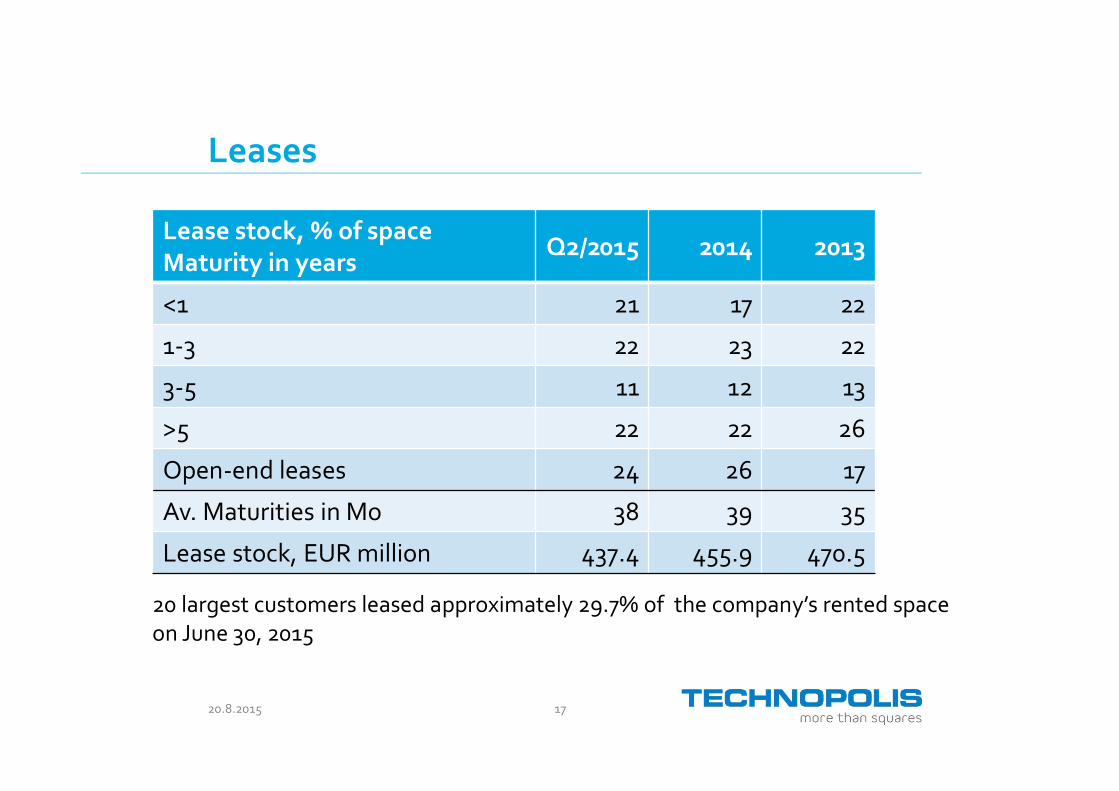
Leases
Lease stock, % of spaceMaturity in years
Q2/2015 2014 2013
<1 21 17 22
1-3 22 23 22
3-5 11 12 13
>5 22 22 26
Open-end leases 24 26 17
Av. Maturities in Mo 38 39 35
Lease stock, EUR million 437.4 455.9 470.5
20 largest customers leased approximately 29.7% of the company’s rented spaceon June 30, 2015
20.8.2015 18
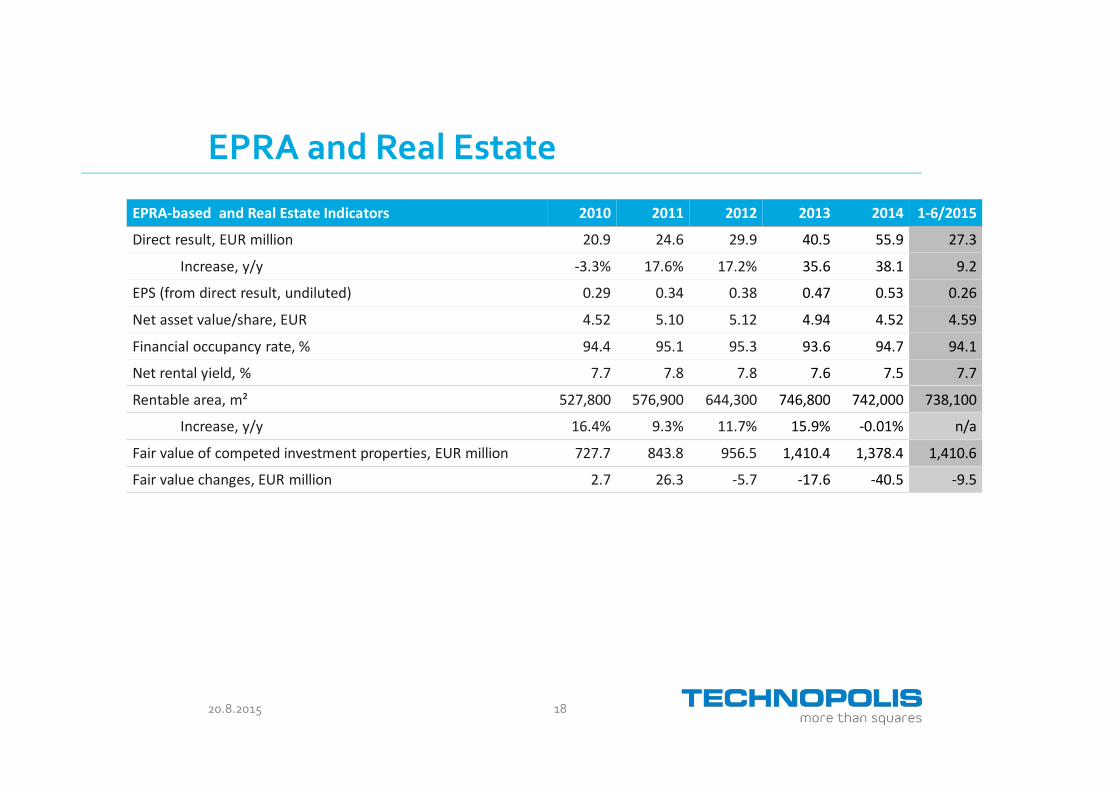
EPRA and Real Estate
EPRA-based and Real Estate Indicators 2010 2011 2012 2013 2014 1-6/2015
Direct result, EUR million 20.9 24.6 29.9 40.5 55.9 27.3
Increase, y/y -3.3% 17.6% 17.2% 35.6 38.1 9.2
EPS (from direct result, undiluted) 0.29 0.34 0.38 0.47 0.53 0.26
Net asset value/share, EUR 4.52 5.10 5.12 4.94 4.52 4.59
Financial occupancy rate, % 94.4 95.1 95.3 93.6 94.7 94.1
Net rental yield, % 7.7 7.8 7.8 7.6 7.5 7.7
Rentable area, m² 527,800 576,900 644,300 746,800 742,000 738,100
Increase, y/y 16.4% 9.3% 11.7% 15.9% -0.01% n/a
Fair value of competed investment properties, EUR million 727.7 843.8 956.5 1,410.4 1,378.4 1,410.6
Fair value changes, EUR million 2.7 26.3 -5.7 -17.6 -40.5 -9.5
20.8.2015 19
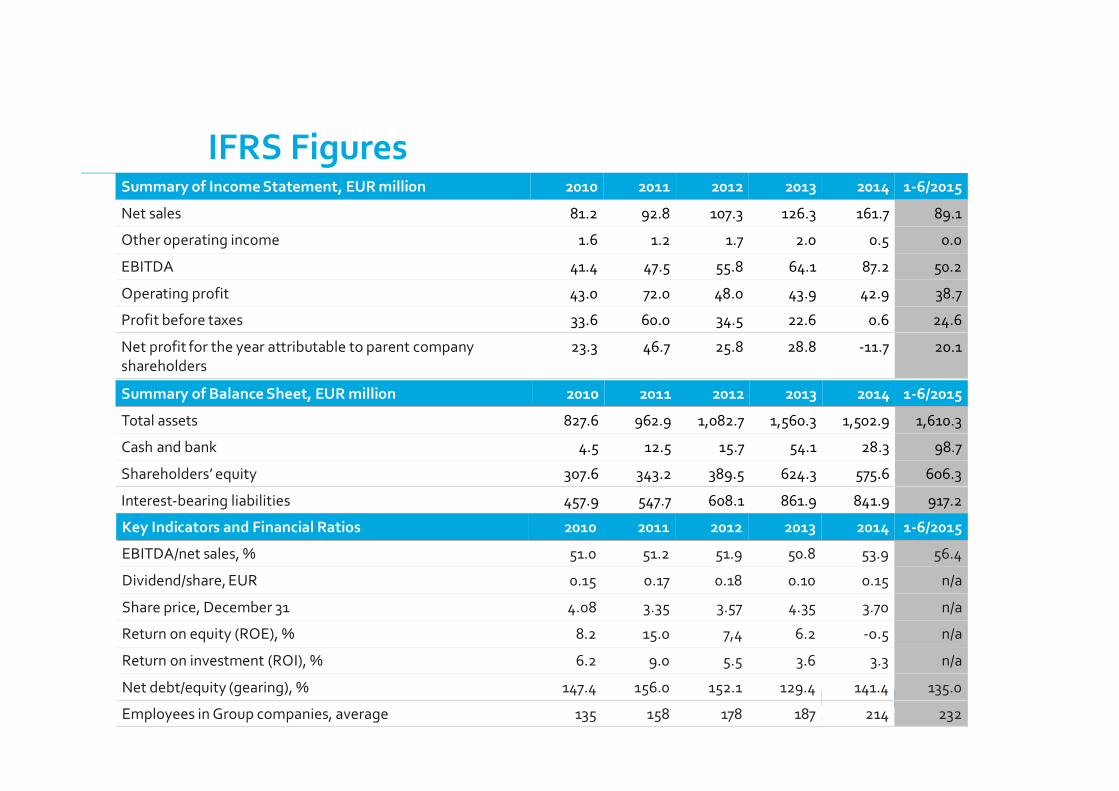
IFRS FiguresSummary of Income Statement, EUR million 2010 2011 2012 2013 2014 1-6/2015
Net sales 81.2 92.8 107.3 126.3 161.7 89.1
Other operating income 1.6 1.2 1.7 2.0 0.5 0.0
EBITDA 41.4 47.5 55.8 64.1 87.2 50.2
Operating profit 43.0 72.0 48.0 43.9 42.9 38.7
Profit before taxes 33.6 60.0 34.5 22.6 0.6 24.6
Net profit for the year attributable to parent companyshareholders
23.3 46.7 25.8 28.8 -11.7 20.1
Summary of Balance Sheet, EUR million 2010 2011 2012 2013 2014 1-6/2015
Total assets 827.6 962.9 1,082.7 1,560.3 1,502.9 1,610.3
Cash and bank 4.5 12.5 15.7 54.1 28.3 98.7
Shareholders’ equity 307.6 343.2 389.5 624.3 575.6 606.3
Interest-bearing liabilities 457.9 547.7 608.1 861.9 841.9 917.2
Key Indicators and Financial Ratios 2010 2011 2012 2013 2014 1-6/2015
EBITDA/net sales, % 51.0 51.2 51.9 50.8 53.9 56.4
Dividend/share, EUR 0.15 0.17 0.18 0.10 0.15 n/a
Share price, December 31 4.08 3.35 3.57 4.35 3.70 n/a
Return on equity (ROE), % 8.2 15.0 7,4 6.2 -0.5 n/a
Return on investment (ROI), % 6.2 9.0 5.5 3.6 3.3 n/a
Net debt/equity (gearing), % 147.4 156.0 152.1 129.4 141.4 135.0
Employees in Group companies, average 135 158 178 187 214 232
20.8.2015 20
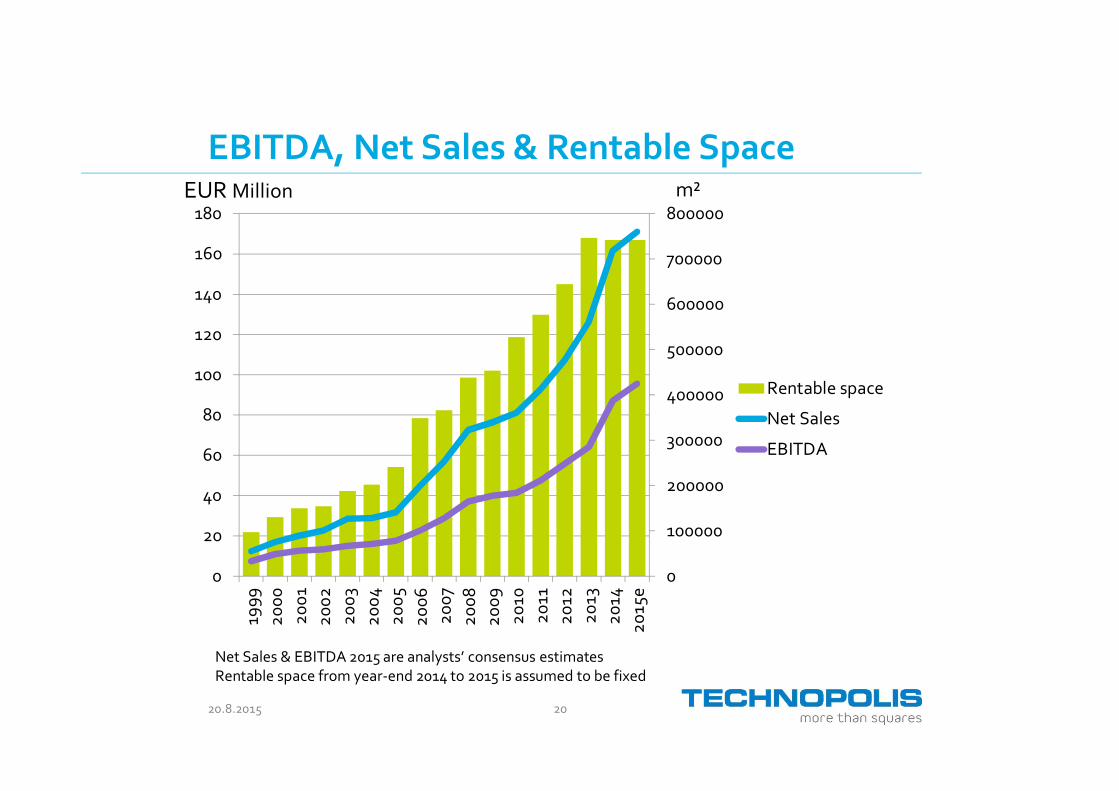
EBITDA, Net Sales & Rentable Spacem²EUR Million
Net Sales & EBITDA 2015 are analysts’ consensus estimatesRentable space from year-end 2014 to 2015 is assumed to be fixed
0
100000
200000
300000
400000
500000
600000
700000
800000
0
20
40
60
80
100
120
140
160
180
1999
2000
2001
2002
2003
2004
2005
2006
2007
2008
2009
2010
2011
2012
2013
2014
2015
e
Rentable space
Net Sales
EBITDA
20.8.2015 21
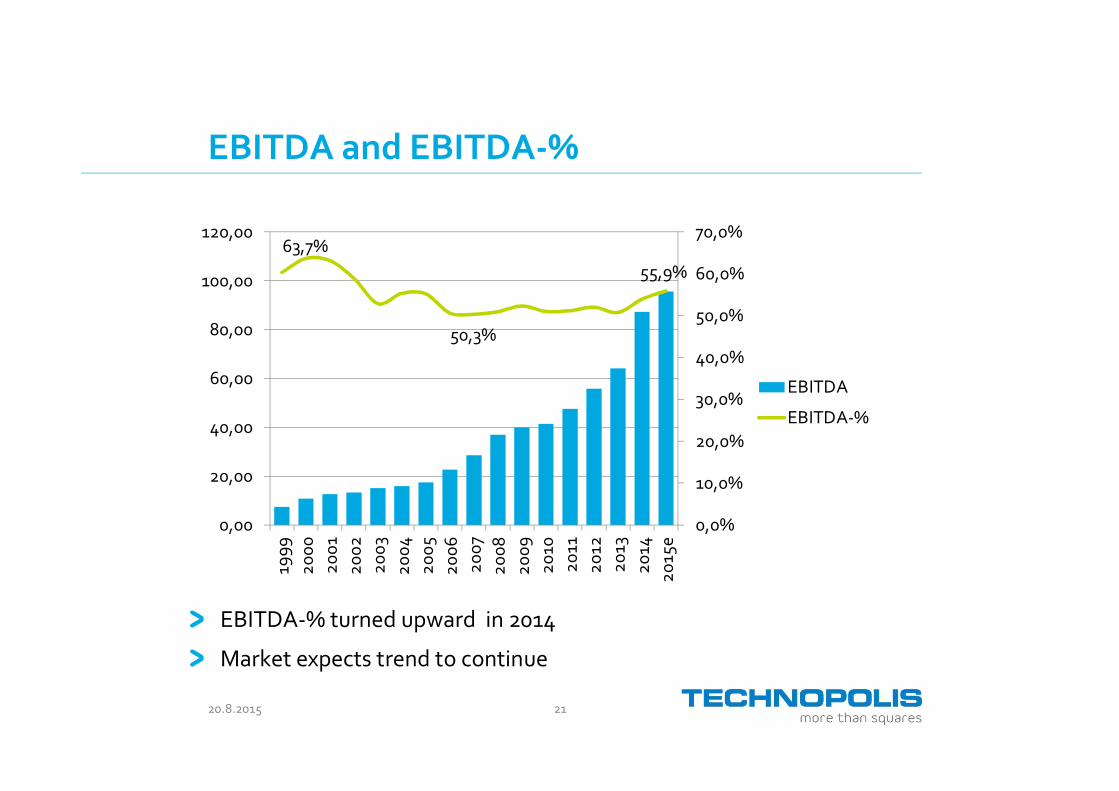
EBITDA and EBITDA-%
EBITDA-% turned upward in 2014
Market expects trend to continue
63,7%
50,3%
55,9%
0,0%
10,0%
20,0%
30,0%
40,0%
50,0%
60,0%
70,0%
0,00
20,00
40,00
60,00
80,00
100,00
120,00
1999
2000
2001
2002
2003
2004
2005
2006
2007
2008
2009
2010
2011
2012
2013
2014
2015
e
EBITDA
EBITDA-%
20.8.2015 22
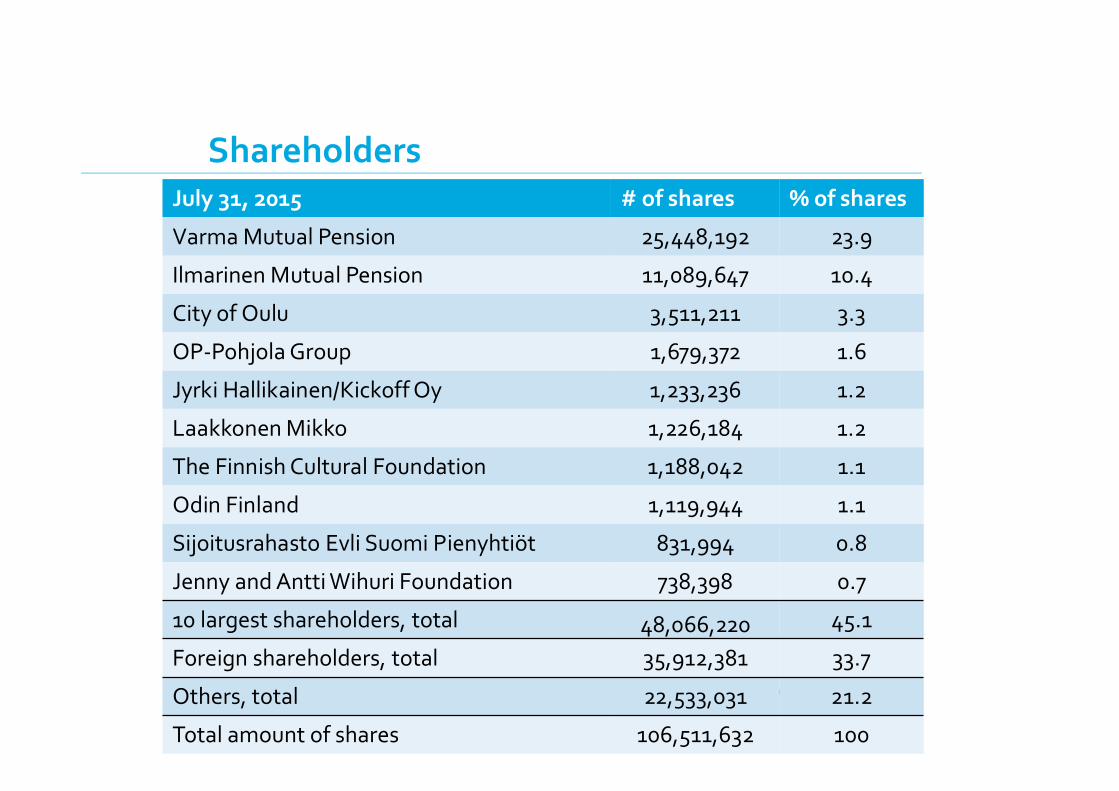
July 31, 2015 # of shares % of shares
Varma Mutual Pension 25,448,192 23.9
Ilmarinen Mutual Pension 11,089,647 10.4
City of Oulu 3,511,211 3.3
OP-Pohjola Group 1,679,372 1.6
Jyrki Hallikainen/Kickoff Oy 1,233,236 1.2
Laakkonen Mikko 1,226,184 1.2
The Finnish Cultural Foundation 1,188,042 1.1
Odin Finland 1,119,944 1.1
Sijoitusrahasto Evli Suomi Pienyhtiöt 831,994 0.8
Jenny and Antti Wihuri Foundation 738,398 0.7
10 largest shareholders, total 48,066,220 45.1
Foreign shareholders, total 35,912,381 33.7
Others, total 22,533,031 21.2
Total amount of shares 106,511,632 100
Shareholders


![DNO Q2 2010 Presentation[1]](https://img.pdfslide.tips/doc/110x75/577d36791a28ab3a6b932f8d/dno-q2-2010-presentation1.jpg)


![Investor Presentation - Q2 FY 2015-16 [Company Update]](https://img.pdfslide.tips/doc/110x75/577ca7bd1a28abea748c88ad/investor-presentation-q2-fy-2015-16-company-update.jpg)