Embed Size (px)
Citation preview
21 October 2015
Outstanding
Customer
Experience
Transcom
Third quarter 2015 results presentation Johan Eriksson, President & CEO
Ulrik Englund, CFO
2
• Positive profitability trend continued
- 4.1% EBIT margin excluding €1.0m non-recurring item in Q3 2015 (provision for class
action lawsuit in North America)
- EBIT margin on a 12-month rolling basis is steadily improving towards our mid-term
target of at least five percent
• Organic growth despite Transcom’s decision not to bid for renewed
public sector agreement in Italy
- 1.8% organic growth, mainly driven by higher activity with clients in the North Europe
region
- Mid-term organic growth target is at least five percent
• Net debt/EBITDA 0.6 compared to 1.7 in Q3 2014 and 0.3 in Q2 2015
- We saw particularly strong collections at the end of Q2 2015, a situation that has now
normalized
- Target for net debt/EBITDA is maximum 1.0
Key highlights Q3 2015

At a glance
1
4
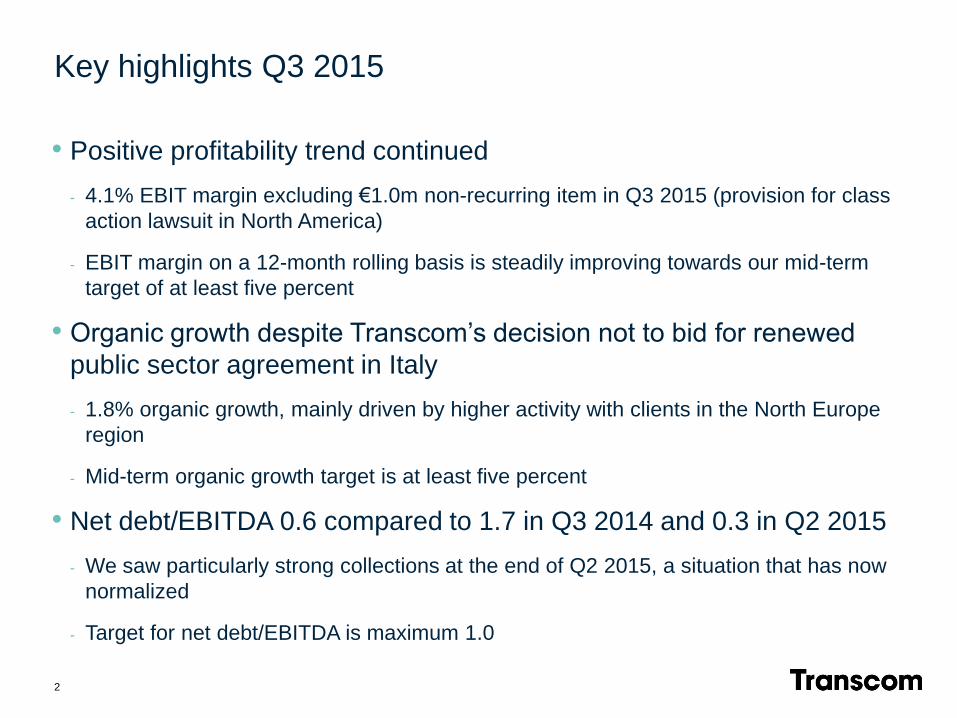
• A global customer experience specialist…
• …employing 30,000 people…
• …representing more than 100 nationalities...
• …operating 54 contact centers, onshore, off-shore and near shore…
• …in 23 countries…
• …delivering services in 33 languages...
• …generating €616.8 million revenue in 2014…
• …with a market cap of SEK 2.1 billion as at September 30, 2015. Listed on Nasdaq Stockholm (Mid Cap segment) under ticker TWW.
Transcom in numbers
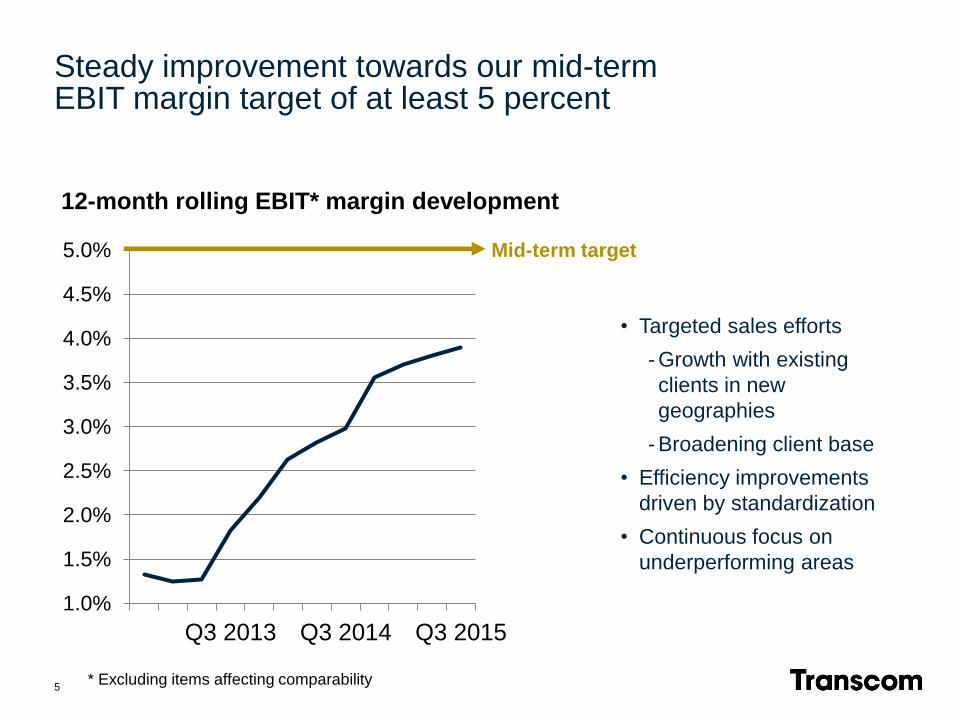
Steady improvement towards our mid-term EBIT margin target of at least 5 percent
1.0%
1.5%
2.0%
2.5%
3.0%
3.5%
4.0%
4.5%
5.0%
Q3 2013 Q3 2014 Q3 2015
5
12-month rolling EBIT* margin development
* Excluding items affecting comparability
Mid-term target
• Targeted sales efforts
- Growth with existing
clients in new
geographies
- Broadening client base
• Efficiency improvements
driven by standardization
• Continuous focus on
underperforming areas
Our performance in Q3 2015
2
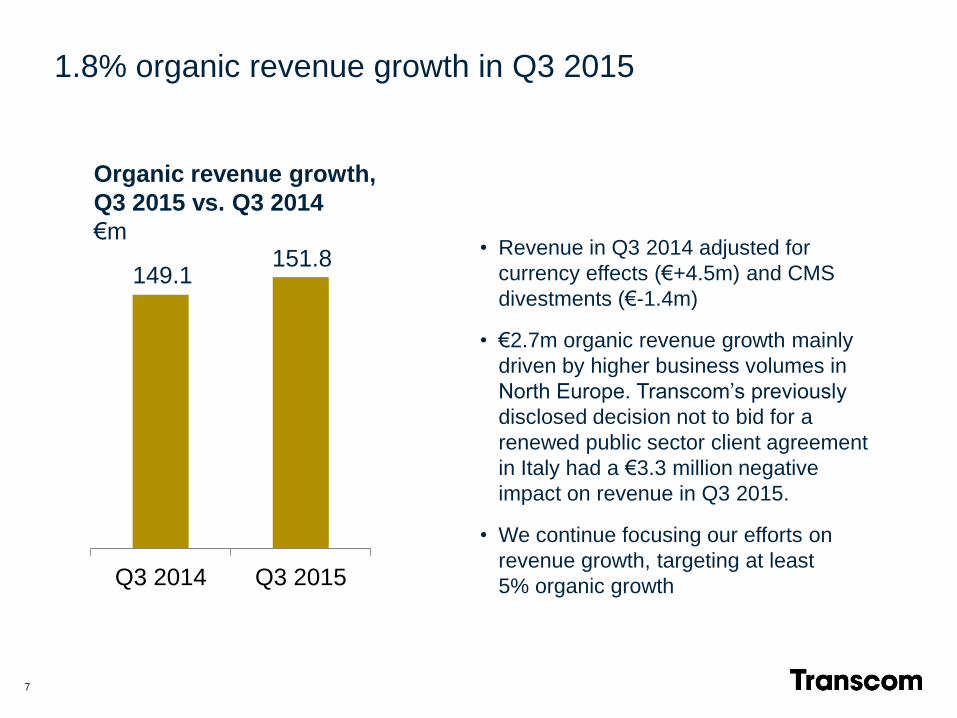
Q3 2014 Q3 2015
7
Organic revenue growth,
Q3 2015 vs. Q3 2014
€m 151.8
149.1
• Revenue in Q3 2014 adjusted for
currency effects (€+4.5m) and CMS
divestments (€-1.4m)
• €2.7m organic revenue growth mainly
driven by higher business volumes in
North Europe. Transcom’s previously
disclosed decision not to bid for a
renewed public sector client agreement
in Italy had a €3.3 million negative
impact on revenue in Q3 2015.
• We continue focusing our efforts on
revenue growth, targeting at least
5% organic growth
1.8% organic revenue growth in Q3 2015
8
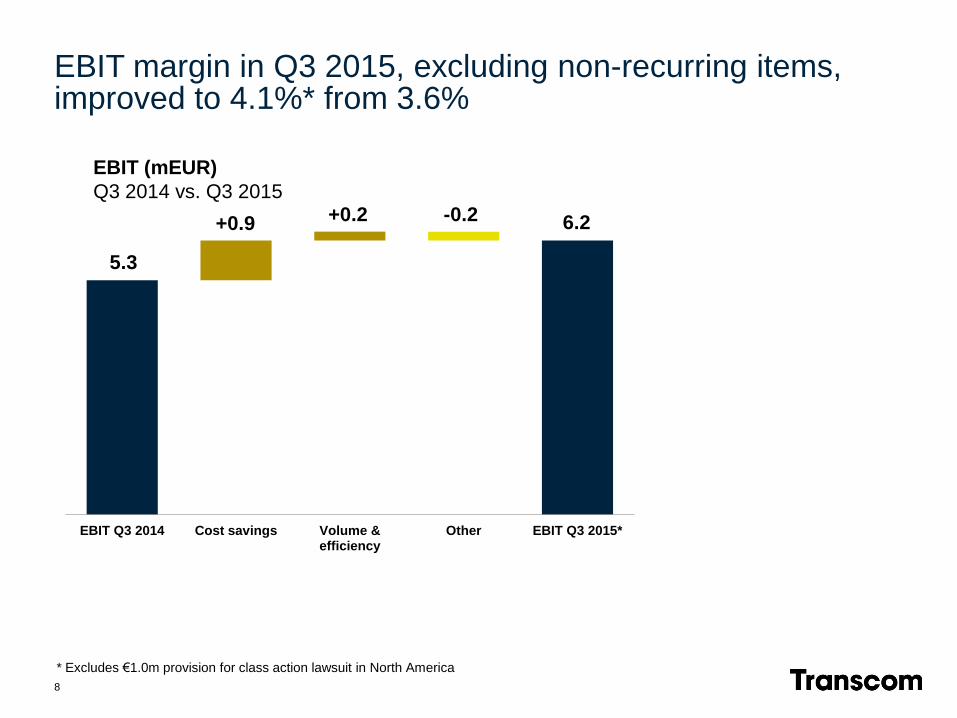
EBIT Q3 2014 Cost savings Volume & efficiency
Other EBIT Q3 2015*
EBIT margin in Q3 2015, excluding non-recurring items, improved to 4.1%* from 3.6%
EBIT (mEUR)
Q3 2014 vs. Q3 2015
5.3
-0.2 +0.2
* Excludes €1.0m provision for class action lawsuit in North America
+0.9 6.2
9
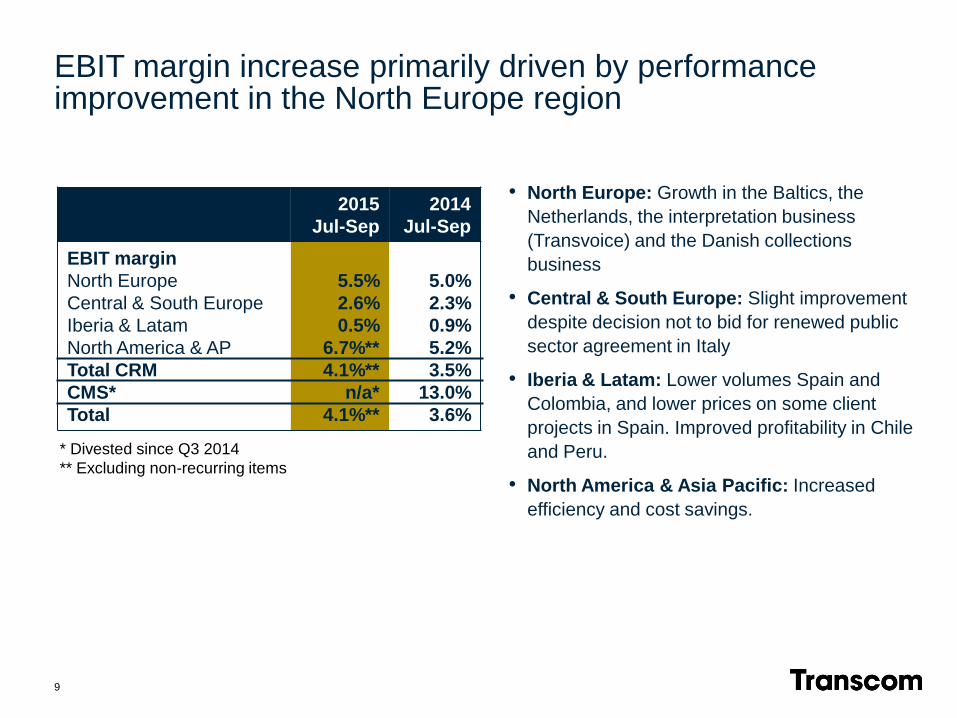
• North Europe: Growth in the Baltics, the
Netherlands, the interpretation business
(Transvoice) and the Danish collections
business
• Central & South Europe: Slight improvement
despite decision not to bid for renewed public
sector agreement in Italy
• Iberia & Latam: Lower volumes Spain and
Colombia, and lower prices on some client
projects in Spain. Improved profitability in Chile
and Peru.
• North America & Asia Pacific: Increased
efficiency and cost savings.
EBIT margin increase primarily driven by performance improvement in the North Europe region
2015
Jul-Sep
2014
Jul-Sep
EBIT margin
North Europe
Central & South Europe
Iberia & Latam
North America & AP
Total CRM
CMS*
Total
5.5%
2.6%
0.5%
6.7%**
4.1%**
n/a*
4.1%**
5.0%
2.3%
0.9%
5.2%
3.5%
13.0%
3.6%
* Divested since Q3 2014
** Excluding non-recurring items
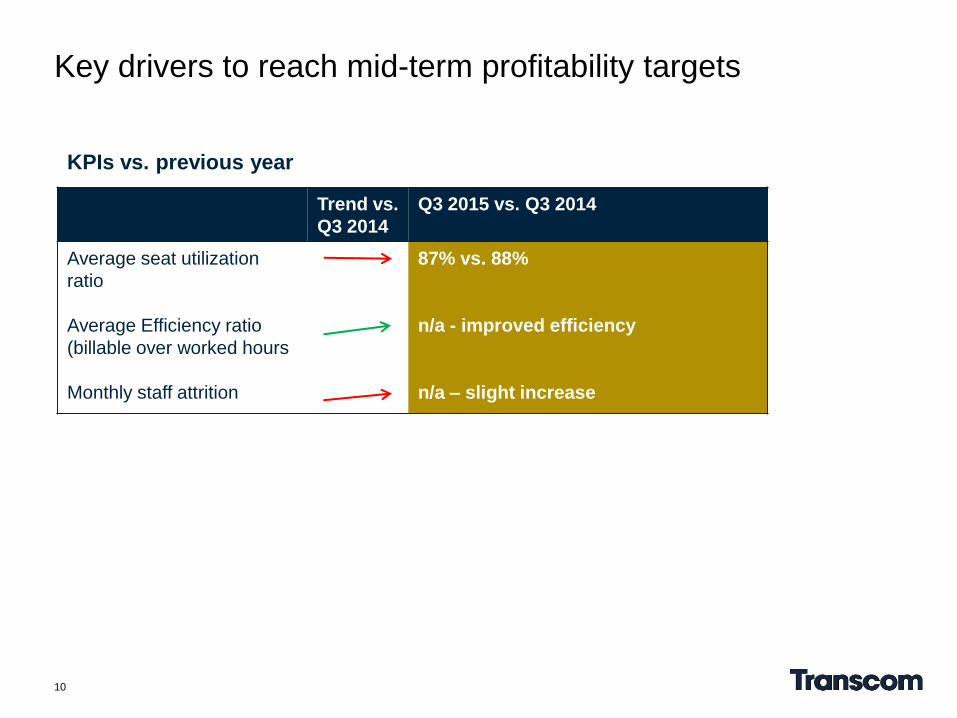
Trend vs.
Q3 2014
Q3 2015 vs. Q3 2014
Average seat utilization
ratio
Average Efficiency ratio
(billable over worked hours
Monthly staff attrition
87% vs. 88%
n/a - improved efficiency
n/a – slight increase
10
KPIs vs. previous year
Key drivers to reach mid-term profitability targets
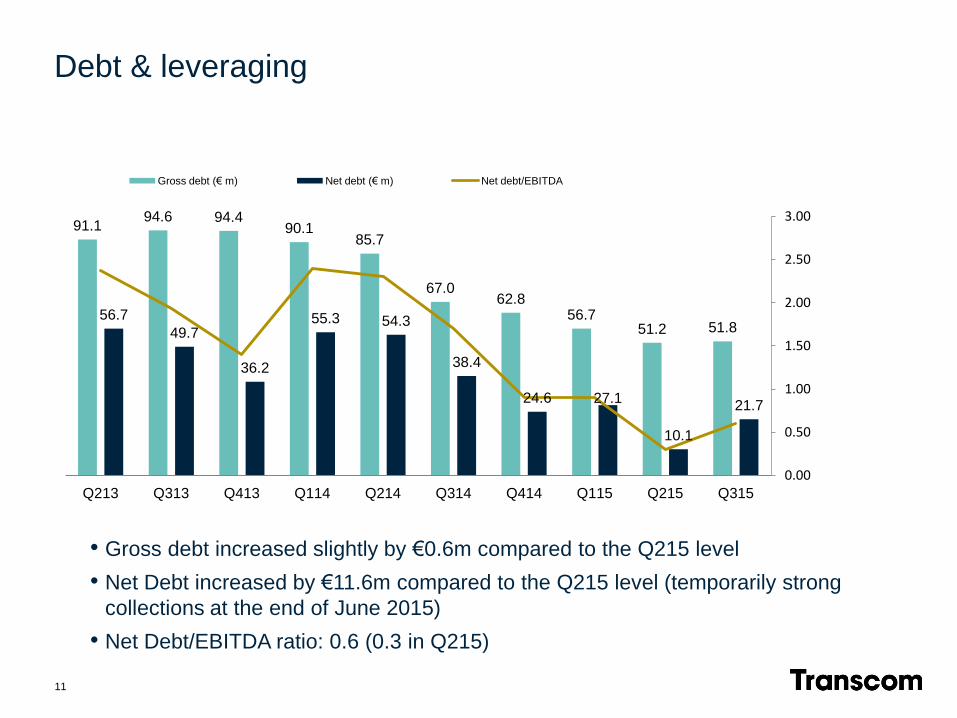
91.1 94.6 94.4
90.1 85.7
67.0 62.8
56.7 51.2 51.8
56.7
49.7
36.2
55.3 54.3
38.4
24.6 27.1
10.1
21.7
0.00
0.50
1.00
1.50
2.00
2.50
3.00
0.0
10.0
20.0
30.0
40.0
50.0
60.0
70.0
80.0
90.0
100.0
Q213 Q313 Q413 Q114 Q214 Q314 Q414 Q115 Q215 Q315
Gross debt (€ m) Net debt (€ m) Net debt/EBITDA
• Gross debt increased slightly by €0.6m compared to the Q215 level
• Net Debt increased by €11.6m compared to the Q215 level (temporarily strong
collections at the end of June 2015)
• Net Debt/EBITDA ratio: 0.6 (0.3 in Q215)
Debt & leveraging
11

3
Going forward – Transcom’s strategic direction
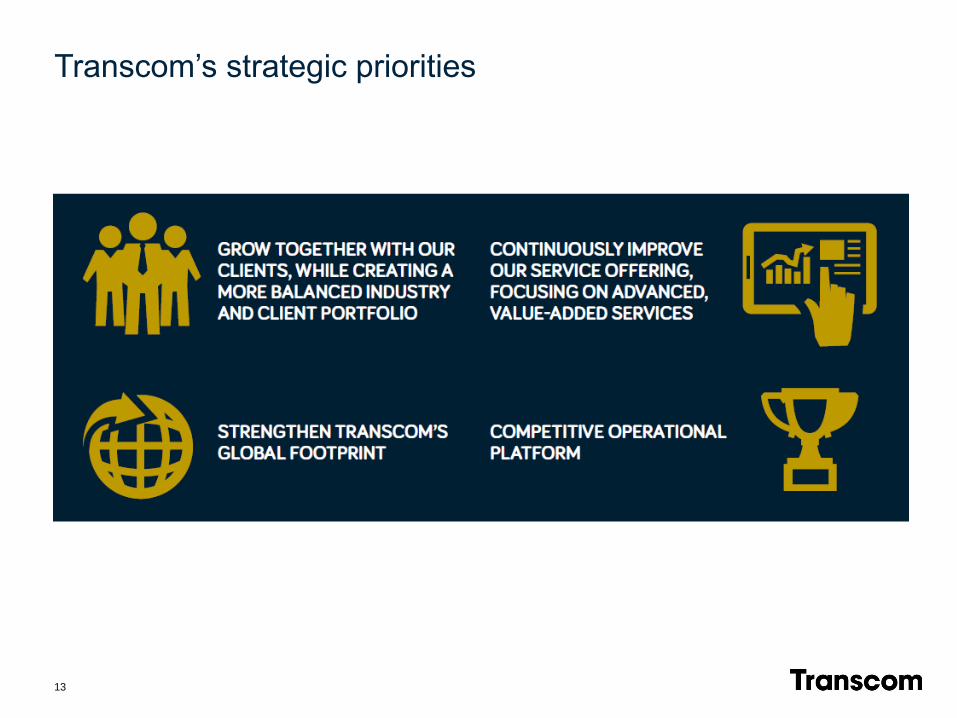
Transcom’s strategic priorities
13
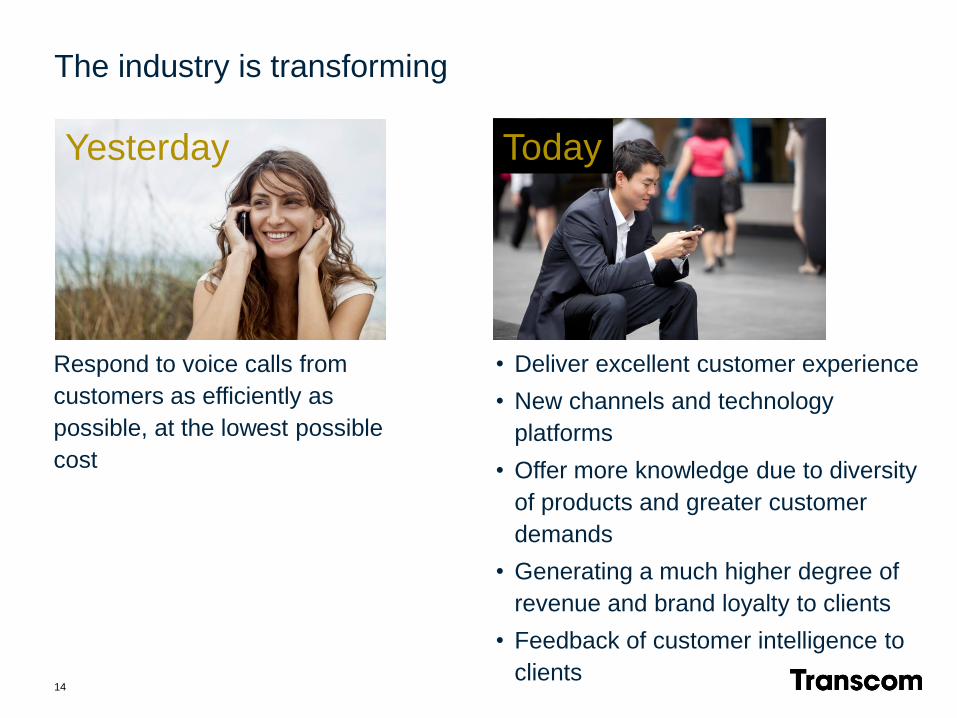
14
Respond to voice calls from
customers as efficiently as
possible, at the lowest possible
cost
The industry is transforming
Yesterday Today
• Deliver excellent customer experience
• New channels and technology
platforms
• Offer more knowledge due to diversity
of products and greater customer
demands
• Generating a much higher degree of
revenue and brand loyalty to clients
• Feedback of customer intelligence to
clients
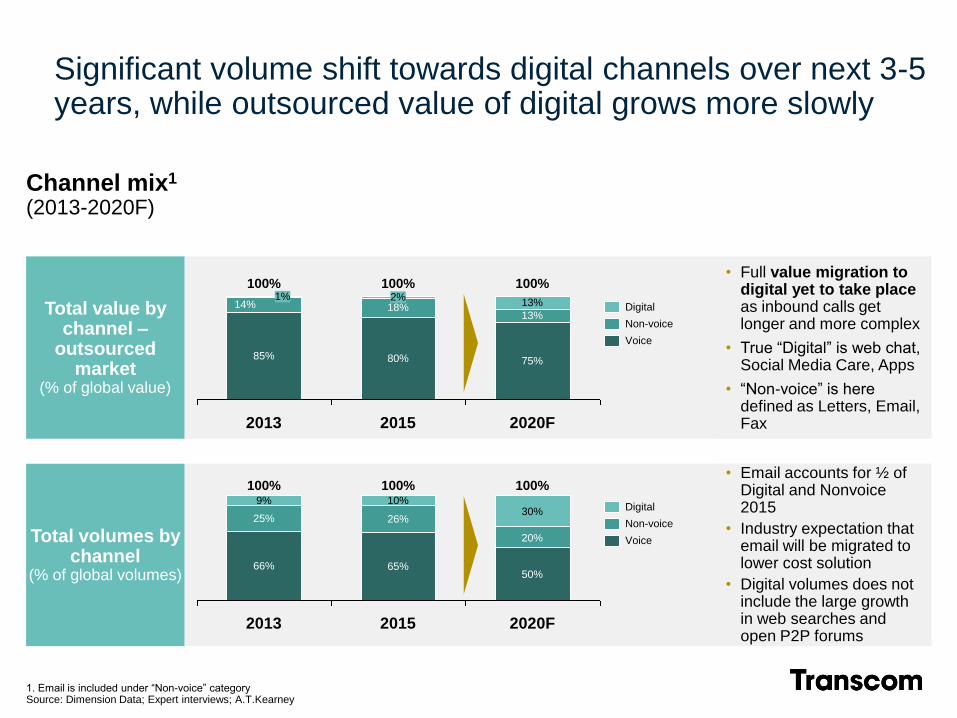
Total value by channel –
outsourced market
(% of global value)
Channel mix1
(2013-2020F)
18% 2%
2013
100%
85%
14% 1%
2020F
100%
75%
13%
13%
2015
100%
80%
Voice
Non-voice
Digital
Total volumes by channel
(% of global volumes)
• Full value migration to digital yet to take place as inbound calls get longer and more complex
• True “Digital” is web chat, Social Media Care, Apps
• “Non-voice” is here defined as Letters, Email, Fax
• Email accounts for ½ of Digital and Nonvoice 2015
• Industry expectation that email will be migrated to lower cost solution
• Digital volumes does not include the large growth in web searches and open P2P forums
20%
2015
100%
65%
2020F
100%
50%
30% 26%
10%
2013
100%
66%
25%
9%
Voice
Digital
Non-voice
1. Email is included under “Non-voice” category Source: Dimension Data; Expert interviews; A.T.Kearney
Significant volume shift towards digital channels over next 3-5 years, while outsourced value of digital grows more slowly

2013 2014 2015e
Share of non-voice services
% of Transcom’s revenue
16
Transcom continues to increase its delivery of non-voice services
• Focus on expanding non-voice services with major clients in several geographies
• Increase in worked non-voice minutes with major clients
• Increased requirements for chat 21%
26%
14%
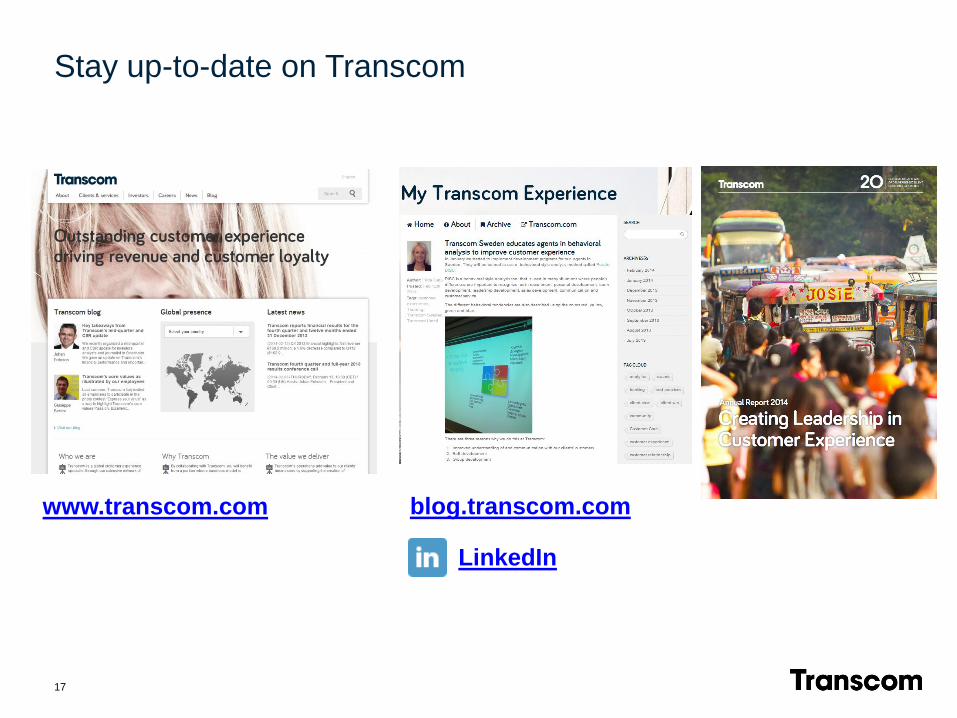
17
www.transcom.com blog.transcom.com
Stay up-to-date on Transcom

Thank you! Questions?
![ASMI Investor presentation Q3-2013 … PowerPoint - ASMI_Investor presentation Q3-2013_1November2013.pptx [Read-Only]](https://img.pdfslide.tips/doc/110x75/5bd6338909d3f2623e8d4ac3/asmi-investor-presentation-q3-2013-powerpoint-asmiinvestor-presentation-q3-20131november2013pptx.jpg)


![Q3 FY16 Investor Presentation [Company Update]](https://img.pdfslide.tips/doc/110x75/577c7ba71a28abe0549822b5/q3-fy16-investor-presentation-company-update.jpg)