Embed Size (px)
Citation preview


𝜌𝐷𝑣
𝐷𝑡= −𝛻𝑝 + 𝛻 ∙ 𝜯 + 𝒇

Data
Acquisition &
modelling
Collaboration
and
visualisation
Analysis &
data mining
Dissemination
& sharing
Archiving and
preserving
fourthparadigm.org
Data-intensive Research

X-Info
• Data ingest
• Managing a petabyte
• Common schema
• How to organize it
• How to reorganize it
• How to share with others
• Query and Vis tools
• Building and executing models
• Integrating data and Literature
• Documenting experiments
• Curation and long-term
preservation
The Generic Problems
Experiments &Instruments
Simulations
Literature
Other Archives
facts
facts
facts
facts
Questions
Answers

All Scientific Data Online
• Many disciplines overlap and use
data from other sciences.
• Internet can unify all literature and
data
• Go from literature to computation to
data back to literature.
• Information at your fingertips –
For everyone, everywhere
• Increase Scientific Information
Velocity
• Huge increase in Science
Productivity
(From Jim Gray’s last talk)
Literature
Derived and recombined data
Raw data

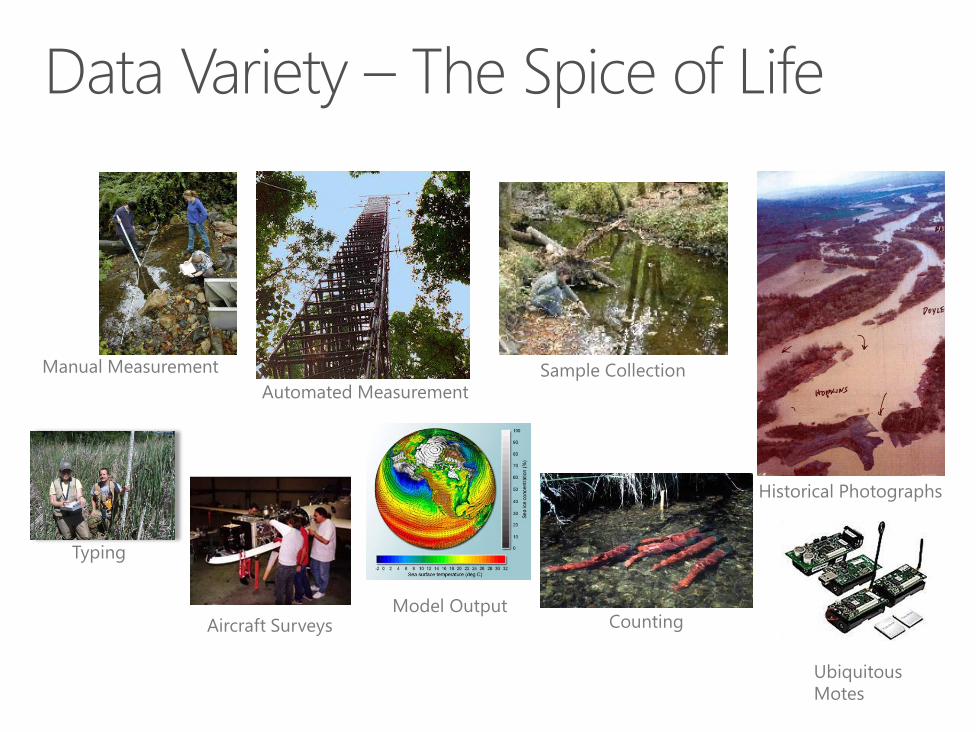
Manual Measurement
Automated Measurement
Sample Collection
Historical Photographs
Counting
Ubiquitous
Motes
Aircraft SurveysModel Output
Typing

Monitoring
Collation
Quality assurance
Aggregation
Analysis
Reporting
Forecasting
Distribution
Done poorly,but a few notablecounter-examples
Done poorly to moderately,not easy to find
Sometimes done well,generally discoverable and available,
but could be improved
Integration
(I. Zaslavsky & CSIRO, BOM, WMO)

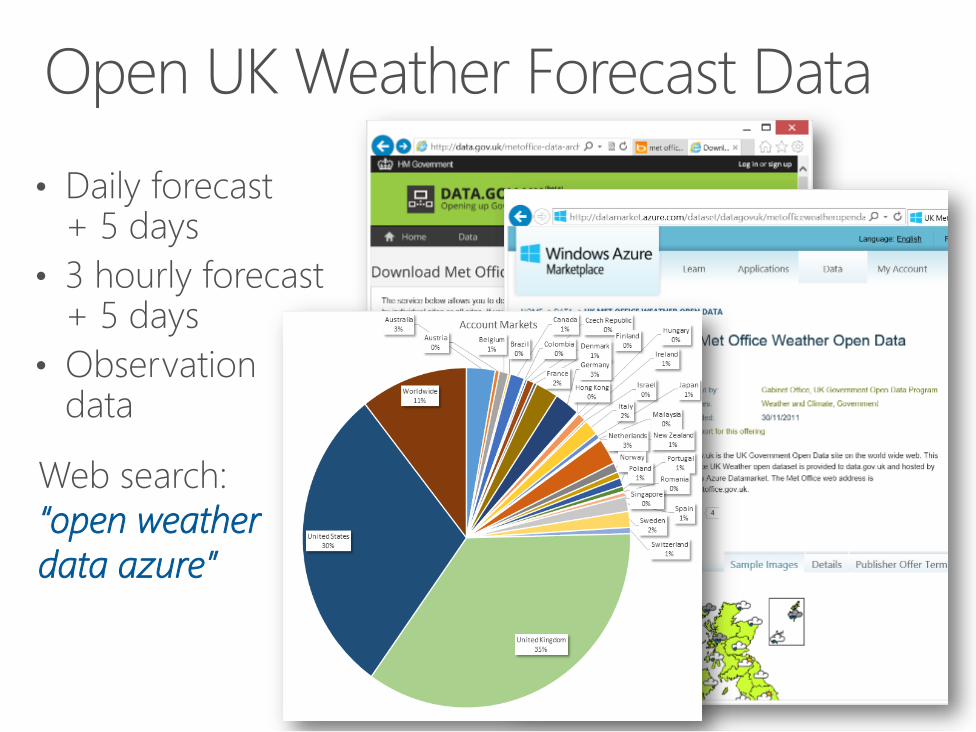
Web search:
“open weather
data azure”

Water depth map of London(~130km2). Storm event of 60
minutes and 100 years return period
http://www.ncl.ac.uk/ceser/researchprogramme
/informatics/citycaturbanfloodmodel/


Parker MacCready: Univ. of Washington
Rob Fatland:, Wenming Ye, Nels Oscar, Microsoft Research

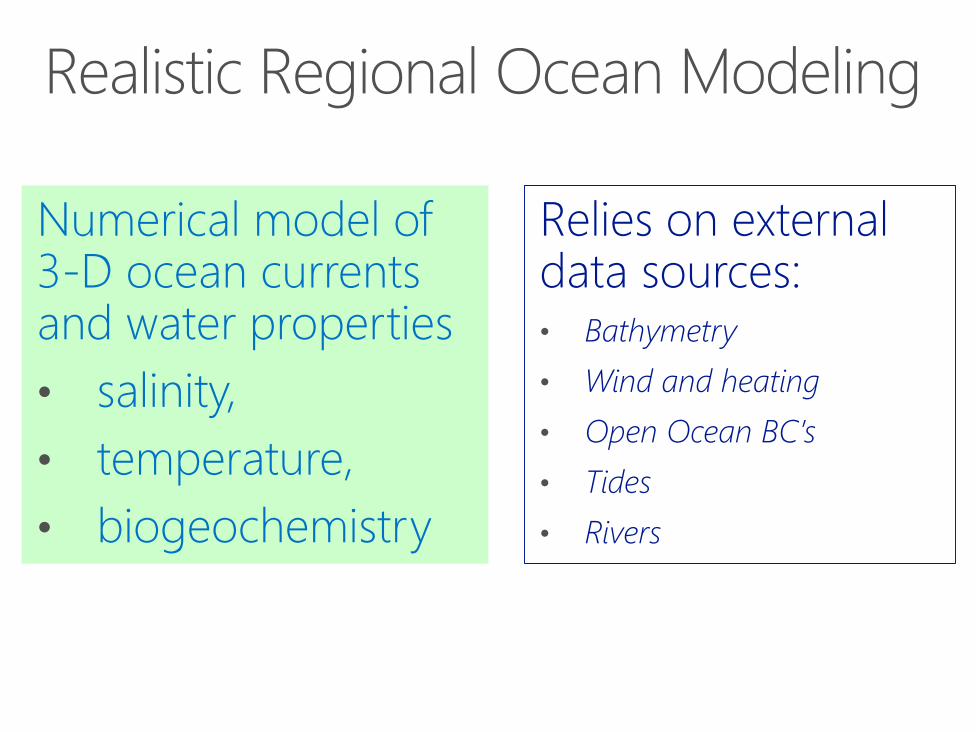
Numerical model of 3-D ocean currents and water properties
• salinity,
• temperature,
• biogeochemistry
Relies on external data sources:• Bathymetry
• Wind and heating
• Open Ocean BC’s
• Tides
• Rivers

Model Validation Comparisons are done to an extensive suite of in-situ observations
• sea surface height
12 NOAA tide gauges
• salinity and temperature
over 2000 CTD casts from ECOHAB, RISE,
DOE, NANOOS, Hood Canal, IOS, King
County, and NOAA
• velocity and moored S,T
7 coastal ADCP / CTD moorings from the
ECOHAB and RISE projects, 2 moorings
from IOS

Interactive 3-D Model Visualization using WorldWide Telescope, Narwhal and Layerscape
www.layerscape.org

EH4 32 m
Figure from SA Siedlecki, UW/JISAO; Observations from Connolly et al., 2010
Validation: Dissolved Oxygen & Temperature

LiveOcean: System Architecture
HPClinux 150 cores
ForecastNetCDF files
LiveOcean
Server• Post Processing
• Pre-make .png “views”
• Archive NetCDF files
• API for web sites
• Admin.js
• Client.jsBlob Storage:
Forecast Copy
Science UserpythonAzure Table:
Log Info
Admin
Website
Client Websitehttp://mappable.azurewebsites.
net/liveocean/
Rivers
USGS
Atmosphere
UW WRFOcean
HYCOM

http://mappable.azurewebsites.net/liveocean


CloudBig data
Aggregation
MachineLearning Analytics

The Cloud
democratizes
access to scale &
economies of scale

Commodity at Scale


Research Cloud Ecosystem

Use laptops &
desktop computers
Overwhelmed by
data
Finding analysis
ever more difficult;
sharing even
harder
www.azure4research.com