Embed Size (px)
Citation preview
App Annie 2015 Retrospective
App Annie 2015 RetrospectiveRESEARCH & ANALYSIS
App Annie 2015 Retrospective
Use Restrictions
2
The information, materials, data, images, graphics and
other components of this report ("Report") are
copyrighted and owned or controlled by App Annie
unless otherwise noted. Unauthorized use of the
Report may violate copyright, trademark and/or other
intellectual property rights of App Annie and may give
rise to a claim for damages and/or be a criminal
offense. The Report may not be modified, copied,
distributed, republished, uploaded, posted, decompiled
or transmitted in any way, without the prior written
consent of App Annie.
App Annie 2015 Retrospective
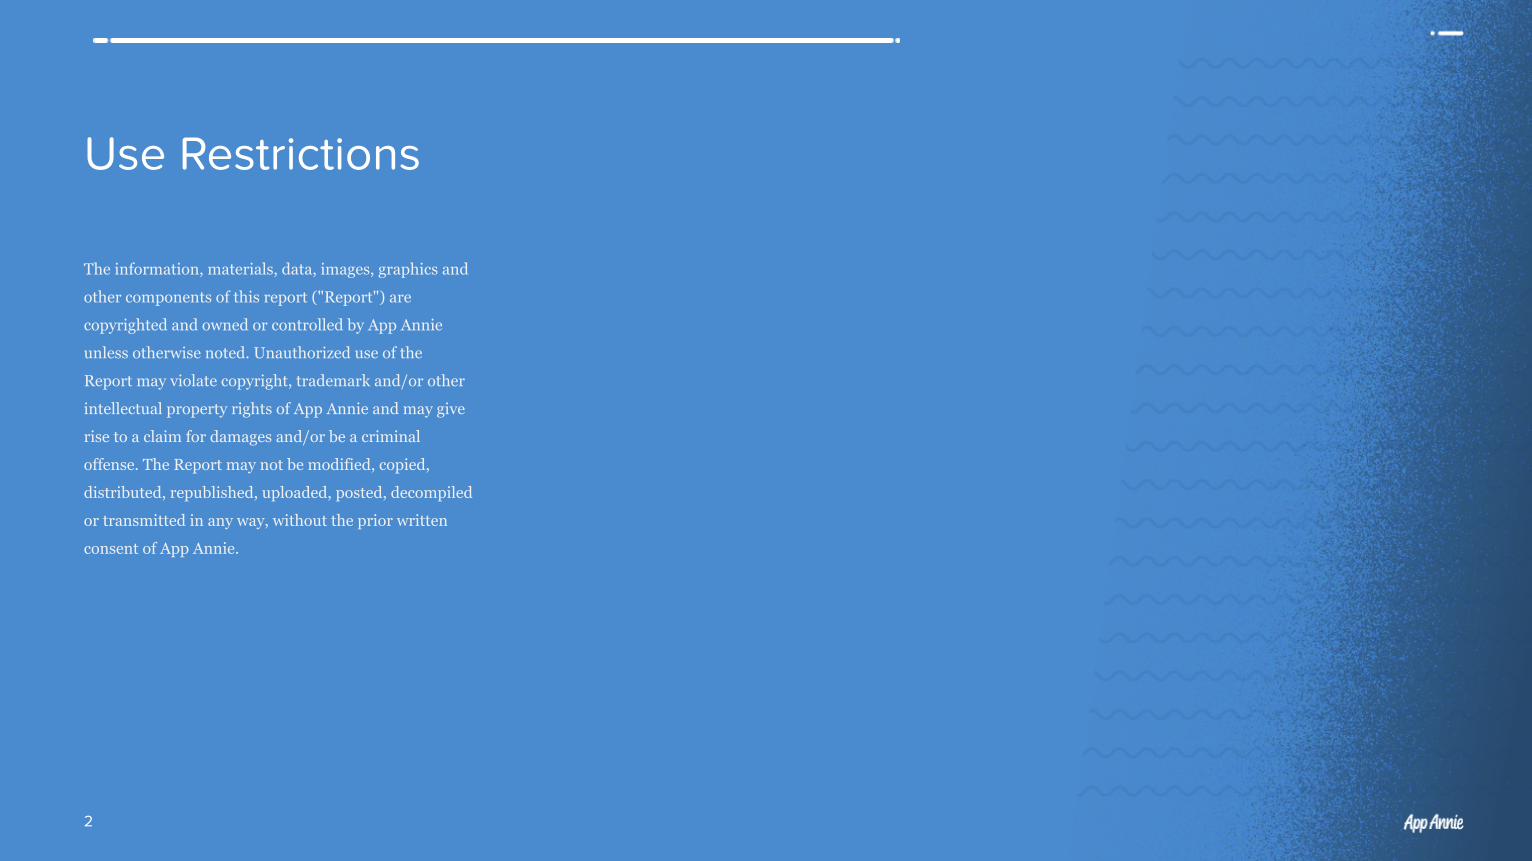
EXECUTIVE SUMMARY 4
TOP APP TRENDS IN 2015
App Platform and Market Developments 6
Platform Trends Continue: Google Play Downloads 2x iOS While IOS Widens Revenue Lead
7
iOS in China: China Passes US in Downloads, While China Revenue Doubles From 2014
9
Google Play Passes iOS in US Downloads 11
Emerging Markets Continue to Climb 14
Expanding App Monetization and Market Sectors 16
Ridesharing and Taxi Apps: Usage Explodes Around the World
17
Dating App Monetization: The Year of Tinder 20
Video Streaming: Battle Lines Are Drawn 22
Music Streaming: Revenue Soars for Global and Local Players
24
M-Commerce: Shoppers Choose the Small Screen 26
The Evolution of Mobile Gaming 29
Competition Increases in Games and Maturity Cycles Accelerate
30
Core Games in Asia: Immersive Games Draw Players’ Time and Money
32
The Next Frontier for Apps 34
Wearables and TV Take Off 35
TOP APPS AND COMPANIES BY COUNTRY 39
Worldwide 40
Brazil 43
China 46
France 49
Germany 52
Japan 55
Russia 58
South Korea 60
United Kingdom 63
United States 66
TOP COUNTRIES AND CATEGORIES 69
Top Countries 70
Top Categories 71
ABOUT APP ANNIE 72
Table of Contents
App Annie 2015 Retrospective
© App Annie 2016
EXECUTIVE SUMMARYThe combination of mobile devices, faster networks and apps
has created a world with a rich array of ways in which these
technologies serve us. From communication and sharing to
productivity and utilities to entertainment and commerce,
apps are where we increasingly live and manage our lives. In
2015, there were a number of developments across the app
ecosystem that demonstrated how apps have become central
to what we do and how we do it.
In App Annie’s 2015 Retrospective, we showcase the most
relevant and impactful developments that we believe define
and redefine what the app market is. Not surprisingly, the
platform developments — namely Google Play’s expanded
download lead and Apple’s iOS gains in revenue share — are
at the center of this ecosystem and set the stage for the
competitive dynamics we will see in the year ahead. From
iOS’s amazing success in China to Google Play’s driving force
across so many emerging markets, we see how these two
platforms are shaping categories, monetization and new
device platforms.
This past year proved to be an exciting year for app
monetization. In fact, in-app purchases (IAPs) as a share of
app store revenue continued to grow in 2015 as subscription
revenue made incredible gains, thanks to strong demand for
video, music and dating apps.
4
RESEARCH & ANALYSIS
App Annie 2015 Retrospective
© App Annie 2016
But the monetization story is even richer than the gains in
subscriptions, as we witnessed mobile-first ridesharing and
commerce apps have breakout years across the globe.
Games continue to drive huge volumes of downloads and store
revenue, yet we are seeing new trends emerge as indie
developers challenge top publishers. Furthermore, there is a
maturity that has developed in the mobile games market that
is accelerating how quickly games reach the end of their
lifecycle — making it even more important for publishers to
find success for new games faster than ever.
Finally, we cannot talk about apps and 2015 without talking
about the next frontier for apps: namely TV and wearables.
This past year we saw the expansion of iOS into wholly new
device categories — watches and TV accessories — and the
extension of iOS with the iPad Pro. With the debut of the
Apple Watch and the watchOS, wearables were further
legitimized as a key form factor for the platform players. And
we believe watches are just the beginning. By September,
Apple’s Tim Cook proclaimed, “We believe the future of TV is
apps.” This long-standing money-making screen holds huge
opportunity for app sales and advertising in 2016 and beyond.
As we look out into 2016, we expect more exciting
developments to unfold across the app ecosystem — in fact,
you can check out our 2016 Predictions. But make no mistake
about it: As apps eat the world, they will continue to
meaningfully transform how we work and play and how
companies engage and monetize customers.
5
App Annie 2015 Retrospective
App Platformand Market
Developments
App Annie 2015 Retrospective
© App Annie 2016
Platform Trends Continue: Google Play Downloads 2x iOSWhile iOS Widens Revenue Lead
Google Play saw a huge increase in downloads
driven by first-time device owners in emerging
markets. This growth opens up avenues for
publishers to create new markets by targeting
unmet needs of users in a given region. Meanwhile,
app revenue increased notably year over year as
iOS cemented its position as app store revenue
king. Of particular note, growth in iOS revenue
helped drive monetization for new sectors of the
app economy, proving to an increasing number of
businesses that mobile and apps are a viable and
vital route for profitable growth.
In last year’s Retrospective, we noted a 60% download lead
of Google Play over iOS. This widened to nearly 100% in
2015. This massive disparity could mark the beginning of
major changes in mobile marketing, including substantial
increases of Android’s share of mobile ad spend.
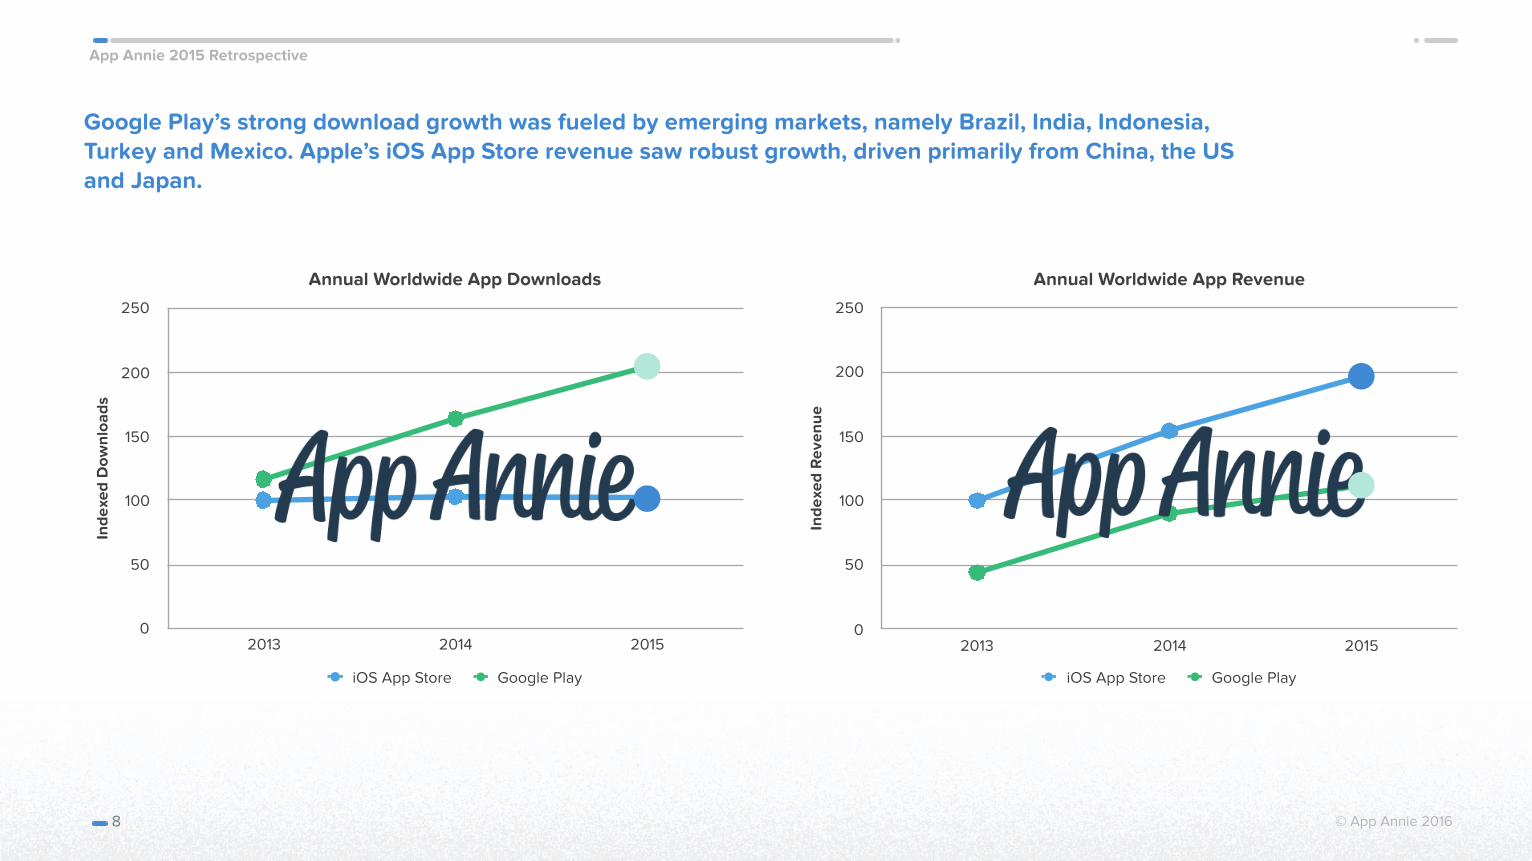
Google Play’s significant increase in worldwide downloads
came largely from emerging markets (a fact that we noted in
our Q1 2015 and Q3 2015 Market Index reports); the top
five contributors were Brazil, India, Indonesia, Turkey and
Mexico. Together, these countries accounted for nearly half
of Google Play’s year-on-year download growth.
Both stores made considerable gains in revenue, although
iOS continued to outpace Google Play.
iOS enjoyed strong growth driven by China, the US and
Japan, which contributed nearly 90% of the iOS App Store’s
year-on-year revenue growth. China saw especially
impressive growth in App Store revenue, a fact that Apple
called out in its Q4 earnings call. The relative contributions
of games and apps did not deviate from their 2014 levels;
games continued to contribute 90% of revenue on Google
Play and 75% on the iOS App Store.
There is still significant room for growth in the mobile app
economy. Device penetration remains relatively low in a
number of emerging markets, and future increases are likely
to bolster download growth. Store revenue will continue to
grow as audiences broaden and monetization options such
as in-app subscriptions gain further traction in the coming
year.
7
App Annie 2015 Retrospective
© App Annie 2016
Google Play’s strong download growth was fueled by emerging markets, namely Brazil, India, Indonesia, Turkey and Mexico. Apple’s iOS App Store revenue saw robust growth, driven primarily from China, the US and Japan.
8
Annual Worldwide App Downloads
Inde
xed
Dow
nloa
ds
0
50
100
150
200
250
2013 2014 2015
iOS App Store Google Play
Annual Worldwide App Revenue
Inde
xed
Rev
enue
0
50
100
150
200
250
2013 2014 2015
iOS App Store Google Play
App Annie 2015 Retrospective
© App Annie 2016
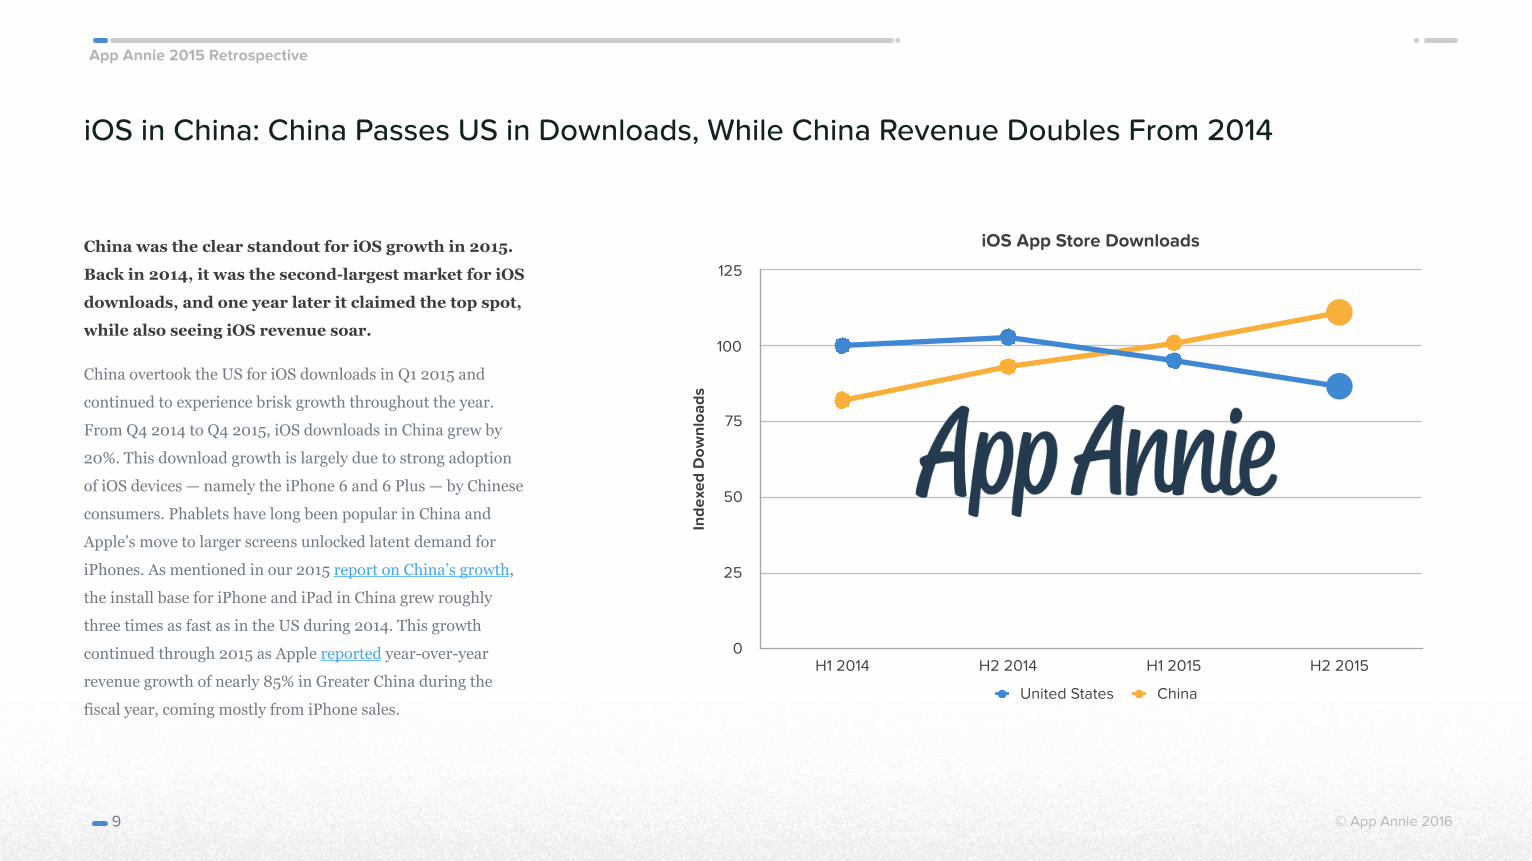
iOS in China: China Passes US in Downloads, While China Revenue Doubles From 2014
China was the clear standout for iOS growth in 2015.
Back in 2014, it was the second-largest market for iOS
downloads, and one year later it claimed the top spot,
while also seeing iOS revenue soar.
China overtook the US for iOS downloads in Q1 2015 and
continued to experience brisk growth throughout the year.
From Q4 2014 to Q4 2015, iOS downloads in China grew by
20%. This download growth is largely due to strong adoption
of iOS devices — namely the iPhone 6 and 6 Plus — by Chinese
consumers. Phablets have long been popular in China and
Apple’s move to larger screens unlocked latent demand for
iPhones. As mentioned in our 2015 report on China’s growth,
the install base for iPhone and iPad in China grew roughly
three times as fast as in the US during 2014. This growth
continued through 2015 as Apple reported year-over-year
revenue growth of nearly 85% in Greater China during the
fiscal year, coming mostly from iPhone sales.
9
iOS App Store Downloads
Inde
xed
Dow
nloa
ds
0
25
50
75
100
125
H1 2014 H2 2014 H1 2015 H2 2015
United States China
App Annie 2015 Retrospective
© App Annie 2016
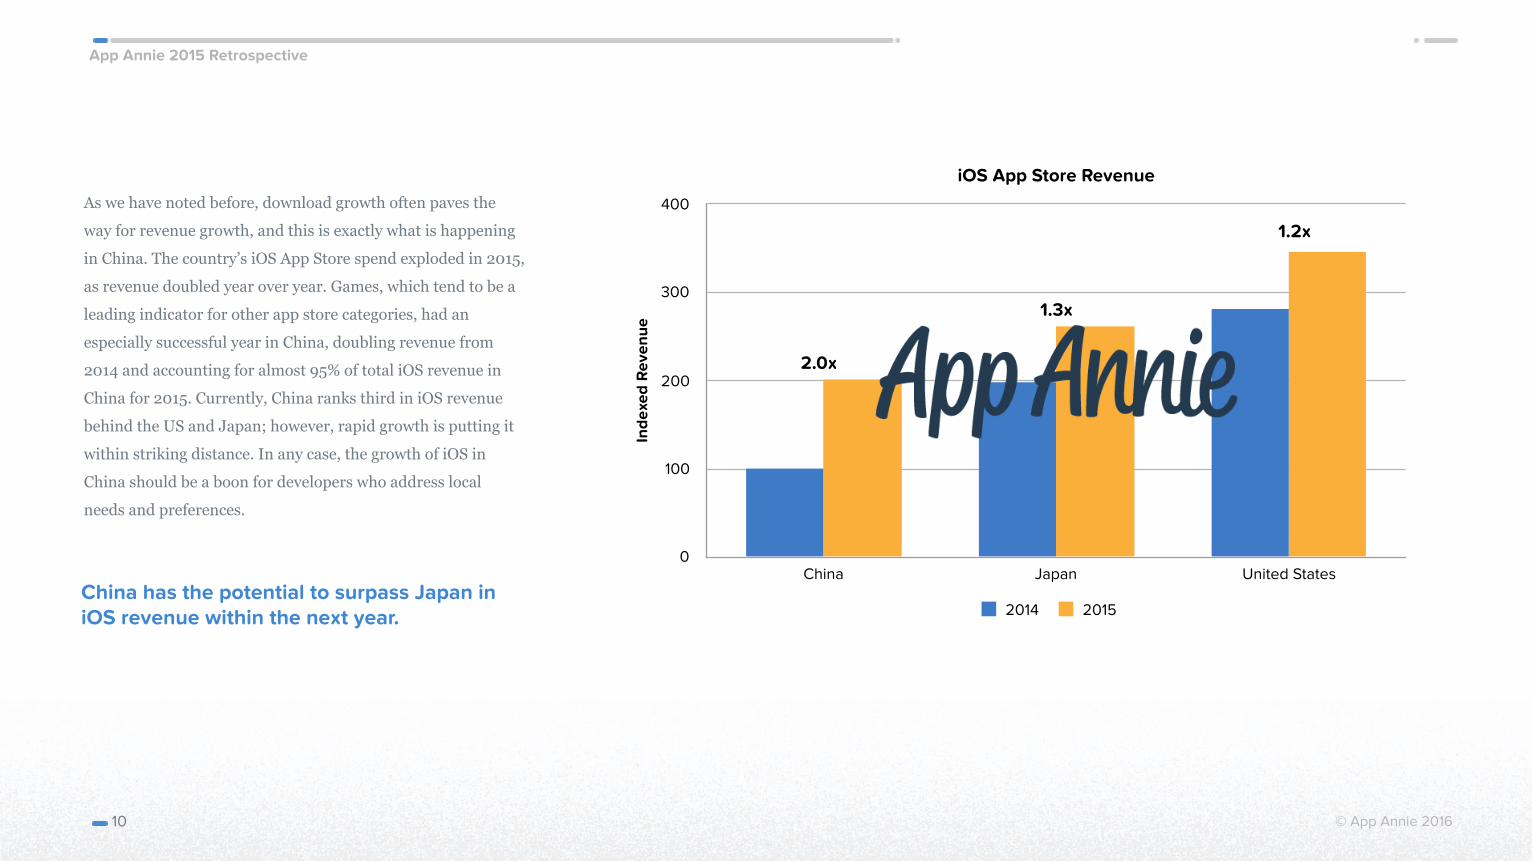
As we have noted before, download growth often paves the
way for revenue growth, and this is exactly what is happening
in China. The country’s iOS App Store spend exploded in 2015,
as revenue doubled year over year. Games, which tend to be a
leading indicator for other app store categories, had an
especially successful year in China, doubling revenue from
2014 and accounting for almost 95% of total iOS revenue in
China for 2015. Currently, China ranks third in iOS revenue
behind the US and Japan; however, rapid growth is putting it
within striking distance. In any case, the growth of iOS in
China should be a boon for developers who address local
needs and preferences.
10
iOS App Store Revenue
Inde
xed
Rev
enue
0
100
200
300
400
China Japan United States
2014 2015
2.0x
1.3x
1.2x
China has the potential to surpass Japan in iOS revenue within the next year.
App Annie 2015 Retrospective
© App Annie 2016
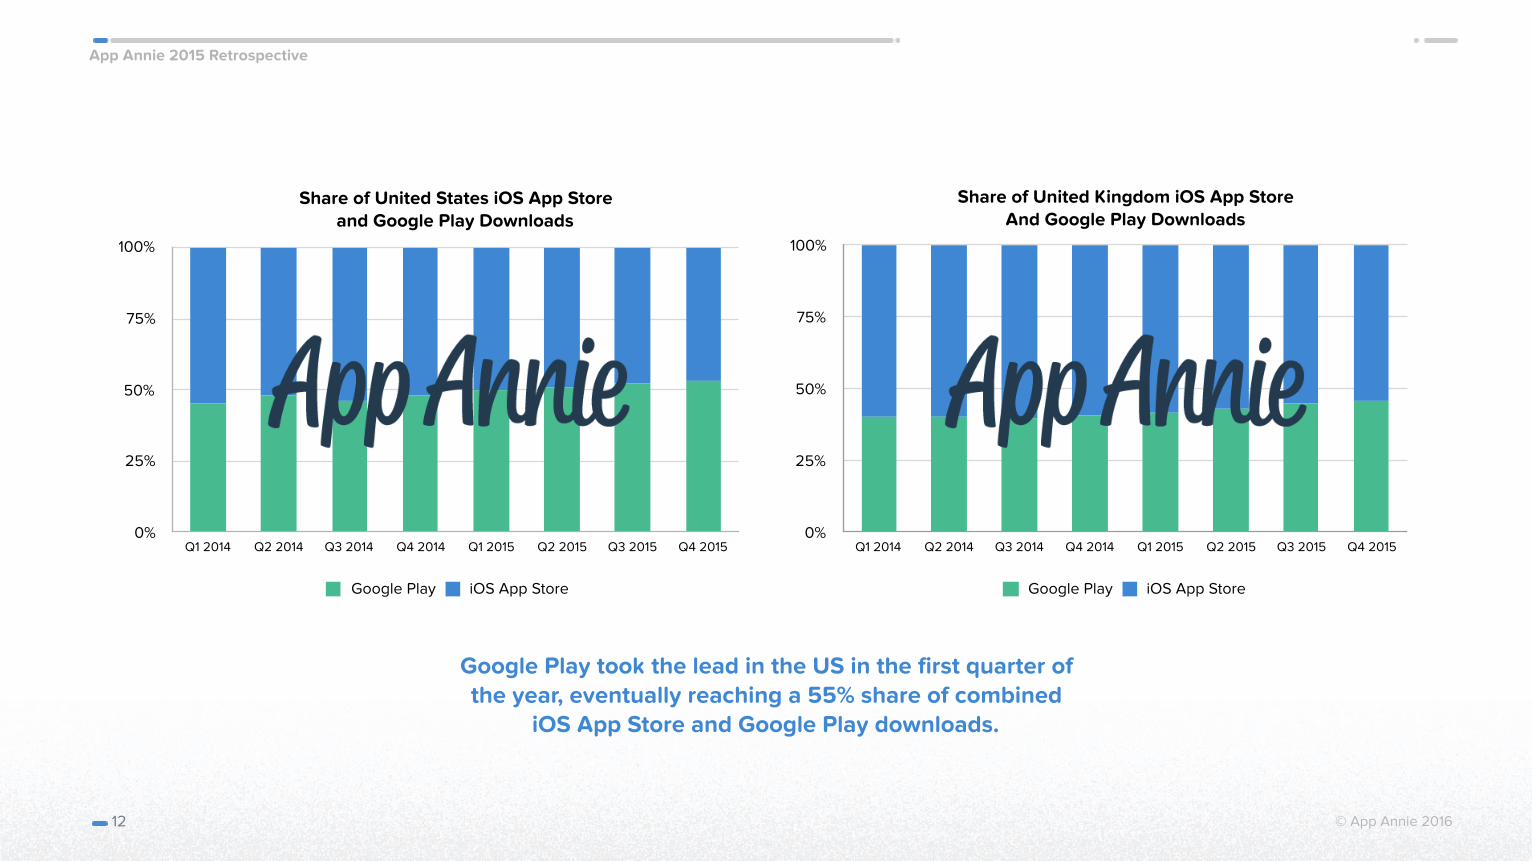
Google Play Passes iOS in US Downloads
The US’s standing in the mobile app economy
cannot be understated. It is home to Apple and
Google and is one of the largest smartphone markets. Additionally, it is the
only country to rank in the top 3 for
downloads and revenue on both the iOS App
Store and Google Play. (Germany is the only
other country to make it into the top 10 in all
cases.) Therefore, any significant shifts in the
US ripple throughout the entire app market.
One such shift occurred in 2015, as annual
downloads on Google Play surpassed those on
the iOS App Store for the first time.
In the US, Google Play’s share of combined iOS and
Google Play downloads grew from about 45% in 2014
to 55% in 2015. Game downloads drove a significant
portion of this shift with Google Play game downloads
at 1.5x iOS game downloads in 2015, up from nearly
equivalent values the year before.
While Google Play has been strong in emerging
markets as highlighted earlier, the growth of Google
Play’s share of combined iOS and Google Play
downloads in mature markets is not an isolated trend.
The UK, another iOS dominant market, has seen
Google Play’s share increase from 40% to 45% year
over year. Generally, games tend to be a leading
indicator of overall download performance and the UK
has already shown signs of an impending shift, with
Google Play game downloads narrowly overtaking
those on iOS in 2015.
11
App Annie 2015 Retrospective
© App Annie 2016 12
Share of United States iOS App Store and Google Play Downloads
0%
25%
50%
75%
100%
Q1 2014 Q2 2014 Q3 2014 Q4 2014 Q1 2015 Q2 2015 Q3 2015 Q4 2015
Google Play iOS App Store
Share of United Kingdom iOS App Store And Google Play Downloads
0%
25%
50%
75%
100%
Q1 2014 Q2 2014 Q3 2014 Q4 2014 Q1 2015 Q2 2015 Q3 2015 Q4 2015
Google Play iOS App Store
Google Play took the lead in the US in the first quarter of the year, eventually reaching a 55% share of combined
iOS App Store and Google Play downloads.
App Annie 2015 Retrospective
© App Annie 2016
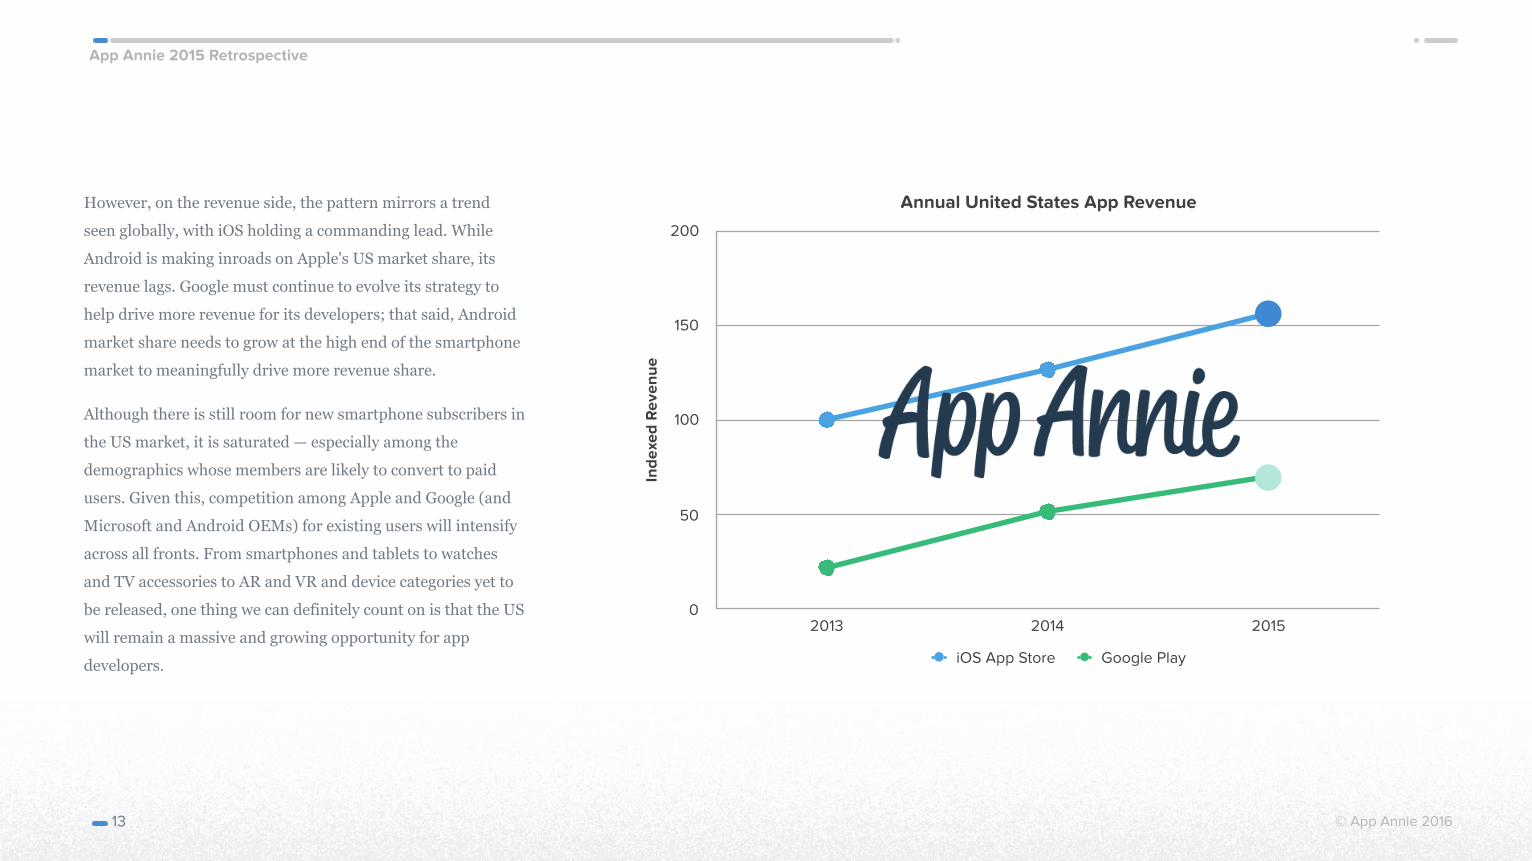
However, on the revenue side, the pattern mirrors a trend
seen globally, with iOS holding a commanding lead. While
Android is making inroads on Apple's US market share, its
revenue lags. Google must continue to evolve its strategy to
help drive more revenue for its developers; that said, Android
market share needs to grow at the high end of the smartphone
market to meaningfully drive more revenue share.
Although there is still room for new smartphone subscribers in
the US market, it is saturated — especially among the
demographics whose members are likely to convert to paid
users. Given this, competition among Apple and Google (and
Microsoft and Android OEMs) for existing users will intensify
across all fronts. From smartphones and tablets to watches
and TV accessories to AR and VR and device categories yet to
be released, one thing we can definitely count on is that the US
will remain a massive and growing opportunity for app
developers.
13
Annual United States App Revenue
Inde
xed
Rev
enue
0
50
100
150
200
2013 2014 2015
iOS App Store Google Play
App Annie 2015 Retrospective
© App Annie 2016
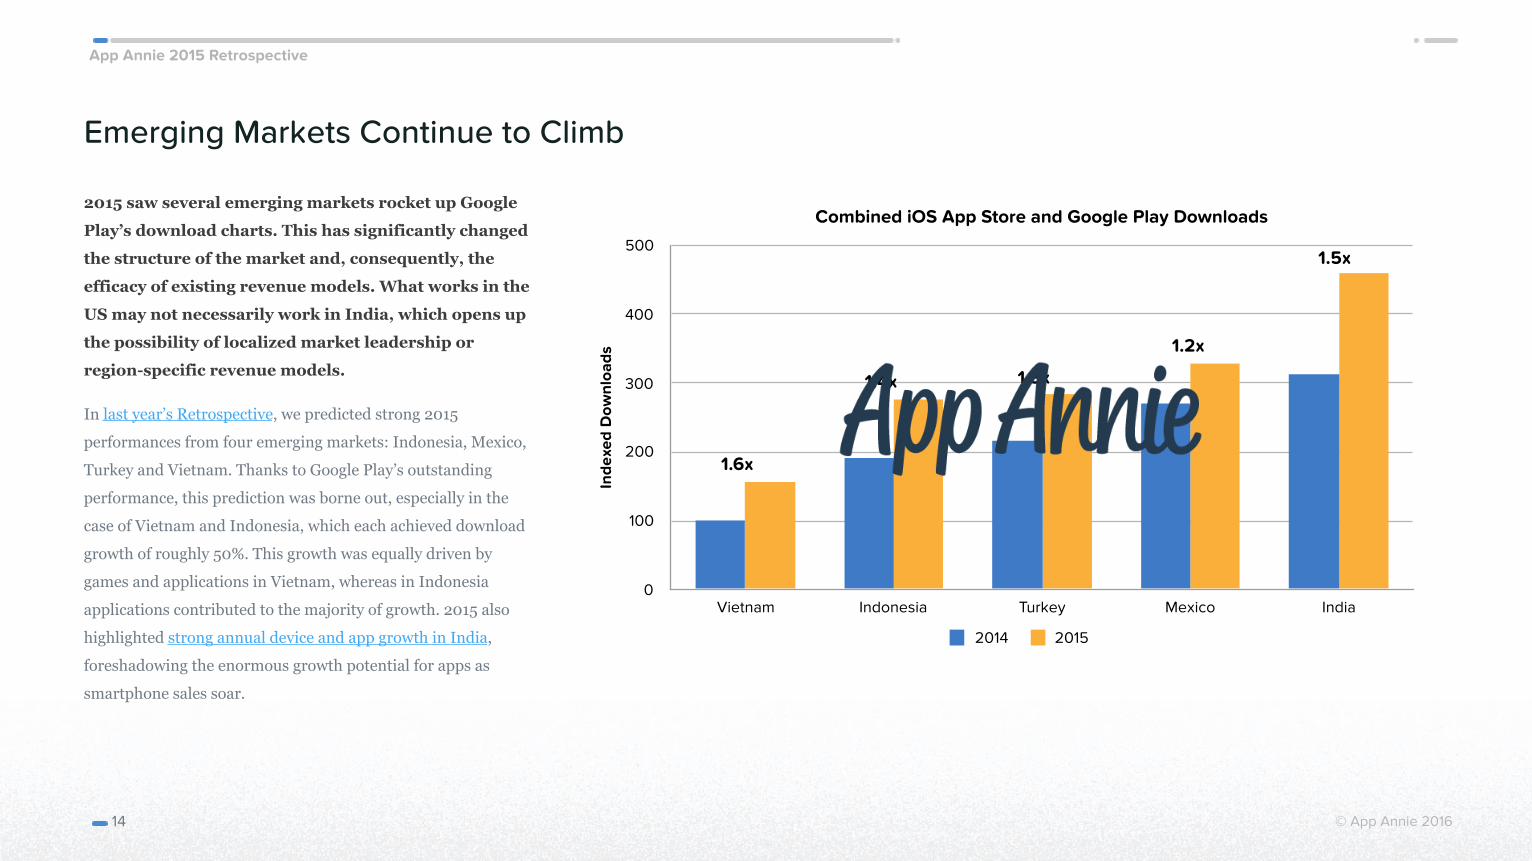
Emerging Markets Continue to Climb
2015 saw several emerging markets rocket up Google
Play’s download charts. This has significantly changed
the structure of the market and, consequently, the
efficacy of existing revenue models. What works in the
US may not necessarily work in India, which opens up
the possibility of localized market leadership or
region-specific revenue models.
In last year’s Retrospective, we predicted strong 2015
performances from four emerging markets: Indonesia, Mexico,
Turkey and Vietnam. Thanks to Google Play’s outstanding
performance, this prediction was borne out, especially in the
case of Vietnam and Indonesia, which each achieved download
growth of roughly 50%. This growth was equally driven by
games and applications in Vietnam, whereas in Indonesia
applications contributed to the majority of growth. 2015 also
highlighted strong annual device and app growth in India,
foreshadowing the enormous growth potential for apps as
smartphone sales soar.
14
Combined iOS App Store and Google Play Downloads
Inde
xed
Dow
nloa
ds0
100
200
300
400
500
Vietnam Indonesia Turkey Mexico India
2014 2015
1.4x
1.2x
1.3x
1.6x
1.5x
App Annie 2015 Retrospective
© App Annie 2016
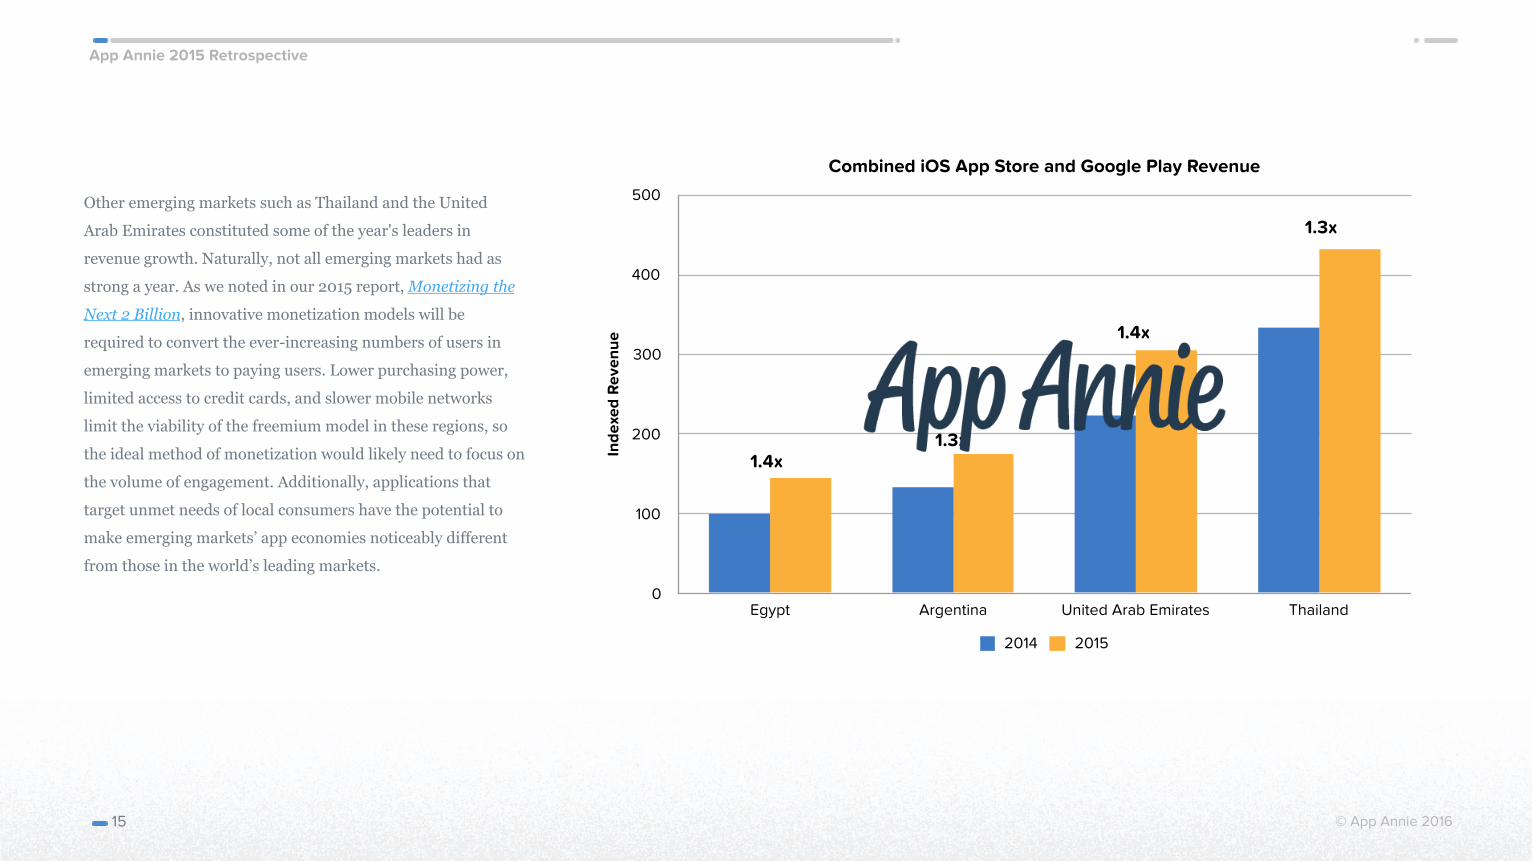
Other emerging markets such as Thailand and the United
Arab Emirates constituted some of the year's leaders in
revenue growth. Naturally, not all emerging markets had as
strong a year. As we noted in our 2015 report, Monetizing the
Next 2 Billion, innovative monetization models will be
required to convert the ever-increasing numbers of users in
emerging markets to paying users. Lower purchasing power,
limited access to credit cards, and slower mobile networks
limit the viability of the freemium model in these regions, so
the ideal method of monetization would likely need to focus on
the volume of engagement. Additionally, applications that
target unmet needs of local consumers have the potential to
make emerging markets’ app economies noticeably different
from those in the world’s leading markets.
15
Combined iOS App Store and Google Play Revenue
Inde
xed
Rev
enue
0
100
200
300
400
500
Egypt Argentina United Arab Emirates Thailand
2014 2015
1.4x1.3x
1.4x
1.3x
App Annie 2015 Retrospective
Expanding App Monetization and Market Sectors
App Annie 2015 Retrospective
© App Annie 2016
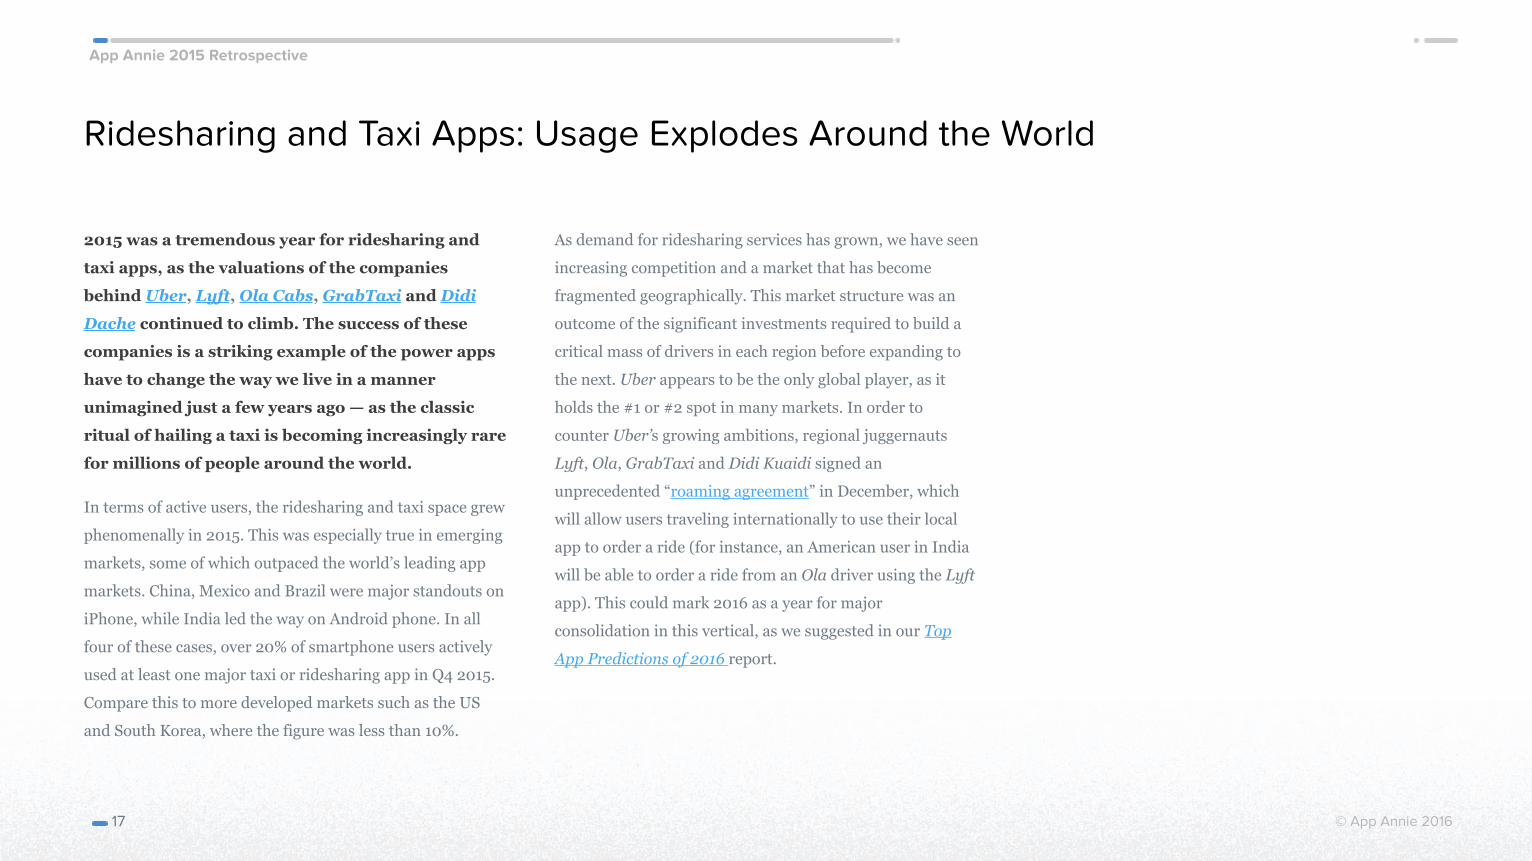
Ridesharing and Taxi Apps: Usage Explodes Around the World
2015 was a tremendous year for ridesharing and
taxi apps, as the valuations of the companies
behind Uber, Lyft, Ola Cabs, GrabTaxi and Didi
Dache continued to climb. The success of these
companies is a striking example of the power apps
have to change the way we live in a manner
unimagined just a few years ago — as the classic
ritual of hailing a taxi is becoming increasingly rare
for millions of people around the world.
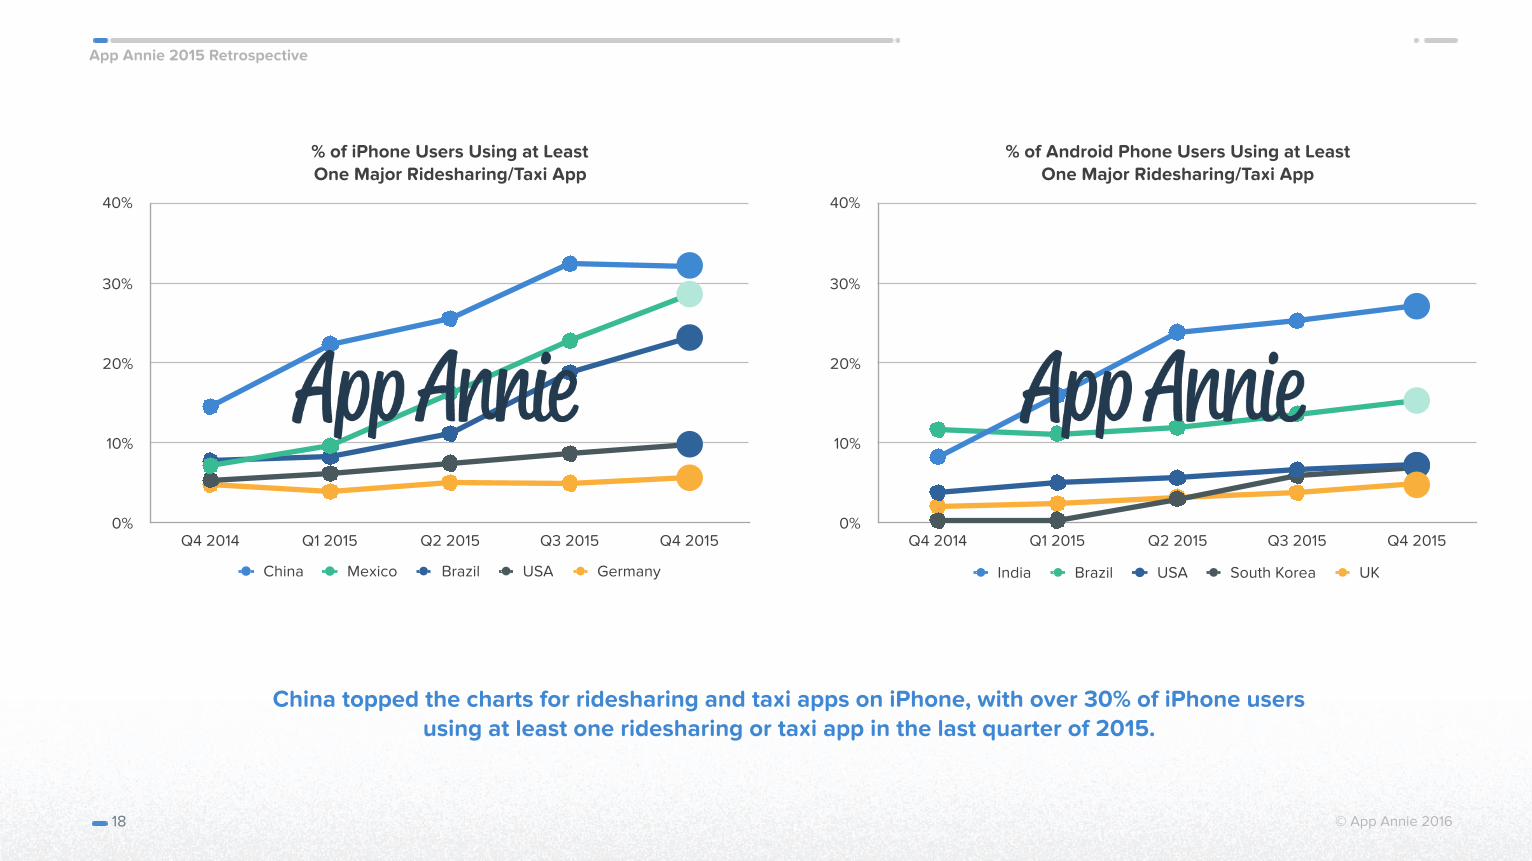
In terms of active users, the ridesharing and taxi space grew
phenomenally in 2015. This was especially true in emerging
markets, some of which outpaced the world’s leading app
markets. China, Mexico and Brazil were major standouts on
iPhone, while India led the way on Android phone. In all
four of these cases, over 20% of smartphone users actively
used at least one major taxi or ridesharing app in Q4 2015.
Compare this to more developed markets such as the US
and South Korea, where the figure was less than 10%.
As demand for ridesharing services has grown, we have seen
increasing competition and a market that has become
fragmented geographically. This market structure was an
outcome of the significant investments required to build a
critical mass of drivers in each region before expanding to
the next. Uber appears to be the only global player, as it
holds the #1 or #2 spot in many markets. In order to
counter Uber’s growing ambitions, regional juggernauts
Lyft, Ola, GrabTaxi and Didi Kuaidi signed an
unprecedented “roaming agreement” in December, which
will allow users traveling internationally to use their local
app to order a ride (for instance, an American user in India
will be able to order a ride from an Ola driver using the Lyft
app). This could mark 2016 as a year for major
consolidation in this vertical, as we suggested in our Top
App Predictions of 2016 report.
17
App Annie 2015 Retrospective
© App Annie 2016 18
% of iPhone Users Using at Least One Major Ridesharing/Taxi App
0%
10%
20%
30%
40%
Q4 2014 Q1 2015 Q2 2015 Q3 2015 Q4 2015
China Mexico Brazil USA Germany
% of Android Phone Users Using at Least One Major Ridesharing/Taxi App
0%
10%
20%
30%
40%
Q4 2014 Q1 2015 Q2 2015 Q3 2015 Q4 2015
India Brazil USA South Korea UK
China topped the charts for ridesharing and taxi apps on iPhone, with over 30% of iPhone users using at least one ridesharing or taxi app in the last quarter of 2015.
App Annie 2015 Retrospective
© App Annie 2016
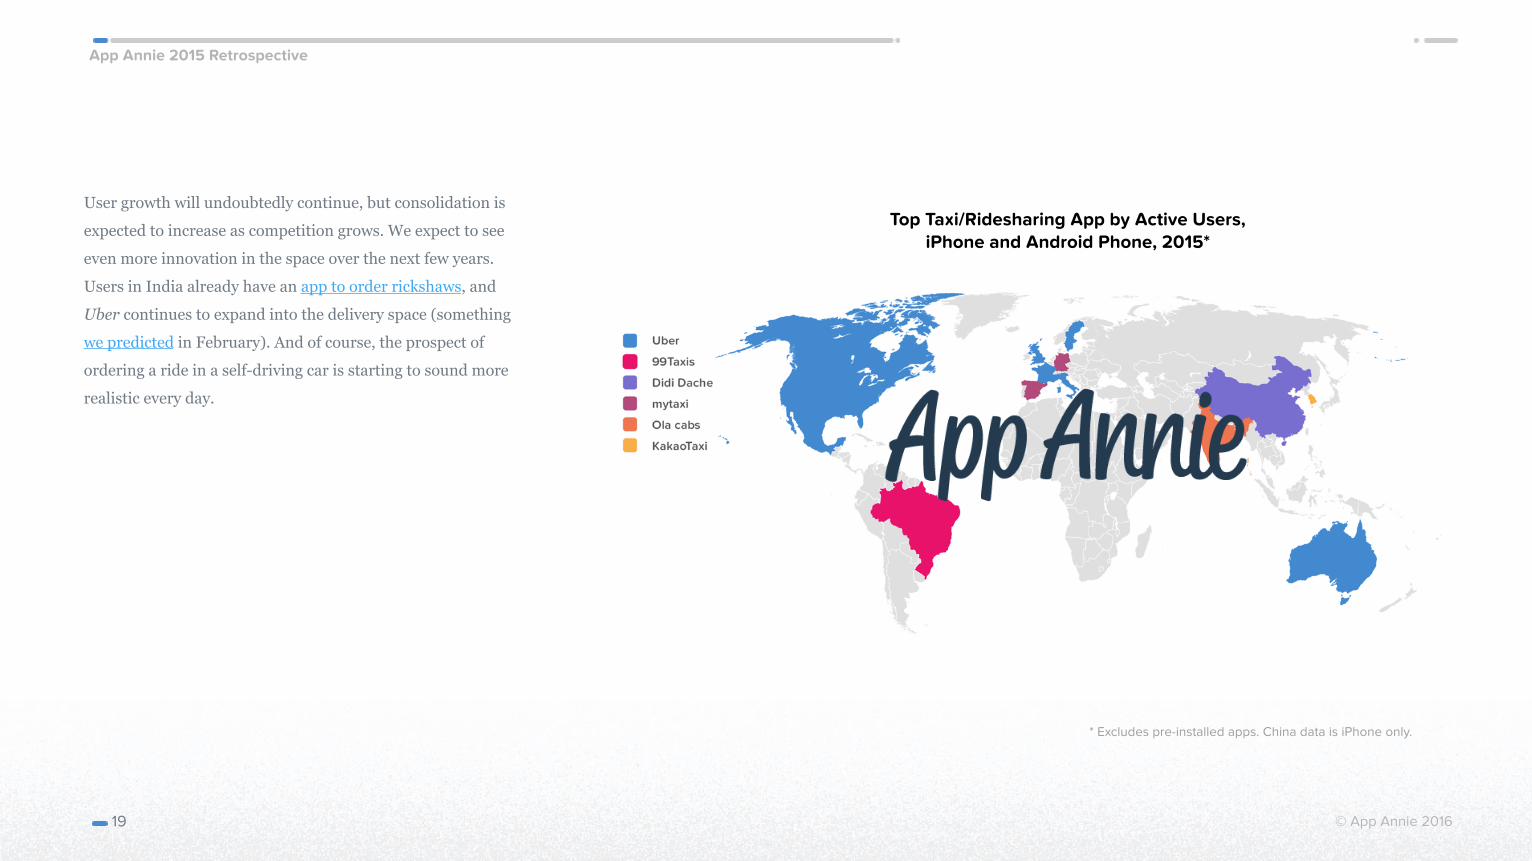
User growth will undoubtedly continue, but consolidation is
expected to increase as competition grows. We expect to see
even more innovation in the space over the next few years.
Users in India already have an app to order rickshaws, and
Uber continues to expand into the delivery space (something
we predicted in February). And of course, the prospect of
ordering a ride in a self-driving car is starting to sound more
realistic every day.
19
Top Taxi/Ridesharing App by Active Users,iPhone and Android Phone, 2015*
* Excludes pre-installed apps. China data is iPhone only.
App Annie 2015 Retrospective
© App Annie 2016
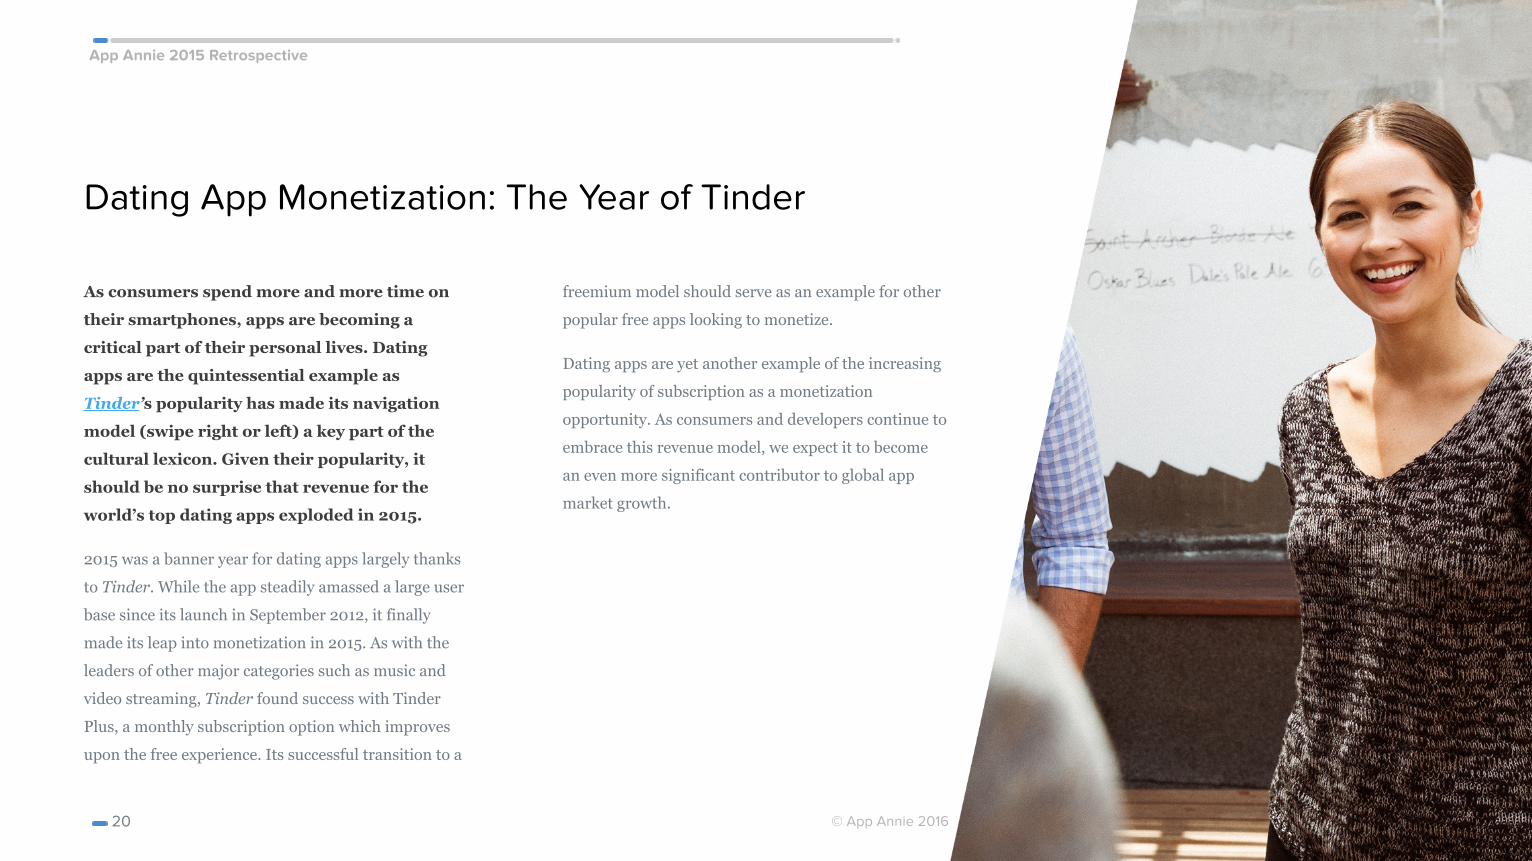
Dating App Monetization: The Year of Tinder
As consumers spend more and more time on
their smartphones, apps are becoming a
critical part of their personal lives. Dating
apps are the quintessential example as
Tinder’s popularity has made its navigation
model (swipe right or left) a key part of the
cultural lexicon. Given their popularity, it
should be no surprise that revenue for the
world’s top dating apps exploded in 2015.
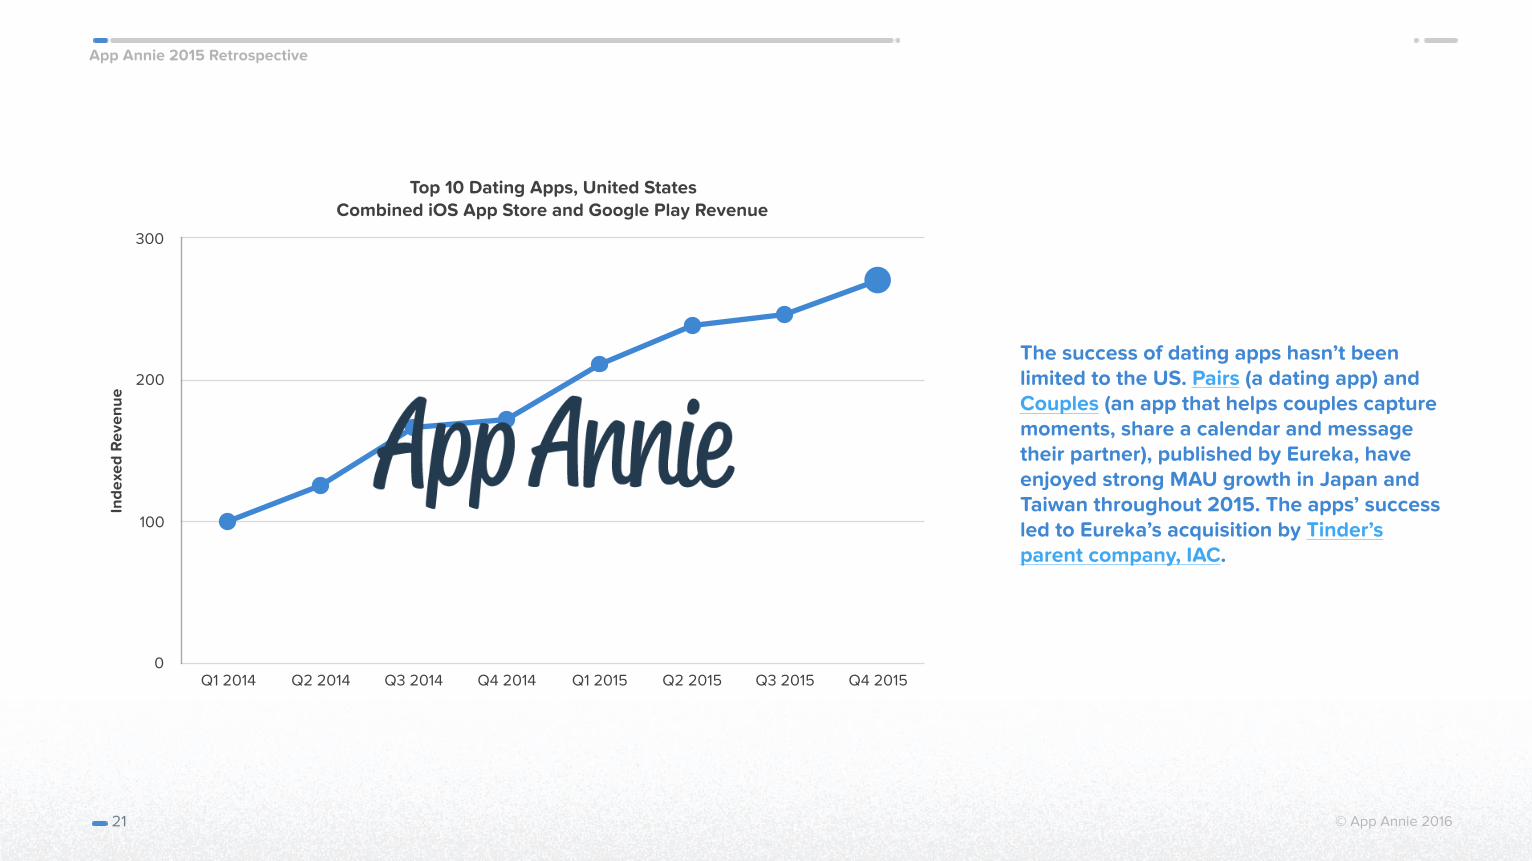
2015 was a banner year for dating apps largely thanks
to Tinder. While the app steadily amassed a large user
base since its launch in September 2012, it finally
made its leap into monetization in 2015. As with the
leaders of other major categories such as music and
video streaming, Tinder found success with Tinder
Plus, a monthly subscription option which improves
upon the free experience. Its successful transition to a
freemium model should serve as an example for other
popular free apps looking to monetize.
Dating apps are yet another example of the increasing
popularity of subscription as a monetization
opportunity. As consumers and developers continue to
embrace this revenue model, we expect it to become
an even more significant contributor to global app
market growth.
20
App Annie 2015 Retrospective
© App Annie 2016
The success of dating apps hasn’t been limited to the US. Pairs (a dating app) and Couples (an app that helps couples capture moments, share a calendar and message their partner), published by Eureka, have enjoyed strong MAU growth in Japan and Taiwan throughout 2015. The apps’ success led to Eureka’s acquisition by Tinder’s parent company, IAC.
21
Top 10 Dating Apps, United States Combined iOS App Store and Google Play Revenue
Inde
xed
Rev
enue
0
100
200
300
Q1 2014 Q2 2014 Q3 2014 Q4 2014 Q1 2015 Q2 2015 Q3 2015 Q4 2015
App Annie 2015 Retrospective
© App Annie 2016
Video Streaming: Battle Lines Are Drawn
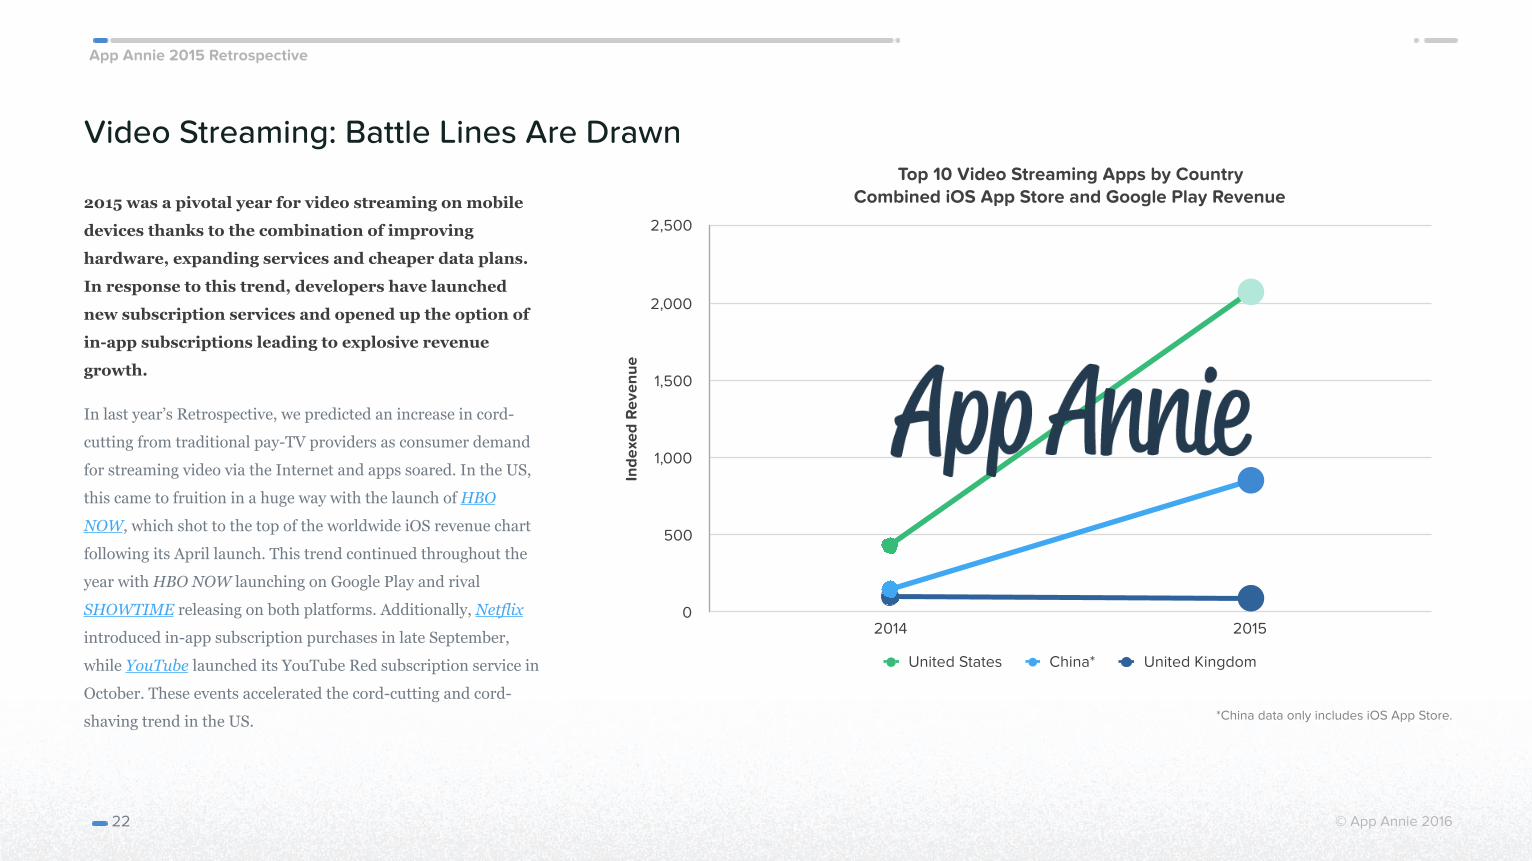
2015 was a pivotal year for video streaming on mobile
devices thanks to the combination of improving
hardware, expanding services and cheaper data plans.
In response to this trend, developers have launched
new subscription services and opened up the option of
in-app subscriptions leading to explosive revenue
growth.
In last year’s Retrospective, we predicted an increase in cord-
cutting from traditional pay-TV providers as consumer demand
for streaming video via the Internet and apps soared. In the US,
this came to fruition in a huge way with the launch of HBO
NOW, which shot to the top of the worldwide iOS revenue chart
following its April launch. This trend continued throughout the
year with HBO NOW launching on Google Play and rival
SHOWTIME releasing on both platforms. Additionally, Netflix
introduced in-app subscription purchases in late September,
while YouTube launched its YouTube Red subscription service in
October. These events accelerated the cord-cutting and cord-
shaving trend in the US.
22
Top 10 Video Streaming Apps by Country Combined iOS App Store and Google Play Revenue
Inde
xed
Rev
enue
0
500
1,000
1,500
2,000
2,500
2014 2015
United States China* United Kingdom
*China data only includes iOS App Store.
App Annie 2015 Retrospective
© App Annie 2016
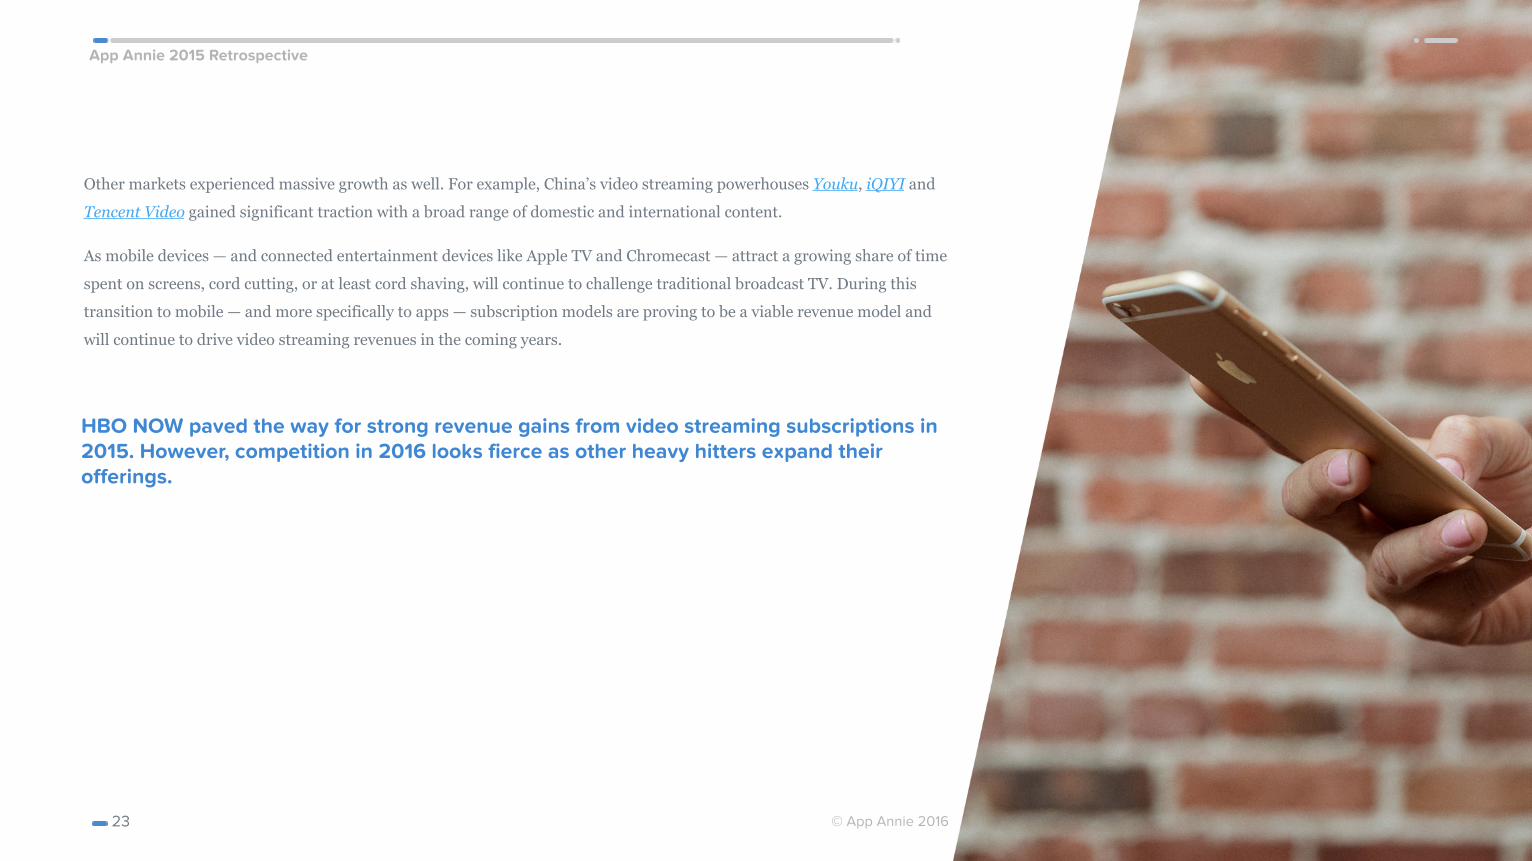
Other markets experienced massive growth as well. For example, China’s video streaming powerhouses Youku, iQIYI and
Tencent Video gained significant traction with a broad range of domestic and international content.
As mobile devices — and connected entertainment devices like Apple TV and Chromecast — attract a growing share of time
spent on screens, cord cutting, or at least cord shaving, will continue to challenge traditional broadcast TV. During this
transition to mobile — and more specifically to apps — subscription models are proving to be a viable revenue model and
will continue to drive video streaming revenues in the coming years.
23
HBO NOW paved the way for strong revenue gains from video streaming subscriptions in 2015. However, competition in 2016 looks fierce as other heavy hitters expand their offerings.
App Annie 2015 Retrospective
© App Annie 2016
Music Streaming: Revenue Soars for Global and Local Players
Music streaming had an eventful year, with high-
profile announcements such as the launch of
Apple Music, Jay Z's acquisition of TIDAL and
Google broadening the music capabilities of
YouTube. Meanwhile, global leaders such as
Spotify saw big gains, and regional challengers
like LINE MUSIC, Saavn and QQMusic built
strong local positions.
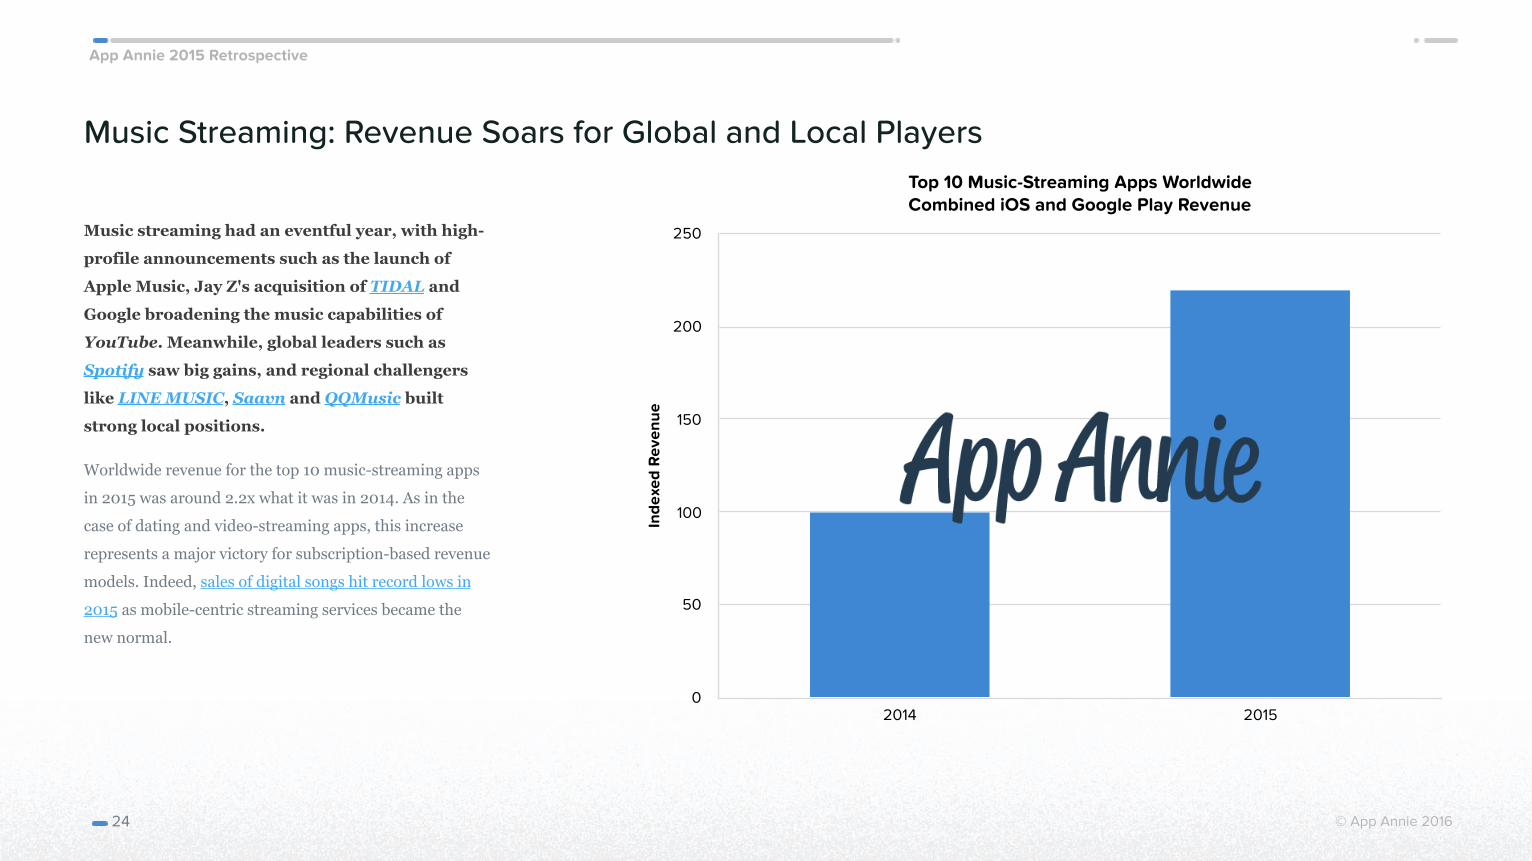
Worldwide revenue for the top 10 music-streaming apps
in 2015 was around 2.2x what it was in 2014. As in the
case of dating and video-streaming apps, this increase
represents a major victory for subscription-based revenue
models. Indeed, sales of digital songs hit record lows in
2015 as mobile-centric streaming services became the
new normal.
24
Top 10 Music-Streaming Apps Worldwide Combined iOS and Google Play Revenue
Inde
xed
Rev
enue
0
50
100
150
200
250
2014 2015
App Annie 2015 Retrospective
© App Annie 2016
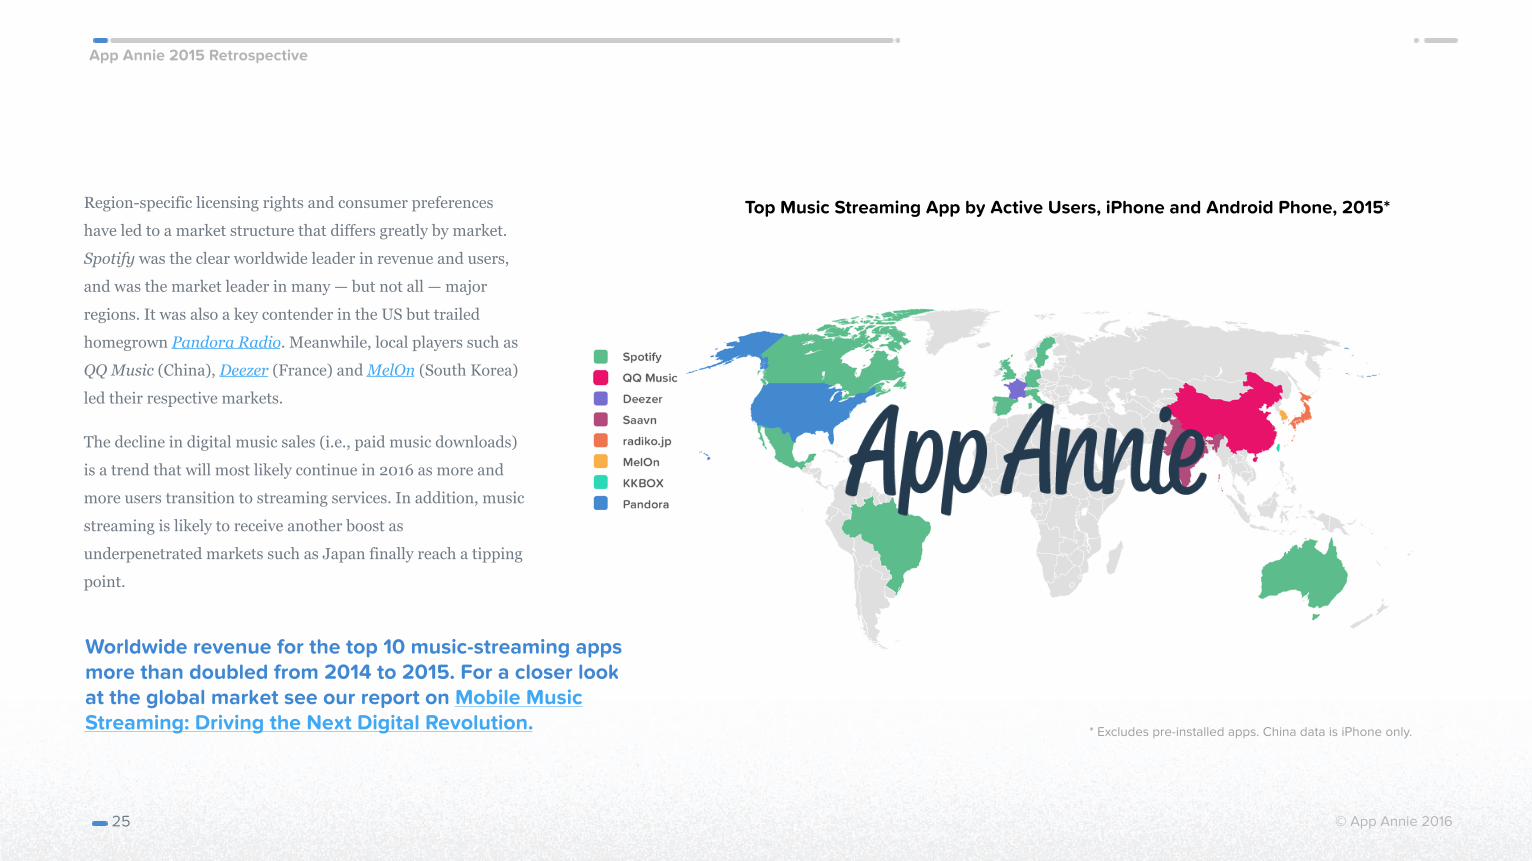
Region-specific licensing rights and consumer preferences
have led to a market structure that differs greatly by market.
Spotify was the clear worldwide leader in revenue and users,
and was the market leader in many — but not all — major
regions. It was also a key contender in the US but trailed
homegrown Pandora Radio. Meanwhile, local players such as
QQ Music (China), Deezer (France) and MelOn (South Korea)
led their respective markets.
The decline in digital music sales (i.e., paid music downloads)
is a trend that will most likely continue in 2016 as more and
more users transition to streaming services. In addition, music
streaming is likely to receive another boost as
underpenetrated markets such as Japan finally reach a tipping
point.
25
Top Music Streaming App by Active Users, iPhone and Android Phone, 2015*
Worldwide revenue for the top 10 music-streaming apps more than doubled from 2014 to 2015. For a closer look at the global market see our report on Mobile Music Streaming: Driving the Next Digital Revolution. * Excludes pre-installed apps. China data is iPhone only.
App Annie 2015 Retrospective
© App Annie 2016
M-Commerce: Shoppers Choose the Small Screen
Mobile devices are an increasingly essential tool for
shopping, making this a particularly hot space in the
app economy. As we discussed in our 2015 Retail
Apps report, top retail apps from around the globe
are pushing the boundaries to enhance users’
experiences across all phases of the customer
journey, including research, product discovery, price
comparisons, purchase and overall engagement.
These apps came from companies across a broad
spectrum of sales channels and product categories,
helping to make 2015 a huge year for m-commerce,
with November being an especially strong month.
On 11/11, Single’s Day set records in China with key e-
commerce giants, like Alibaba’s Taobao and Tmall, releasing
app updates specifically designed for the festival. Later that
month, mobile shopping set Black Friday records in the US.
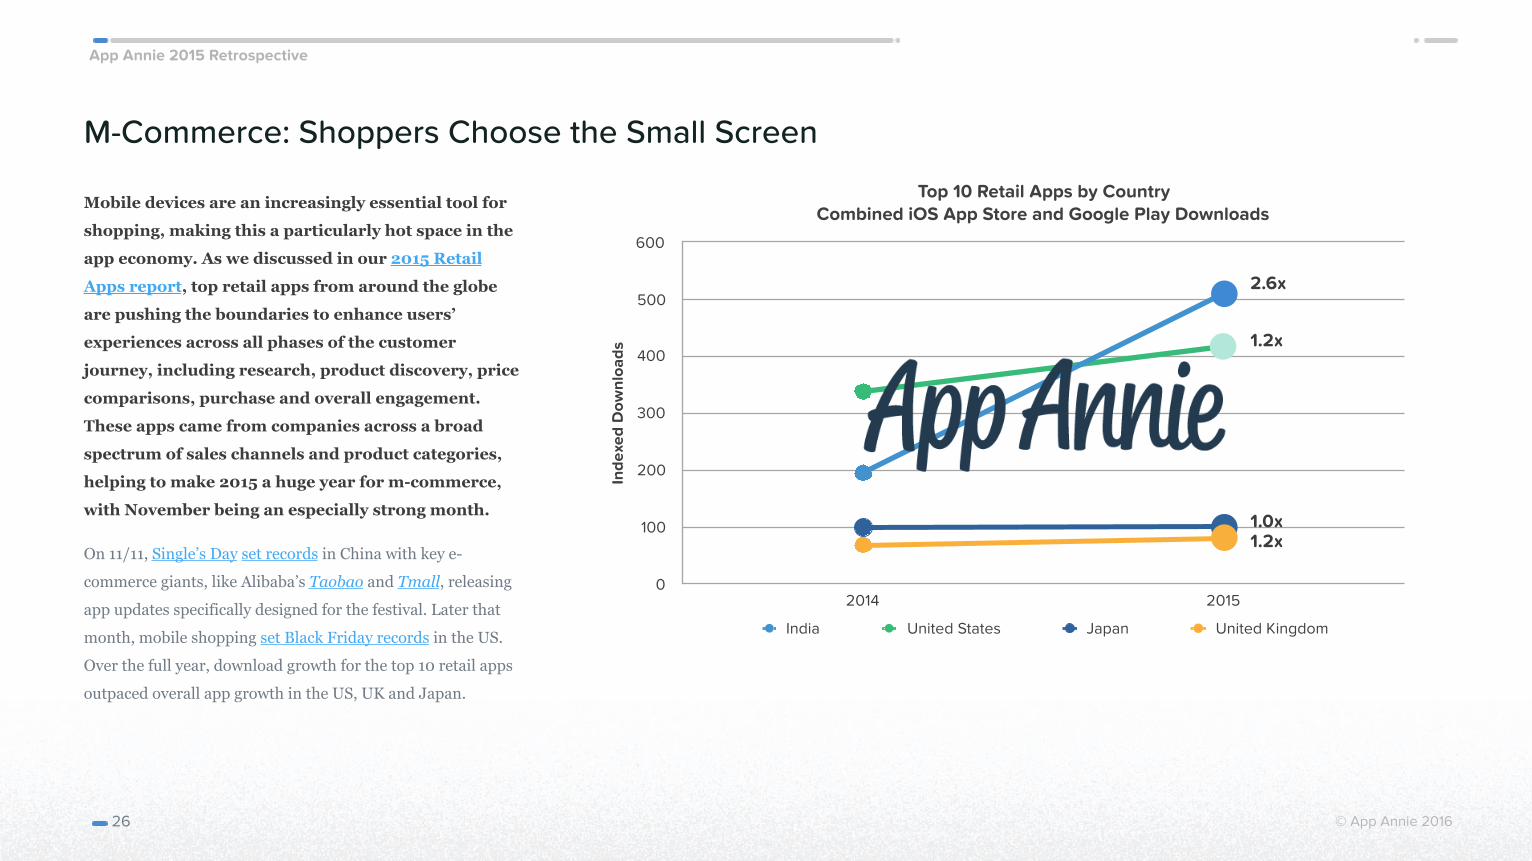
Over the full year, download growth for the top 10 retail apps
outpaced overall app growth in the US, UK and Japan.
26
Top 10 Retail Apps by Country Combined iOS App Store and Google Play Downloads
Inde
xed
Dow
nloa
ds
0
100
200
300
400
500
600
2014 2015
India United States Japan United Kingdom
2.6x
1.2x
1.0x1.2x
App Annie 2015 Retrospective
© App Annie 2016
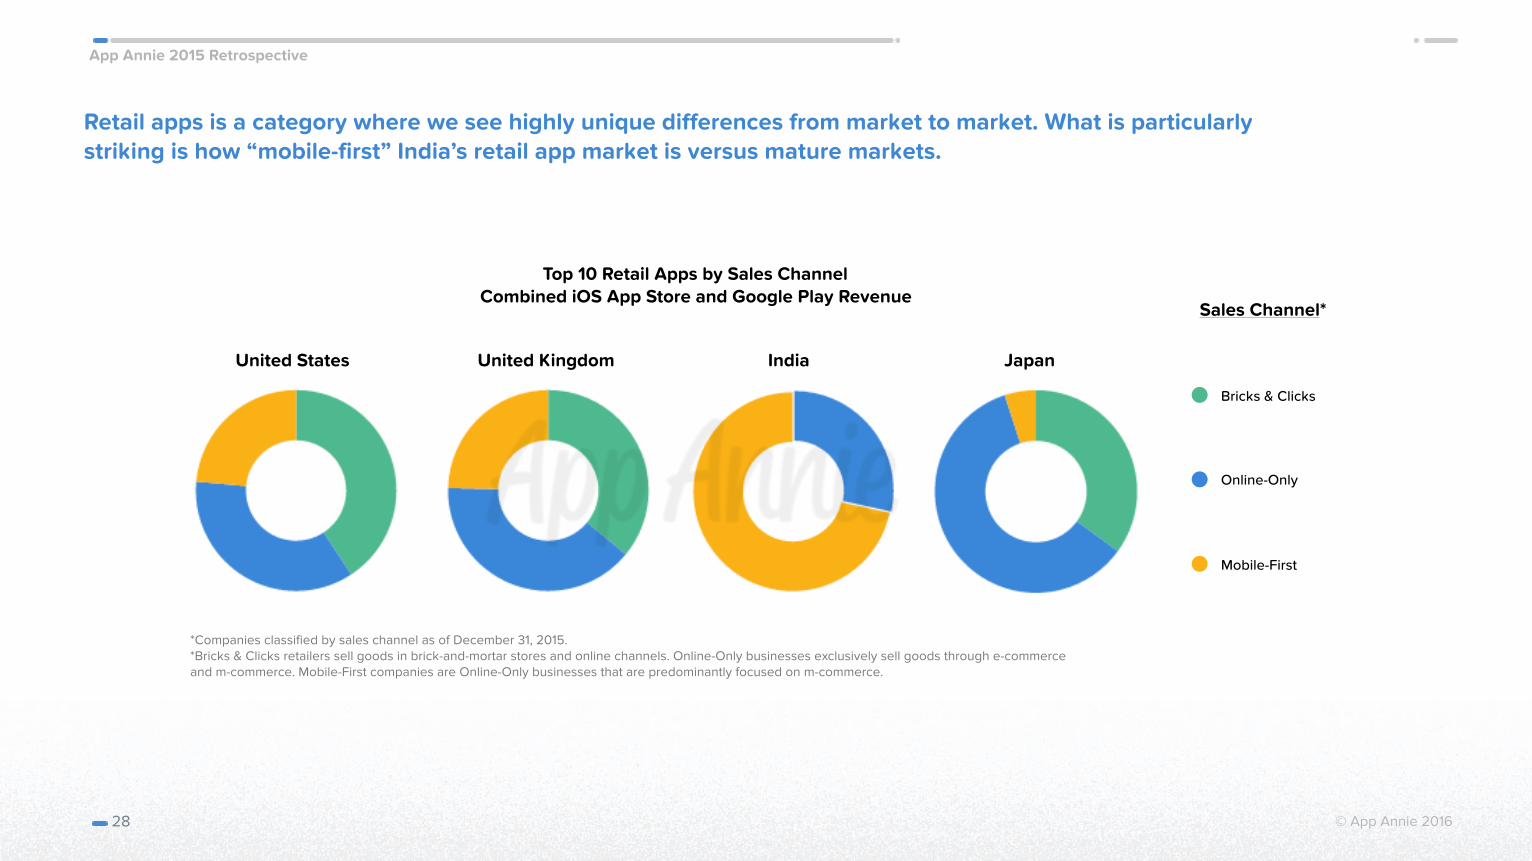
Among retail apps, Amazon topped downloads and monthly
active users (MAU) in all three countries. ContextLogic’s
mobile-first apps Wish and Geek both made a major global
impact, ranking in the top 10 retail apps by 2015 downloads
in both the US and the UK.
As we noted in December, mobile-first apps were even more prominent in India, accounting for 6 of the top 10
spots by combined iOS App Store and Google Play
downloads. Furthermore, the download growth for India’s
top 10 retail apps was significantly higher than those in
Japan and the US. These downloads have resulted in major
mobile traffic for retailers in India. For instance, 75% of
Flipkart’s traffic was driven by its mobile apps. And Myntra
generated 90% of its traffic from its mobile apps prior to
switching to an app-only approach and shutting off its
desktop site. Jeff Bezos’s contention that India will become
a trillion-dollar market underscores the potential for retail
apps in this country.
We heard from multiple Western retailers this year that
customers that use a retailer’s app have higher basket spend
than those buying via the web. So while the web can be a
place to onboard a customer, getting them to download and
use the app pays dividends. For Bricks & Clicks retailers,
their omnichannel advantage of both physical stores and
online merchandising allow them to engage with customers,
cross-promote products and reinforce their brand across
multiple touchpoints in an increasingly successful manner.
Looking ahead, all companies participating in the retail
space will need to continue to invest in their mobile app
strategy in order to stay competitive and keep up with
shoppers’ evolving demands. We expect to see continued
innovation and activity in this space as retailers seek to
drive more transactions, higher spend and increased loyalty
through apps.
27
As identified in our Retail Report, download growth for the top 10 retail apps eclipsed overall app growth in the US, the UK and Japan.
App Annie 2015 Retrospective
© App Annie 2016
India Japan
Retail apps is a category where we see highly unique differences from market to market. What is particularly striking is how “mobile-first” India’s retail app market is versus mature markets.
28
United States United Kingdom
Top 10 Retail Apps by Sales Channel Combined iOS App Store and Google Play Revenue
Sales Channel*
*Companies classified by sales channel as of December 31, 2015. *Bricks & Clicks retailers sell goods in brick-and-mortar stores and online channels. Online-Only businesses exclusively sell goods through e-commerce and m-commerce. Mobile-First companies are Online-Only businesses that are predominantly focused on m-commerce.
Bricks & Clicks
Online-Only
Mobile-First
App Annie 2015 Retrospective
The Evolution of Mobile Gaming
App Annie 2015 Retrospective
© App Annie 2016
Competition Increases in Games and Maturity Cycles Accelerate
Although the individual apps leading the revenue
charts remained relatively steady in 2015,
beneath the surface there have been massive
shifts in the mobile gaming market. Games are
maturing at a faster rate, while mobile gaming
revenue has become less concentrated. This
presents opportunities for publishers who can
effectively navigate this changing landscape, but
also presents challenges for those that cannot.
In our App Adoption Cycle report, we analyzed the
average estimated time to maturity for new games, which
dropped 60% from 2014 to 2015 — from almost 50 weeks
to just over 17. Compared to just three years prior, this is
a remarkably slim window in which to generate
downloads. For games released in 2012, average time to
maturity was over 10 times longer than it was for those
released in 2015.
This naturally impacts marketing and monetization
strategies as publishers seek high visibility and
engagement upon release. It also has significant
ramifications for portfolio management, with most
publishers requiring more frequent releases to maintain
the momentum that may have been sustained by a single
title in previous years.
Meanwhile, as game revenue grows, it is also becoming
less concentrated among the top publishers. Even as the
biggest names in mobile gaming draw attention with
multi-million-dollar ad campaigns and high-profile
releases, the concentration of revenue in the mobile
gaming market has been trending toward less
concentration at the top. In our Rise of the Indies report,
we used a common measure of industry concentration,
the Herfindahl-Hirschman Index (HHI), to show that
revenue became more evenly dispersed among publishers
from Q1 2014 to Q1 2015. The HHI continued to fall
throughout 2015, opening up more opportunity for long-
tail publishers.
30
Average Estimated Time to Maturity* by Year of Release
Combined iOS App Store and Google Play Worldwide Downloads
Wee
ks A
fter
Lau
nch
0
50
100
150
200
2012 2013 2014 2015
*Defined as the point at which a game reaches 90% of estimated market potential (based on cumulative downloads).
App Annie 2015 Retrospective
© App Annie 2016
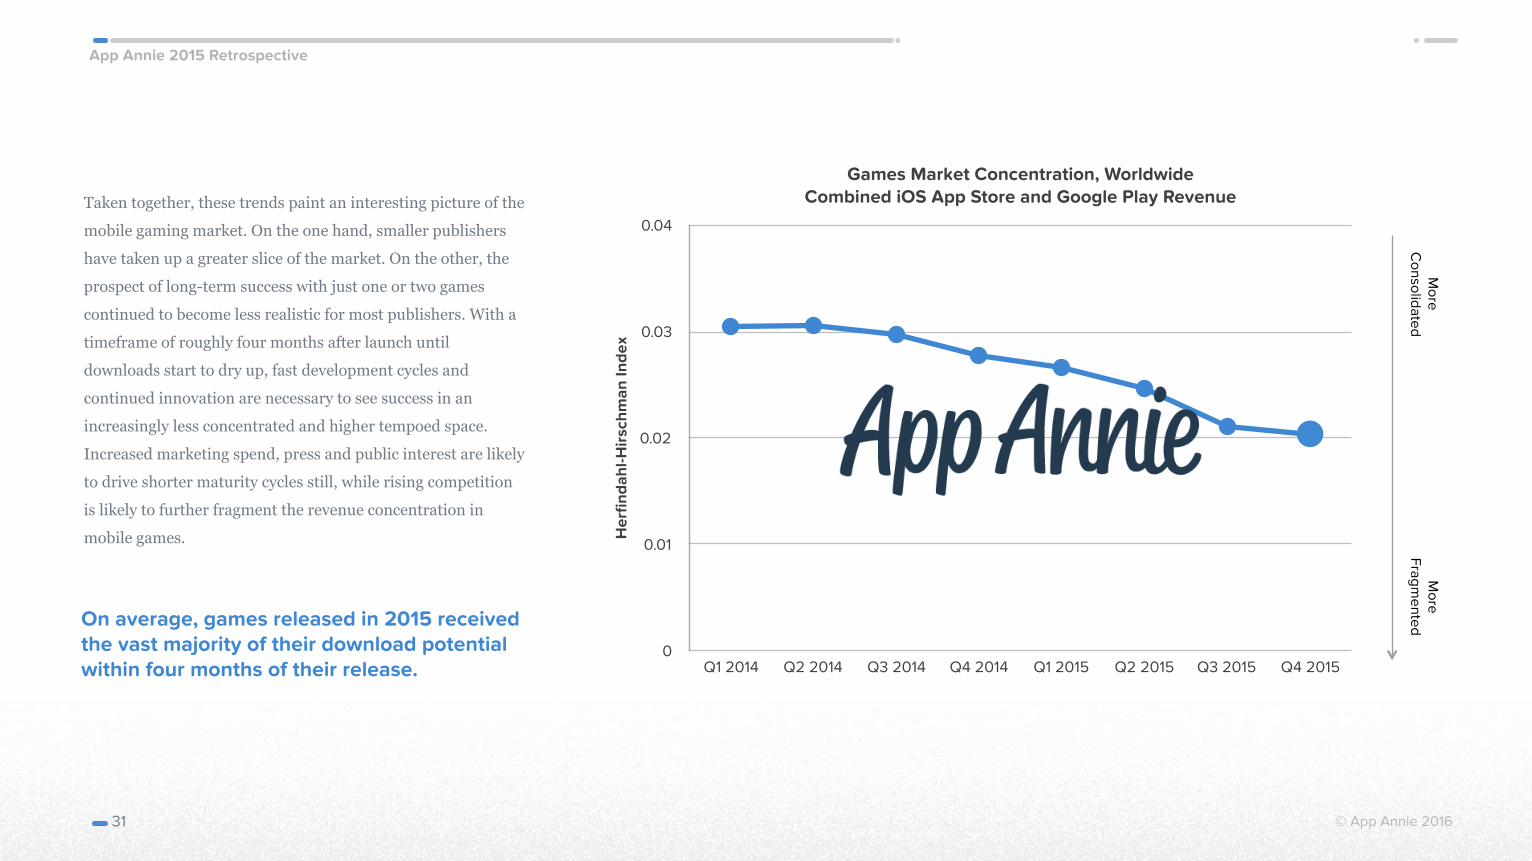
Taken together, these trends paint an interesting picture of the
mobile gaming market. On the one hand, smaller publishers
have taken up a greater slice of the market. On the other, the
prospect of long-term success with just one or two games
continued to become less realistic for most publishers. With a
timeframe of roughly four months after launch until
downloads start to dry up, fast development cycles and
continued innovation are necessary to see success in an
increasingly less concentrated and higher tempoed space.
Increased marketing spend, press and public interest are likely
to drive shorter maturity cycles still, while rising competition
is likely to further fragment the revenue concentration in
mobile games.
31
Games Market Concentration, Worldwide Combined iOS App Store and Google Play Revenue
Her
finda
hl-H
irsc
hman
Inde
x
0
0.01
0.02
0.03
0.04
Q1 2014 Q2 2014 Q3 2014 Q4 2014 Q1 2015 Q2 2015 Q3 2015 Q4 2015
On average, games released in 2015 received the vast majority of their download potential within four months of their release.
More
Consolidated
More
Fragmented
App Annie 2015 Retrospective
© App Annie 2016
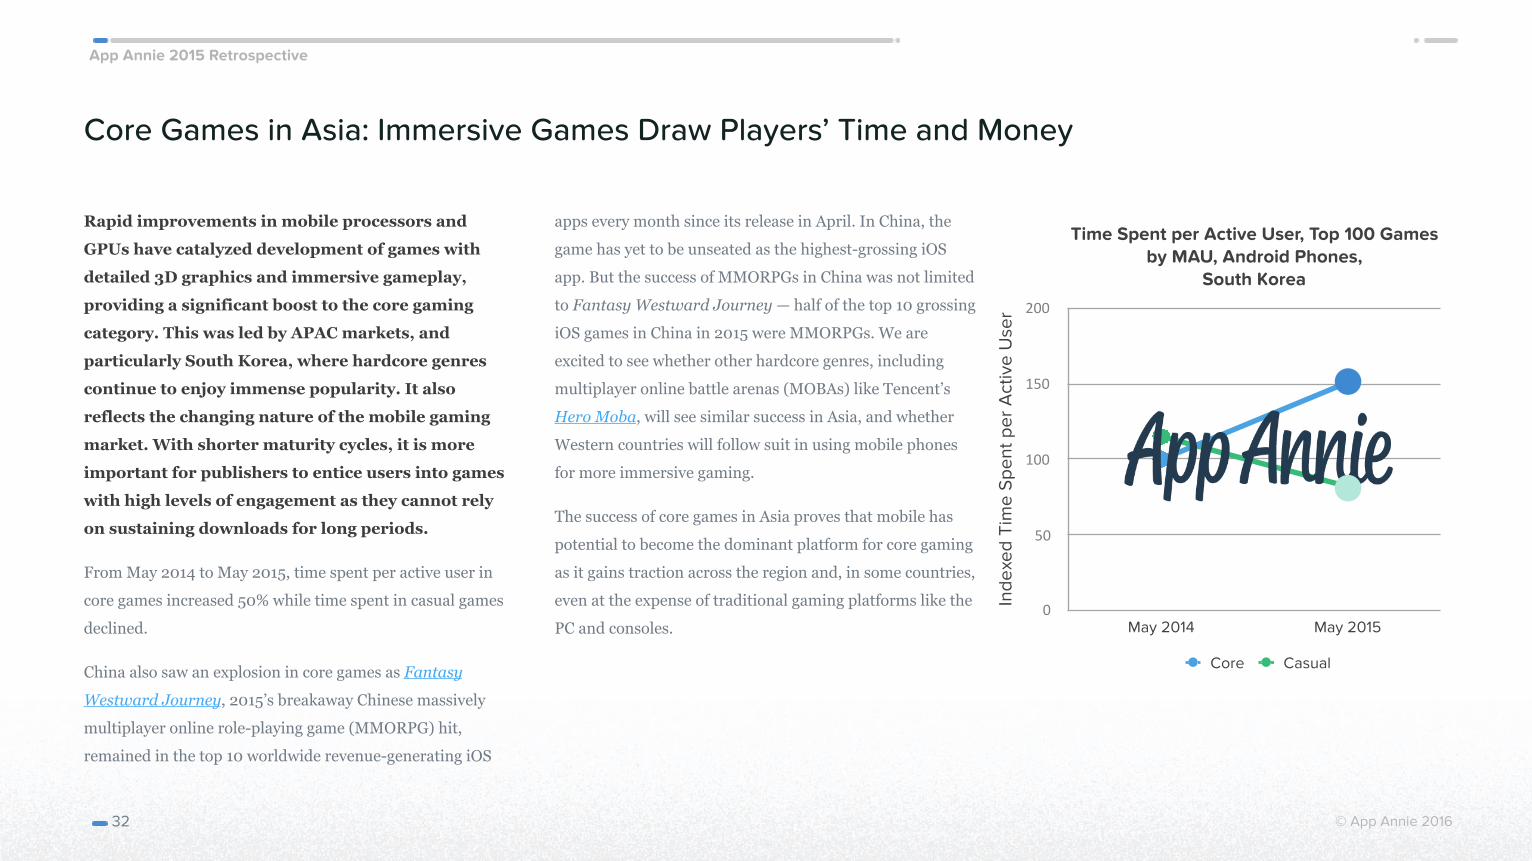
Core Games in Asia: Immersive Games Draw Players’ Time and Money
Rapid improvements in mobile processors and
GPUs have catalyzed development of games with
detailed 3D graphics and immersive gameplay,
providing a significant boost to the core gaming
category. This was led by APAC markets, and
particularly South Korea, where hardcore genres
continue to enjoy immense popularity. It also
reflects the changing nature of the mobile gaming
market. With shorter maturity cycles, it is more
important for publishers to entice users into games
with high levels of engagement as they cannot rely
on sustaining downloads for long periods.
From May 2014 to May 2015, time spent per active user in
core games increased 50% while time spent in casual games
declined.
China also saw an explosion in core games as Fantasy
Westward Journey, 2015’s breakaway Chinese massively
multiplayer online role-playing game (MMORPG) hit,
remained in the top 10 worldwide revenue-generating iOS
apps every month since its release in April. In China, the
game has yet to be unseated as the highest-grossing iOS
app. But the success of MMORPGs in China was not limited
to Fantasy Westward Journey — half of the top 10 grossing
iOS games in China in 2015 were MMORPGs. We are
excited to see whether other hardcore genres, including
multiplayer online battle arenas (MOBAs) like Tencent’s
Hero Moba, will see similar success in Asia, and whether
Western countries will follow suit in using mobile phones
for more immersive gaming.
The success of core games in Asia proves that mobile has
potential to become the dominant platform for core gaming
as it gains traction across the region and, in some countries,
even at the expense of traditional gaming platforms like the
PC and consoles.
32
Time Spent per Active User, Top 100 Games by MAU, Android Phones,
South Korea
Inde
xed
Tim
e Sp
ent p
er A
ctiv
e U
ser
0
50
100
150
200
May 2014 May 2015
Core Casual
App Annie 2015 Retrospective
© App Annie 2016 33
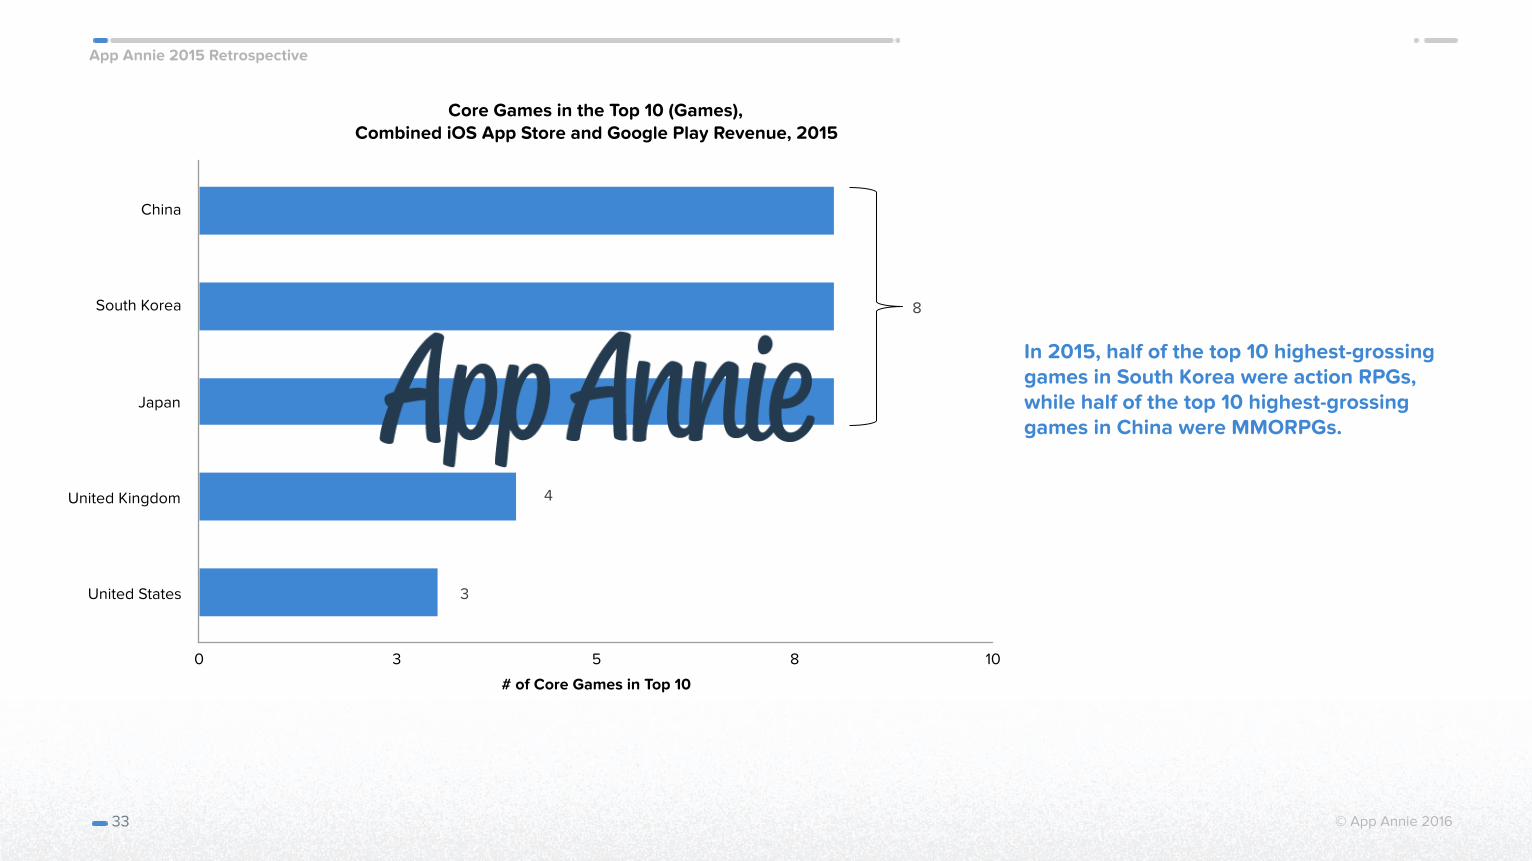
Core Games in the Top 10 (Games), Combined iOS App Store and Google Play Revenue, 2015
China
South Korea
Japan
United Kingdom
United States
# of Core Games in Top 10
0 3 5 8 10
In 2015, half of the top 10 highest-grossing games in South Korea were action RPGs, while half of the top 10 highest-grossing games in China were MMORPGs.
8
4
3
App Annie 2015 Retrospective
The NextFrontier for Apps
App Annie 2015 Retrospective
© App Annie 2016
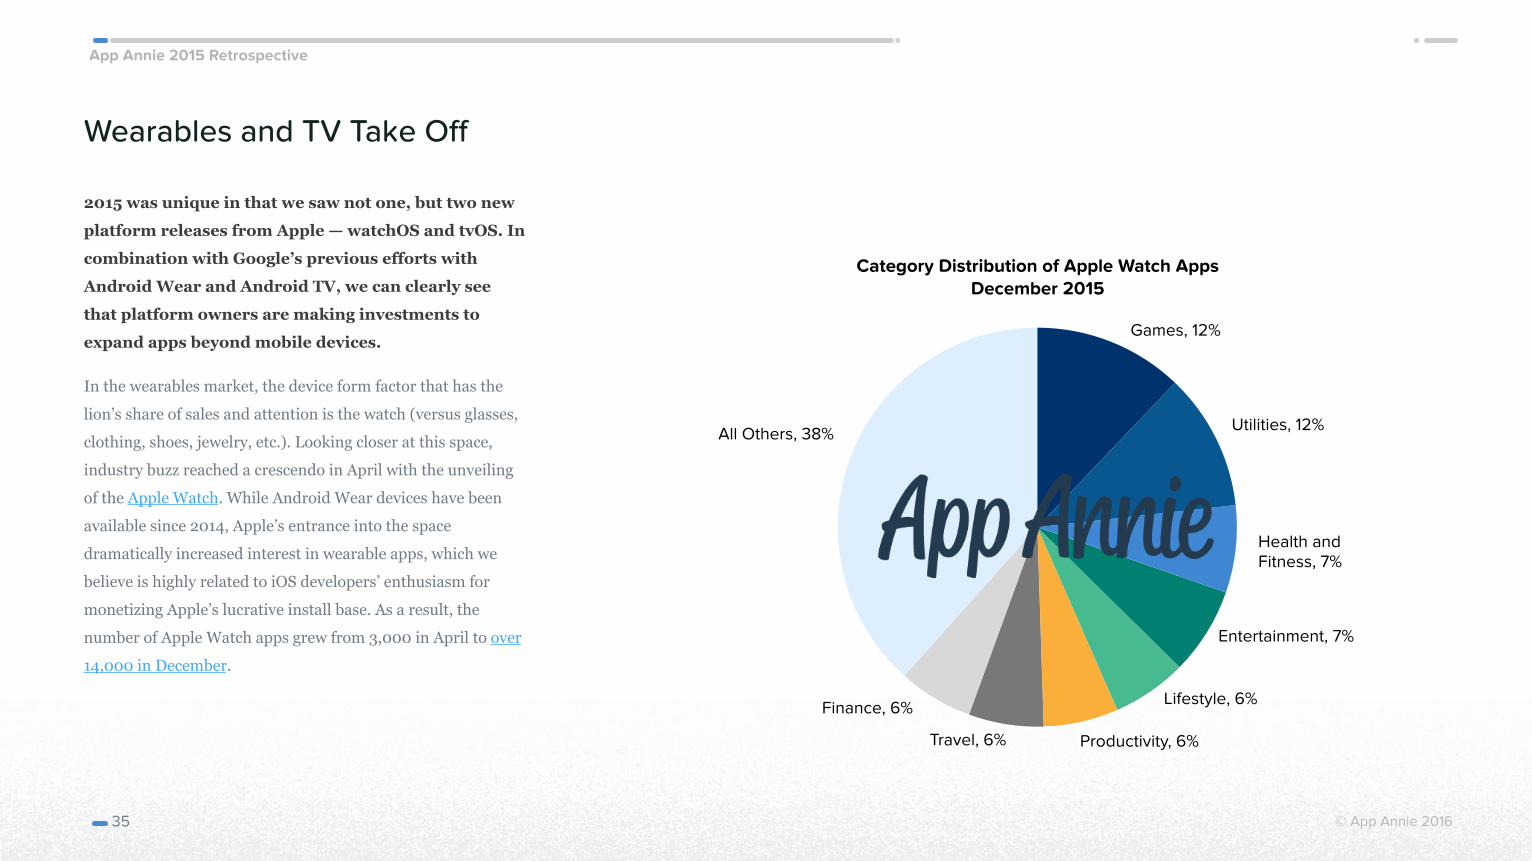
Wearables and TV Take Off
2015 was unique in that we saw not one, but two new
platform releases from Apple — watchOS and tvOS. In
combination with Google’s previous efforts with
Android Wear and Android TV, we can clearly see
that platform owners are making investments to
expand apps beyond mobile devices.
In the wearables market, the device form factor that has the
lion’s share of sales and attention is the watch (versus glasses,
clothing, shoes, jewelry, etc.). Looking closer at this space,
industry buzz reached a crescendo in April with the unveiling
of the Apple Watch. While Android Wear devices have been
available since 2014, Apple’s entrance into the space
dramatically increased interest in wearable apps, which we
believe is highly related to iOS developers’ enthusiasm for
monetizing Apple’s lucrative install base. As a result, the
number of Apple Watch apps grew from 3,000 in April to over
14,000 in December.
35
Category Distribution of Apple Watch Apps December 2015
Games, 12%
Utilities, 12%
Health and Fitness, 7%
Entertainment, 7%
Lifestyle, 6%Finance, 6%
Productivity, 6%Travel, 6%
All Others, 38%
App Annie 2015 Retrospective
Apps With Apple Watch Support Top 10 iPhone Apps by Category, Worldwide Downloads
December 2015
Weather
Shopping
Social Networking
News
Health and Fitness
Navigation
Travel
Entertainment
Music
Utilities
Productivity
Sports
Games
# Top 10 Apps in Category With Apple Watch Support
0 3 5 8 10
© App Annie 2016
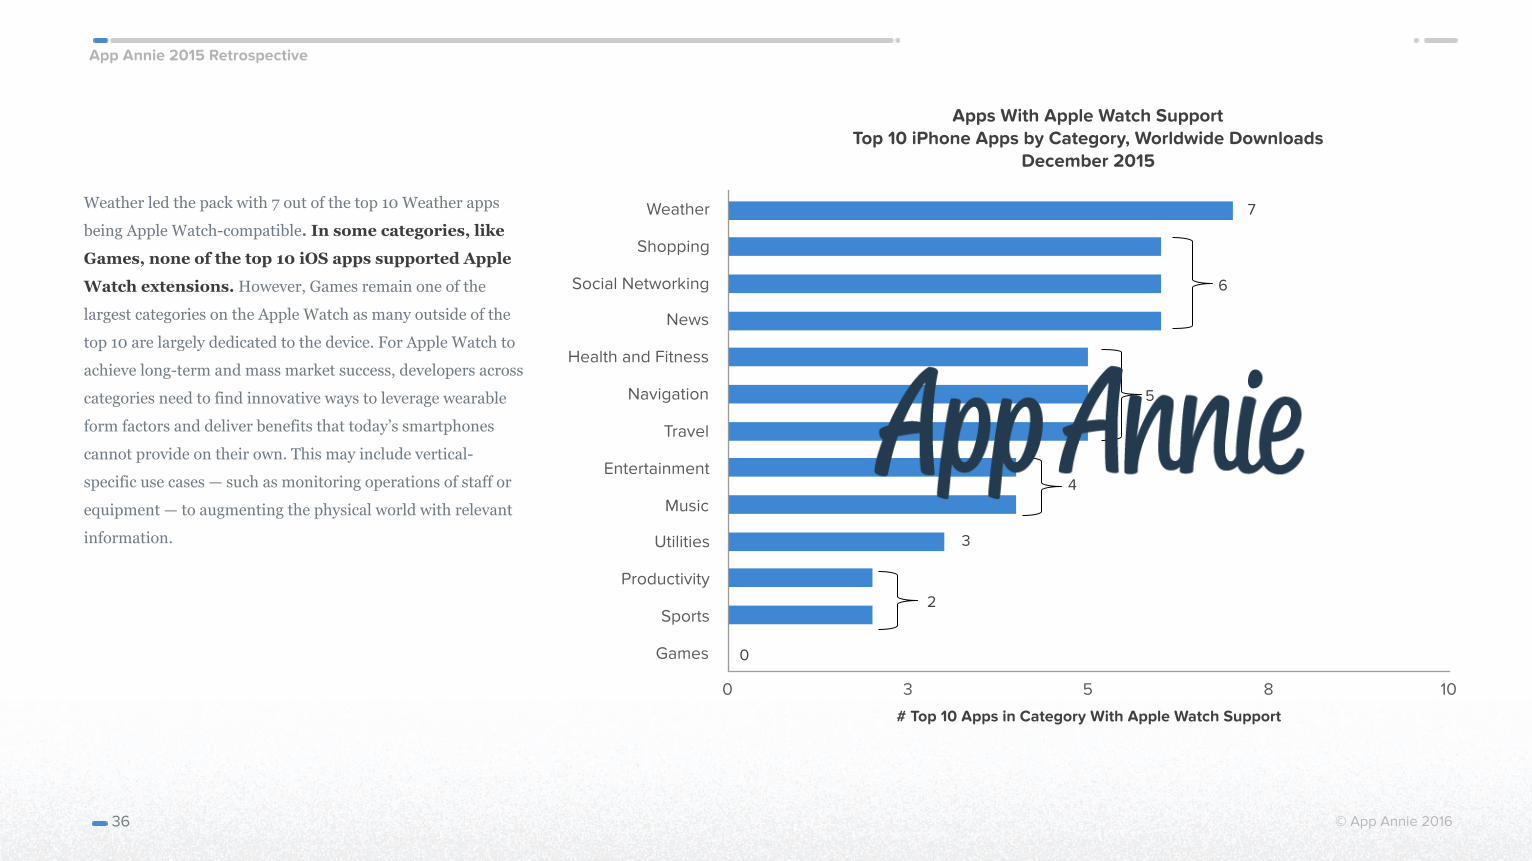
Weather led the pack with 7 out of the top 10 Weather apps
being Apple Watch-compatible. In some categories, like
Games, none of the top 10 iOS apps supported Apple
Watch extensions. However, Games remain one of the
largest categories on the Apple Watch as many outside of the
top 10 are largely dedicated to the device. For Apple Watch to
achieve long-term and mass market success, developers across
categories need to find innovative ways to leverage wearable
form factors and deliver benefits that today’s smartphones
cannot provide on their own. This may include vertical-
specific use cases — such as monitoring operations of staff or
equipment — to augmenting the physical world with relevant
information.
36
7
6
5
4
3
2
0
App Annie 2015 Retrospective
© App Annie 2016
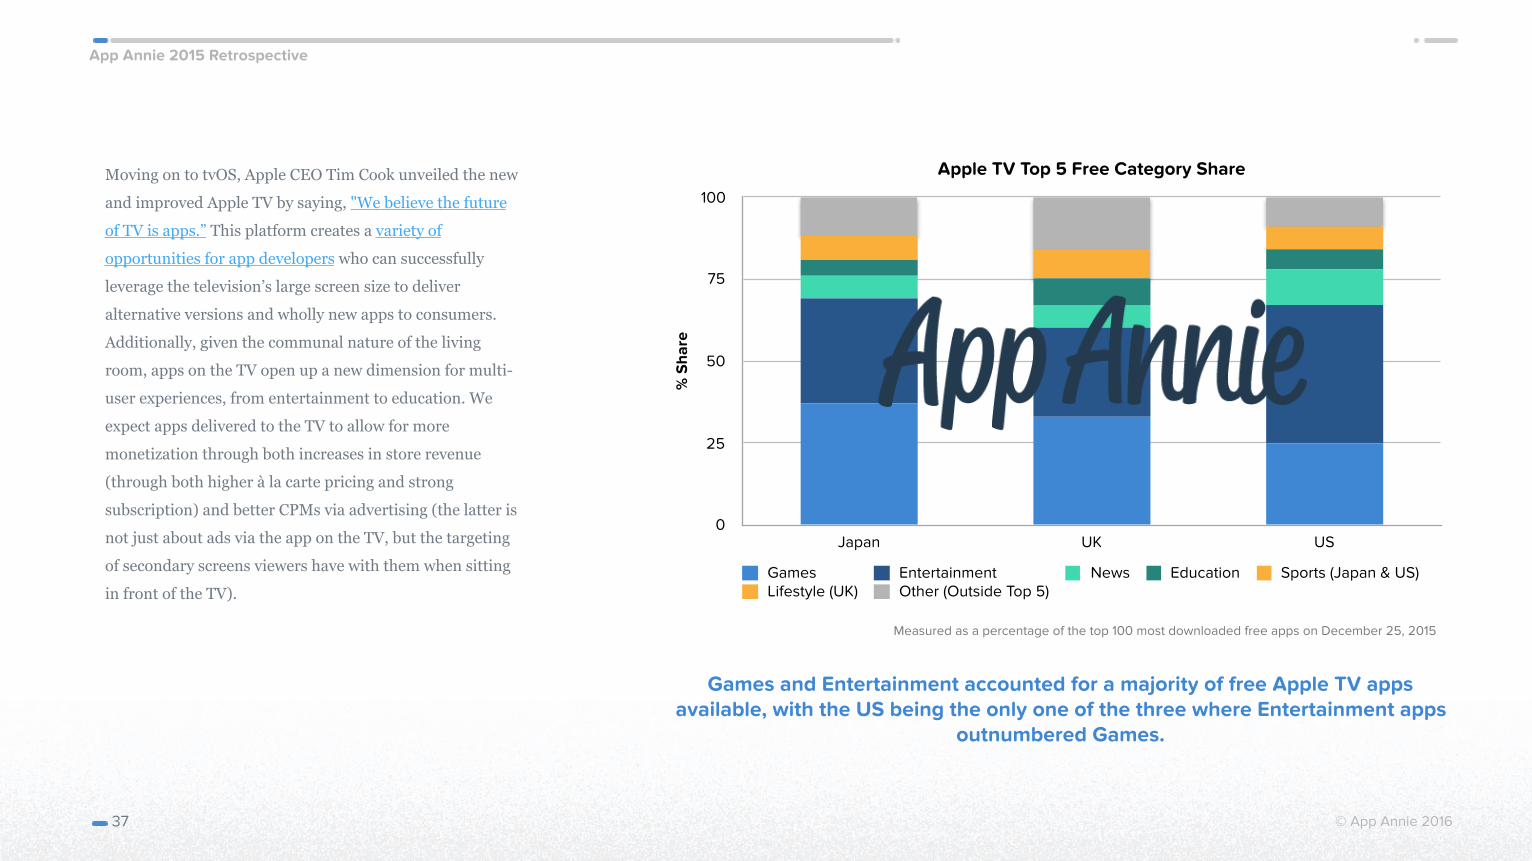
Moving on to tvOS, Apple CEO Tim Cook unveiled the new
and improved Apple TV by saying, "We believe the future
of TV is apps.” This platform creates a variety of
opportunities for app developers who can successfully
leverage the television’s large screen size to deliver
alternative versions and wholly new apps to consumers.
Additionally, given the communal nature of the living
room, apps on the TV open up a new dimension for multi-
user experiences, from entertainment to education. We
expect apps delivered to the TV to allow for more
monetization through both increases in store revenue
(through both higher à la carte pricing and strong
subscription) and better CPMs via advertising (the latter is
not just about ads via the app on the TV, but the targeting
of secondary screens viewers have with them when sitting
in front of the TV).
37
Apple TV Top 5 Free Category Share
% S
hare
0
25
50
75
100
Japan UK US
Games Entertainment News Education Sports (Japan & US)Lifestyle (UK) Other (Outside Top 5)
Games and Entertainment accounted for a majority of free Apple TV apps available, with the US being the only one of the three where Entertainment apps
outnumbered Games.
Measured as a percentage of the top 100 most downloaded free apps on December 25, 2015
App Annie 2015 Retrospective
© App Annie 2016
The move beyond smartphones and tablets to wearables and TV — and even emerging opportunities such as VR, home IoT
and automotive — signifies just how embedded apps are in people's daily lives. The evolution of apps will continue as
users and developers embrace new ways to unleash the power of apps on other device categories that are already
connected as well as those that have yet be networked.
38
App Annie 2015 Retrospective
Top Apps and Companies by Country
App Annie 2015 Retrospective
© App Annie 2016
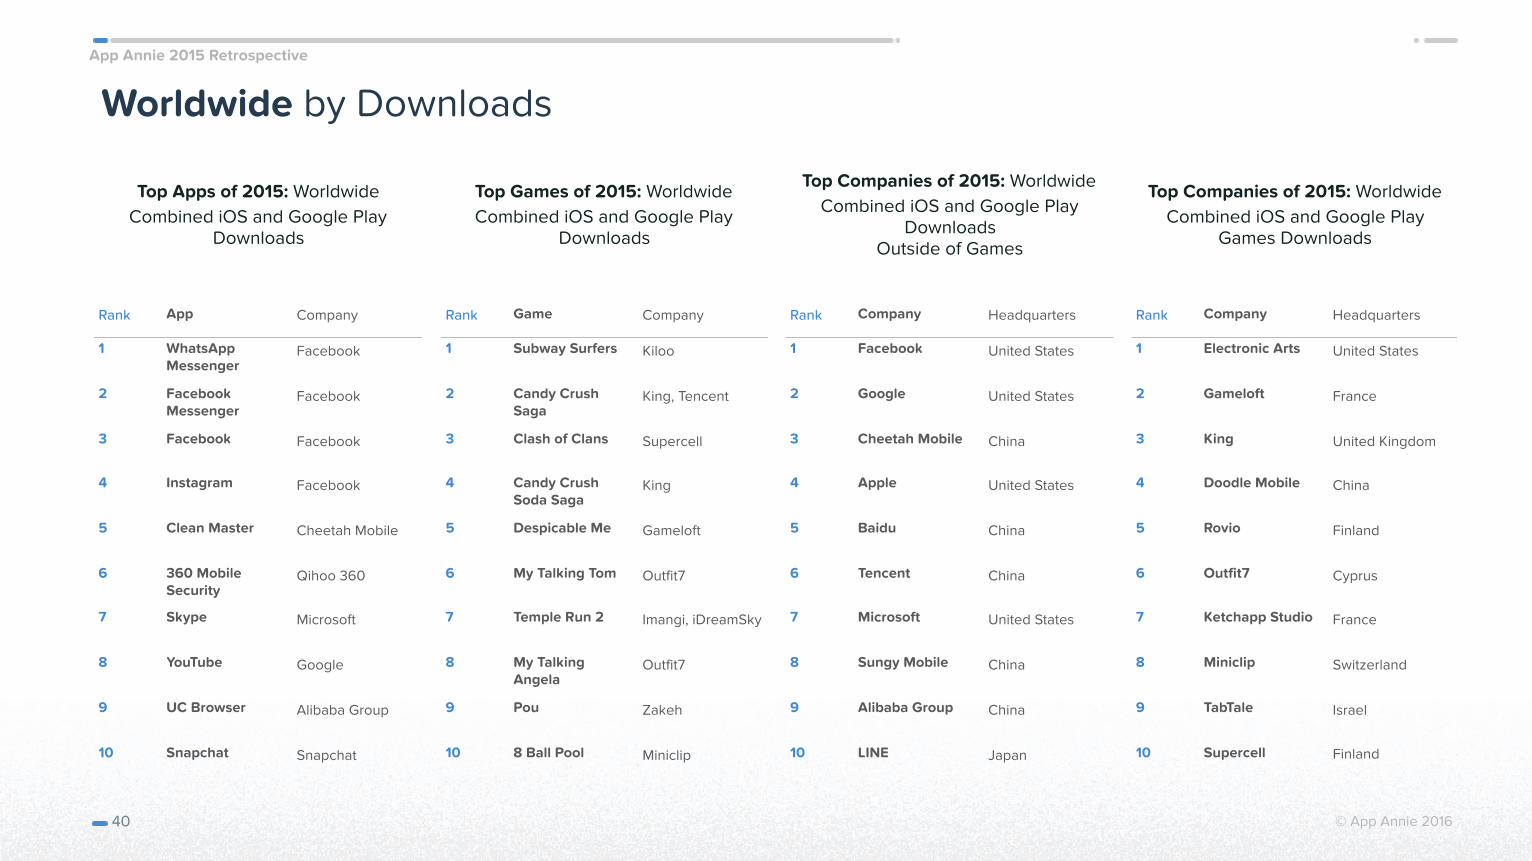
Worldwide by Downloads
Rank App Company
1 WhatsApp Messenger
2 Facebook Messenger
3 Facebook Facebook
4 Instagram Facebook
5 Clean Master Cheetah Mobile
6 360 Mobile Security
Qihoo 360
7 Skype Microsoft
8 YouTube Google
9 UC Browser Alibaba Group
10 Snapchat Snapchat
Top Apps of 2015: Worldwide Combined iOS and Google Play
Downloads
Rank Game Company
1 Subway Surfers Kiloo
2 Candy Crush Saga
King, Tencent
3 Clash of Clans Supercell
4 Candy Crush Soda Saga
King
5 Despicable Me Gameloft
6 My Talking Tom Outfit7
7 Temple Run 2 Imangi, iDreamSky
8 My Talking Angela
Outfit7
9 Pou Zakeh
10 8 Ball Pool Miniclip
40
Rank Company Headquarters
1 Facebook United States
2 Google United States
3 Cheetah Mobile China
4 Apple United States
5 Baidu China
6 Tencent China
7 Microsoft United States
8 Sungy Mobile China
9 Alibaba Group China
10 LINE Japan
Rank Company Headquarters
1 Electronic Arts United States
2 Gameloft France
3 King United Kingdom
4 Doodle Mobile China
5 Rovio Finland
6 Outfit7 Cyprus
7 Ketchapp Studio France
8 Miniclip Switzerland
9 TabTale Israel
10 Supercell Finland
Top Games of 2015: Worldwide Combined iOS and Google Play
Downloads
Top Companies of 2015: Worldwide Combined iOS and Google Play
Downloads Outside of Games
Top Companies of 2015: Worldwide Combined iOS and Google Play
Games Downloads
App Annie 2015 Retrospective
© App Annie 2016
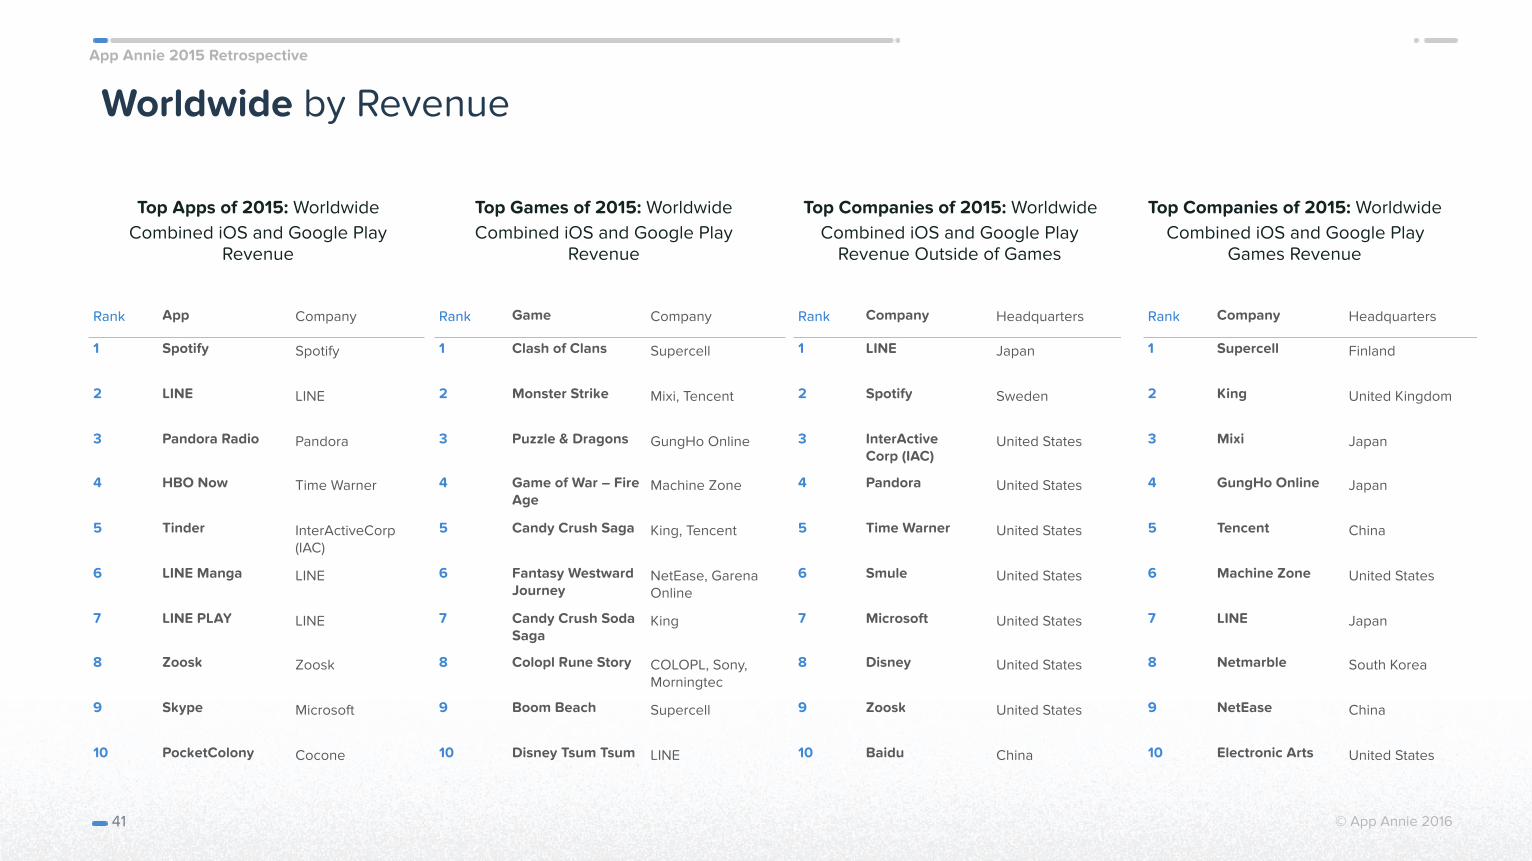
Worldwide by Revenue
Top Apps of 2015: Worldwide Combined iOS and Google Play
Revenue
41
Top Games of 2015: Worldwide Combined iOS and Google Play
Revenue
Top Companies of 2015: Worldwide Combined iOS and Google Play
Revenue Outside of Games
Top Companies of 2015: Worldwide Combined iOS and Google Play
Games Revenue
Rank App Company
1 Spotify Spotify
2 LINE LINE
3 Pandora Radio Pandora
4 HBO Now Time Warner
5 Tinder InterActiveCorp (IAC)
6 LINE Manga LINE
7 LINE PLAY LINE
8 Zoosk Zoosk
9 Skype Microsoft
10 PocketColony Cocone
Rank Game Company
1 Clash of Clans Supercell
2 Monster Strike Mixi, Tencent
3 Puzzle & Dragons GungHo Online
4 Game of War – Fire Age
Machine Zone
5 Candy Crush Saga King, Tencent
6 Fantasy Westward Journey
NetEase, Garena Online
7 Candy Crush Soda Saga
King
8 Colopl Rune Story COLOPL, Sony, Morningtec
9 Boom Beach Supercell
10 Disney Tsum Tsum LINE
Rank Company Headquarters
1 LINE Japan
2 Spotify Sweden
3 InterActive Corp (IAC)
United States
4 Pandora United States
5 Time Warner United States
6 Smule United States
7 Microsoft United States
8 Disney United States
9 Zoosk United States
10 Baidu China
Rank Company Headquarters
1 Supercell Finland
2 King United Kingdom
3 Mixi Japan
4 GungHo Online Japan
5 Tencent China
6 Machine Zone United States
7 LINE Japan
8 Netmarble South Korea
9 NetEase China
10 Electronic Arts United States
App Annie 2015 Retrospective
© App Annie 2016
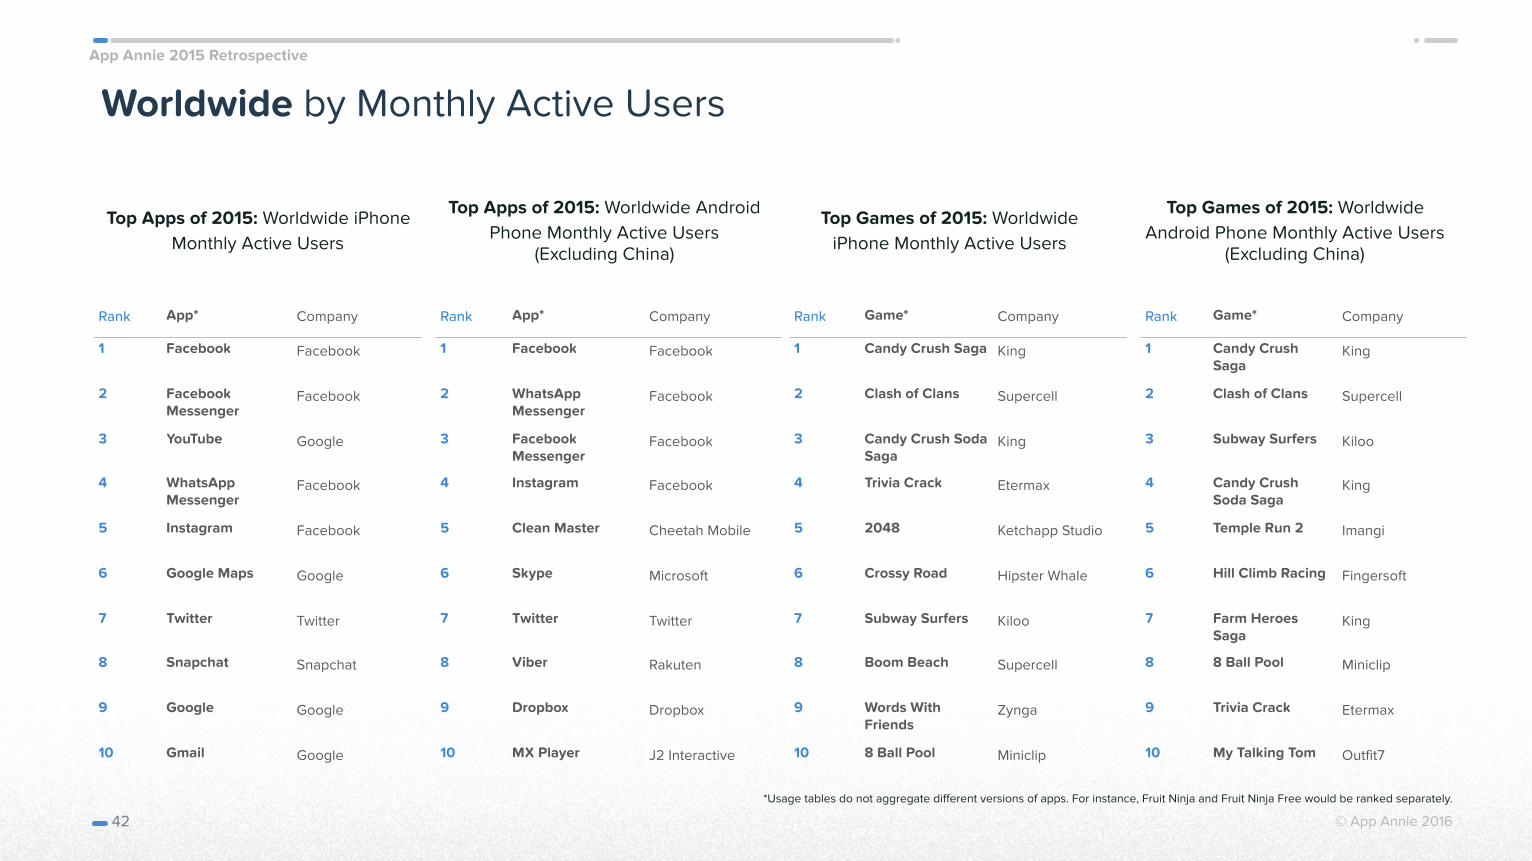
Worldwide by Monthly Active Users
Top Apps of 2015: Worldwide iPhone Monthly Active Users
42
Top Apps of 2015: Worldwide Android Phone Monthly Active Users
(Excluding China)
Top Games of 2015: Worldwide iPhone Monthly Active Users
Top Games of 2015: Worldwide Android Phone Monthly Active Users
(Excluding China)
Rank App* Company
1 Facebook Facebook
2 Facebook Messenger
3 YouTube Google
4 WhatsApp Messenger
5 Instagram Facebook
6 Google Maps Google
7 Twitter Twitter
8 Snapchat Snapchat
9 Google Google
10 Gmail Google
Rank App* Company
1 Facebook Facebook
2 WhatsApp Messenger
3 Facebook Messenger
4 Instagram Facebook
5 Clean Master Cheetah Mobile
6 Skype Microsoft
7 Twitter Twitter
8 Viber Rakuten
9 Dropbox Dropbox
10 MX Player J2 Interactive
Rank Game* Company
1 Candy Crush Saga King
2 Clash of Clans Supercell
3 Candy Crush Soda Saga
King
4 Trivia Crack Etermax
5 2048 Ketchapp Studio
6 Crossy Road Hipster Whale
7 Subway Surfers Kiloo
8 Boom Beach Supercell
9 Words With Friends
Zynga
10 8 Ball Pool Miniclip
Rank Game* Company
1 Candy Crush Saga
King
2 Clash of Clans Supercell
3 Subway Surfers Kiloo
4 Candy Crush Soda Saga
King
5 Temple Run 2 Imangi
6 Hill Climb Racing Fingersoft
7 Farm Heroes Saga
King
8 8 Ball Pool Miniclip
9 Trivia Crack Etermax
10 My Talking Tom Outfit7
*Usage tables do not aggregate different versions of apps. For instance, Fruit Ninja and Fruit Ninja Free would be ranked separately.
App Annie 2015 Retrospective
© App Annie 2016
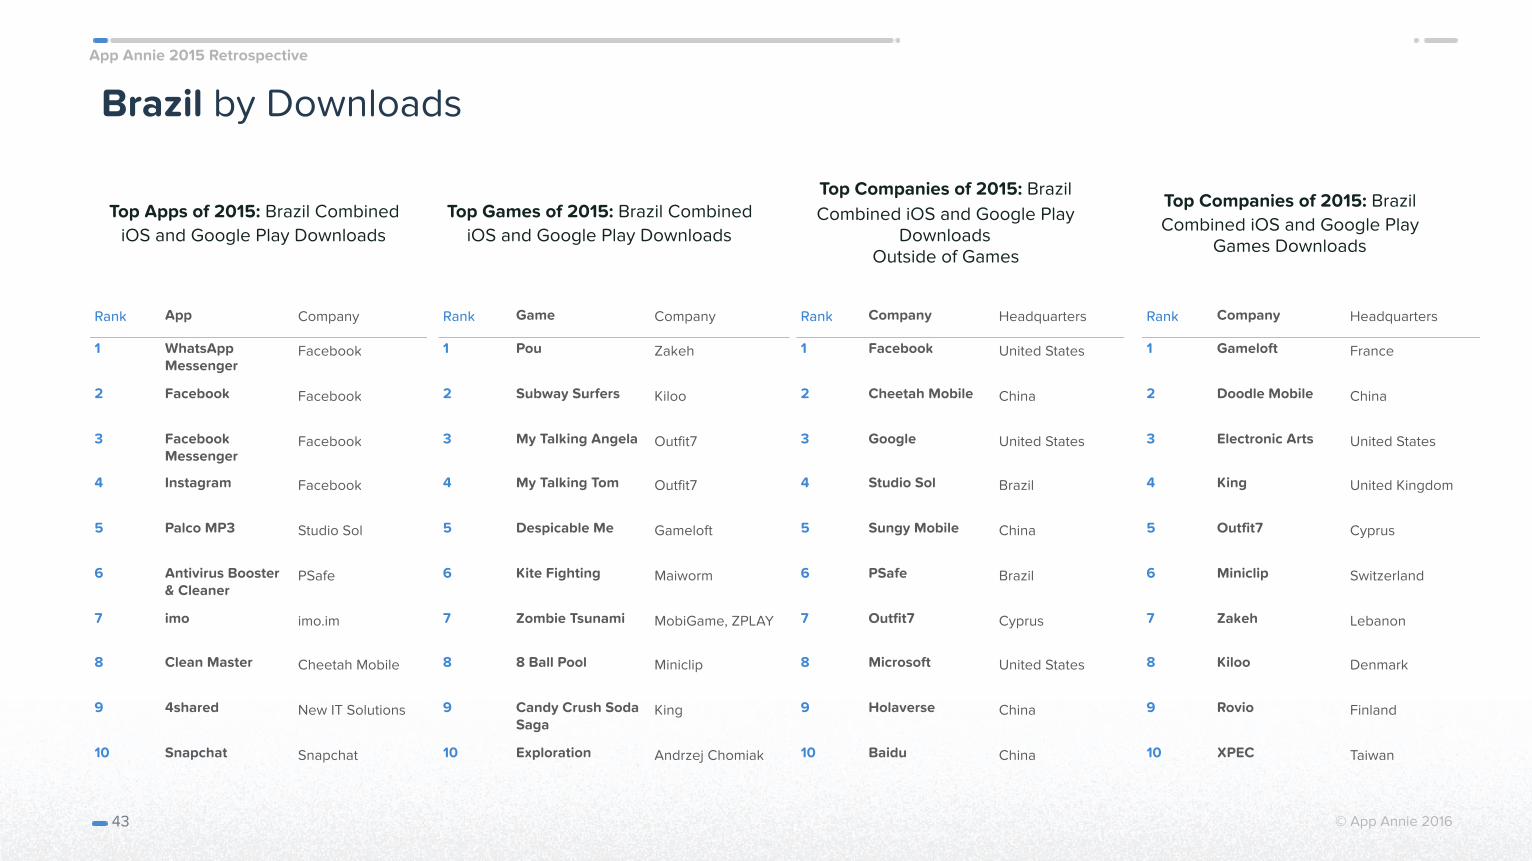
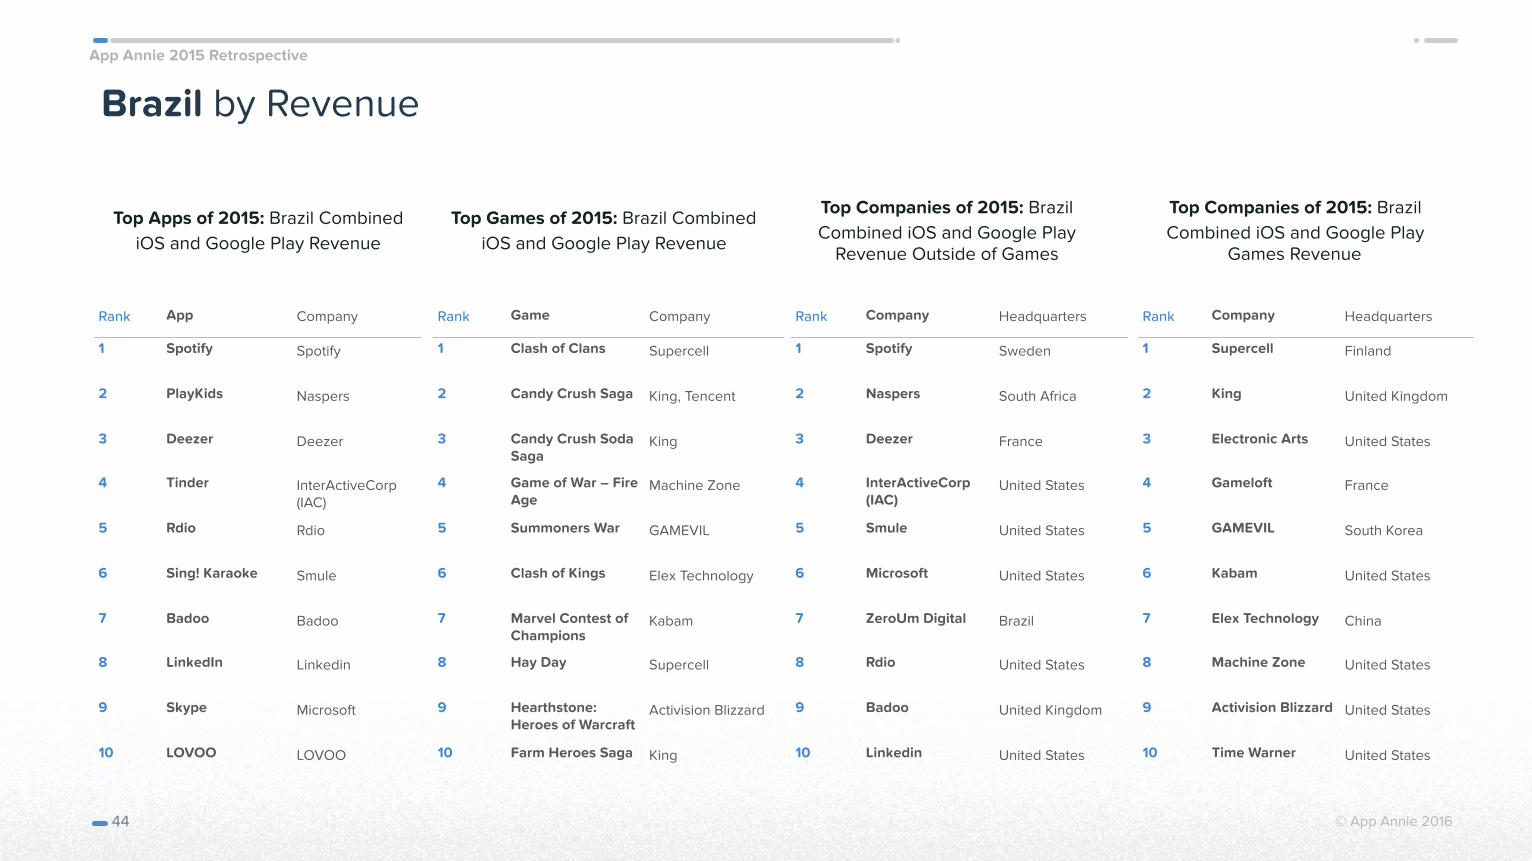
Brazil by Downloads
Top Apps of 2015: Brazil Combined iOS and Google Play Downloads
43
Top Games of 2015: Brazil Combined iOS and Google Play Downloads
Top Companies of 2015: Brazil Combined iOS and Google Play
Downloads Outside of Games
Top Companies of 2015: Brazil Combined iOS and Google Play
Games Downloads
Rank App Company
1 WhatsApp Messenger
2 Facebook Facebook
3 Facebook Messenger
4 Instagram Facebook
5 Palco MP3 Studio Sol
6 Antivirus Booster & Cleaner
PSafe
7 imo imo.im
8 Clean Master Cheetah Mobile
9 4shared New IT Solutions
10 Snapchat Snapchat
Rank Game Company
1 Pou Zakeh
2 Subway Surfers Kiloo
3 My Talking Angela Outfit7
4 My Talking Tom Outfit7
5 Despicable Me Gameloft
6 Kite Fighting Maiworm
7 Zombie Tsunami MobiGame, ZPLAY
8 8 Ball Pool Miniclip
9 Candy Crush Soda Saga
King
10 Exploration Andrzej Chomiak
Rank Company Headquarters
1 Facebook United States
2 Cheetah Mobile China
3 Google United States
4 Studio Sol Brazil
5 Sungy Mobile China
6 PSafe Brazil
7 Outfit7 Cyprus
8 Microsoft United States
9 Holaverse China
10 Baidu China
Rank Company Headquarters
1 Gameloft France
2 Doodle Mobile China
3 Electronic Arts United States
4 King United Kingdom
5 Outfit7 Cyprus
6 Miniclip Switzerland
7 Zakeh Lebanon
8 Kiloo Denmark
9 Rovio Finland
10 XPEC Taiwan
App Annie 2015 Retrospective
© App Annie 2016
Brazil by Revenue
Top Apps of 2015: Brazil Combined iOS and Google Play Revenue
44
Top Games of 2015: Brazil Combined iOS and Google Play Revenue
Top Companies of 2015: Brazil Combined iOS and Google Play
Revenue Outside of Games
Top Companies of 2015: Brazil Combined iOS and Google Play
Games Revenue
Rank App Company
1 Spotify Spotify
2 PlayKids Naspers
3 Deezer Deezer
4 Tinder InterActiveCorp (IAC)
5 Rdio Rdio
6 Sing! Karaoke Smule
7 Badoo Badoo
8 LinkedIn Linkedin
9 Skype Microsoft
10 LOVOO LOVOO
Rank Game Company
1 Clash of Clans Supercell
2 Candy Crush Saga King, Tencent
3 Candy Crush Soda Saga
King
4 Game of War – Fire Age
Machine Zone
5 Summoners War GAMEVIL
6 Clash of Kings Elex Technology
7 Marvel Contest of Champions
Kabam
8 Hay Day Supercell
9 Hearthstone: Heroes of Warcraft
Activision Blizzard
10 Farm Heroes Saga King
Rank Company Headquarters
1 Spotify Sweden
2 Naspers South Africa
3 Deezer France
4 InterActiveCorp (IAC)
United States
5 Smule United States
6 Microsoft United States
7 ZeroUm Digital Brazil
8 Rdio United States
9 Badoo United Kingdom
10 Linkedin United States
Rank Company Headquarters
1 Supercell Finland
2 King United Kingdom
3 Electronic Arts United States
4 Gameloft France
5 GAMEVIL South Korea
6 Kabam United States
7 Elex Technology China
8 Machine Zone United States
9 Activision Blizzard United States
10 Time Warner United States
App Annie 2015 Retrospective
© App Annie 2016
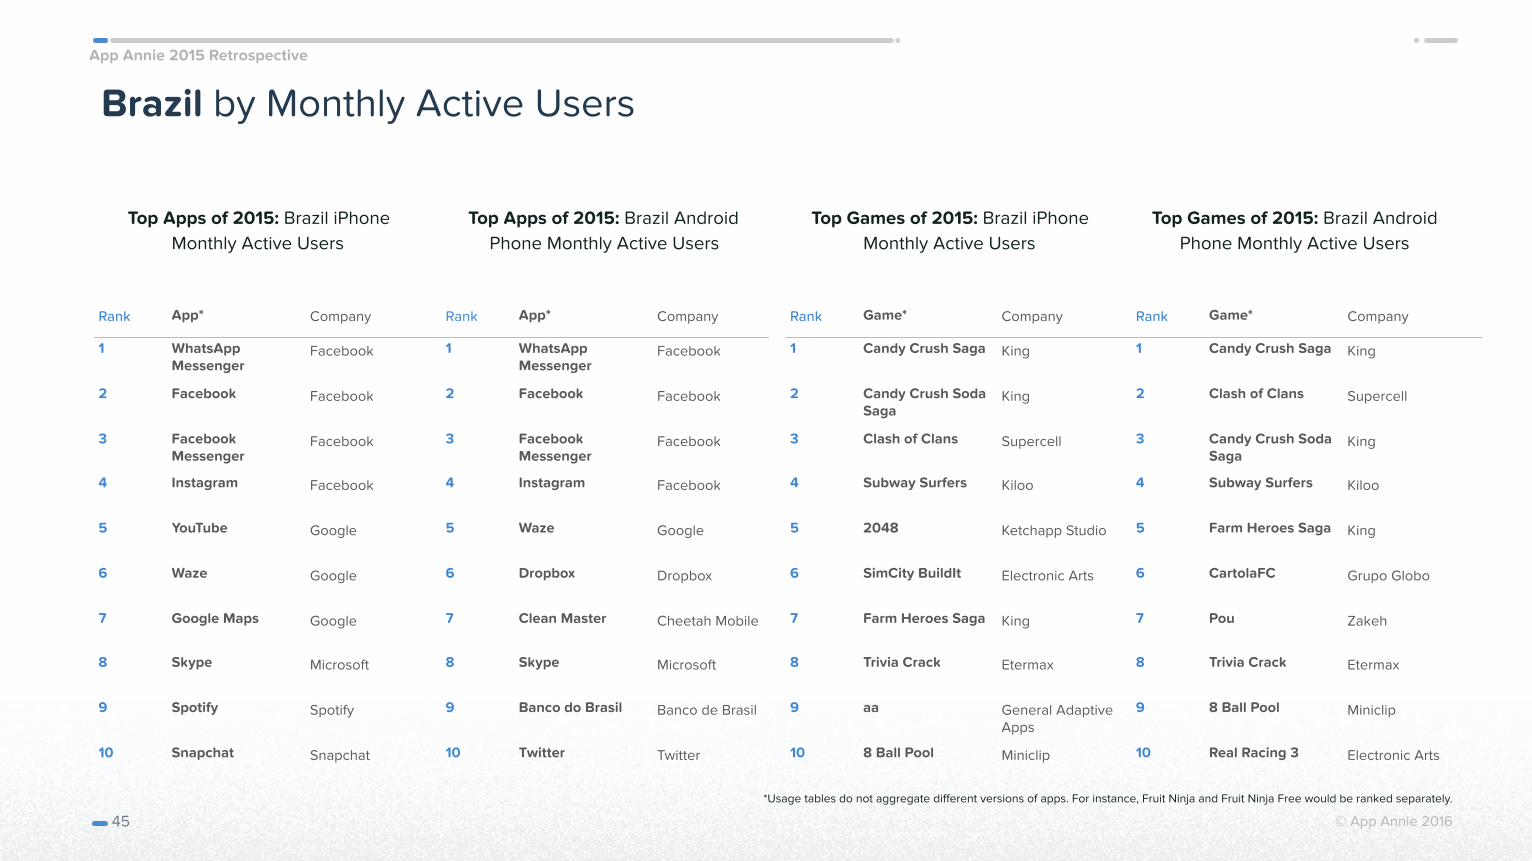
Brazil by Monthly Active Users
Top Apps of 2015: Brazil iPhone Monthly Active Users
45
Top Apps of 2015: Brazil Android Phone Monthly Active Users
Top Games of 2015: Brazil iPhone Monthly Active Users
Top Games of 2015: Brazil Android Phone Monthly Active Users
Rank App* Company
1 WhatsApp Messenger
2 Facebook Facebook
3 Facebook Messenger
4 Instagram Facebook
5 YouTube Google
6 Waze Google
7 Google Maps Google
8 Skype Microsoft
9 Spotify Spotify
10 Snapchat Snapchat
Rank App* Company
1 WhatsApp Messenger
2 Facebook Facebook
3 Facebook Messenger
4 Instagram Facebook
5 Waze Google
6 Dropbox Dropbox
7 Clean Master Cheetah Mobile
8 Skype Microsoft
9 Banco do Brasil Banco de Brasil
10 Twitter Twitter
Rank Game* Company
1 Candy Crush Saga King
2 Candy Crush Soda Saga
King
3 Clash of Clans Supercell
4 Subway Surfers Kiloo
5 2048 Ketchapp Studio
6 SimCity BuildIt Electronic Arts
7 Farm Heroes Saga King
8 Trivia Crack Etermax
9 aa General Adaptive Apps
10 8 Ball Pool Miniclip
Rank Game* Company
1 Candy Crush Saga King
2 Clash of Clans Supercell
3 Candy Crush Soda Saga
King
4 Subway Surfers Kiloo
5 Farm Heroes Saga King
6 CartolaFC Grupo Globo
7 Pou Zakeh
8 Trivia Crack Etermax
9 8 Ball Pool Miniclip
10 Real Racing 3 Electronic Arts
*Usage tables do not aggregate different versions of apps. For instance, Fruit Ninja and Fruit Ninja Free would be ranked separately.
App Annie 2015 Retrospective
© App Annie 2016
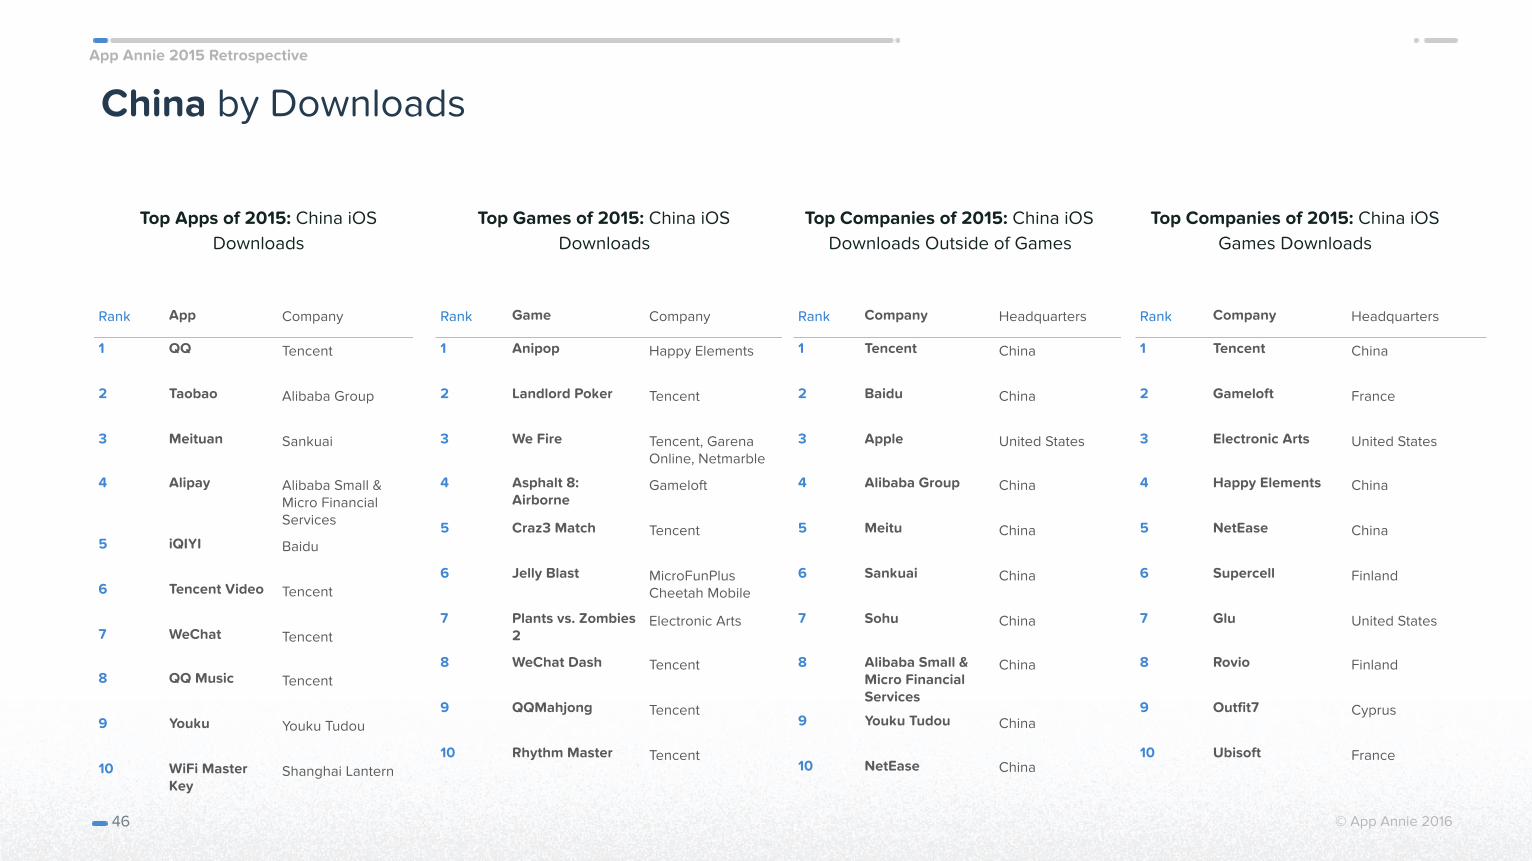
China by Downloads
Top Apps of 2015: China iOS Downloads
46
Top Games of 2015: China iOS Downloads
Top Companies of 2015: China iOS Downloads Outside of Games
Top Companies of 2015: China iOS Games Downloads
Rank App Company
1 QQ Tencent
2 Taobao Alibaba Group
3 Meituan Sankuai
4 Alipay Alibaba Small & Micro Financial Services
5 iQIYI Baidu
6 Tencent Video Tencent
7 WeChat Tencent
8 QQ Music Tencent
9 Youku Youku Tudou
10 WiFi Master Key
Shanghai Lantern
Rank Game Company
1 Anipop Happy Elements
2 Landlord Poker Tencent
3 We Fire Tencent, Garena Online, Netmarble
4 Asphalt 8: Airborne
Gameloft
5 Craz3 Match Tencent
6 Jelly Blast MicroFunPlus Cheetah Mobile
7 Plants vs. Zombies 2
Electronic Arts
8 WeChat Dash Tencent
9 QQMahjong Tencent
10 Rhythm Master Tencent
Rank Company Headquarters
1 Tencent China
2 Baidu China
3 Apple United States
4 Alibaba Group China
5 Meitu China
6 Sankuai China
7 Sohu China
8 Alibaba Small & Micro Financial Services
China
9 Youku Tudou China
10 NetEase China
Rank Company Headquarters
1 Tencent China
2 Gameloft France
3 Electronic Arts United States
4 Happy Elements China
5 NetEase China
6 Supercell Finland
7 Glu United States
8 Rovio Finland
9 Outfit7 Cyprus
10 Ubisoft France
App Annie 2015 Retrospective
© App Annie 2016
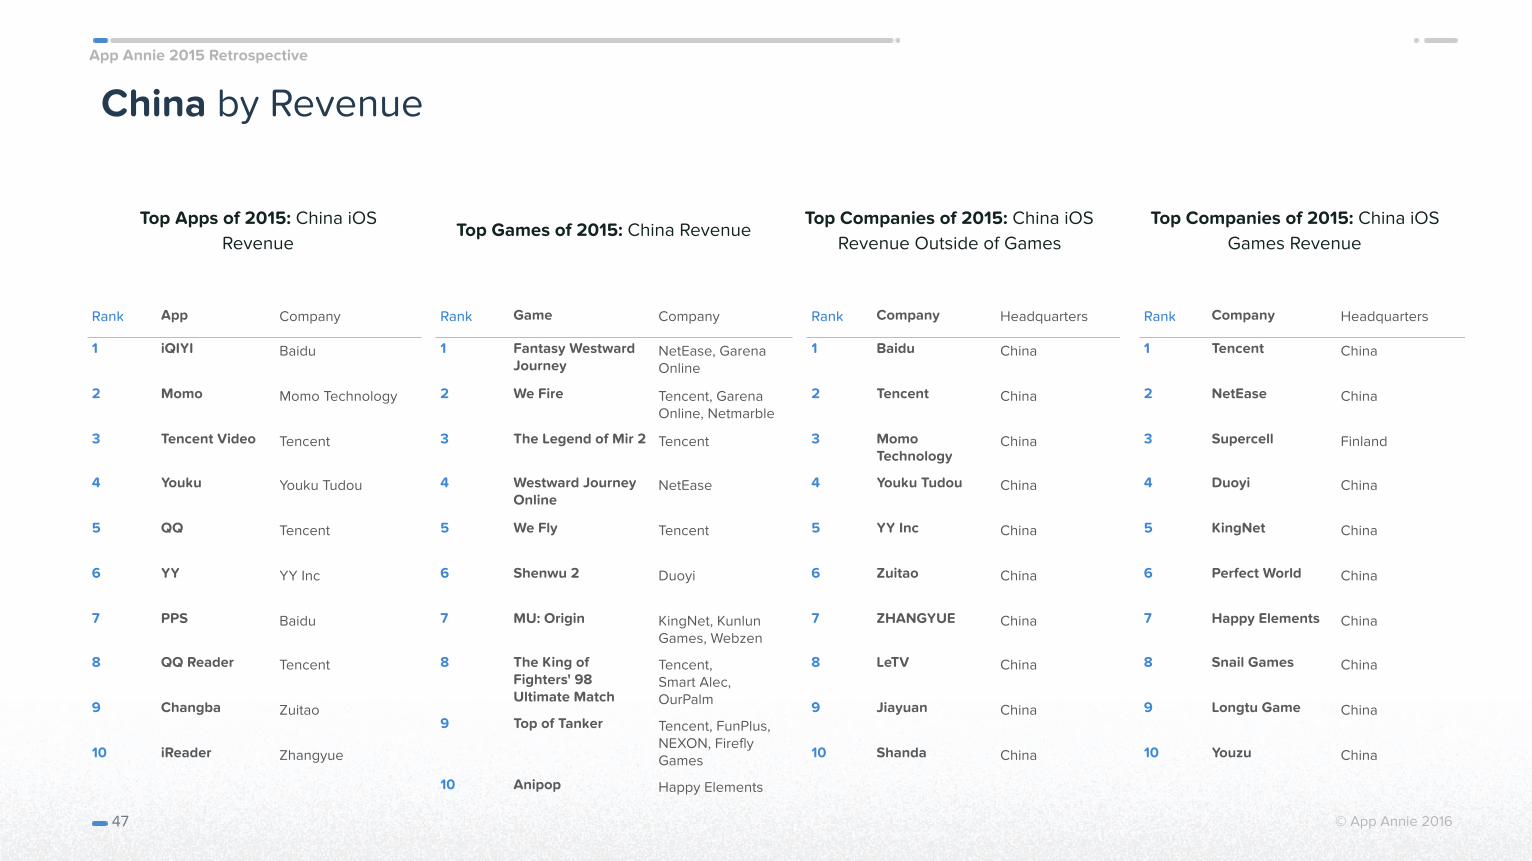
China by Revenue
Top Apps of 2015: China iOS Revenue
47
Top Games of 2015: China RevenueTop Companies of 2015: China iOS
Revenue Outside of GamesTop Companies of 2015: China iOS
Games Revenue
Rank App Company
1 iQIYI Baidu
2 Momo Momo Technology
3 Tencent Video Tencent
4 Youku Youku Tudou
5 QQ Tencent
6 YY YY Inc
7 PPS Baidu
8 QQ Reader Tencent
9 Changba Zuitao
10 iReader Zhangyue
Rank Game Company
1 Fantasy Westward Journey
NetEase, Garena Online
2 We Fire Tencent, Garena Online, Netmarble
3 The Legend of Mir 2 Tencent
4 Westward Journey Online
NetEase
5 We Fly Tencent
6 Shenwu 2 Duoyi
7 MU: Origin KingNet, Kunlun Games, Webzen
8 The King of Fighters' 98 Ultimate Match
Tencent, Smart Alec, OurPalm
9 Top of Tanker Tencent, FunPlus, NEXON, Firefly Games
10 Anipop Happy Elements
Rank Company Headquarters
1 Baidu China
2 Tencent China
3 Momo Technology
China
4 Youku Tudou China
5 YY Inc China
6 Zuitao China
7 ZHANGYUE China
8 LeTV China
9 Jiayuan China
10 Shanda China
Rank Company Headquarters
1 Tencent China
2 NetEase China
3 Supercell Finland
4 Duoyi China
5 KingNet China
6 Perfect World China
7 Happy Elements China
8 Snail Games China
9 Longtu Game China
10 Youzu China
App Annie 2015 Retrospective
© App Annie 2016
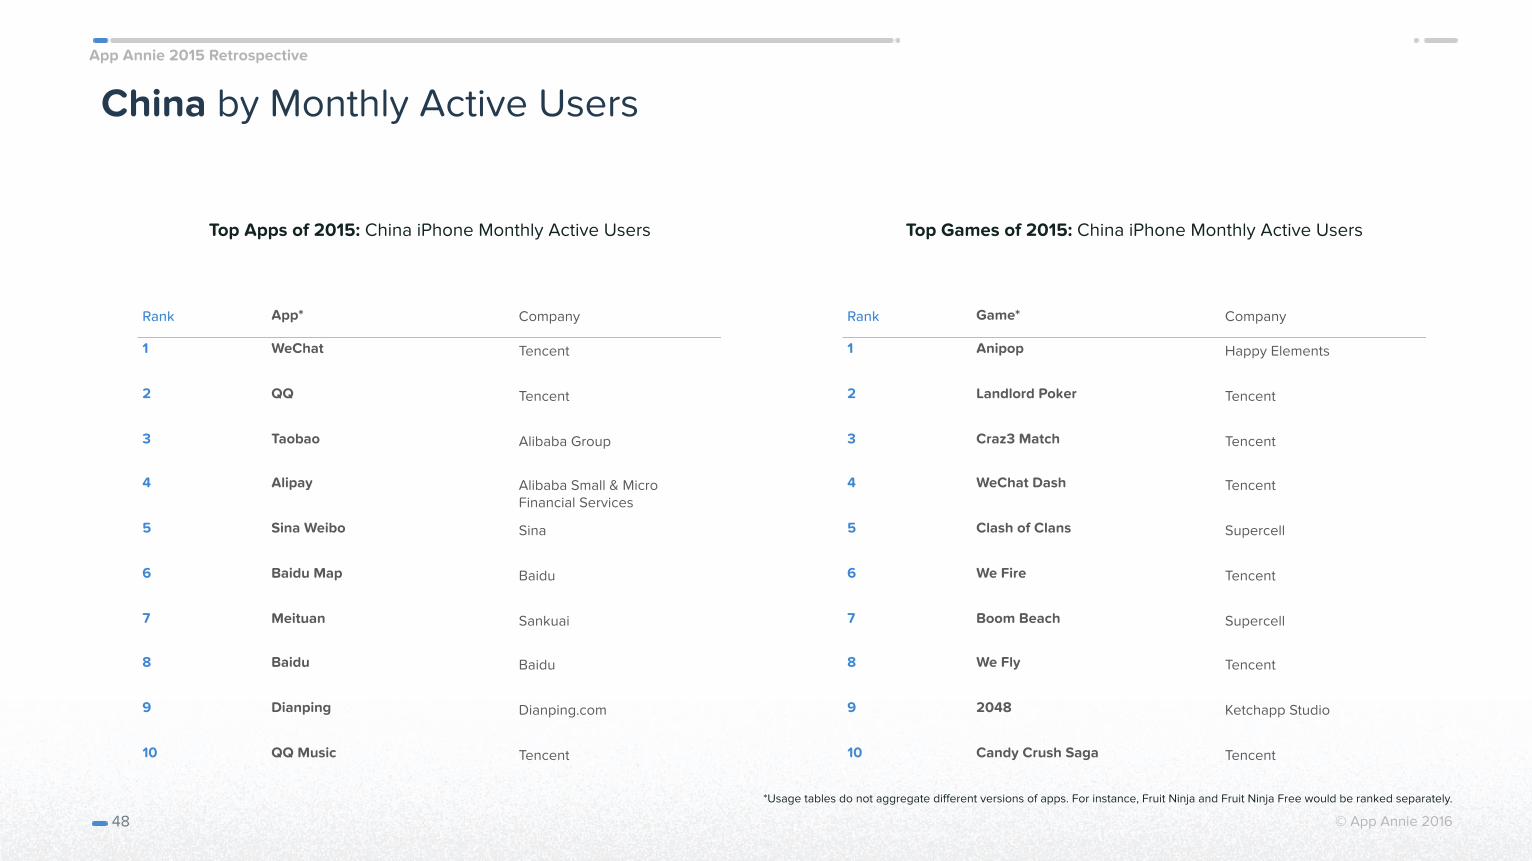
China by Monthly Active Users
Top Apps of 2015: China iPhone Monthly Active Users
48
Top Games of 2015: China iPhone Monthly Active Users
Rank App* Company
1 WeChat Tencent
2 QQ Tencent
3 Taobao Alibaba Group
4 Alipay Alibaba Small & Micro Financial Services
5 Sina Weibo Sina
6 Baidu Map Baidu
7 Meituan Sankuai
8 Baidu Baidu
9 Dianping Dianping.com
10 QQ Music Tencent
Rank Game* Company
1 Anipop Happy Elements
2 Landlord Poker Tencent
3 Craz3 Match Tencent
4 WeChat Dash Tencent
5 Clash of Clans Supercell
6 We Fire Tencent
7 Boom Beach Supercell
8 We Fly Tencent
9 2048 Ketchapp Studio
10 Candy Crush Saga Tencent
*Usage tables do not aggregate different versions of apps. For instance, Fruit Ninja and Fruit Ninja Free would be ranked separately.
App Annie 2015 Retrospective
© App Annie 2016
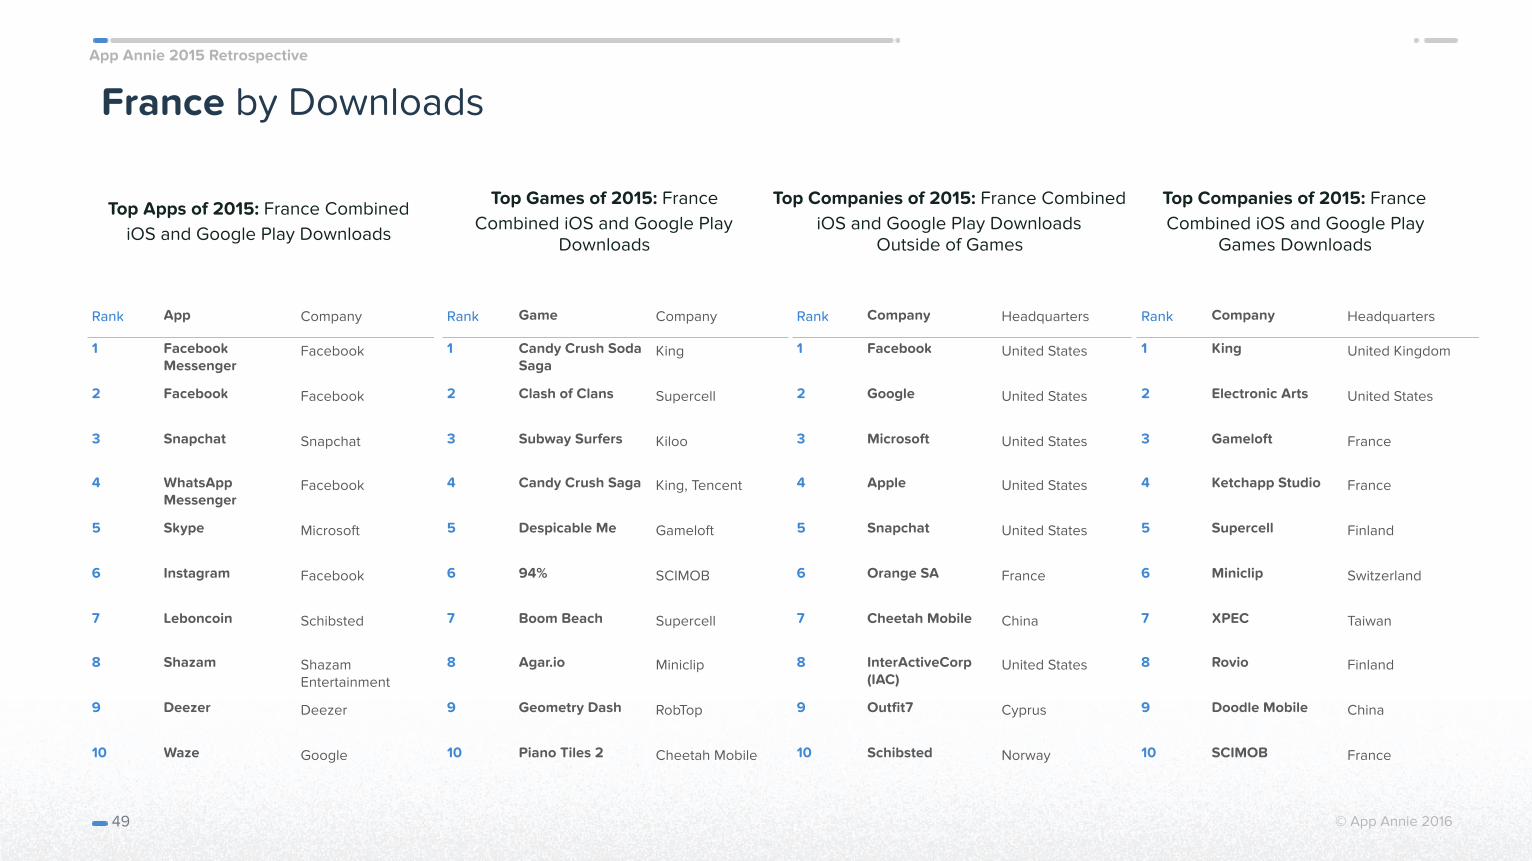
France by Downloads
Top Apps of 2015: France Combined iOS and Google Play Downloads
49
Top Games of 2015: France Combined iOS and Google Play
Downloads
Top Companies of 2015: France Combined iOS and Google Play Downloads
Outside of Games
Top Companies of 2015: France Combined iOS and Google Play
Games Downloads
Rank App Company
1 Facebook Messenger
2 Facebook Facebook
3 Snapchat Snapchat
4 WhatsApp Messenger
5 Skype Microsoft
6 Instagram Facebook
7 Leboncoin Schibsted
8 Shazam Shazam Entertainment
9 Deezer Deezer
10 Waze Google
Rank Game Company
1 Candy Crush Soda Saga
King
2 Clash of Clans Supercell
3 Subway Surfers Kiloo
4 Candy Crush Saga King, Tencent
5 Despicable Me Gameloft
6 94% SCIMOB
7 Boom Beach Supercell
8 Agar.io Miniclip
9 Geometry Dash RobTop
10 Piano Tiles 2 Cheetah Mobile
Rank Company Headquarters
1 Facebook United States
2 Google United States
3 Microsoft United States
4 Apple United States
5 Snapchat United States
6 Orange SA France
7 Cheetah Mobile China
8 InterActiveCorp (IAC)
United States
9 Outfit7 Cyprus
10 Schibsted Norway
Rank Company Headquarters
1 King United Kingdom
2 Electronic Arts United States
3 Gameloft France
4 Ketchapp Studio France
5 Supercell Finland
6 Miniclip Switzerland
7 XPEC Taiwan
8 Rovio Finland
9 Doodle Mobile China
10 SCIMOB France
App Annie 2015 Retrospective
© App Annie 2016
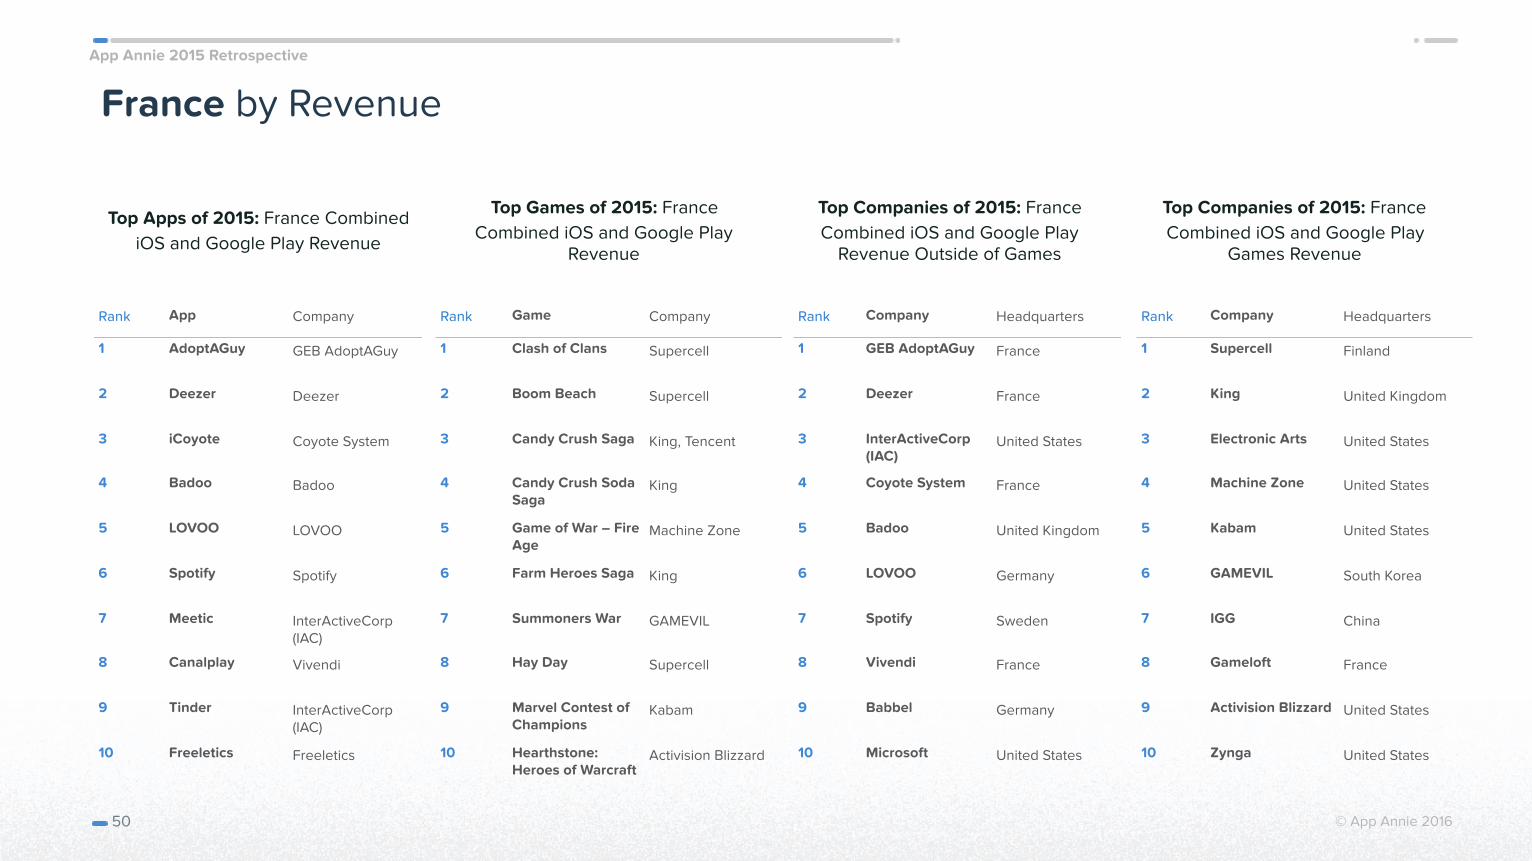
France by Revenue
Top Apps of 2015: France Combined iOS and Google Play Revenue
50
Top Games of 2015: France Combined iOS and Google Play
Revenue
Top Companies of 2015: France Combined iOS and Google Play
Revenue Outside of Games
Top Companies of 2015: France Combined iOS and Google Play
Games Revenue
Rank App Company
1 AdoptAGuy GEB AdoptAGuy
2 Deezer Deezer
3 iCoyote Coyote System
4 Badoo Badoo
5 LOVOO LOVOO
6 Spotify Spotify
7 Meetic InterActiveCorp (IAC)
8 Canalplay Vivendi
9 Tinder InterActiveCorp (IAC)
10 Freeletics Freeletics
Rank Game Company
1 Clash of Clans Supercell
2 Boom Beach Supercell
3 Candy Crush Saga King, Tencent
4 Candy Crush Soda Saga
King
5 Game of War – Fire Age
Machine Zone
6 Farm Heroes Saga King
7 Summoners War GAMEVIL
8 Hay Day Supercell
9 Marvel Contest of Champions
Kabam
10 Hearthstone: Heroes of Warcraft
Activision Blizzard
Rank Company Headquarters
1 GEB AdoptAGuy France
2 Deezer France
3 InterActiveCorp (IAC)
United States
4 Coyote System France
5 Badoo United Kingdom
6 LOVOO Germany
7 Spotify Sweden
8 Vivendi France
9 Babbel Germany
10 Microsoft United States
Rank Company Headquarters
1 Supercell Finland
2 King United Kingdom
3 Electronic Arts United States
4 Machine Zone United States
5 Kabam United States
6 GAMEVIL South Korea
7 IGG China
8 Gameloft France
9 Activision Blizzard United States
10 Zynga United States
App Annie 2015 Retrospective
© App Annie 2016
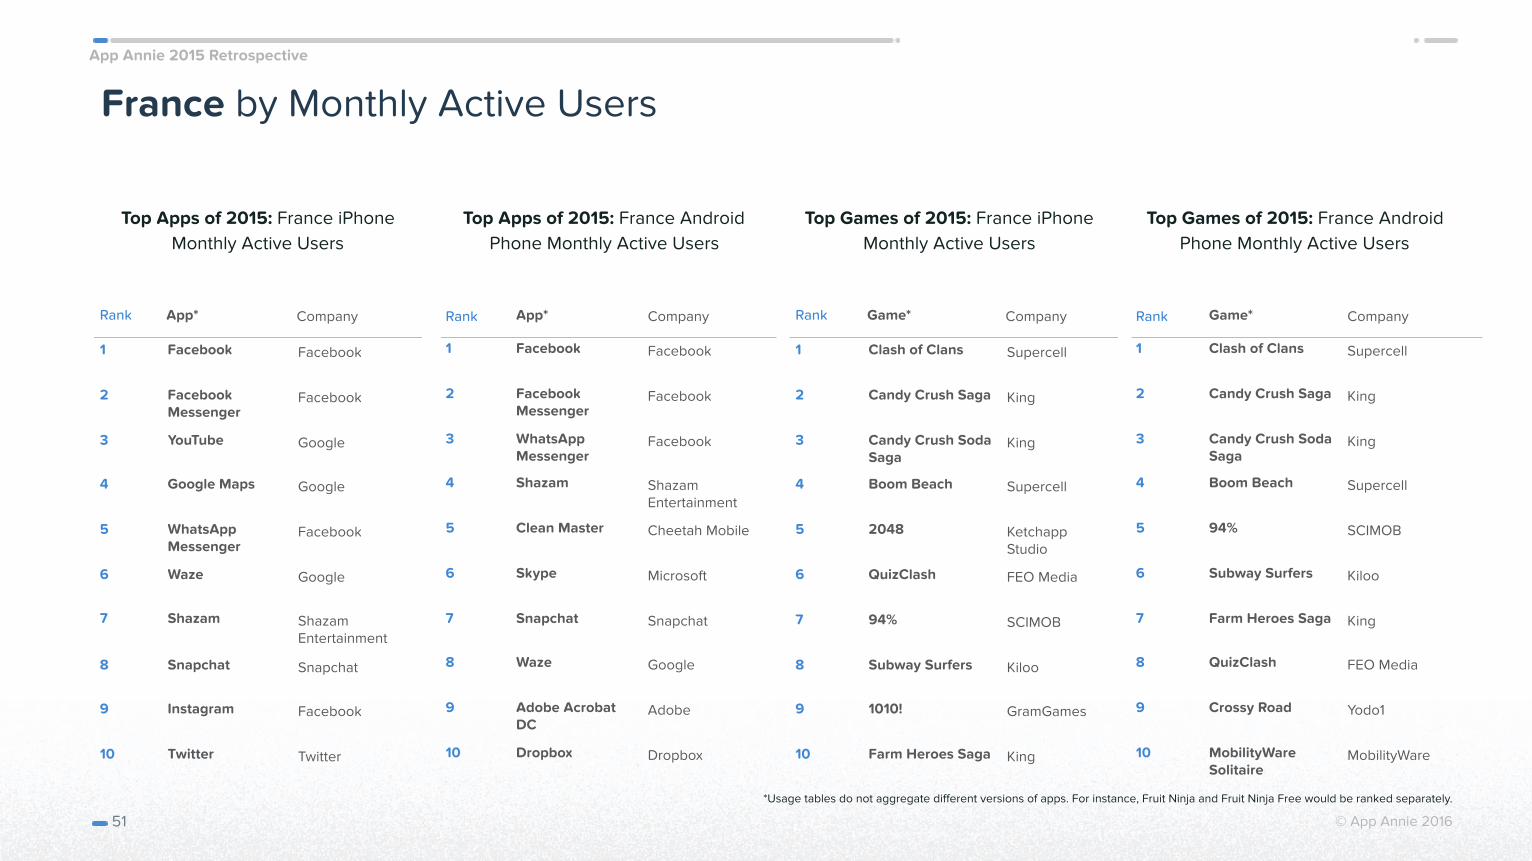
France by Monthly Active Users
Top Apps of 2015: France iPhone Monthly Active Users
51
Top Apps of 2015: France Android Phone Monthly Active Users
Top Games of 2015: France iPhone Monthly Active Users
Top Games of 2015: France Android Phone Monthly Active Users
Rank App* Company
1 Facebook Facebook
2 Facebook Messenger
3 YouTube Google
4 Google Maps Google
5 WhatsApp Messenger
6 Waze Google
7 Shazam Shazam Entertainment
8 Snapchat Snapchat
9 Instagram Facebook
10 Twitter Twitter
Rank App* Company
1 Facebook Facebook
2 Facebook Messenger
3 WhatsApp Messenger
4 Shazam Shazam Entertainment
5 Clean Master Cheetah Mobile
6 Skype Microsoft
7 Snapchat Snapchat
8 Waze Google
9 Adobe Acrobat DC
Adobe
10 Dropbox Dropbox
Rank Game* Company
1 Clash of Clans Supercell
2 Candy Crush Saga King
3 Candy Crush Soda Saga
King
4 Boom Beach Supercell
5 2048 Ketchapp Studio
6 QuizClash FEO Media
7 94% SCIMOB
8 Subway Surfers Kiloo
9 1010! GramGames
10 Farm Heroes Saga King
Rank Game* Company
1 Clash of Clans Supercell
2 Candy Crush Saga King
3 Candy Crush Soda Saga
King
4 Boom Beach Supercell
5 94% SCIMOB
6 Subway Surfers Kiloo
7 Farm Heroes Saga King
8 QuizClash FEO Media
9 Crossy Road Yodo1
10 MobilityWare Solitaire
MobilityWare
*Usage tables do not aggregate different versions of apps. For instance, Fruit Ninja and Fruit Ninja Free would be ranked separately.
App Annie 2015 Retrospective
© App Annie 2016
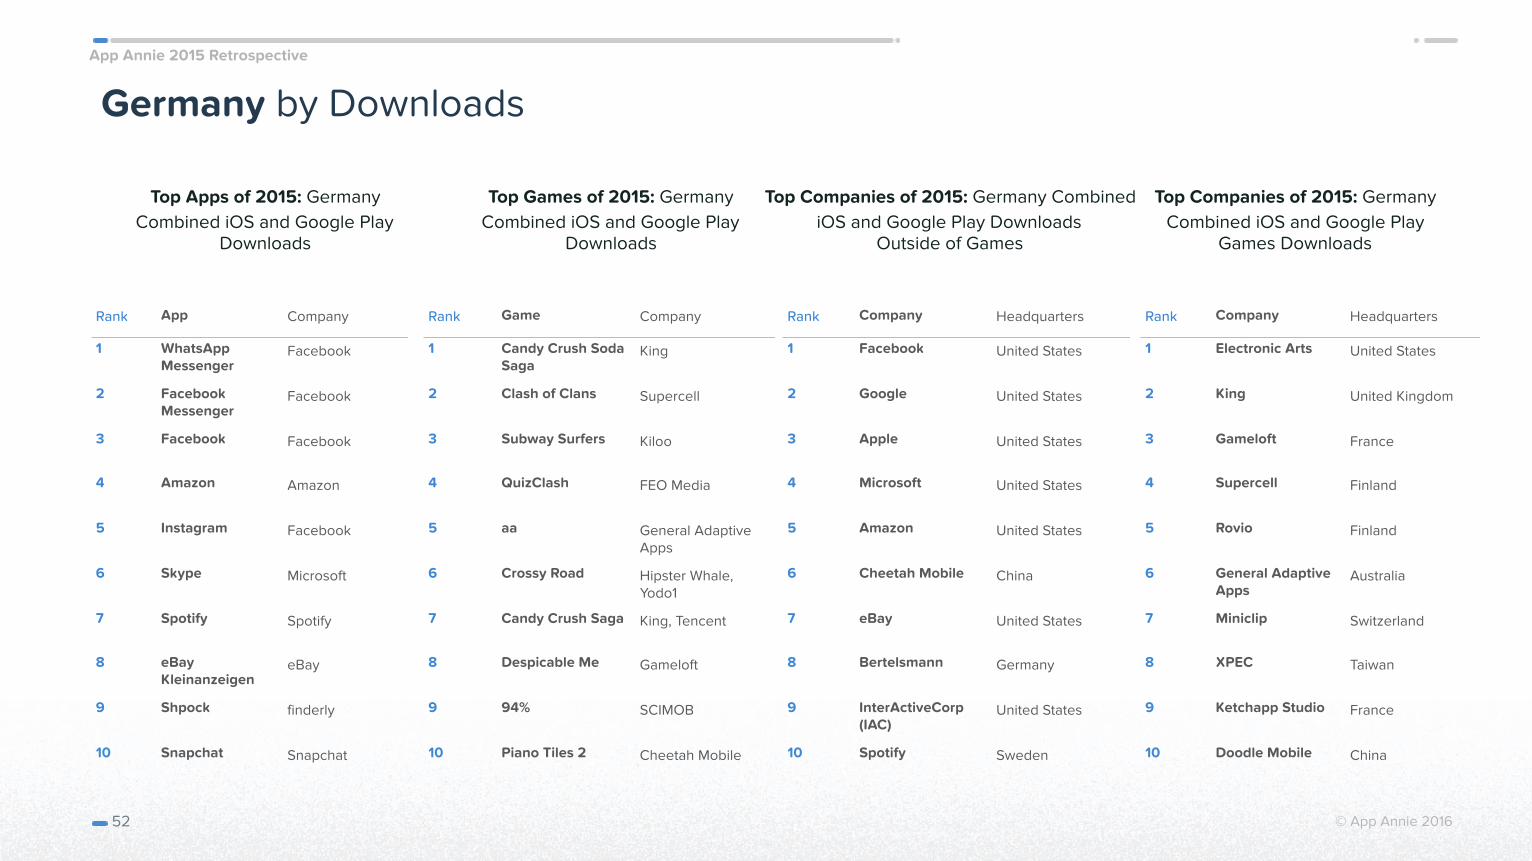
Germany by Downloads
Top Apps of 2015: Germany Combined iOS and Google Play
Downloads
52
Top Games of 2015: Germany Combined iOS and Google Play
Downloads
Top Companies of 2015: Germany Combined iOS and Google Play Downloads
Outside of Games
Top Companies of 2015: Germany Combined iOS and Google Play
Games Downloads
Rank App Company
1 WhatsApp Messenger
2 Facebook Messenger
3 Facebook Facebook
4 Amazon Amazon
5 Instagram Facebook
6 Skype Microsoft
7 Spotify Spotify
8 eBay Kleinanzeigen
eBay
9 Shpock finderly
10 Snapchat Snapchat
Rank Game Company
1 Candy Crush Soda Saga
King
2 Clash of Clans Supercell
3 Subway Surfers Kiloo
4 QuizClash FEO Media
5 aa General Adaptive Apps
6 Crossy Road Hipster Whale, Yodo1
7 Candy Crush Saga King, Tencent
8 Despicable Me Gameloft
9 94% SCIMOB
10 Piano Tiles 2 Cheetah Mobile
Rank Company Headquarters
1 Facebook United States
2 Google United States
3 Apple United States
4 Microsoft United States
5 Amazon United States
6 Cheetah Mobile China
7 eBay United States
8 Bertelsmann Germany
9 InterActiveCorp (IAC)
United States
10 Spotify Sweden
Rank Company Headquarters
1 Electronic Arts United States
2 King United Kingdom
3 Gameloft France
4 Supercell Finland
5 Rovio Finland
6 General Adaptive Apps
Australia
7 Miniclip Switzerland
8 XPEC Taiwan
9 Ketchapp Studio France
10 Doodle Mobile China
App Annie 2015 Retrospective
© App Annie 2016
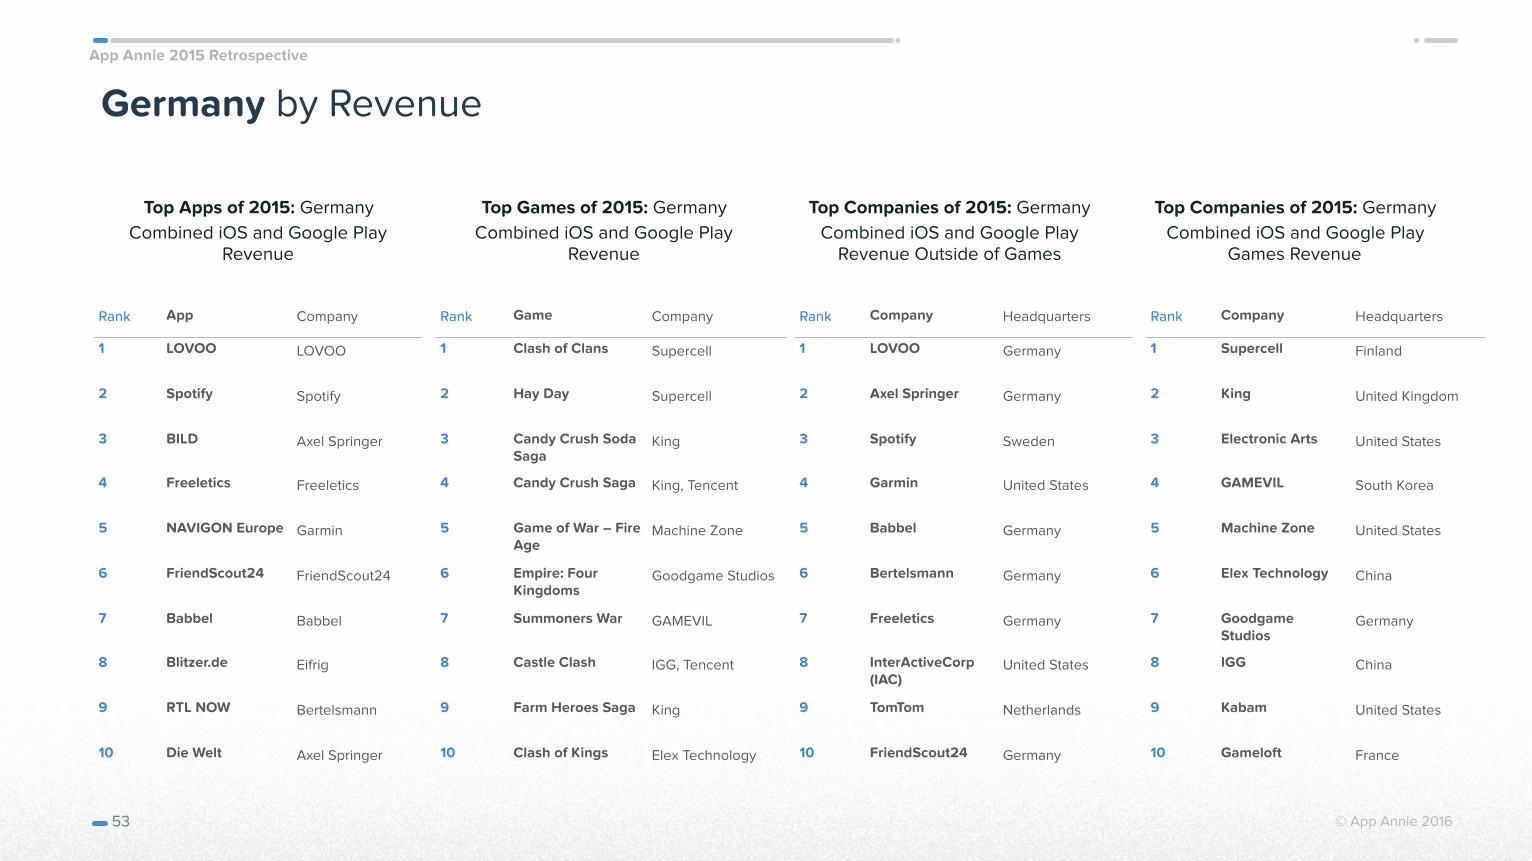
Germany by Revenue
Top Apps of 2015: Germany Combined iOS and Google Play
Revenue
53
Top Games of 2015: Germany Combined iOS and Google Play
Revenue
Top Companies of 2015: Germany Combined iOS and Google Play
Revenue Outside of Games
Top Companies of 2015: Germany Combined iOS and Google Play
Games Revenue
Rank App Company
1 LOVOO LOVOO
2 Spotify Spotify
3 BILD Axel Springer
4 Freeletics Freeletics
5 NAVIGON Europe Garmin
6 FriendScout24 FriendScout24
7 Babbel Babbel
8 Blitzer.de Eifrig
9 RTL NOW Bertelsmann
10 Die Welt Axel Springer
Rank Game Company
1 Clash of Clans Supercell
2 Hay Day Supercell
3 Candy Crush Soda Saga
King
4 Candy Crush Saga King, Tencent
5 Game of War – Fire Age
Machine Zone
6 Empire: Four Kingdoms
Goodgame Studios
7 Summoners War GAMEVIL
8 Castle Clash IGG, Tencent
9 Farm Heroes Saga King
10 Clash of Kings Elex Technology
Rank Company Headquarters
1 LOVOO Germany
2 Axel Springer Germany
3 Spotify Sweden
4 Garmin United States
5 Babbel Germany
6 Bertelsmann Germany
7 Freeletics Germany
8 InterActiveCorp (IAC)
United States
9 TomTom Netherlands
10 FriendScout24 Germany
Rank Company Headquarters
1 Supercell Finland
2 King United Kingdom
3 Electronic Arts United States
4 GAMEVIL South Korea
5 Machine Zone United States
6 Elex Technology China
7 Goodgame Studios
Germany
8 IGG China
9 Kabam United States
10 Gameloft France
App Annie 2015 Retrospective
© App Annie 2016
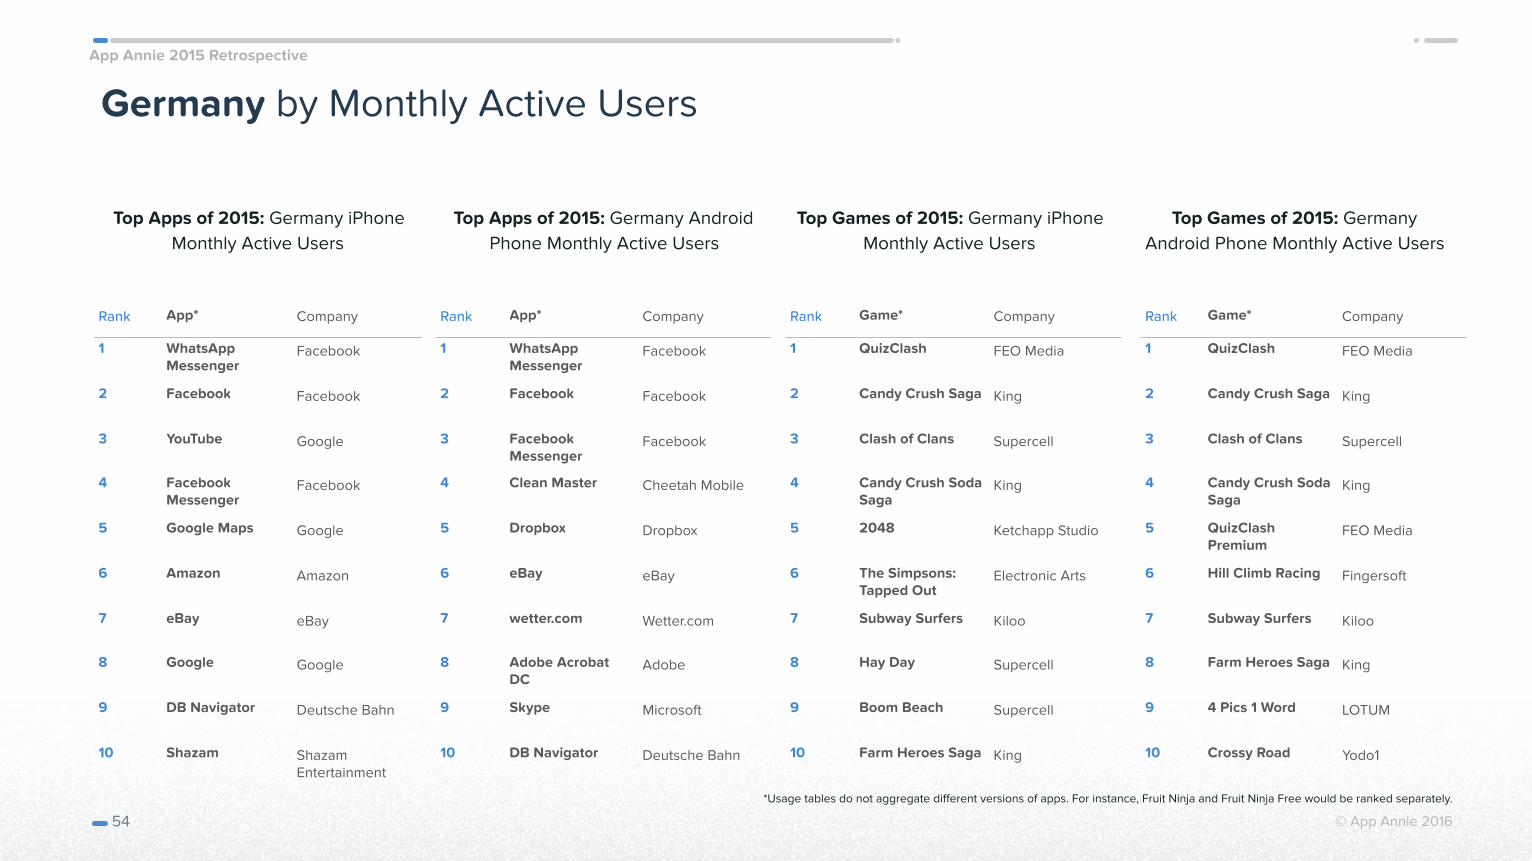
Germany by Monthly Active Users
Top Apps of 2015: Germany iPhone Monthly Active Users
54
Top Apps of 2015: Germany Android Phone Monthly Active Users
Top Games of 2015: Germany iPhone Monthly Active Users
Top Games of 2015: Germany Android Phone Monthly Active Users
Rank App* Company
1 WhatsApp Messenger
2 Facebook Facebook
3 YouTube Google
4 Facebook Messenger
5 Google Maps Google
6 Amazon Amazon
7 eBay eBay
8 Google Google
9 DB Navigator Deutsche Bahn
10 Shazam Shazam Entertainment
Rank App* Company
1 WhatsApp Messenger
2 Facebook Facebook
3 Facebook Messenger
4 Clean Master Cheetah Mobile
5 Dropbox Dropbox
6 eBay eBay
7 wetter.com Wetter.com
8 Adobe Acrobat DC
Adobe
9 Skype Microsoft
10 DB Navigator Deutsche Bahn
Rank Game* Company
1 QuizClash FEO Media
2 Candy Crush Saga King
3 Clash of Clans Supercell
4 Candy Crush Soda Saga
King
5 2048 Ketchapp Studio
6 The Simpsons: Tapped Out
Electronic Arts
7 Subway Surfers Kiloo
8 Hay Day Supercell
9 Boom Beach Supercell
10 Farm Heroes Saga King
Rank Game* Company
1 QuizClash FEO Media
2 Candy Crush Saga King
3 Clash of Clans Supercell
4 Candy Crush Soda Saga
King
5 QuizClash Premium
FEO Media
6 Hill Climb Racing Fingersoft
7 Subway Surfers Kiloo
8 Farm Heroes Saga King
9 4 Pics 1 Word LOTUM
10 Crossy Road Yodo1
*Usage tables do not aggregate different versions of apps. For instance, Fruit Ninja and Fruit Ninja Free would be ranked separately.
App Annie 2015 Retrospective
© App Annie 2016
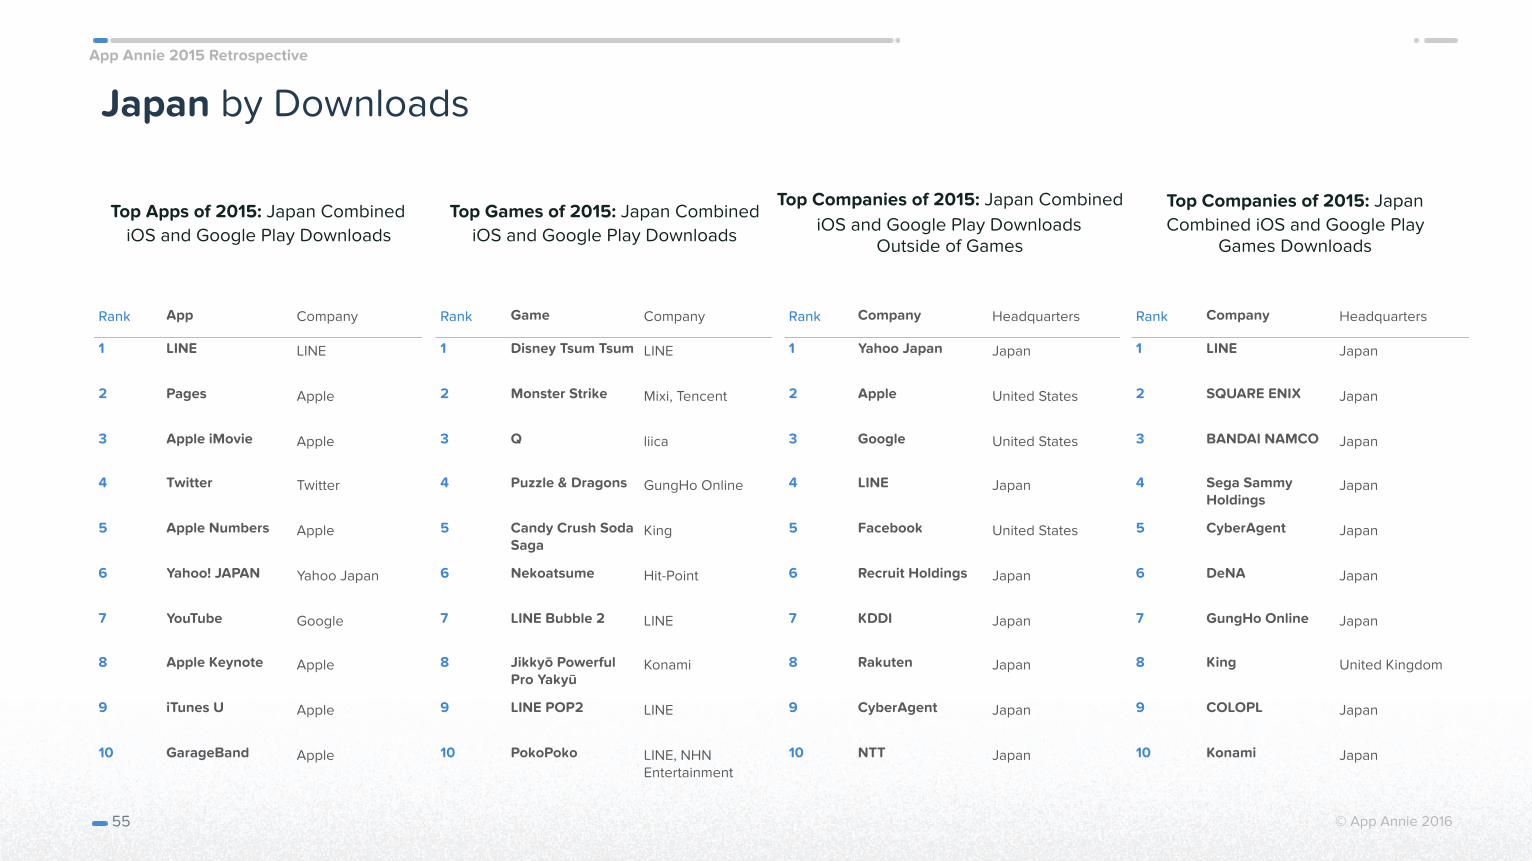
Japan by Downloads
Top Apps of 2015: Japan Combined iOS and Google Play Downloads
55
Top Games of 2015: Japan Combined iOS and Google Play Downloads
Top Companies of 2015: Japan Combined iOS and Google Play Downloads
Outside of Games
Top Companies of 2015: Japan Combined iOS and Google Play
Games Downloads
Rank App Company
1 LINE LINE
2 Pages Apple
3 Apple iMovie Apple
4 Twitter Twitter
5 Apple Numbers Apple
6 Yahoo! JAPAN Yahoo Japan
7 YouTube Google
8 Apple Keynote Apple
9 iTunes U Apple
10 GarageBand Apple
Rank Game Company
1 Disney Tsum Tsum LINE
2 Monster Strike Mixi, Tencent
3 Q liica
4 Puzzle & Dragons GungHo Online
5 Candy Crush Soda Saga
King
6 Nekoatsume Hit-Point
7 LINE Bubble 2 LINE
8 Jikkyō Powerful Pro Yakyū
Konami
9 LINE POP2 LINE
10 PokoPoko LINE, NHN Entertainment
Rank Company Headquarters
1 Yahoo Japan Japan
2 Apple United States
3 Google United States
4 LINE Japan
5 Facebook United States
6 Recruit Holdings Japan
7 KDDI Japan
8 Rakuten Japan
9 CyberAgent Japan
10 NTT Japan
Rank Company Headquarters
1 LINE Japan
2 SQUARE ENIX Japan
3 BANDAI NAMCO Japan
4 Sega Sammy Holdings
Japan
5 CyberAgent Japan
6 DeNA Japan
7 GungHo Online Japan
8 King United Kingdom
9 COLOPL Japan
10 Konami Japan
App Annie 2015 Retrospective
© App Annie 2016
Japan by Revenue
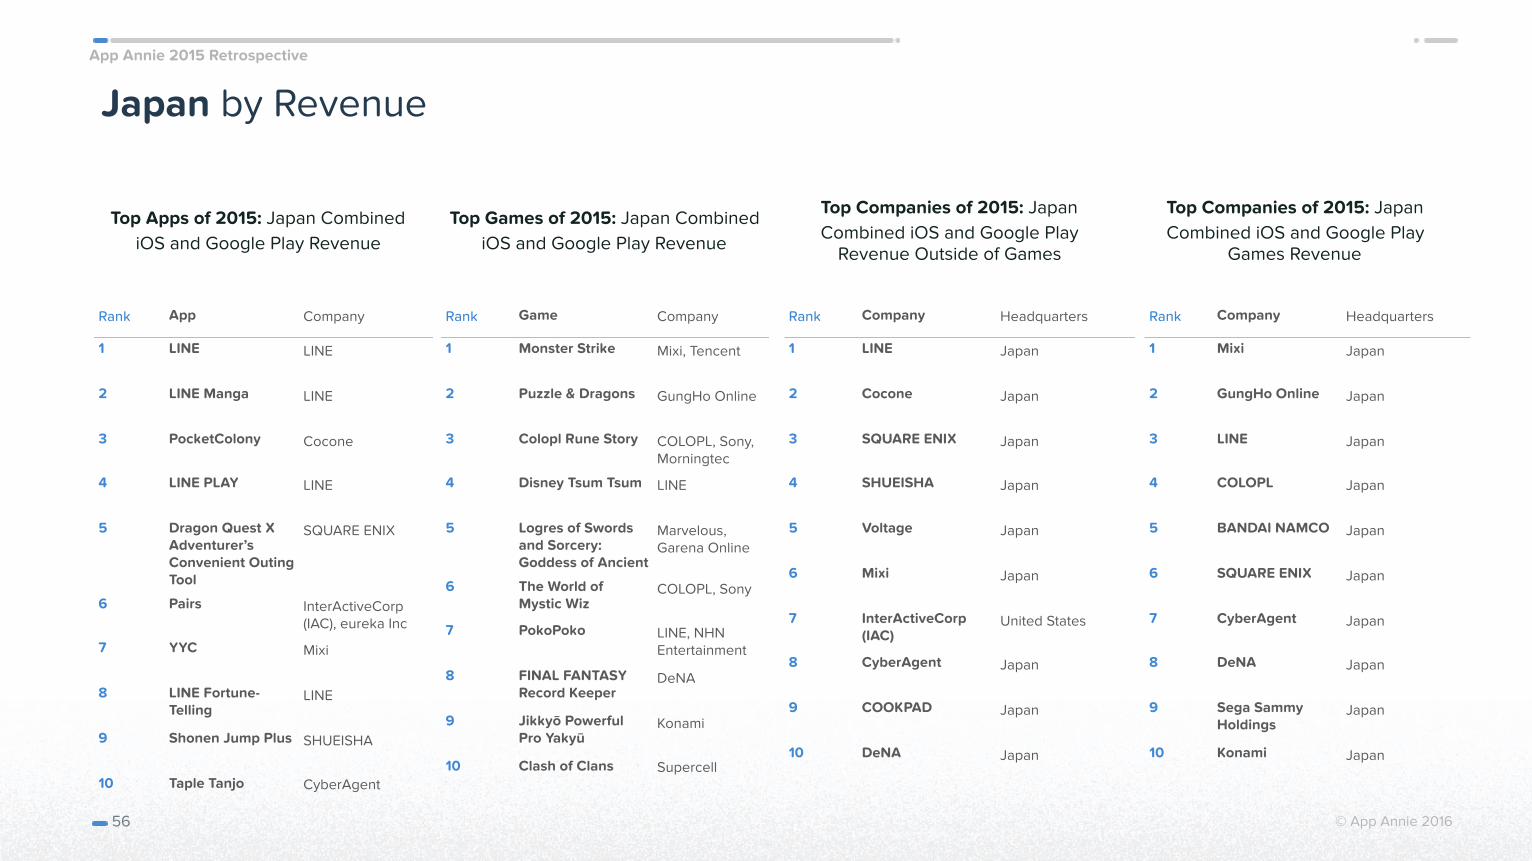
Top Apps of 2015: Japan Combined iOS and Google Play Revenue
56
Top Games of 2015: Japan Combined iOS and Google Play Revenue
Top Companies of 2015: Japan Combined iOS and Google Play
Revenue Outside of Games
Top Companies of 2015: Japan Combined iOS and Google Play
Games Revenue
Rank App Company
1 LINE LINE
2 LINE Manga LINE
3 PocketColony Cocone
4 LINE PLAY LINE
5 Dragon Quest X Adventurer’s Convenient Outing Tool
SQUARE ENIX
6 Pairs InterActiveCorp (IAC), eureka Inc
7 YYC Mixi
8 LINE Fortune-Telling
LINE
9 Shonen Jump Plus SHUEISHA
10 Taple Tanjo CyberAgent
Rank Game Company
1 Monster Strike Mixi, Tencent
2 Puzzle & Dragons GungHo Online
3 Colopl Rune Story COLOPL, Sony, Morningtec
4 Disney Tsum Tsum LINE
5 Logres of Swords and Sorcery: Goddess of Ancient
Marvelous, Garena Online
6 The World of Mystic Wiz
COLOPL, Sony
7 PokoPoko LINE, NHN Entertainment
8 FINAL FANTASY Record Keeper
DeNA
9 Jikkyō Powerful Pro Yakyū
Konami
10 Clash of Clans Supercell
Rank Company Headquarters
1 LINE Japan
2 Cocone Japan
3 SQUARE ENIX Japan
4 SHUEISHA Japan
5 Voltage Japan
6 Mixi Japan
7 InterActiveCorp (IAC)
United States
8 CyberAgent Japan
9 COOKPAD Japan
10 DeNA Japan
Rank Company Headquarters
1 Mixi Japan
2 GungHo Online Japan
3 LINE Japan
4 COLOPL Japan
5 BANDAI NAMCO Japan
6 SQUARE ENIX Japan
7 CyberAgent Japan
8 DeNA Japan
9 Sega Sammy Holdings
Japan
10 Konami Japan
App Annie 2015 Retrospective
© App Annie 2016
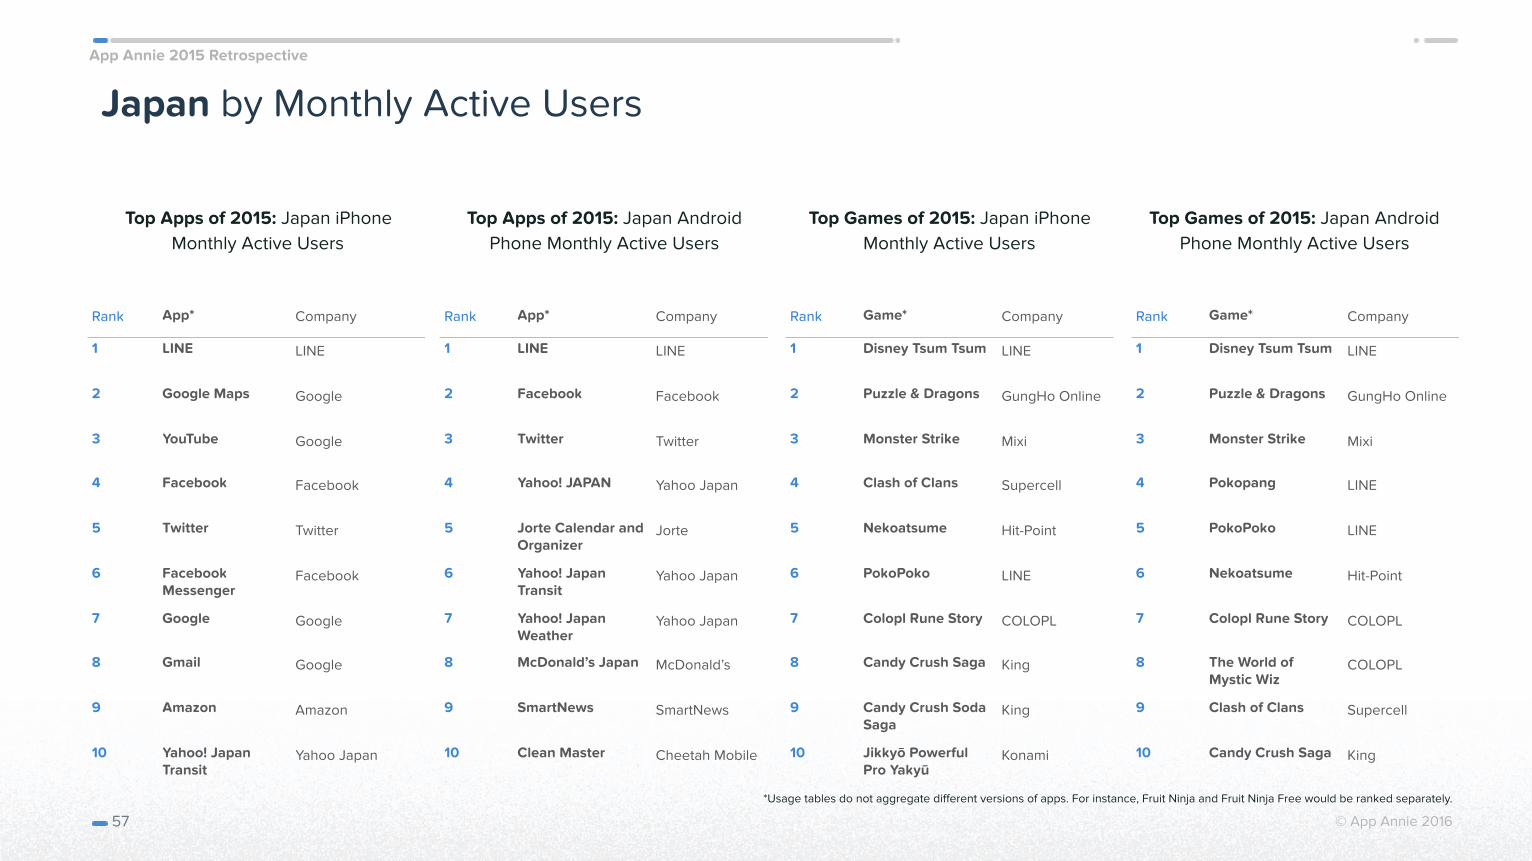
Japan by Monthly Active Users
Top Apps of 2015: Japan iPhone Monthly Active Users
57
Top Apps of 2015: Japan Android Phone Monthly Active Users
Top Games of 2015: Japan iPhone Monthly Active Users
Top Games of 2015: Japan Android Phone Monthly Active Users
Rank App* Company
1 LINE LINE
2 Google Maps Google
3 YouTube Google
4 Facebook Facebook
5 Twitter Twitter
6 Facebook Messenger
7 Google Google
8 Gmail Google
9 Amazon Amazon
10 Yahoo! Japan Transit
Yahoo Japan
Rank App* Company
1 LINE LINE
2 Facebook Facebook
3 Twitter Twitter
4 Yahoo! JAPAN Yahoo Japan
5 Jorte Calendar and Organizer
Jorte
6 Yahoo! Japan Transit
Yahoo Japan
7 Yahoo! Japan Weather
Yahoo Japan
8 McDonald’s Japan McDonald’s
9 SmartNews SmartNews
10 Clean Master Cheetah Mobile
Rank Game* Company
1 Disney Tsum Tsum LINE
2 Puzzle & Dragons GungHo Online
3 Monster Strike Mixi
4 Clash of Clans Supercell
5 Nekoatsume Hit-Point
6 PokoPoko LINE
7 Colopl Rune Story COLOPL
8 Candy Crush Saga King
9 Candy Crush Soda Saga
King
10 Jikkyō Powerful Pro Yakyū
Konami
Rank Game* Company
1 Disney Tsum Tsum LINE
2 Puzzle & Dragons GungHo Online
3 Monster Strike Mixi
4 Pokopang LINE
5 PokoPoko LINE
6 Nekoatsume Hit-Point
7 Colopl Rune Story COLOPL
8 The World of Mystic Wiz
COLOPL
9 Clash of Clans Supercell
10 Candy Crush Saga King
*Usage tables do not aggregate different versions of apps. For instance, Fruit Ninja and Fruit Ninja Free would be ranked separately.
App Annie 2015 Retrospective
© App Annie 2016
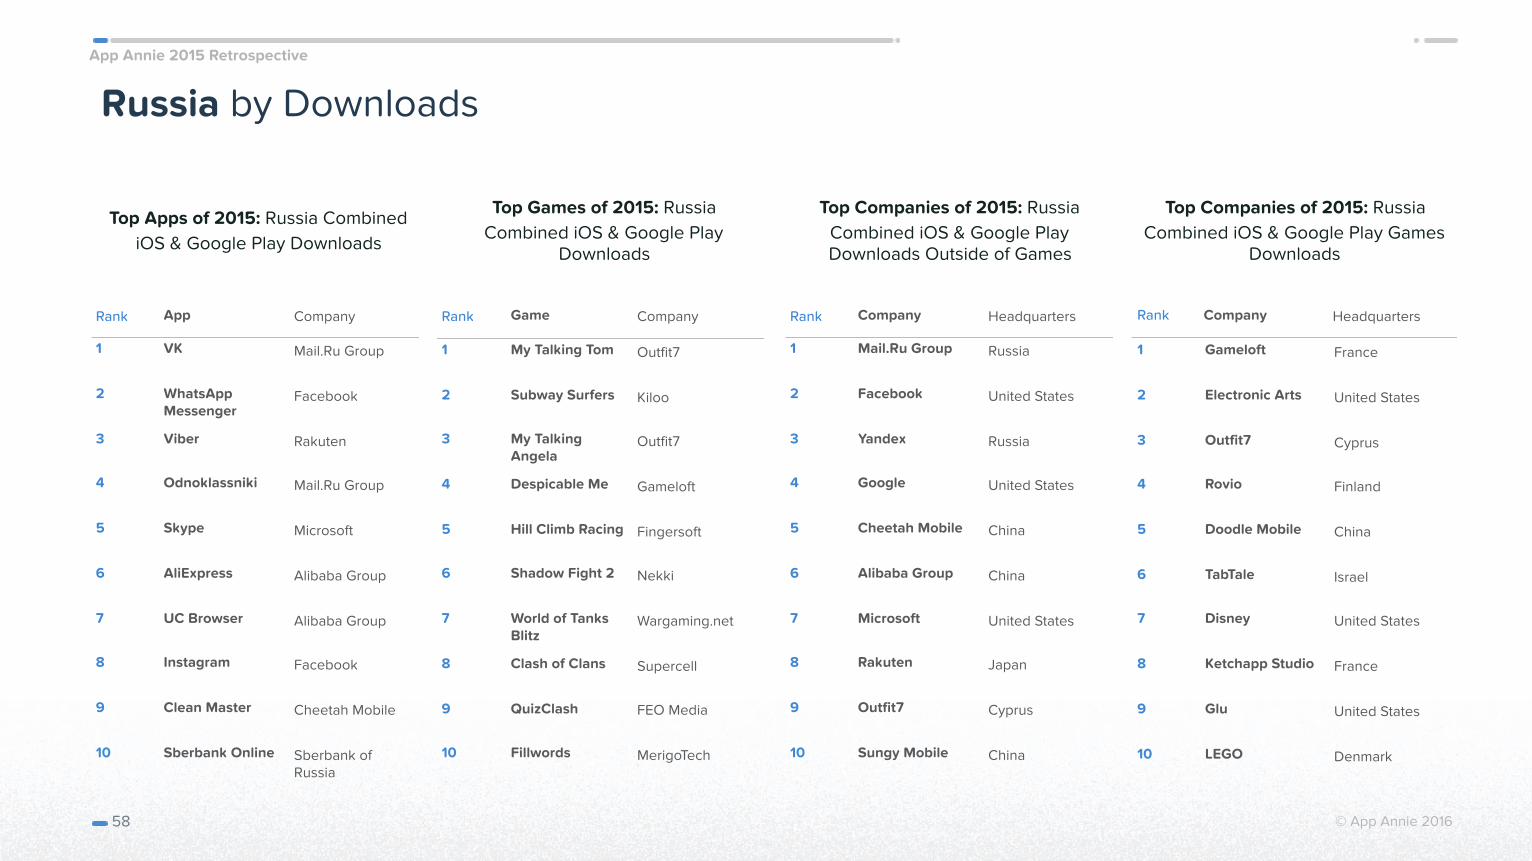
Russia by Downloads
Top Apps of 2015: Russia Combined iOS & Google Play Downloads
58
Top Games of 2015: Russia Combined iOS & Google Play
Downloads
Top Companies of 2015: Russia Combined iOS & Google Play Downloads Outside of Games
Top Companies of 2015: Russia Combined iOS & Google Play Games
Downloads
Rank App Company
1 VK Mail.Ru Group
2 WhatsApp Messenger
3 Viber Rakuten
4 Odnoklassniki Mail.Ru Group
5 Skype Microsoft
6 AliExpress Alibaba Group
7 UC Browser Alibaba Group
8 Instagram Facebook
9 Clean Master Cheetah Mobile
10 Sberbank Online Sberbank of Russia
Rank Game Company
1 My Talking Tom Outfit7
2 Subway Surfers Kiloo
3 My Talking Angela
Outfit7
4 Despicable Me Gameloft
5 Hill Climb Racing Fingersoft
6 Shadow Fight 2 Nekki
7 World of Tanks Blitz
Wargaming.net
8 Clash of Clans Supercell
9 QuizClash FEO Media
10 Fillwords MerigoTech
Rank Company Headquarters
1 Mail.Ru Group Russia
2 Facebook United States
3 Yandex Russia
4 Google United States
5 Cheetah Mobile China
6 Alibaba Group China
7 Microsoft United States
8 Rakuten Japan
9 Outfit7 Cyprus
10 Sungy Mobile China
Rank Company Headquarters
1 Gameloft France
2 Electronic Arts United States
3 Outfit7 Cyprus
4 Rovio Finland
5 Doodle Mobile China
6 TabTale Israel
7 Disney United States
8 Ketchapp Studio France
9 Glu United States
10 LEGO Denmark
App Annie 2015 Retrospective
© App Annie 2016
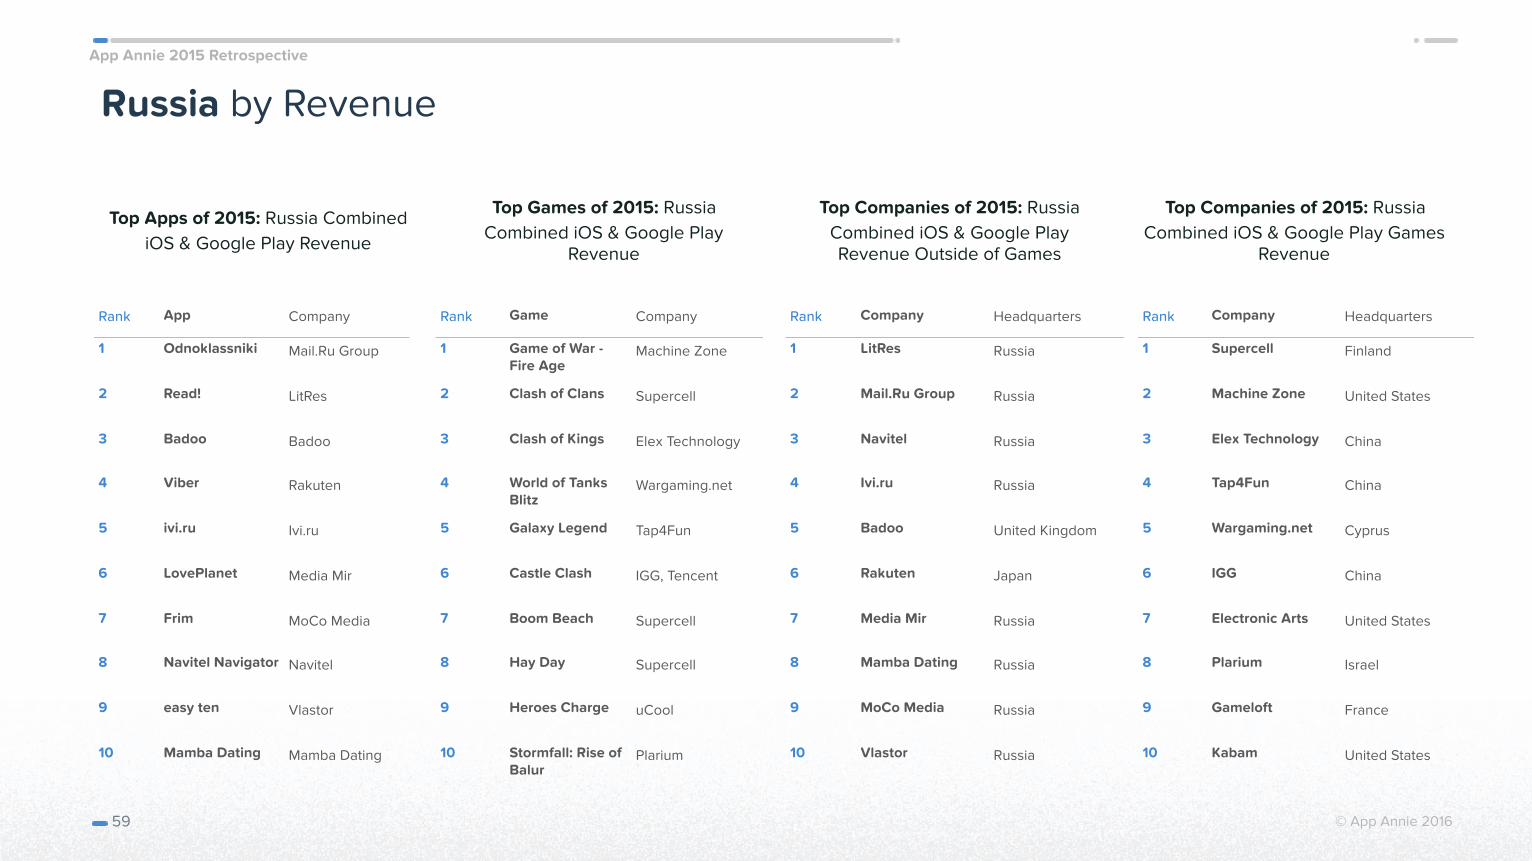
Russia by Revenue
Top Apps of 2015: Russia Combined iOS & Google Play Revenue
59
Top Games of 2015: Russia Combined iOS & Google Play
Revenue
Top Companies of 2015: Russia Combined iOS & Google Play Revenue Outside of Games
Top Companies of 2015: Russia Combined iOS & Google Play Games
Revenue
Rank App Company
1 Odnoklassniki Mail.Ru Group
2 Read! LitRes
3 Badoo Badoo
4 Viber Rakuten
5 ivi.ru Ivi.ru
6 LovePlanet Media Mir
7 Frim MoCo Media
8 Navitel Navigator Navitel
9 easy ten Vlastor
10 Mamba Dating Mamba Dating
Rank Game Company
1 Game of War - Fire Age
Machine Zone
2 Clash of Clans Supercell
3 Clash of Kings Elex Technology
4 World of Tanks Blitz
Wargaming.net
5 Galaxy Legend Tap4Fun
6 Castle Clash IGG, Tencent
7 Boom Beach Supercell
8 Hay Day Supercell
9 Heroes Charge uCool
10 Stormfall: Rise of Balur
Plarium
Rank Company Headquarters
1 LitRes Russia
2 Mail.Ru Group Russia
3 Navitel Russia
4 Ivi.ru Russia
5 Badoo United Kingdom
6 Rakuten Japan
7 Media Mir Russia
8 Mamba Dating Russia
9 MoCo Media Russia
10 Vlastor Russia
Rank Company Headquarters
1 Supercell Finland
2 Machine Zone United States
3 Elex Technology China
4 Tap4Fun China
5 Wargaming.net Cyprus
6 IGG China
7 Electronic Arts United States
8 Plarium Israel
9 Gameloft France
10 Kabam United States
App Annie 2015 Retrospective
© App Annie 2016
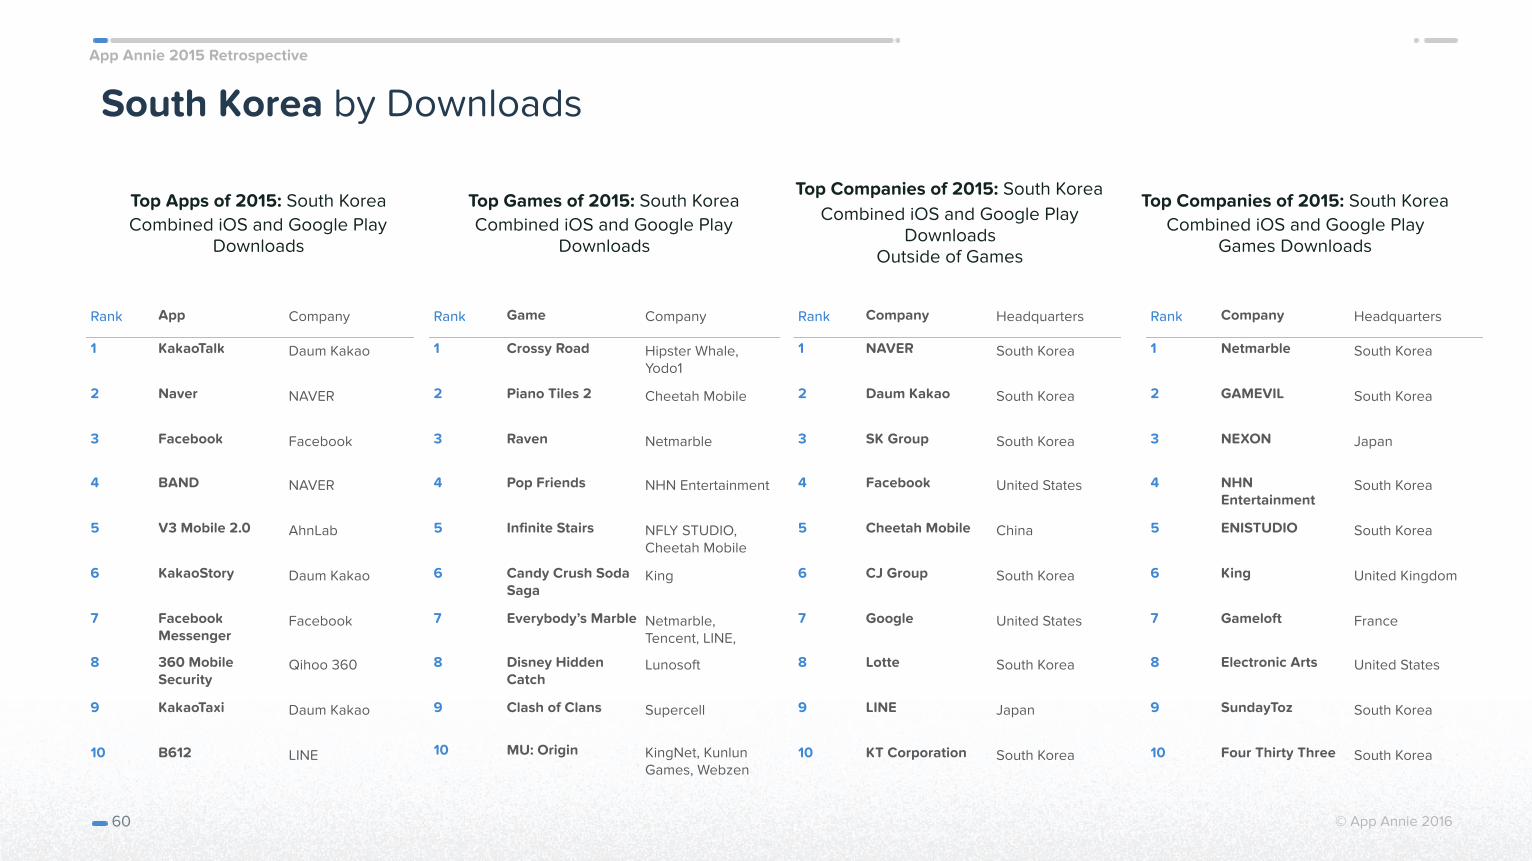
Rank App Company
1 KakaoTalk Daum Kakao
2 Naver NAVER
3 Facebook Facebook
4 BAND NAVER
5 V3 Mobile 2.0 AhnLab
6 KakaoStory Daum Kakao
7 Facebook Messenger
8 360 Mobile Security
Qihoo 360
9 KakaoTaxi Daum Kakao
10 B612 LINE
Rank Game Company
1 Crossy Road Hipster Whale, Yodo1
2 Piano Tiles 2 Cheetah Mobile
3 Raven Netmarble
4 Pop Friends NHN Entertainment
5 Infinite Stairs NFLY STUDIO, Cheetah Mobile
6 Candy Crush Soda Saga
King
7 Everybody’s Marble Netmarble, Tencent, LINE,
8 Disney Hidden Catch
Lunosoft
9 Clash of Clans Supercell
10 MU: Origin KingNet, Kunlun Games, Webzen
Rank Company Headquarters
1 NAVER South Korea
2 Daum Kakao South Korea
3 SK Group South Korea
4 Facebook United States
5 Cheetah Mobile China
6 CJ Group South Korea
7 Google United States
8 Lotte South Korea
9 LINE Japan
10 KT Corporation South Korea
Rank Company Headquarters
1 Netmarble South Korea
2 GAMEVIL South Korea
3 NEXON Japan
4 NHN Entertainment
South Korea
5 ENISTUDIO South Korea
6 King United Kingdom
7 Gameloft France
8 Electronic Arts United States
9 SundayToz South Korea
10 Four Thirty Three South Korea
South Korea by Downloads
Top Apps of 2015: South Korea Combined iOS and Google Play
Downloads
60
Top Games of 2015: South Korea Combined iOS and Google Play
Downloads
Top Companies of 2015: South Korea Combined iOS and Google Play
Downloads Outside of Games
Top Companies of 2015: South Korea Combined iOS and Google Play
Games Downloads
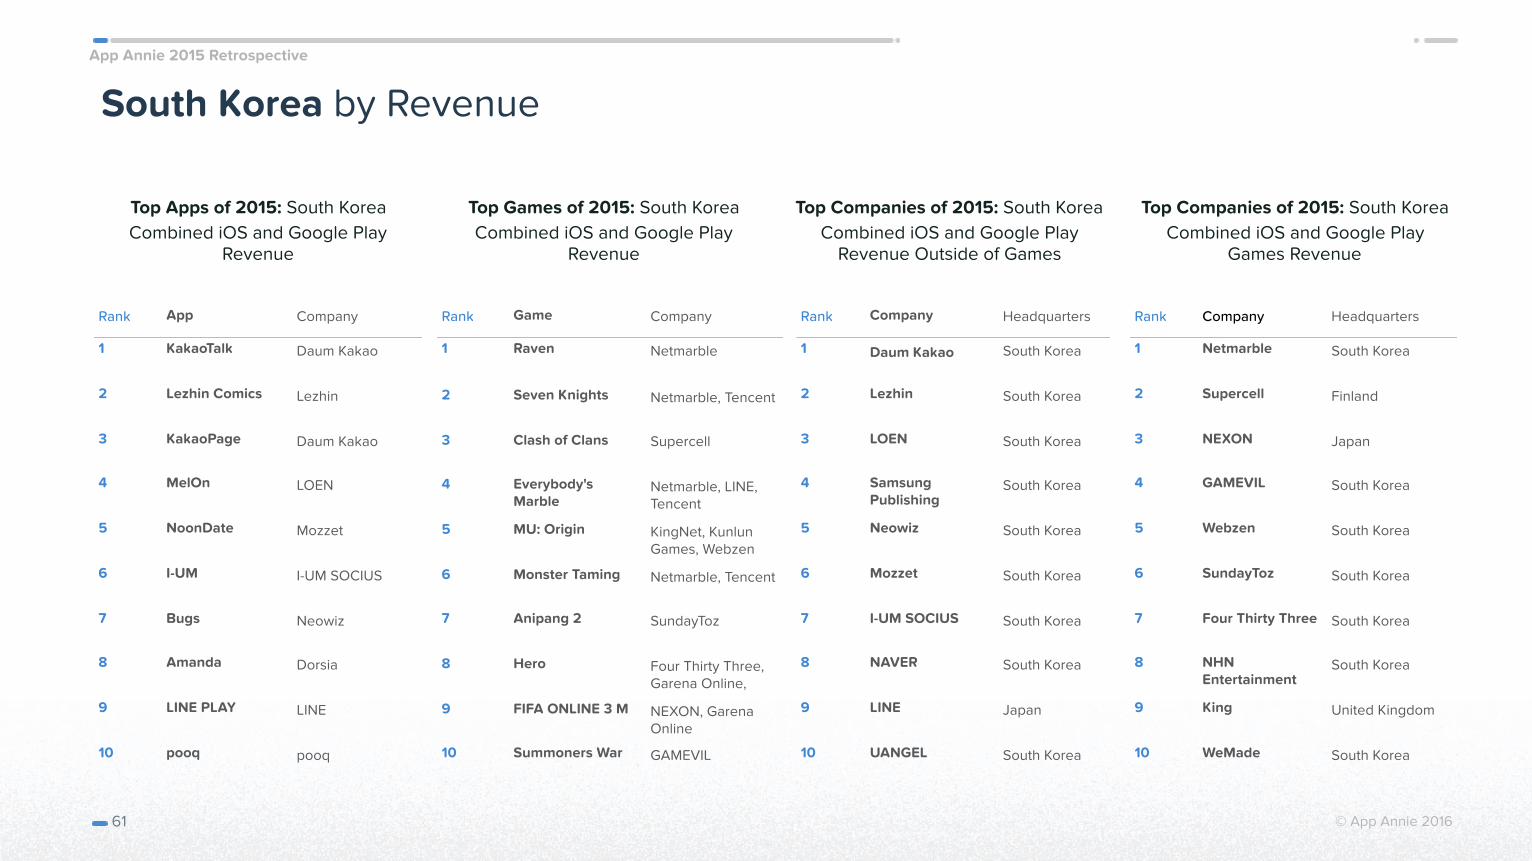
App Annie 2015 Retrospective
© App Annie 2016
South Korea by Revenue
Top Apps of 2015: South Korea Combined iOS and Google Play
Revenue
61
Top Games of 2015: South Korea Combined iOS and Google Play
Revenue
Top Companies of 2015: South Korea Combined iOS and Google Play
Revenue Outside of Games
Top Companies of 2015: South Korea Combined iOS and Google Play
Games Revenue
Rank App Company
1 KakaoTalk Daum Kakao
2 Lezhin Comics Lezhin
3 KakaoPage Daum Kakao
4 MelOn LOEN
5 NoonDate Mozzet
6 I-UM I-UM SOCIUS
7 Bugs Neowiz
8 Amanda Dorsia
9 LINE PLAY LINE
10 pooq pooq
Rank Game Company
1 Raven Netmarble
2 Seven Knights Netmarble, Tencent
3 Clash of Clans Supercell
4 Everybody's Marble
Netmarble, LINE, Tencent
5 MU: Origin KingNet, Kunlun Games, Webzen
6 Monster Taming Netmarble, Tencent
7 Anipang 2 SundayToz
8 Hero Four Thirty Three, Garena Online,
9 FIFA ONLINE 3 M NEXON, Garena Online
10 Summoners War GAMEVIL
Rank Company Headquarters
1 DaumKakao South Korea
2 Lezhin South Korea
3 LOEN South Korea
4 Samsung Publishing
South Korea
5 Neowiz South Korea
6 Mozzet South Korea
7 I-UM SOCIUS South Korea
8 NAVER South Korea
9 LINE Japan
10 UANGEL South Korea
Rank Company Headquarters
1 Netmarble South Korea
2 Supercell Finland
3 NEXON Japan
4 GAMEVIL South Korea
5 Webzen South Korea
6 SundayToz South Korea
7 Four Thirty Three South Korea
8 NHN Entertainment
South Korea
9 King United Kingdom
10 WeMade South Korea
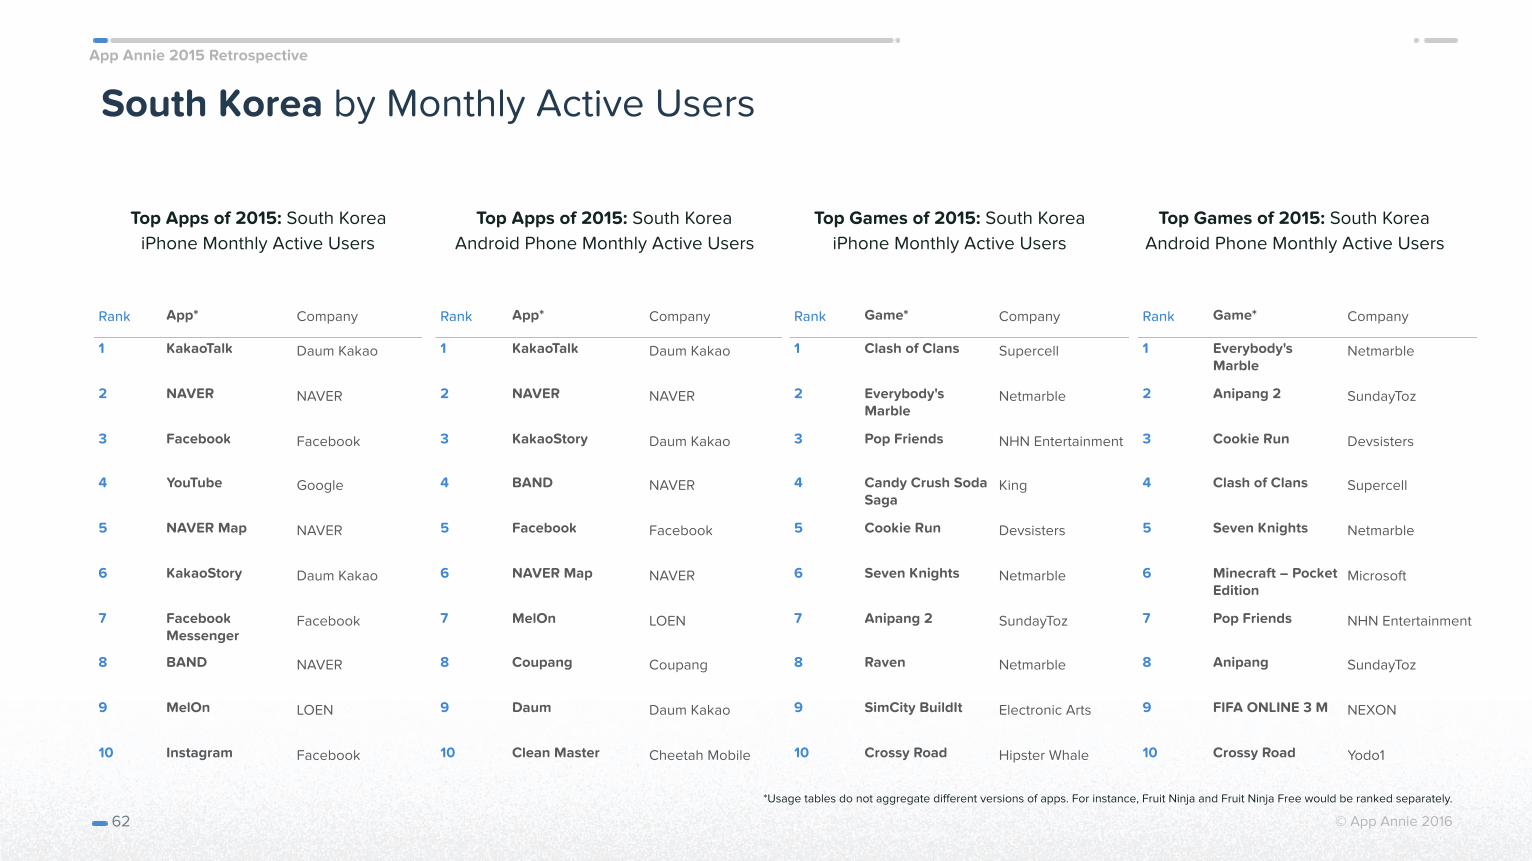
App Annie 2015 Retrospective
© App Annie 2016
South Korea by Monthly Active Users
Top Apps of 2015: South Korea iPhone Monthly Active Users
62
Top Apps of 2015: South Korea Android Phone Monthly Active Users
Top Games of 2015: South Korea iPhone Monthly Active Users
Top Games of 2015: South Korea Android Phone Monthly Active Users
Rank App* Company
1 KakaoTalk Daum Kakao
2 NAVER NAVER
3 Facebook Facebook
4 YouTube Google
5 NAVER Map NAVER
6 KakaoStory Daum Kakao
7 Facebook Messenger
8 BAND NAVER
9 MelOn LOEN
10 Instagram Facebook
Rank App* Company
1 KakaoTalk Daum Kakao
2 NAVER NAVER
3 KakaoStory Daum Kakao
4 BAND NAVER
5 Facebook Facebook
6 NAVER Map NAVER
7 MelOn LOEN
8 Coupang Coupang
9 Daum Daum Kakao
10 Clean Master Cheetah Mobile
Rank Game* Company
1 Clash of Clans Supercell
2 Everybody's Marble
Netmarble
3 Pop Friends NHN Entertainment
4 Candy Crush Soda Saga
King
5 Cookie Run Devsisters
6 Seven Knights Netmarble
7 Anipang 2 SundayToz
8 Raven Netmarble
9 SimCity BuildIt Electronic Arts
10 Crossy Road Hipster Whale
Rank Game* Company
1 Everybody's Marble
Netmarble
2 Anipang 2 SundayToz
3 Cookie Run Devsisters
4 Clash of Clans Supercell
5 Seven Knights Netmarble
6 Minecraft – Pocket Edition
Microsoft
7 Pop Friends NHN Entertainment
8 Anipang SundayToz
9 FIFA ONLINE 3 M NEXON
10 Crossy Road Yodo1
*Usage tables do not aggregate different versions of apps. For instance, Fruit Ninja and Fruit Ninja Free would be ranked separately.
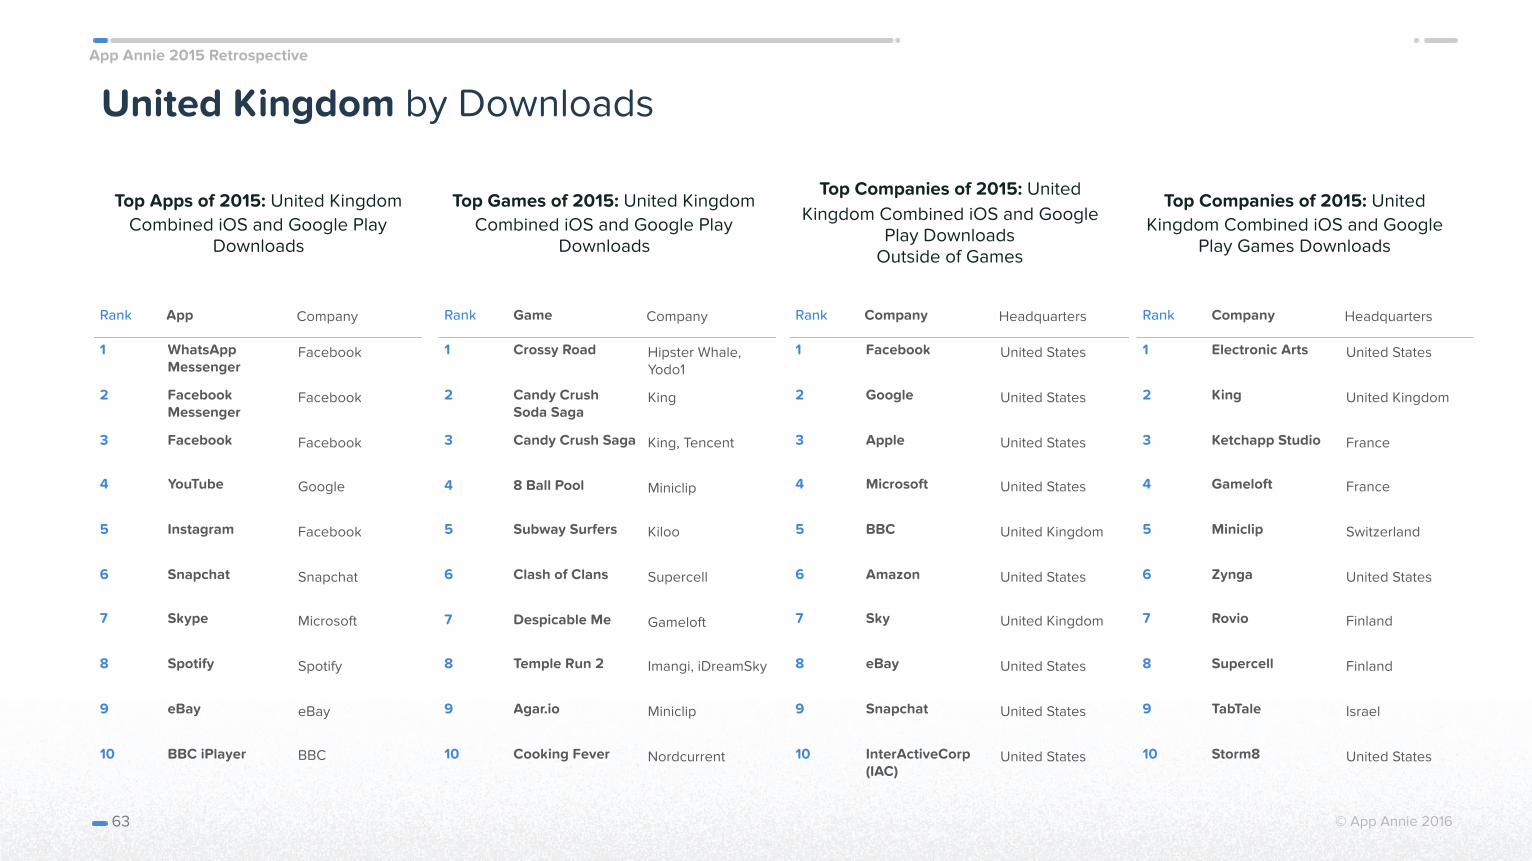
App Annie 2015 Retrospective
© App Annie 2016
United Kingdom by Downloads
Top Apps of 2015: United Kingdom Combined iOS and Google Play
Downloads
63
Top Games of 2015: United Kingdom Combined iOS and Google Play
Downloads
Top Companies of 2015: United Kingdom Combined iOS and Google
Play Downloads Outside of Games
Top Companies of 2015: United Kingdom Combined iOS and Google
Play Games Downloads
Rank App Company
1 WhatsApp Messenger
2 Facebook Messenger
3 Facebook Facebook
4 YouTube Google
5 Instagram Facebook
6 Snapchat Snapchat
7 Skype Microsoft
8 Spotify Spotify
9 eBay eBay
10 BBC iPlayer BBC
Rank Game Company
1 Crossy Road Hipster Whale, Yodo1
2 Candy Crush Soda Saga
King
3 Candy Crush Saga King, Tencent
4 8 Ball Pool Miniclip
5 Subway Surfers Kiloo
6 Clash of Clans Supercell
7 Despicable Me Gameloft
8 Temple Run 2 Imangi, iDreamSky
9 Agar.io Miniclip
10 Cooking Fever Nordcurrent
Rank Company Headquarters
1 Facebook United States
2 Google United States
3 Apple United States
4 Microsoft United States
5 BBC United Kingdom
6 Amazon United States
7 Sky United Kingdom
8 eBay United States
9 Snapchat United States
10 InterActiveCorp (IAC)
United States
Rank Company Headquarters
1 Electronic Arts United States
2 King United Kingdom
3 Ketchapp Studio France
4 Gameloft France
5 Miniclip Switzerland
6 Zynga United States
7 Rovio Finland
8 Supercell Finland
9 TabTale Israel
10 Storm8 United States
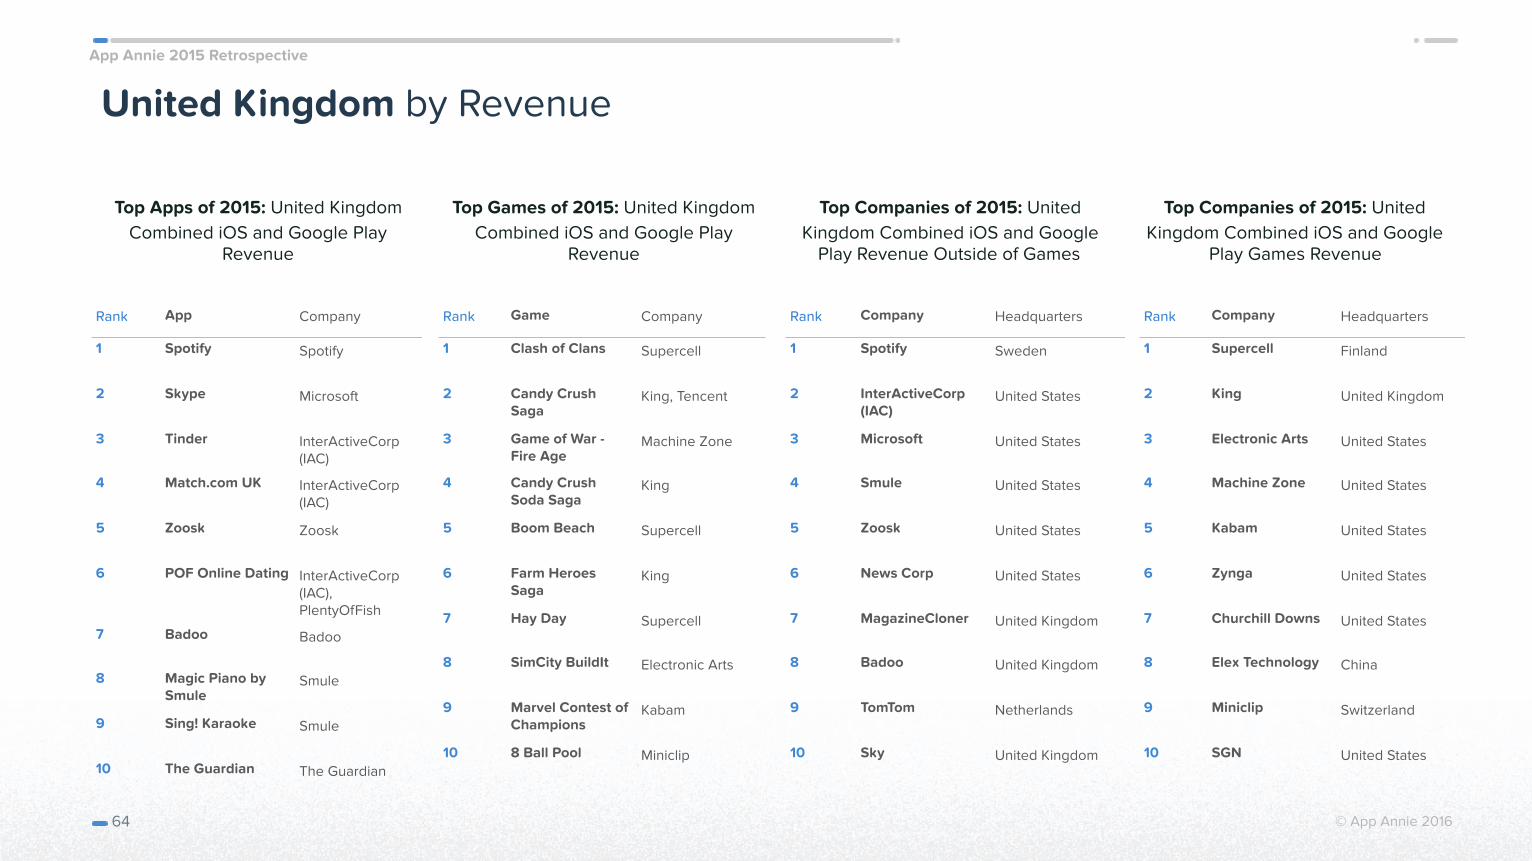
App Annie 2015 Retrospective
© App Annie 2016
United Kingdom by Revenue
Top Apps of 2015: United Kingdom Combined iOS and Google Play
Revenue
64
Top Games of 2015: United Kingdom Combined iOS and Google Play
Revenue
Top Companies of 2015: United Kingdom Combined iOS and Google
Play Revenue Outside of Games
Top Companies of 2015: United Kingdom Combined iOS and Google
Play Games Revenue
Rank App Company
1 Spotify Spotify
2 Skype Microsoft
3 Tinder InterActiveCorp (IAC)
4 Match.com UK InterActiveCorp (IAC)
5 Zoosk Zoosk
6 POF Online Dating InterActiveCorp (IAC), PlentyOfFish
7 Badoo Badoo
8 Magic Piano by Smule
Smule
9 Sing! Karaoke Smule
10 The Guardian The Guardian
Rank Game Company
1 Clash of Clans Supercell
2 Candy Crush Saga
King, Tencent
3 Game of War - Fire Age
Machine Zone
4 Candy Crush Soda Saga
King
5 Boom Beach Supercell
6 Farm Heroes Saga
King
7 Hay Day Supercell
8 SimCity BuildIt Electronic Arts
9 Marvel Contest of Champions
Kabam
10 8 Ball Pool Miniclip
Rank Company Headquarters
1 Spotify Sweden
2 InterActiveCorp (IAC)
United States
3 Microsoft United States
4 Smule United States
5 Zoosk United States
6 News Corp United States
7 MagazineCloner United Kingdom
8 Badoo United Kingdom
9 TomTom Netherlands
10 Sky United Kingdom
Rank Company Headquarters
1 Supercell Finland
2 King United Kingdom
3 Electronic Arts United States
4 Machine Zone United States
5 Kabam United States
6 Zynga United States
7 Churchill Downs United States
8 Elex Technology China
9 Miniclip Switzerland
10 SGN United States
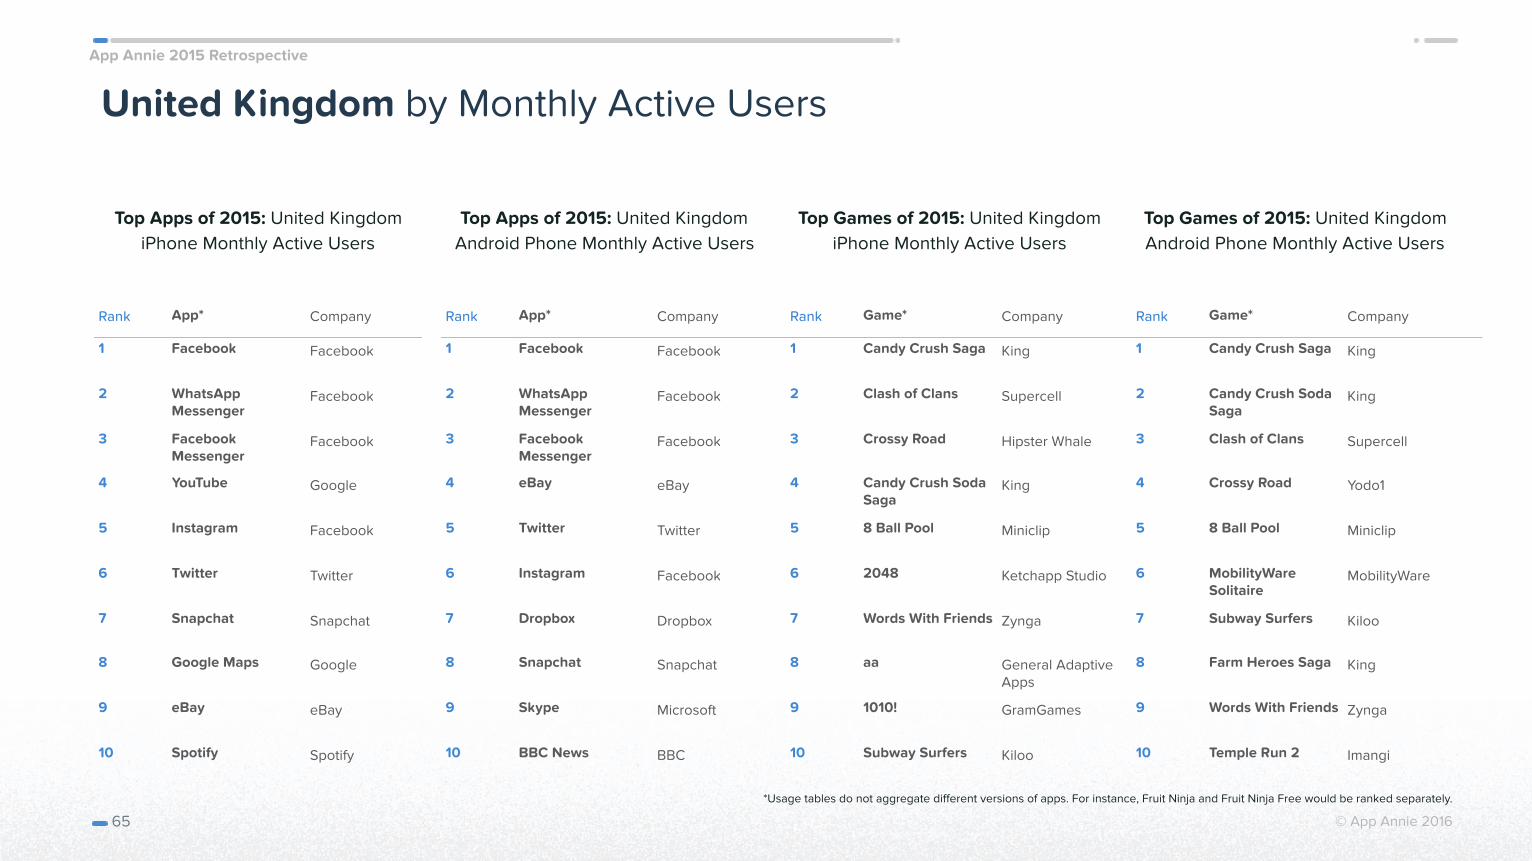
App Annie 2015 Retrospective
© App Annie 2016
United Kingdom by Monthly Active Users
Top Apps of 2015: United Kingdom iPhone Monthly Active Users
65
Top Apps of 2015: United Kingdom Android Phone Monthly Active Users
Top Games of 2015: United Kingdom iPhone Monthly Active Users
Top Games of 2015: United Kingdom Android Phone Monthly Active Users
Rank App* Company
1 Facebook Facebook
2 WhatsApp Messenger
3 Facebook Messenger
4 YouTube Google
5 Instagram Facebook
6 Twitter Twitter
7 Snapchat Snapchat
8 Google Maps Google
9 eBay eBay
10 Spotify Spotify
Rank App* Company
1 Facebook Facebook
2 WhatsApp Messenger
3 Facebook Messenger
4 eBay eBay
5 Twitter Twitter
6 Instagram Facebook
7 Dropbox Dropbox
8 Snapchat Snapchat
9 Skype Microsoft
10 BBC News BBC
Rank Game* Company
1 Candy Crush Saga King
2 Clash of Clans Supercell
3 Crossy Road Hipster Whale
4 Candy Crush Soda Saga
King
5 8 Ball Pool Miniclip
6 2048 Ketchapp Studio
7 Words With Friends Zynga
8 aa General Adaptive Apps
9 1010! GramGames
10 Subway Surfers Kiloo
Rank Game* Company
1 Candy Crush Saga King
2 Candy Crush Soda Saga
King
3 Clash of Clans Supercell
4 Crossy Road Yodo1
5 8 Ball Pool Miniclip
6 MobilityWare Solitaire
MobilityWare
7 Subway Surfers Kiloo
8 Farm Heroes Saga King
9 Words With Friends Zynga
10 Temple Run 2 Imangi
*Usage tables do not aggregate different versions of apps. For instance, Fruit Ninja and Fruit Ninja Free would be ranked separately.
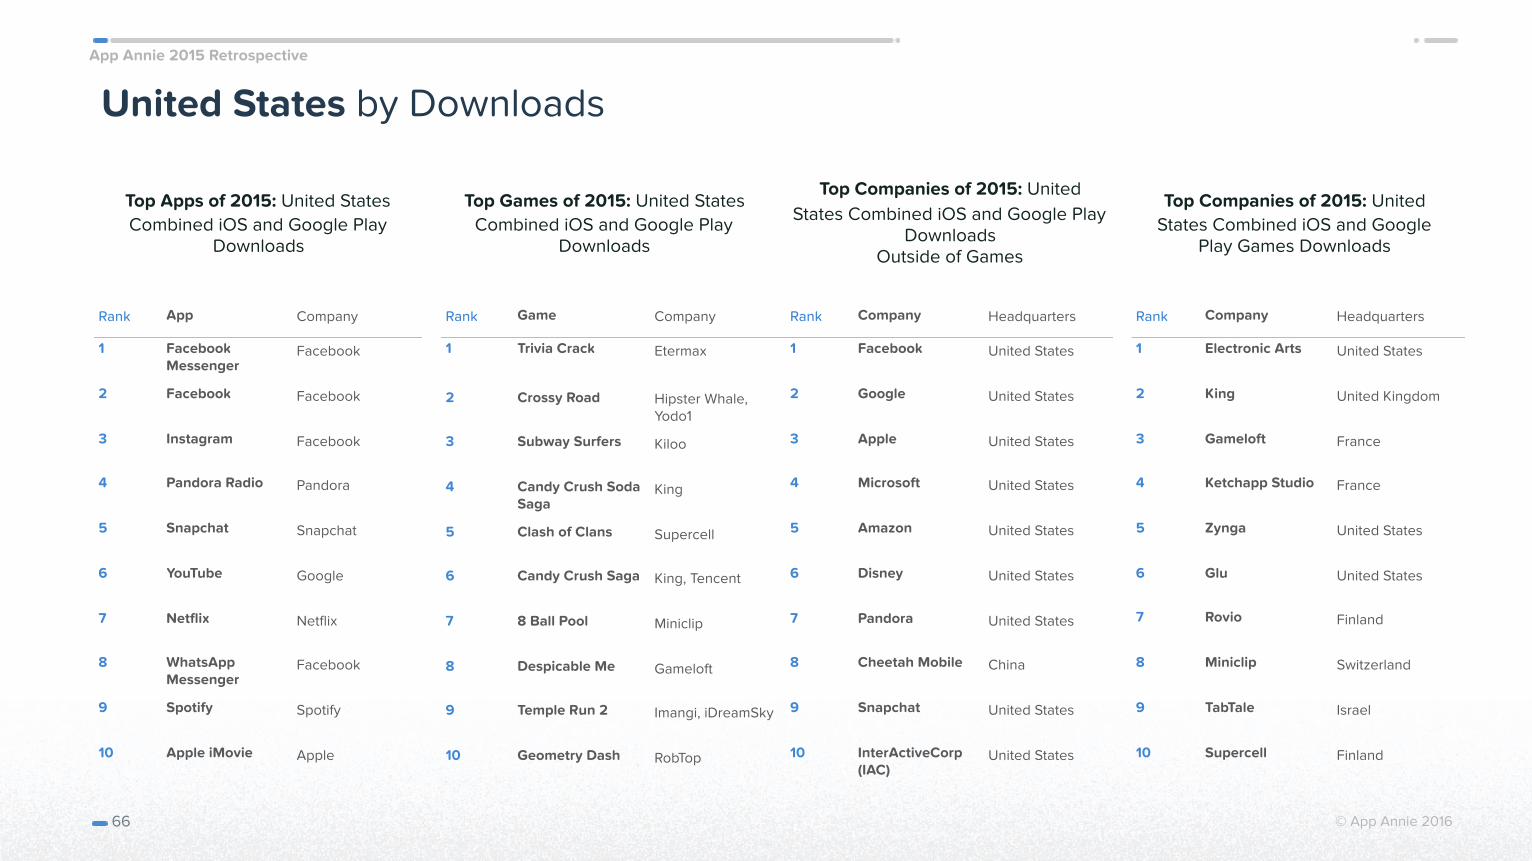
App Annie 2015 Retrospective
© App Annie 2016
United States by Downloads
Top Apps of 2015: United States Combined iOS and Google Play
Downloads
66
Top Games of 2015: United States Combined iOS and Google Play
Downloads
Top Companies of 2015: United States Combined iOS and Google Play
Downloads Outside of Games
Top Companies of 2015: United States Combined iOS and Google
Play Games Downloads
Rank App Company
1 Facebook Messenger
2 Facebook Facebook
3 Instagram Facebook
4 Pandora Radio Pandora
5 Snapchat Snapchat
6 YouTube Google
7 Netflix Netflix
8 WhatsApp Messenger
9 Spotify Spotify
10 Apple iMovie Apple
Rank Game Company
1 Trivia Crack Etermax
2 Crossy Road Hipster Whale, Yodo1
3 Subway Surfers Kiloo
4 Candy Crush Soda Saga
King
5 Clash of Clans Supercell
6 Candy Crush Saga King, Tencent
7 8 Ball Pool Miniclip
8 Despicable Me Gameloft
9 Temple Run 2 Imangi, iDreamSky
10 Geometry Dash RobTop
Rank Company Headquarters
1 Facebook United States
2 Google United States
3 Apple United States
4 Microsoft United States
5 Amazon United States
6 Disney United States
7 Pandora United States
8 Cheetah Mobile China
9 Snapchat United States
10 InterActiveCorp (IAC)
United States
Rank Company Headquarters
1 Electronic Arts United States
2 King United Kingdom
3 Gameloft France
4 Ketchapp Studio France
5 Zynga United States
6 Glu United States
7 Rovio Finland
8 Miniclip Switzerland
9 TabTale Israel
10 Supercell Finland
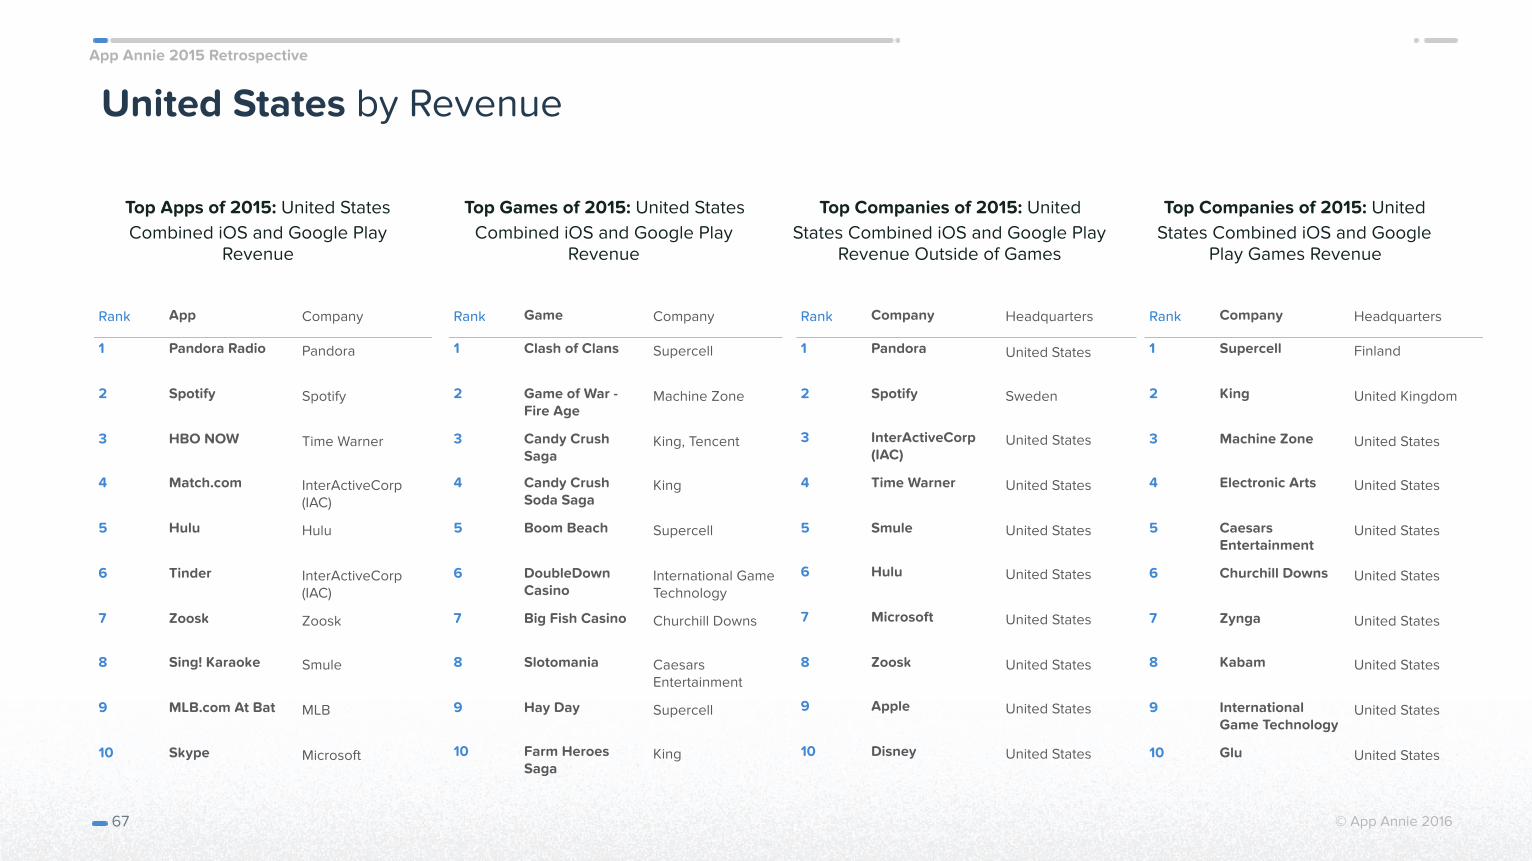
App Annie 2015 Retrospective
© App Annie 2016
United States by Revenue
Top Apps of 2015: United States Combined iOS and Google Play
Revenue
67
Top Games of 2015: United States Combined iOS and Google Play
Revenue
Top Companies of 2015: United States Combined iOS and Google Play
Revenue Outside of Games
Top Companies of 2015: United States Combined iOS and Google
Play Games Revenue
Rank App Company
1 Pandora Radio Pandora
2 Spotify Spotify
3 HBO NOW Time Warner
4 Match.com InterActiveCorp (IAC)
5 Hulu Hulu
6 Tinder InterActiveCorp (IAC)
7 Zoosk Zoosk
8 Sing! Karaoke Smule
9 MLB.com At Bat MLB
10 Skype Microsoft
Rank Game Company
1 Clash of Clans Supercell
2 Game of War - Fire Age
Machine Zone
3 Candy Crush Saga
King, Tencent
4 Candy Crush Soda Saga
King
5 Boom Beach Supercell
6 DoubleDown Casino
International Game Technology
7 Big Fish Casino Churchill Downs
8 Slotomania Caesars Entertainment
9 Hay Day Supercell
10 Farm Heroes Saga
King
Rank Company Headquarters
1 Pandora UnitedStates
2 Spotify Sweden
3 InterActiveCorp (IAC)
United States
4 Time Warner United States
5 Smule United States
6 Hulu United States
7 Microsoft United States
8 Zoosk United States
9 Apple United States
10 Disney United States
Rank Company Headquarters
1 Supercell Finland
2 King United Kingdom
3 Machine Zone United States
4 Electronic Arts United States
5 Caesars Entertainment
United States
6 Churchill Downs United States
7 Zynga United States
8 Kabam United States
9 International Game Technology
United States
10 Glu United States
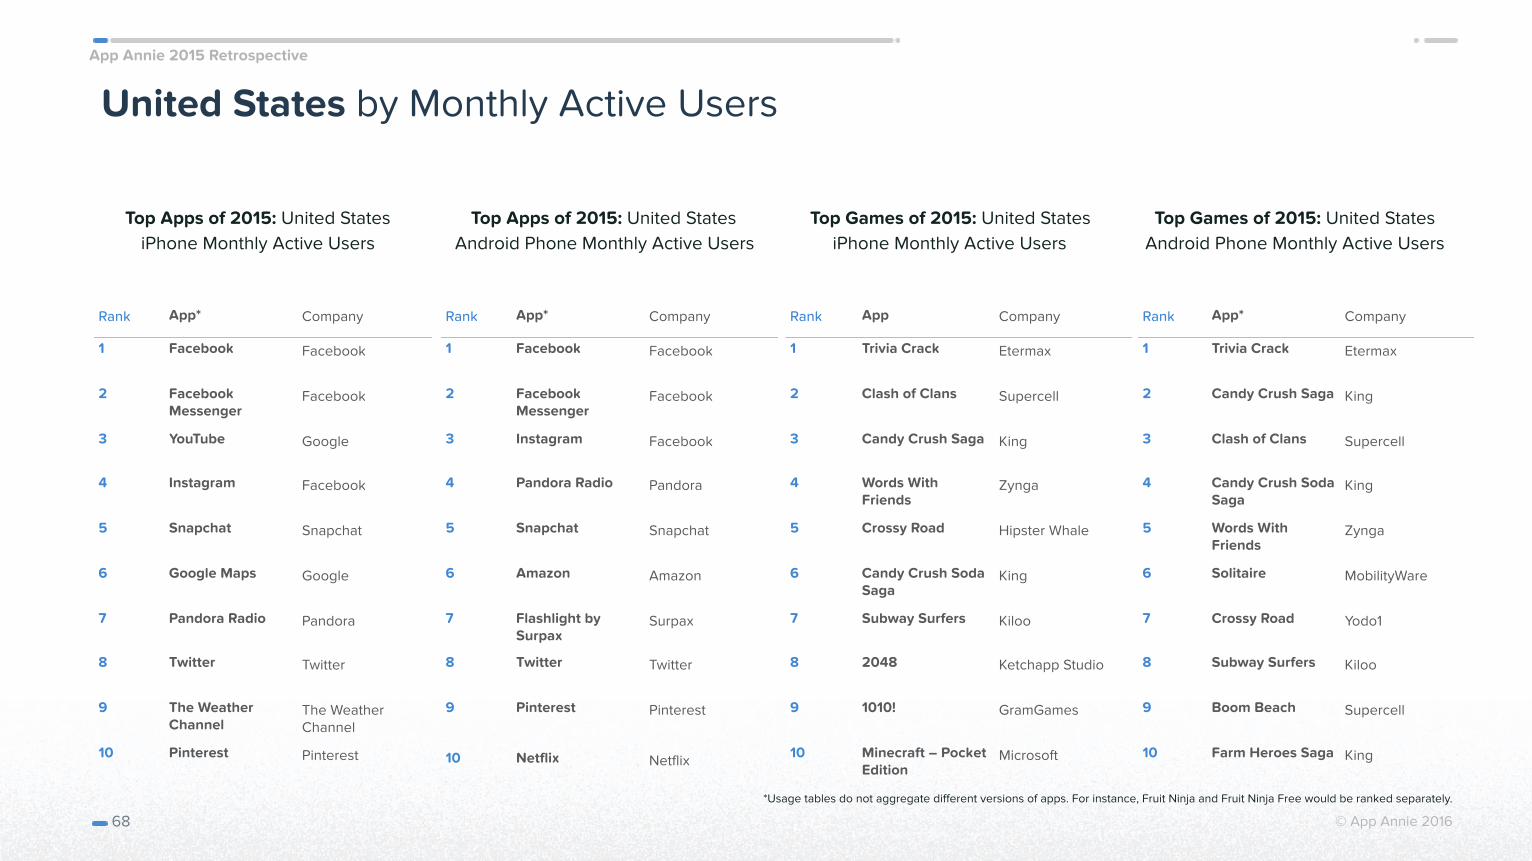
App Annie 2015 Retrospective
© App Annie 2016
United States by Monthly Active Users
Top Apps of 2015: United States iPhone Monthly Active Users
68
Top Apps of 2015: United States Android Phone Monthly Active Users
Top Games of 2015: United States iPhone Monthly Active Users
Top Games of 2015: United States Android Phone Monthly Active Users
Rank App* Company
1 Facebook Facebook
2 Facebook Messenger
3 YouTube Google
4 Instagram Facebook
5 Snapchat Snapchat
6 Google Maps Google
7 Pandora Radio Pandora
8 Twitter Twitter
9 The Weather Channel
The Weather Channel
10 Pinterest Pinterest
Rank App* Company
1 Facebook Facebook
2 Facebook Messenger
3 Instagram Facebook
4 Pandora Radio Pandora
5 Snapchat Snapchat
6 Amazon Amazon
7 Flashlight by Surpax
Surpax
8 Twitter Twitter
9 Pinterest Pinterest
10 Netflix Netflix
Rank App Company
1 Trivia Crack Etermax
2 Clash of Clans Supercell
3 Candy Crush Saga King
4 Words With Friends
Zynga
5 Crossy Road Hipster Whale
6 Candy Crush Soda Saga
King
7 Subway Surfers Kiloo
8 2048 Ketchapp Studio
9 1010! GramGames
10 Minecraft – Pocket Edition
Microsoft
Rank App* Company
1 Trivia Crack Etermax
2 Candy Crush Saga King
3 Clash of Clans Supercell
4 Candy Crush Soda Saga
King
5 Words With Friends
Zynga
6 Solitaire MobilityWare
7 Crossy Road Yodo1
8 Subway Surfers Kiloo
9 Boom Beach Supercell
10 Farm Heroes Saga King
*Usage tables do not aggregate different versions of apps. For instance, Fruit Ninja and Fruit Ninja Free would be ranked separately.
App Annie 2015 Retrospective
Top Countries and Categories
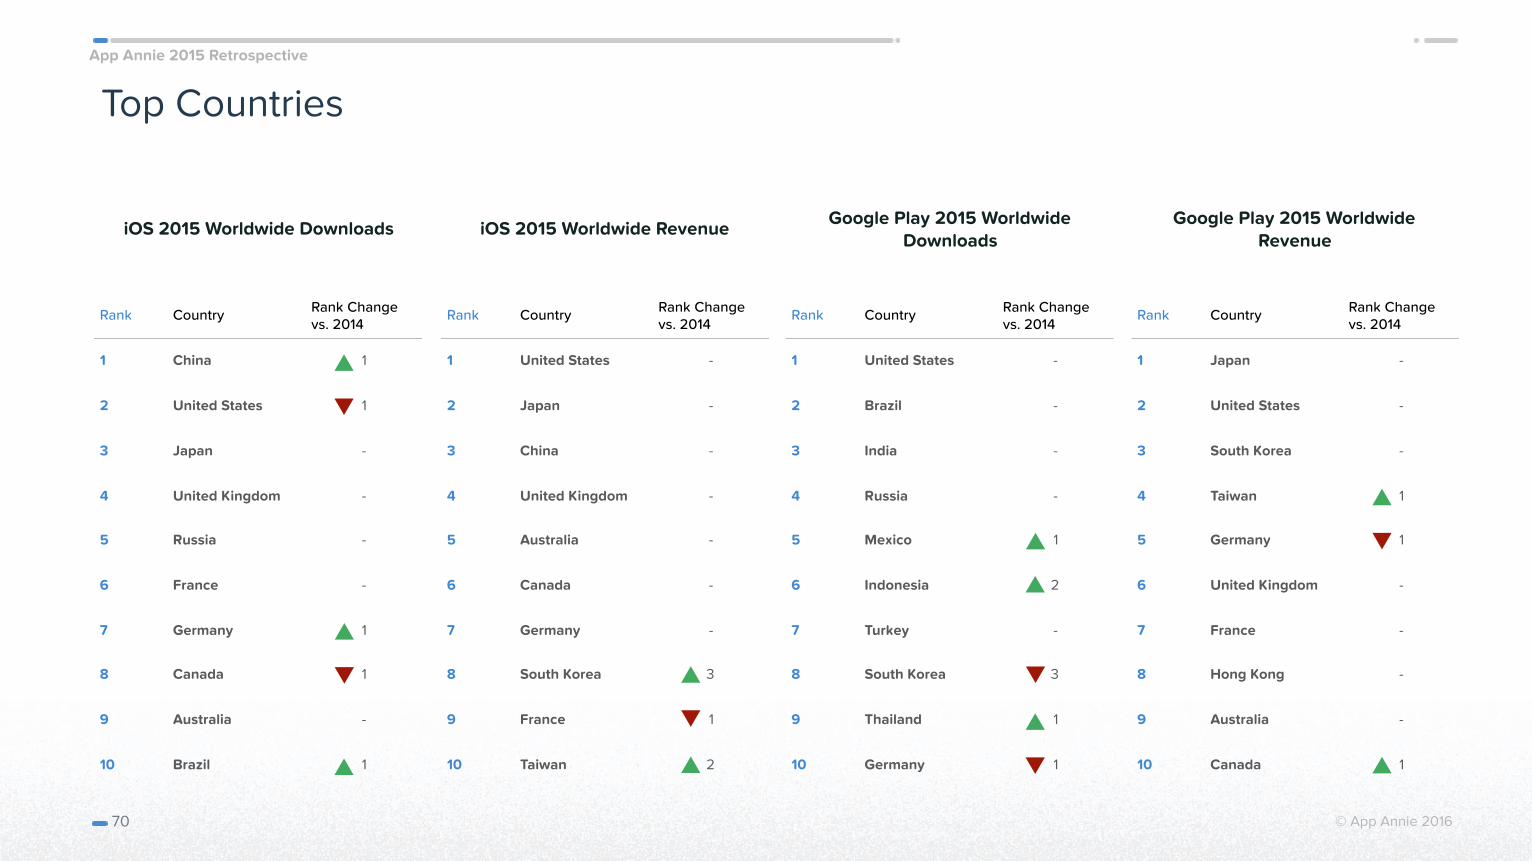
App Annie 2015 Retrospective
© App Annie 2016
Top Countries
iOS 2015 Worldwide Downloads
70
iOS 2015 Worldwide Revenue Google Play 2015 Worldwide Downloads
Google Play 2015 Worldwide Revenue
Rank Country Rank Change vs. 2014
1 China 1
2 United States 1
3 Japan -
4 United Kingdom -
5 Russia -
6 France -
7 Germany 1
8 Canada 1
9 Australia -
10 Brazil 1
Rank Country Rank Change vs. 2014
1 United States -
2 Japan -
3 China -
4 United Kingdom -
5 Australia -
6 Canada -
7 Germany -
8 South Korea 3
9 France 1
10 Taiwan 2
Rank Country Rank Change vs. 2014
1 United States -
2 Brazil -
3 India -
4 Russia -
5 Mexico 1
6 Indonesia 2
7 Turkey -
8 South Korea 3
9 Thailand 1
10 Germany 1
Rank Country Rank Change vs. 2014
1 Japan -
2 United States -
3 South Korea -
4 Taiwan 1
5 Germany 1
6 United Kingdom -
7 France -
8 Hong Kong -
9 Australia -
10 Canada 1
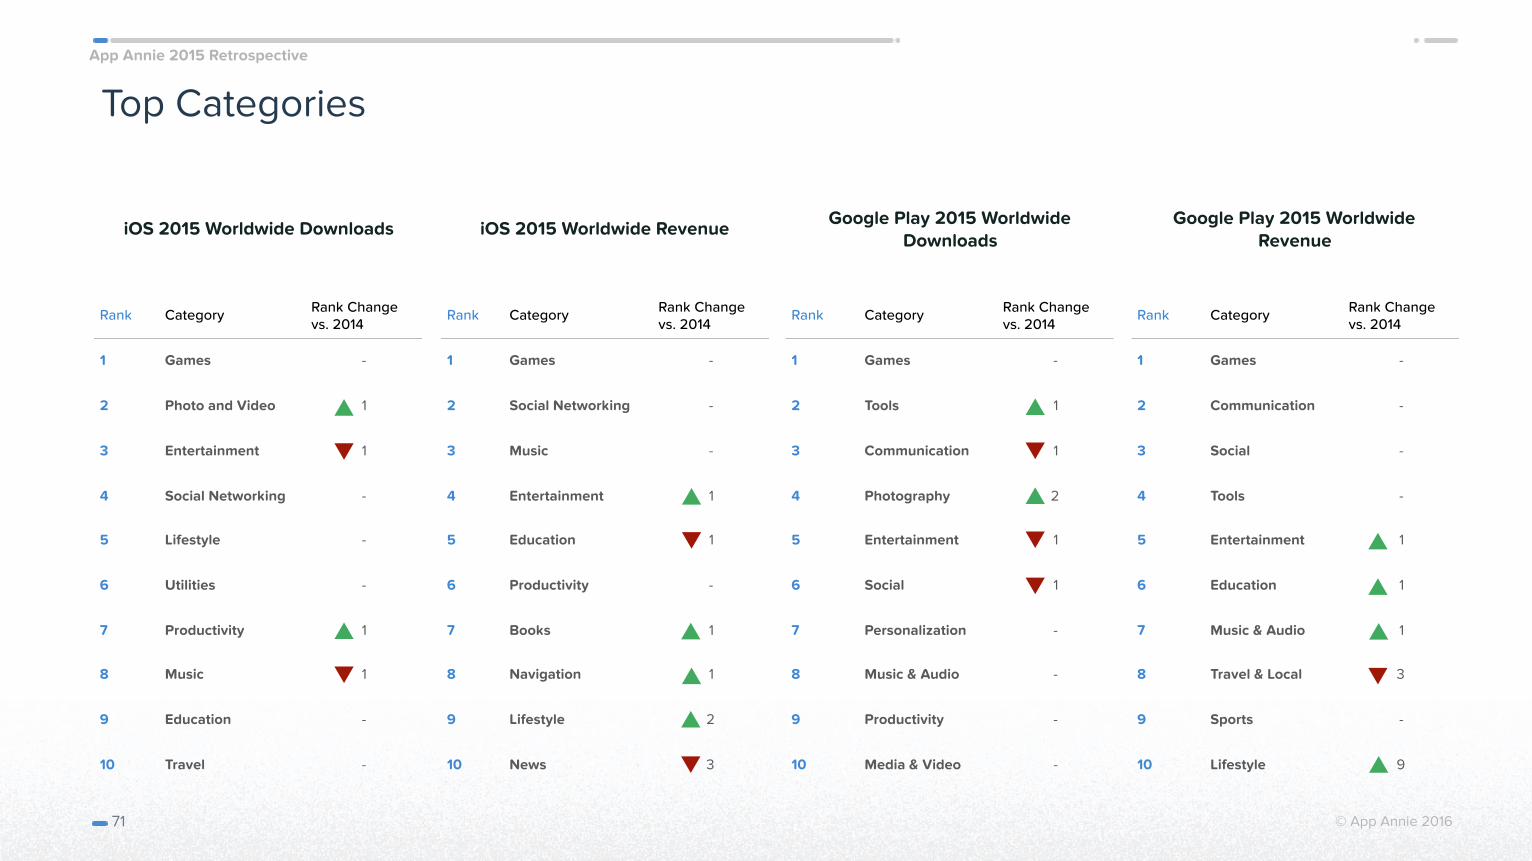
App Annie 2015 Retrospective
© App Annie 2016
Top Categories
iOS 2015 Worldwide Downloads
71
iOS 2015 Worldwide Revenue Google Play 2015 Worldwide Downloads
Google Play 2015 Worldwide Revenue
Rank Category Rank Change vs. 2014
1 Games -
2 Photo and Video 1
3 Entertainment 1
4 Social Networking -
5 Lifestyle -
6 Utilities -
7 Productivity 1
8 Music 1
9 Education -
10 Travel -
Rank Category Rank Change vs. 2014
1 Games -
2 Social Networking -
3 Music -
4 Entertainment 1
5 Education 1
6 Productivity -
7 Books 1
8 Navigation 1
9 Lifestyle 2
10 News 3
Rank Category Rank Change vs. 2014
1 Games -
2 Tools 1
3 Communication 1
4 Photography 2
5 Entertainment 1
6 Social 1
7 Personalization -
8 Music & Audio -
9 Productivity -
10 Media & Video -
Rank Category Rank Change vs. 2014
1 Games -
2 Communication -
3 Social -
4 Tools -
5 Entertainment 1
6 Education 1
7 Music & Audio 1
8 Travel & Local 3
9 Sports -
10 Lifestyle 9
App Annie 2015 Retrospective
© App Annie 2016
App Annie delivers the most trusted app data and
insights for your business to succeed in the app
economy globally. App Annie is used by more than 1
million apps to track their performance, and now has
over 500,000 registered members — including 94 of
the top 100 publishers. The company is headquartered
in San Francisco with 425 employees across 15 global
offices. App Annie has raised $157 million in financing
to date from investors such as e.Ventures, Greenspring
Associates, Greycroft Partners, IDG Capital Partners,
Institutional Venture Partners and Sequoia Capital.
For more information, please visit http://
www.appannie.com/, check out our blog, and
follow us on Twitter (@AppAnnie). To find out
more about our specific products, tour our App
Store Analytics, Store Stats, and App Annie
Intelligence products. For the most current
monthly rankings of apps and publishers, check
out the App Annie Index.
Report methodology and updates are available here.
72
Create your freeApp Annie account to get access to historical ranks
and reviews at www.appannie.com
About App Annie