Embed Size (px)
DESCRIPTION
有同学在看过《Oracle调优鹰眼,深入理解AWR性能报告》的教学视频后急切期待第三讲,但实际是第三讲需要结合大量的原理知识才能充分理解 例如Latch activity 、Undo、Dynamic Resource Master均需要理解其原理才能充分理解。 所以这些AWR的环节将在 Maclean 今后的 系列调优讲座中介绍。 对于《Oracle调优鹰眼系列》 则会增加本附录,作为对全部Oracle AWR指标的介绍, 本附录对于原理理解方面的内容将不多,而更侧重于指标含义的介绍,是对AWR鹰眼讲座的工具文档。
Citation preview

上海 Oracle 用户组 -- SHOUG -- ShangHai Oracle Users Group http://www.shoug.info/
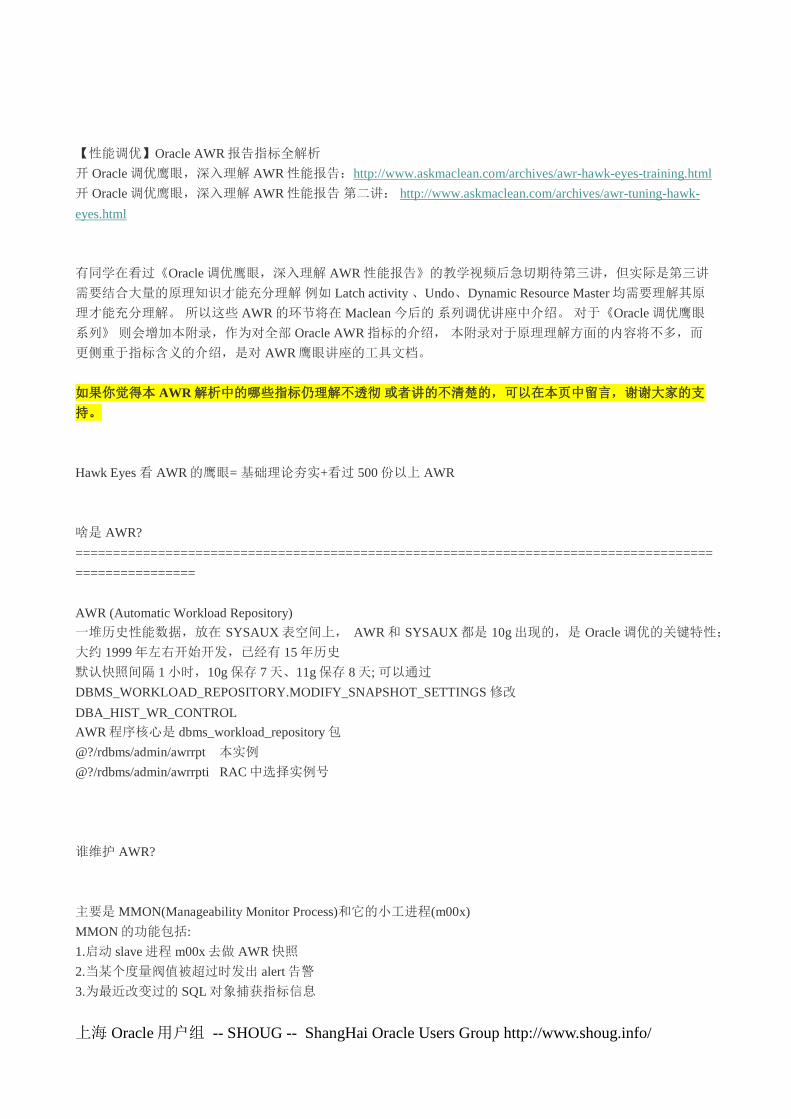
【性能调优】Oracle AWR 报告指标全解析
by Maclean.liu [email protected]
www.askmaclean.com

上海 Oracle 用户组 -- SHOUG -- ShangHai Oracle Users Group http://www.shoug.info/

上海 Oracle 用户组 -- SHOUG -- ShangHai Oracle Users Group http://www.shoug.info/
How to Find SHOUG?
上海 Oracle 用户组 -- SHOUG -- ShangHai Oracle Users Group http://www.shoug.info/
【性能调优】Oracle AWR 报告指标全解析
开 Oracle 调优鹰眼,深入理解 AWR 性能报告:http://www.askmaclean.com/archives/awr-hawk-eyes-training.html
开 Oracle 调优鹰眼,深入理解 AWR 性能报告 第二讲: http://www.askmaclean.com/archives/awr-tuning-hawk-
eyes.html
有同学在看过《Oracle 调优鹰眼,深入理解 AWR 性能报告》的教学视频后急切期待第三讲,但实际是第三讲
需要结合大量的原理知识才能充分理解 例如 Latch activity 、Undo、Dynamic Resource Master 均需要理解其原
理才能充分理解。 所以这些 AWR 的环节将在 Maclean 今后的 系列调优讲座中介绍。 对于《Oracle 调优鹰眼
系列》 则会增加本附录,作为对全部 Oracle AWR 指标的介绍, 本附录对于原理理解方面的内容将不多,而
更侧重于指标含义的介绍,是对 AWR 鹰眼讲座的工具文档。
如果你觉得本 AWR 解析中的哪些指标仍理解不透彻 或者讲的不清楚的,可以在本页中留言,谢谢大家的支
持。
Hawk Eyes 看 AWR 的鹰眼= 基础理论夯实+看过 500 份以上 AWR
啥是 AWR?
=====================================================================================
================
AWR (Automatic Workload Repository)
一堆历史性能数据,放在 SYSAUX 表空间上, AWR 和 SYSAUX 都是 10g 出现的,是 Oracle 调优的关键特性;
大约 1999 年左右开始开发,已经有 15 年历史
默认快照间隔 1 小时,10g 保存 7 天、11g 保存 8 天; 可以通过
DBMS_WORKLOAD_REPOSITORY.MODIFY_SNAPSHOT_SETTINGS 修改
DBA_HIST_WR_CONTROL
AWR 程序核心是 dbms_workload_repository 包
@?/rdbms/admin/awrrpt 本实例
@?/rdbms/admin/awrrpti RAC 中选择实例号
谁维护 AWR?
主要是 MMON(Manageability Monitor Process)和它的小工进程(m00x)
MMON 的功能包括:
1.启动 slave 进程 m00x 去做 AWR 快照
2.当某个度量阀值被超过时发出 alert 告警
3.为最近改变过的 SQL 对象捕获指标信息
上海 Oracle 用户组 -- SHOUG -- ShangHai Oracle Users Group http://www.shoug.info/
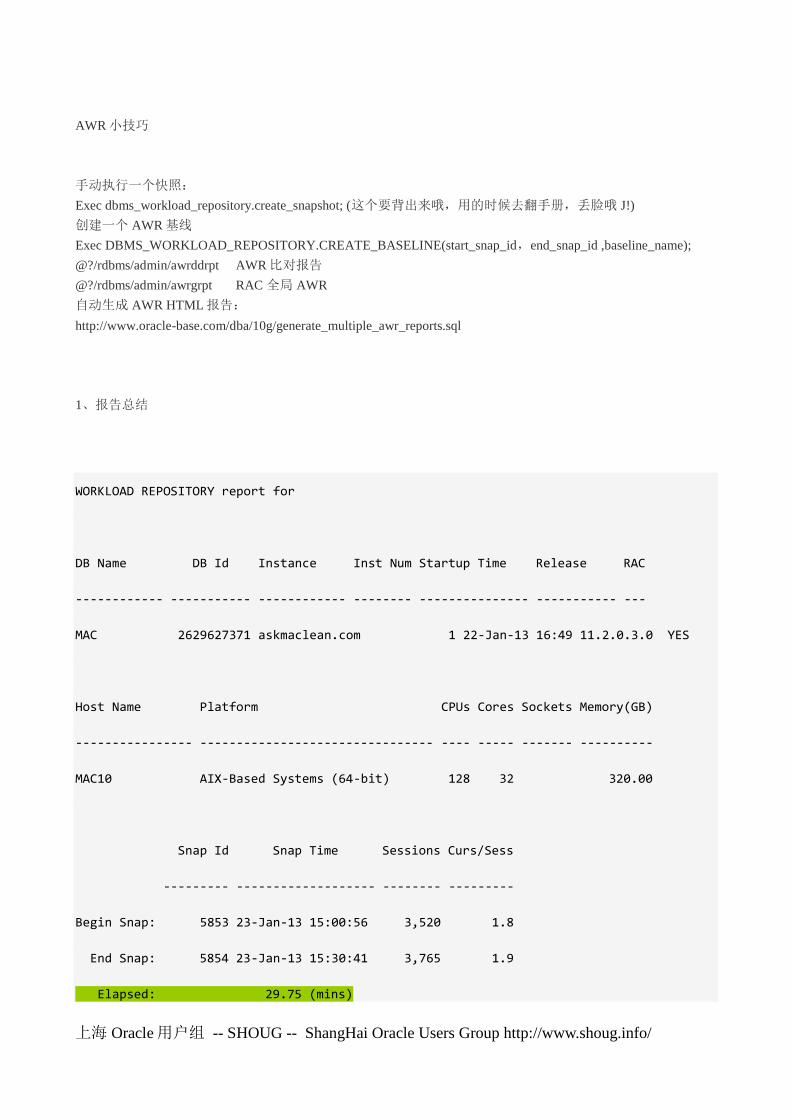
AWR 小技巧
手动执行一个快照:
Exec dbms_workload_repository.create_snapshot; (这个要背出来哦,用的时候去翻手册,丢脸哦 J!)
创建一个 AWR 基线
Exec DBMS_WORKLOAD_REPOSITORY.CREATE_BASELINE(start_snap_id,end_snap_id ,baseline_name);
@?/rdbms/admin/awrddrpt AWR 比对报告
@?/rdbms/admin/awrgrpt RAC 全局 AWR
自动生成 AWR HTML 报告:
http://www.oracle-base.com/dba/10g/generate_multiple_awr_reports.sql
1、报告总结
WORKLOAD REPOSITORY report for
DB Name DB Id Instance Inst Num Startup Time Release RAC
------------ ----------- ------------ -------- --------------- ----------- ---
MAC 2629627371 askmaclean.com 1 22-Jan-13 16:49 11.2.0.3.0 YES
Host Name Platform CPUs Cores Sockets Memory(GB)
---------------- -------------------------------- ---- ----- ------- ----------
MAC10 AIX-Based Systems (64-bit) 128 32 320.00
Snap Id Snap Time Sessions Curs/Sess
--------- ------------------- -------- ---------
Begin Snap: 5853 23-Jan-13 15:00:56 3,520 1.8
End Snap: 5854 23-Jan-13 15:30:41 3,765 1.9
Elapsed: 29.75 (mins)

上海 Oracle 用户组 -- SHOUG -- ShangHai Oracle Users Group http://www.shoug.info/
DB Time: 7,633.76 (mins)
Elapsed 为该 AWR 性能报告的时间跨度(自然时间的跨度,例如前一个快照 snapshot 是 4 点生成的,后一个快
照 snapshot 是 6 点生成的,则若使用@?/rdbms/admin/awrrpt 脚本中指定这 2 个快照的话,那么其 elapsed = (6-
4)=2 个小时),一个 AWR 性能报告 至少需要 2 个 AWR snapshot 性能快照才能生成 ( 注意这 2 个快照时间 实例
不能重启过,否则指定这 2 个快照生成 AWR 性能报告 会报错),AWR 性能报告中的 指标往往是 后一个快照
和前一个快照的 指标的 delta,这是因为 累计值并不能反映某段时间内的系统 workload。
DB TIME= 所有前台 session 花费在 database 调用上的总和时间:
注意是前台进程 foreground sessions
包括 CPU 时间、IO Time、和其他一系列非空闲等待时间,别忘了 cpu on queue time
DB TIME 不等于 响应时间,DB TIME 高了未必响应慢,DB TIME 低了未必响应快
DB Time 描绘了数据库总体负载,但要和 elapsed time 逝去时间结合其他来。
Average Active Session AAS= DB time/Elapsed Time
DB Time =60 min , Elapsed Time =60 min AAS=60/60=1 负载一般
DB Time= 1min , Elapsed Time= 60 min AAS= 1/60 负载很轻
DB Time= 60000 min,Elapsed Time= 60 min AAS=1000 系统 hang 了吧?
DB TIME= DB CPU + Non-Idle Wait + Wait on CPU queue
如果仅有 2 个逻辑 CPU,而 2 个 session 在 60 分钟都没等待事件,一直跑在 CPU 上,那么:
DB CPU= 2 * 60 mins , DB Time = 2* 60 + 0 + 0 =120
AAS = 120/60=2 正好等于 OS load 2。
如果有 3 个 session 都 100%仅消耗 CPU,那么总有一个要 wait on queue
DB CPU = 2* 60 mins ,wait on CPU queue= 60 mins
AAS= (120+ 60)/60=3 主机 load 亦为 3,此时 vmstat 看 waiting for run time
真实世界中? DB Cpu = xx mins , Non-Idle Wait= enq:TX + cursor pin S on X + latch : xxx + db file sequential
read + ……….. 阿猫阿狗
1-1 内存参数大小
Cache Sizes Begin End
~~~~~~~~~~~ ---------- ----------
Buffer Cache: 49,152M 49,152M Std Block Size: 8K
Shared Pool Size: 13,312M 13,312M Log Buffer: 334,848K

上海 Oracle 用户组 -- SHOUG -- ShangHai Oracle Users Group http://www.shoug.info/
内存管理方式:MSMM、ASMM(sga_target)、AMM(memory_target)
小内存有小内存的问题, 大内存有大内存的麻烦! ORA-04031???!!
Buffer cache 和 shared pool size 的 begin/end 值在 ASMM、AMM 和 11gR2 MSMM 下可是会动的哦!
这里说 shared pool 一直收缩,则在 shrink 过程中一些 row cache 对象被 lock 住可能导致前台 row cache lock 等
解析等待,最好别让 shared pool shrink。如果这里 shared pool 一直在 grow,那说明 shared pool 原有大小不足以
满足需求(可能是大量硬解析),结合下文的解析信息和 SGA breakdown 来一起诊断问题。
1-2 Load Profile
Load Profile Per Second Per Transaction Per Exec Per Call
~~~~~~~~~~~~ --------------- --------------- ---------- ----------
DB Time(s): 256.6 0.2 0.07 0.03
DB CPU(s): 3.7 0.0 0.00 0.00
Redo size: 1,020,943.0 826.5
Logical reads: 196,888.0 159.4
Block changes: 6,339.4 5.1
Physical reads: 5,076.7 4.1
Physical writes: 379.2 0.3
User calls: 10,157.4 8.2
Parses: 204.0 0.2
Hard parses: 0.9 0.0
W/A MB processed: 5.0 0.0
Logons: 1.7 0.0
Executes: 3,936.6 3.2
Rollbacks: 1,126.3 0.9
Transactions: 1,235.3

上海 Oracle 用户组 -- SHOUG -- ShangHai Oracle Users Group http://www.shoug.info/
% Blocks changed per Read: 53.49 Recursive Call %: 98.04
Rollback per transaction %: 36.57 Rows per Sort: 73.70
指标 指标含义
redo size
单位 bytes,redo size 可以用来估量 update/insert/delete 的频率,大的 redo size 往往对 lgwr 写日
志,和 arch 归档造成 I/O 压力, Per Transaction 可以用来分辨是 大量小事务, 还是少量大事
务。如上例每秒 redo 约 1MB ,每个事务 800 字节,符合 OLTP 特征
Logical Read
单位 次数*块数, 相当于 ―人*次‖, 如上例 196,888 * db_block_size=1538MB/s , 逻辑读耗
CPU,主频和 CPU 核数都很重要,逻辑读高则 DB CPU 往往高,也往往可以看到 latch: cache
buffer chains 等待。 大量 OLTP 系统(例如 siebel)可以高达几十乃至上百 Gbytes。
Block changes 单位 次数*块数 , 描绘数据变化频率
Physical Read
单位次数*块数, 如上例 5076 * 8k = 39MB/s, 物理读消耗 IO 读,体现在 IOPS 和吞吐量等不
同纬度上;但减少物理读可能意味着消耗更多 CPU。好的存储 每秒物理读能力达到几 GB,
例如 Exadata。 这个 physical read 包含了 physical reads cache 和 physical reads direct
Physical writes
单位 次数*块数,主要是 DBWR 写 datafile,也有 direct path write。 dbwr 长期写出慢会导致
定期 log file switch(checkpoint no complete) 检查点无法完成的前台等待。 这个 physical write
包含了 physical writes direct +physical writes from cache
User Calls 单位次数,用户调用数,more details from internal
Parses 解析次数,包括软解析+硬解析,软解析优化得不好,则夸张地说几乎等于每秒 SQL 执行次
数。 即执行解析比 1:1,而我们希望的是 解析一次 到处运行哦!
Hard Parses 万恶之源. Cursor pin s on X, library cache: mutex X , latch: row cache objects /shared
pool……………..。 硬解析最好少于每秒 20 次
W/A MB pro-
cessed
单位 MB W/A workarea workarea 中处理的数据数量
结合 In-memory Sort%, sorts (disk) PGA Aggr 一起看
Logons 登陆次数, logon storm 登陆风暴,结合 AUDIT 审计数据一起看。短连接的附带效应是游标缓
存无用
Executes 执行次数,反应执行频率
Rollback 回滚次数, 反应回滚频率, 但是这个指标不太精确,参考而已,别太当真
Transactions 每秒事务数,是数据库层的 TPS,可以看做压力测试或比对性能时的一个指标,孤立看无意
义
% Blocks
changed per
Read
每次逻辑读导致数据块变化的比率;如果‘redo size‘, ‗block changes‘ ‗pct of blocks changed per
read‘三个指标都很高,则说明系统正执行大量 insert/update/delete;
pct of blocks changed per read = (block changes ) /( logical reads)

上海 Oracle 用户组 -- SHOUG -- ShangHai Oracle Users Group http://www.shoug.info/
Recursive Call % 递归调用的比率;Recursive Call % = (recursive calls)/(user calls)
Rollback per
transaction % 事务回滚比率。 Rollback per transaction %= (rollback)/(transactions)
Rows per Sort 平均每次排序涉及到的行数 ; Rows per Sort= ( sorts(rows) ) / ( sorts(disk) + sorts(memory))
注意这些 Load Profile 负载指标 在本环节提供了 2 个维度 per second 和 per transaction。
per Second: 主要是把 快照内的 delta 值除以 快站时间的秒数 , 例如 在 A 快照中 V$SYSSTAT 视图反应 table
scans (long tables) 这个指标是 100 ,在 B 快照中 V$SYSSTAT 视图反应 table scans (long tables) 这个指标是
3700, 而 A 快照和 B 快照 之间 间隔了一个小时 3600 秒, 则 对于 table scans (long tables) per second 就
是 ( 3700- 100) /3600=1。
pert Second 是我们审视数据的主要维度 ,任何性能数据脱离了 时间模型则毫无意义。
在 statspack/AWR 出现之前 的调优 洪荒时代, 有很多 DBA 依赖 V$SYSSTAT 等视图中的累计 统计信息来调
优,以当前的调优眼光来看,那无异于刀耕火种。
per transaction : 基于事务的维度, 与 per second 相比 是把除数从时间的秒数改为了该段时间内的事务数。 这
个维度的很大用户是用来 识别应用特性的变化 ,若 2 个 AWR 性能报告中该维度指标 出现了大幅变化,例如
redo size 从本来 per transaction 1k 变化为 10k per transaction,则说明 SQL 业务逻辑肯定发生了某些变化。
注意 AWR 中的这些指标 并不仅仅用来孤立地了解 Oracle 数据库负载情况, 实施调优工作。 对于 故障诊断
例如 HANG、Crash 等, 完全可以通过对比问题时段的性能报告和常规时间来对比,通过各项指标的对比往往
可以找出 病灶所在。
1-3 Instance Efficiency Percentages (Target 100%)
Instance Efficiency Percentages (Target 100%)
~~~~~~~~~~~~~~~~~~~~~~~~~~~~~~~~~~~~~~~~~~~~~
Buffer Nowait %: 99.97 Redo NoWait %: 100.00
Buffer Hit %: 97.43 In-memory Sort %: 100.00
Library Hit %: 99.88 Soft Parse %: 99.58
Execute to Parse %: 94.82 Latch Hit %: 99.95
Parse CPU to Parse Elapsd %: 1.75 % Non-Parse CPU: 99.85

上海 Oracle 用户组 -- SHOUG -- ShangHai Oracle Users Group http://www.shoug.info/
上述所有指标 的目标均为 100%,即越大越好,在少数 bug 情况下可能超过 100%或者为负值。
80%以上 %Non-Parse CPU
90%以上 Buffer Hit%, In-memory Sort%, Soft Parse%
95%以上 Library Hit%, Redo Nowait%, Buffer Nowait%
98%以上 Latch Hit%
1、 Buffer Nowait % session 申请一个 buffer(兼容模式)不等待的次数比例。 需要访问 buffer 时立即可以访问的
比率, 不兼容的情况 在 9i 中是 buffer busy waits,从 10g 以后 buffer busy waits 分离为 buffer busy wait 和 read
by other session2 个等待事件 :
9i 中 waitstat 的总次数基本等于 buffer busy waits 等待事件的次数
SQL> select sum(TOTAL_WAITS) from v$system_event where event='buffer busy waits';
SUM(TOTAL_WAITS)
—————-
33070394
SQL> select sum(count) from v$waitstat;
SUM(COUNT)
———-
33069335
10g waitstat 的总次数基本等于 buffer busy waits 和 read by other session 等待的次数总和
SQL> select sum(TOTAL_WAITS) from v$system_event where event='buffer busy waits' or
event='read by other session';
SUM(TOTAL_WAITS)
—————-
上海 Oracle 用户组 -- SHOUG -- ShangHai Oracle Users Group http://www.shoug.info/
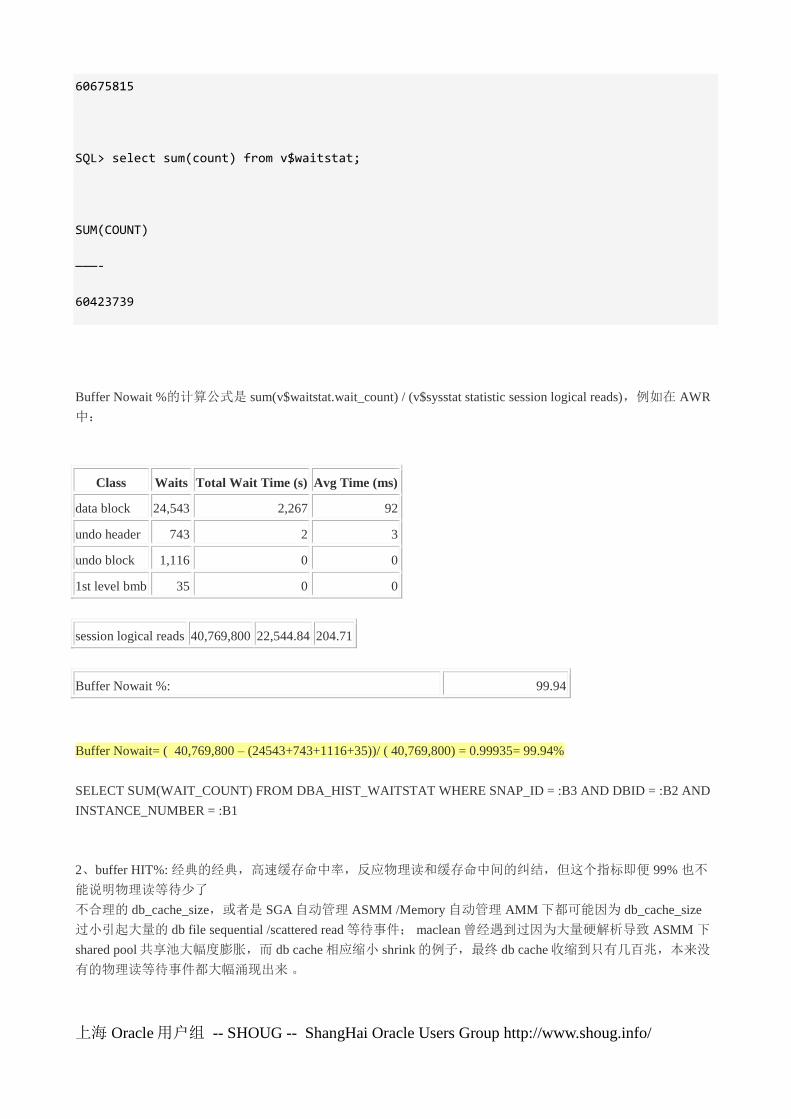
60675815
SQL> select sum(count) from v$waitstat;
SUM(COUNT)
———-
60423739
Buffer Nowait %的计算公式是 sum(v$waitstat.wait_count) / (v$sysstat statistic session logical reads),例如在 AWR
中:
Class Waits Total Wait Time (s) Avg Time (ms)
data block 24,543 2,267 92
undo header 743 2 3
undo block 1,116 0 0
1st level bmb 35 0 0
session logical reads 40,769,800 22,544.84 204.71
Buffer Nowait %: 99.94
Buffer Nowait= ( 40,769,800 – (24543+743+1116+35))/ ( 40,769,800) = 0.99935= 99.94%
SELECT SUM(WAIT_COUNT) FROM DBA_HIST_WAITSTAT WHERE SNAP_ID = :B3 AND DBID = :B2 AND
INSTANCE_NUMBER = :B1
2、buffer HIT%: 经典的经典,高速缓存命中率,反应物理读和缓存命中间的纠结,但这个指标即便 99% 也不
能说明物理读等待少了
不合理的 db_cache_size,或者是 SGA 自动管理 ASMM /Memory 自动管理 AMM 下都可能因为 db_cache_size
过小引起大量的 db file sequential /scattered read 等待事件; maclean 曾经遇到过因为大量硬解析导致 ASMM 下
shared pool 共享池大幅度膨胀,而 db cache 相应缩小 shrink 的例子,最终 db cache 收缩到只有几百兆,本来没
有的物理读等待事件都大幅涌现出来 。

上海 Oracle 用户组 -- SHOUG -- ShangHai Oracle Users Group http://www.shoug.info/
此外与 buffer HIT%相关的指标值得关注的还有 table scans(long tables) 大表扫描这个统计项目、此外相关的栏
目还有 Buffer Pool Statistics 、Buffer Pool Advisory 等(如果不知道在哪里,直接找一个 AWR 去搜索这些关键
词即可)。
buffer HIT%在 不同版本有多个计算公式:
在 9i 中
Buffer Hit Ratio = 1 – ((physical reads – physical reads direct – physical reads direct (lob)) / (db block gets + consistent
gets – physical reads direct – physical reads direct (lob))
在 10g 以后:
Buffer Hit Ratio= 1 – ((‗physical reads cache‘) / (‗consistent gets from cache‘ + ‗db block gets from cache‘)
注意:但是实际 AWR 中 似乎还是按照 9i 中的算法,虽然算法的区别对最后算得的比率影响不大。
对于 buffer hit % 看它的命中率有多高没有意义,主要是关注 未命中的次数有多少。通过上述公式很容易反
推出未命中的物理读的次数。
db block gets 、consistent gets 以及 session logical reads 的关系如下:
db block gets=db block gets direct+ db block gets from cache
consistent gets = consistent gets from cache+ consistent gets direct
consistent gets from cache= consistent gets – examination + else
consistent gets – examination==>指的是不需要 pin buffer 直接可以执行 consistent get 的次数,常用于索引,只需
要一次 latch get
session logical reads = db block gets +consistent gets
其中 physical reads 、physical reads cache、physical reads direct、physical reads direct (lob)几者的关系为:
physical reads = physical reads cache + physical reads direct
这个公式其实说明了 物理读有 2 种 :
物理读进入 buffer cache 中 ,是常见的模式 physical reads cache
物理读直接进入 PGA 直接路径读, 即 physical reads direct
physical
reads
8 Total number of data blocks read from disk. This value can be greater than the value of ―physical reads
direct‖ plus ―physical reads cache‖ as reads into process private buffers also included in this statistic.
physical reads
cache
8 Total number of data blocks read from disk into the buffer cache. This is a subset of ―physical
reads‖ statistic.
physical
reads direct
8 Number of reads directly from disk, bypassing the buffer cache. For example, in high bandwidth, data-
intensive operations such as parallel query, reads of disk blocks bypass the buffer cache to maximize
transfer rates and to prevent the premature aging of shared data blocks resident in the buffer cache.
上海 Oracle 用户组 -- SHOUG -- ShangHai Oracle Users Group http://www.shoug.info/
physical reads direct = physical reads direct (lob) + physical reads direct temporary tablespace + physical reads
direct(普通)
这个公式也说明了 直接路径读 分成三个部分:
physical reads direct (lob) 直接路径读 LOB 对象
physical reads direct temporary tablespace 直接路径读临时表空间
physical read direct(普通) 普通的直接路径读, 一般是 11g 开始的自动的大表 direct path read 和并行引起
的 direct path read
physical writes direct= physical writes direct (lob)+ physical writes direct temporary tablespace
DBWR checkpoint buffers written = DBWR thread checkpoint buffers written+ DBWR tablespace checkpoint buffers
written+ DBWR PQ tablespace checkpoint buffers written+….
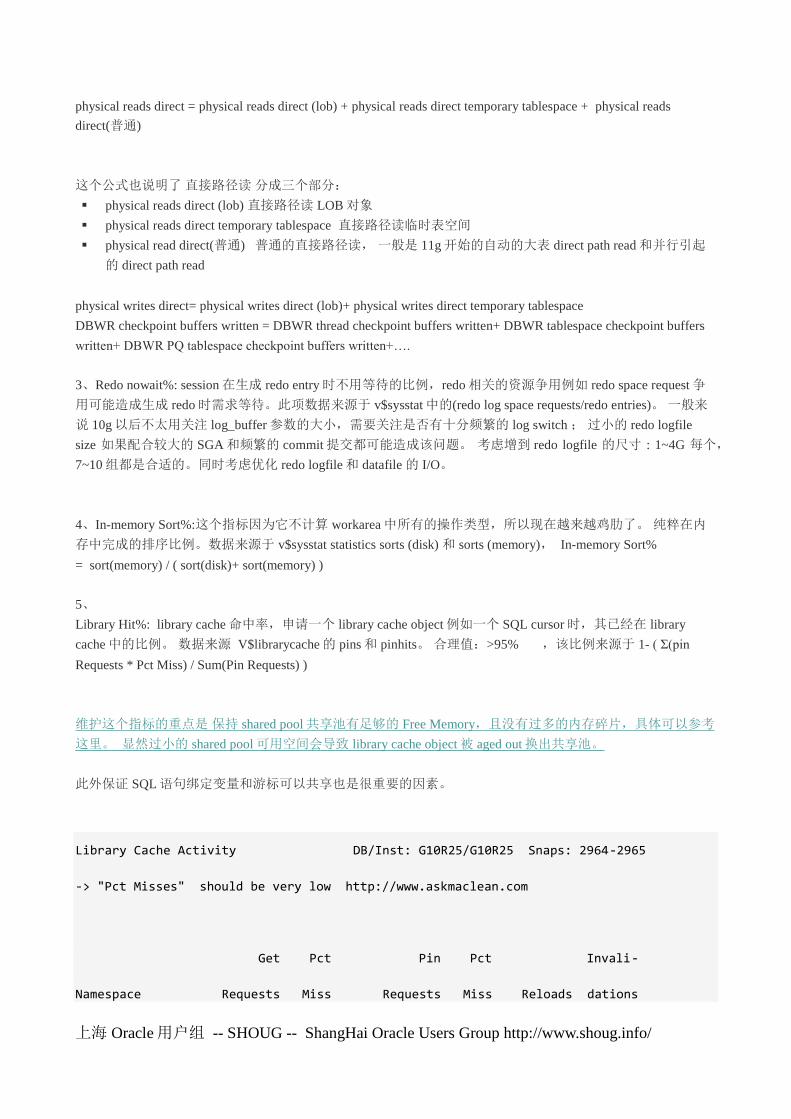
3、Redo nowait%: session 在生成 redo entry 时不用等待的比例,redo 相关的资源争用例如 redo space request 争
用可能造成生成 redo 时需求等待。此项数据来源于 v$sysstat 中的(redo log space requests/redo entries)。 一般来
说 10g 以后不太用关注 log_buffer 参数的大小,需要关注是否有十分频繁的 log switch ; 过小的 redo logfile
size 如果配合较大的 SGA 和频繁的 commit 提交都可能造成该问题。 考虑增到 redo logfile 的尺寸 : 1~4G 每个,
7~10 组都是合适的。同时考虑优化 redo logfile 和 datafile 的 I/O。
4、In-memory Sort%:这个指标因为它不计算 workarea 中所有的操作类型,所以现在越来越鸡肋了。 纯粹在内
存中完成的排序比例。数据来源于 v$sysstat statistics sorts (disk) 和 sorts (memory), In-memory Sort%
= sort(memory) / ( sort(disk)+ sort(memory) )
5、
Library Hit%: library cache 命中率,申请一个 library cache object 例如一个 SQL cursor 时,其已经在 library
cache 中的比例。 数据来源 V$librarycache 的 pins 和 pinhits。 合理值:>95% ,该比例来源于 1- ( Σ(pin
Requests * Pct Miss) / Sum(Pin Requests) )
维护这个指标的重点是 保持 shared pool 共享池有足够的 Free Memory,且没有过多的内存碎片,具体可以参考
这里。 显然过小的 shared pool 可用空间会导致 library cache object 被 aged out 换出共享池。
此外保证 SQL 语句绑定变量和游标可以共享也是很重要的因素。
Library Cache Activity DB/Inst: G10R25/G10R25 Snaps: 2964-2965
-> "Pct Misses" should be very low http://www.askmaclean.com
Get Pct Pin Pct Invali-
Namespace Requests Miss Requests Miss Reloads dations
上海 Oracle 用户组 -- SHOUG -- ShangHai Oracle Users Group http://www.shoug.info/
--------------- ------------ ------ -------------- ------ ---------- --------
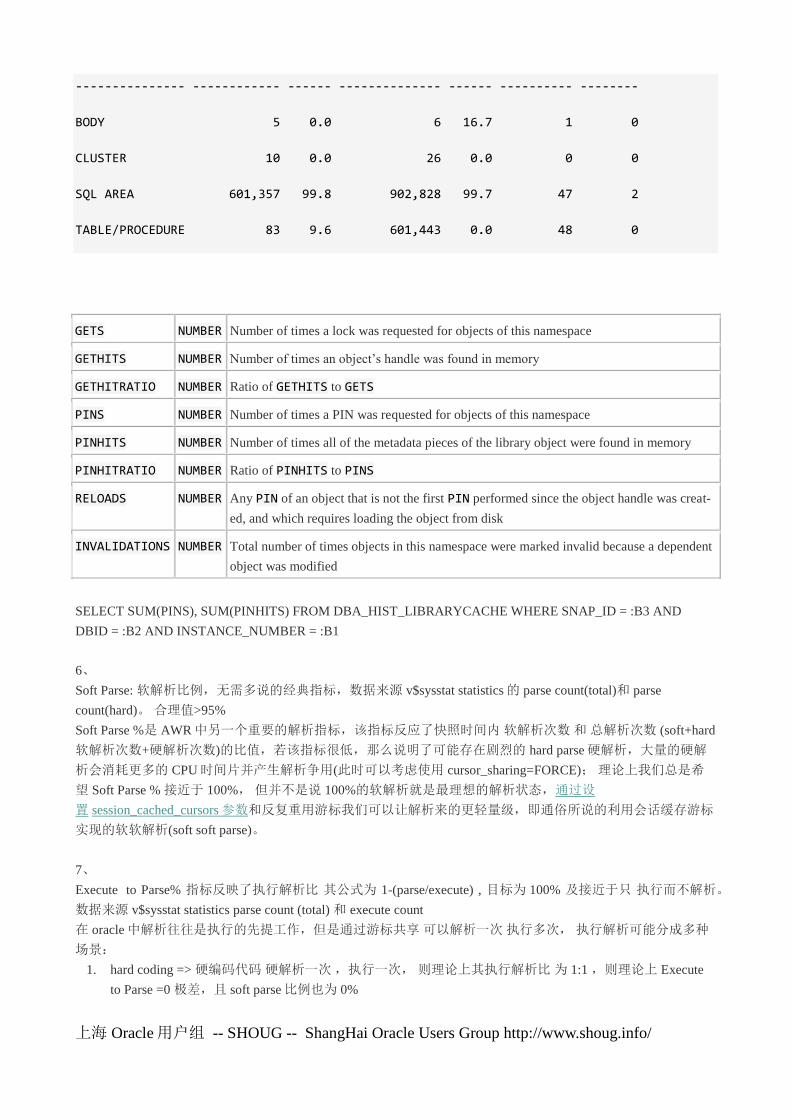
BODY 5 0.0 6 16.7 1 0
CLUSTER 10 0.0 26 0.0 0 0
SQL AREA 601,357 99.8 902,828 99.7 47 2
TABLE/PROCEDURE 83 9.6 601,443 0.0 48 0
GETS NUMBER Number of times a lock was requested for objects of this namespace
GETHITS NUMBER Number of times an object‘s handle was found in memory
GETHITRATIO NUMBER Ratio of GETHITS to GETS
PINS NUMBER Number of times a PIN was requested for objects of this namespace
PINHITS NUMBER Number of times all of the metadata pieces of the library object were found in memory
PINHITRATIO NUMBER Ratio of PINHITS to PINS
RELOADS NUMBER Any PIN of an object that is not the first PIN performed since the object handle was creat-
ed, and which requires loading the object from disk
INVALIDATIONS NUMBER Total number of times objects in this namespace were marked invalid because a dependent
object was modified
SELECT SUM(PINS), SUM(PINHITS) FROM DBA_HIST_LIBRARYCACHE WHERE SNAP_ID = :B3 AND
DBID = :B2 AND INSTANCE_NUMBER = :B1
6、
Soft Parse: 软解析比例,无需多说的经典指标,数据来源 v$sysstat statistics 的 parse count(total)和 parse
count(hard)。 合理值>95%
Soft Parse %是 AWR 中另一个重要的解析指标,该指标反应了快照时间内 软解析次数 和 总解析次数 (soft+hard
软解析次数+硬解析次数)的比值,若该指标很低,那么说明了可能存在剧烈的 hard parse 硬解析,大量的硬解
析会消耗更多的 CPU 时间片并产生解析争用(此时可以考虑使用 cursor_sharing=FORCE); 理论上我们总是希
望 Soft Parse % 接近于 100%, 但并不是说 100%的软解析就是最理想的解析状态,通过设
置 session_cached_cursors 参数和反复重用游标我们可以让解析来的更轻量级,即通俗所说的利用会话缓存游标
实现的软软解析(soft soft parse)。
7、
Execute to Parse% 指标反映了执行解析比 其公式为 1-(parse/execute) , 目标为 100% 及接近于只 执行而不解析。
数据来源 v$sysstat statistics parse count (total) 和 execute count
在 oracle 中解析往往是执行的先提工作,但是通过游标共享 可以解析一次 执行多次, 执行解析可能分成多种
场景:
1. hard coding => 硬编码代码 硬解析一次 ,执行一次, 则理论上其执行解析比 为 1:1 ,则理论上 Execute
to Parse =0 极差,且 soft parse 比例也为 0%

上海 Oracle 用户组 -- SHOUG -- ShangHai Oracle Users Group http://www.shoug.info/
2. 绑定变量但是仍软解析=》 软解析一次,执行一次 , 这种情况虽然比前一种好 但是执行解析比(这里的
parse,包含了软解析和硬解析)仍是 1:1, 理论上 Execute to Parse =0 极差, 但是 soft parse 比例可能很高
3. 使用 静态 SQL、动态绑定、session_cached_cursor、open cursors 等技术实现的 解析一次,执行多次, 执
行解析比为 N:1, 则 Execute to Parse= 1- (1/N) 执行次数越多 Execute to Parse 越接近 100% ,这种是我们
在 OLTP 环境中喜闻乐见的!
通俗地说 soft parse% 反映了软解析率, 而软解析在 oracle 中仍是较昂贵的操作, 我们希望的是解析 1 次执行
N 次,如果每次执行均需要软解析,那么虽然 soft parse%=100% 但是 parse time 仍可能是消耗 DB TIME 的大头。
Execute to Parse 反映了 执行解析比,Execute to Parse 和 soft parse% 都很低 那么说明确实没有绑定变量 , 而如
果 soft parse% 接近 99% 而 Execute to Parse 不足 90% 则说明没有执行解析比低, 需要通过 静态 SQL、动态绑
定、session_cached_cursor、open cursors 等技术减少软解析。
8、
Latch Hit%: willing-to-wait latch 闩申请不要等待的比例。 数据来源 V$latch gets 和 misses
Latch Name
----------------------------------------
Get Requests Misses Sleeps Spin Gets Sleep1 Sleep2 Sleep3
-------------- ----------- ----------- ---------- -------- -------- --------
shared pool
9,988,637 364 23 341 0 0 0
library cache
6,753,468 152 6 146 0 0 0
Memory Management Latch
369 1 1 0 0 0 0
qmn task queue latch
24 1 1 0 0 0 0
Latch Hit%:= (1 – (Sum(misses) / Sum(gets)))
关于 Latch 的更多信息内容可以参考 AWR 后面的专栏 Latch Statistics, 注意对于一个并发设计良好的 OLTP 应
用来说,Latch、Enqueue 等并发控制不应当成为系统的主要瓶颈, 同时对于这些并发争用而言 堆积硬件 CPU
和内存 很难有效改善性能。
SELECT SUM(GETS), SUM(MISSES) FROM DBA_HIST_LATCH WHERE SNAP_ID = :B3 AND DBID = :B2
AND INSTANCE_NUMBER = :B1
9、

上海 Oracle 用户组 -- SHOUG -- ShangHai Oracle Users Group http://www.shoug.info/
Parse CPU To Parse Elapsd:该指标反映了 快照内解析 CPU 时间和总的解析时间的比值(Parse CPU Time/ Parse
Elapsed Time); 若该指标水平很低,那么说明在整个解析过程中 实际在 CPU 上运算的时间是很短的,而主要
的解析时间都耗费在各种其他非空闲的等待事件上了(如 latch:shared pool,row cache lock 之类等) 数据来源
V$sysstat 的 parse time cpu 和 parse time elapsed
10、
%Non-Parse CPU 非解析 cpu 比例,公式为 (DB CPU – Parse CPU)/DB CPU, 若大多数 CPU 都用在解析上了,
则可能好钢没用在刃上了。 数据来源 v$sysstat 的 parse time cpu 和 cpu used by this session
1-4 Shared Pool Statistics
Shared Pool Statistics Begin End
------ ------
Memory Usage %: 84.64 79.67
% SQL with executions>1: 93.77 24.69
% Memory for SQL w/exec>1: 85.36 34.8
该环节提供一个大致的 SQL 重用及 shared pool 内存使用的评估。 应用是否共享 SQL? 有多少内存是给只运行
一次的 SQL 占掉的,对比共享 SQL 呢?
如果该环节中% SQL with executions>1 的 比例 小于%90 , 考虑用下面链接的 SQL 去抓 硬编码的非绑定变量
SQL 语句。
利用 FORCE_MATCHING_SIGNATURE 捕获非绑定变量 SQL
Memory Usage %: (shared pool 的实时大小- shared pool free memory)/ shared pool 的实时大小, 代表 shared
pool 的空间使用率,虽然有使用率但没有标明碎片程度
% SQL with executions>1 复用的 SQL 占总的 SQL 语句的比率,数据来源 DBA_HIST_SQL_SUMMARY 的
SINGLE_USE_SQL 和 TOTAL_SQL:1 – SINGLE_USE_SQL / TOTAL_SQL

上海 Oracle 用户组 -- SHOUG -- ShangHai Oracle Users Group http://www.shoug.info/
% Memory for SQL w/exec>1 执行 2 次以上的 SQL 所占内存占总的 SQL 内存的比率,数据来源
DBA_HIST_SQL_SUMMARY 的 SINGLE_USE_SQL_MEM 和 TOTAL_SQL_MEM:1 – SIN-
GLE_USE_SQL_MEM / TOTAL_SQL_MEM
==》上面 2 个指标也可以用来大致了解 shared pool 中的内存碎片程序,因为 SINGLE_USE_SQL 单次执行的
SQL 多的话,那么显然可能有较多的共享池内存碎片
SQL 复用率低的原因一般来说就是硬绑定变量(hard Coding)未合理使用绑定变量(bind variable),对于这种现象
短期无法修改代表使用绑定变量的可以 ALTER SYSTEM SET CURSOR_SHARING=FORCE; 来绕过问题,对
于长期来看还是要修改代码绑定变量。 Oracle 从 11g 开始宣称今后将废弃 CURSOR_SHARING 的 SIMILAR
选项,同时 SIMILAR 选项本身也造成了很多问题,所以一律不推荐用 CURSOR_SHARING=SIMILAR。
如果 memory usage%比率一直很高,则可以关注下后面 sga breakdown 中的 shared pool free memory 大小,一般
推荐至少让 free memroy 有个 300~500MB 以避免隐患。
1-5 Top 5 Timed Events
Top 5 Timed Events Avg %Total
~~~~~~~~~~~~~~~~~~ wait Call
Event Waits Time (s) (ms) Time Wait Class
------------------------------ ------------ ----------- ------ ------ ----------
gc buffer busy 79,083 73,024 923 65.4 Cluster
enq: TX - row lock contention 35,068 17,123 488 15.3 Applicatio
CPU time 12,205 10.9
gc current request 2,714 3,315 1221 3.0 Cluster
gc cr multi block request 83,666 1,008 12 0.9 Cluster
基于 Wait Interface 的调优是目前的主流!每个指标都重要!
基于命中比例的调优,好比是统计局的报告, 张财主家财产 100 万,李木匠家财产 1 万, 平均财产 50.5 万。
基于等待事件的调优,好比马路上 100 辆汽车的行驶记录表,上车用了几分钟, 红灯等了几分钟,拥堵塞了
几分钟。。。
丰富的等待事件以足够的细节来描绘系统运行的性能瓶颈,这是 Mysql 梦寐以求的东西……
Waits : 该等待事件发生的次数, 对于 DB CPU 此项不可用

上海 Oracle 用户组 -- SHOUG -- ShangHai Oracle Users Group http://www.shoug.info/
Times : 该等待事件消耗的总计时间,单位为秒, 对于 DB CPU 而言是前台进程所消耗 CPU 时间片的总和,但
不包括 Wait on CPU QUEUE
Avg Wait(ms) : 该等待事件平均等待的时间, 实际就是 Times/Waits,单位 ms, 对于 DB CPU 此项不可用
% Total Call Time, 该等待事件占总的 call time 的比率
total call time = total CPU time + total wait time for non-idle events
% Total Call Time = time for each timed event / total call time
Wait Class: 等待类型:
Concurrency,System I/O,User
I/O,Administrative,Other,Configuration,Scheduler,Cluster,Application,Idle,Network,Commit
CPU 上在干什么?
逻辑读? 解析?Latch spin? PL/SQL、函数运算?
DB CPU/CPU time 是 Top 1 是好事情吗? 未必!
注意 DB CPU 不包含 wait on cpu queue!
SELECT e.event_name event,
e.total_waits - NVL (b.total_waits, 0) waits,
DECODE (
e.total_waits - NVL (b.total_waits, 0),
0, TO_NUMBER (NULL),
DECODE (
e.total_timeouts - NVL (b.total_timeouts, 0),
0, TO_NUMBER (NULL),
100
* (e.total_timeouts - NVL (b.total_timeouts, 0))
/ (e.total_waits - NVL (b.total_waits, 0))))
pctto,
(e.time_waited_micro - NVL (b.time_waited_micro, 0)) / 1000000 time,
DECODE (
(e.total_waits - NVL (b.total_waits, 0)),
0, TO_NUMBER (NULL),

上海 Oracle 用户组 -- SHOUG -- ShangHai Oracle Users Group http://www.shoug.info/
( (e.time_waited_micro - NVL (b.time_waited_micro, 0)) / 1000)
/ (e.total_waits - NVL (b.total_waits, 0)))
avgwt,
DECODE (e.wait_class, 'Idle', 99, 0) idle
FROM dba_hist_system_event b, dba_hist_system_event e
WHERE b.snap_id(+) = &bid
AND e.snap_id = &eid
--AND b.dbid(+) = :dbid
--AND e.dbid = :dbid
AND b.instance_number(+) = 1
AND e.instance_number = 1
AND b.event_id(+) = e.event_id
AND e.total_waits > NVL (b.total_waits, 0)
AND e.event_name NOT IN
('smon timer',
'pmon timer',
'dispatcher timer',
'dispatcher listen timer',
'rdbms ipc message')
ORDER BY idle,
time DESC,
waits DESC,
event
几种常见的等待事件
=========================>

上海 Oracle 用户组 -- SHOUG -- ShangHai Oracle Users Group http://www.shoug.info/
db file scattered read, Avg wait time 应当小于 20ms 如果数据库执行全表扫描或者是全索引扫描会执行 Multi
block I/O ,此时等待物理 I/O 结束会出现此等待事件。一般会从应用程序(SQL),I/O 方面入手调整; 注意和
《Instance Activity Stats》中的 index fast full scans (full) 以及 table scans (long tables)集合起来一起看。
db file sequential read ,该等待事件 Avg wait time 平均单次等待时间应当小于 20ms
‖db file sequential read‖单块读等待是一种最为常见的物理 IO 等待事件,这里的 sequential 指的是将数据块读入
到相连的内存空间中(contiguous memory space),而不是指所读取的数据块是连续的。该 wait event 可能在以下
情景中发生:
http://www.askmaclean.com/archives/db-file-sequential-read-wait-event.html
latch free 其实是未获得 latch ,而进入 latch sleep,见《全面解析 9i 以后 Oracle Latch 闩锁原理》
enq:XX 队列锁等待,视乎不同的队列锁有不同的情况:
你有多了解 Oracle Enqueue lock 队列锁机制?
Oracle 队列锁: Enqueue HW
Oracle 队列锁 enq:US,Undo Segment
enq: TX – row lock/index contention、allocate ITL 等待事件
enq: TT – contention 等待事件
Oracle 队列锁 enq:TS,Temporary Segment (also TableSpace)
enq: JI – contention 等待事件
enq: US – contention 等待事件
enq: TM – contention 等待事件
enq: RO fast object reuse 等待事件
enq: HW – contention 等待事件
free buffer waits:是由于无法找到可用的 buffer cache 空闲区域,需要等待 DBWR 写入完成引起
一般是由于
低效的 sql
过小的 buffer cache
DBWR 工作负荷过量
buffer busy wait/ read by other session 一般以上 2 个等待事件可以归为一起处理,建议客户都进行监控 。 以上
等待时间可以由如下操作引起
select/select —- read by other session: 由于需要从 数据文件中将数据块读入 buffer cache 中引起,有可能是
大量的 逻辑/物理读 ;或者过小的 buffer cache 引起
select/update —- buffer busy waits/ read by other session 是由于更新某数据块后 需要在 undo 中 重建构建 过
去时间的块,有可能伴生 enq:cr-contention 是由于大量的物理读/逻辑读造成。

上海 Oracle 用户组 -- SHOUG -- ShangHai Oracle Users Group http://www.shoug.info/
update/update —- buffer busy waits 由于更新同一个数据块(非同一行,同一行是 enq:TX-contention) 此类
问题是热点块造成
insert/insert —- buffer busy waits 是由于 freelist 争用造成,可以将表空间更改为 ASSM 管理 或者加大
freelist 。
write complete waits :一般此类等待事件是由于 DBWR 将脏数据写入 数据文件,其他进程如果需要修改 buffer
cache 会引起此等待事件,一般是 I/O 性能问题或者是 DBWR 工作负荷过量引起
Wait time 1 Seconds.
control file parallel write:频繁的更新控制文件会造成大量此类等待事件,如日志频繁切换,检查点经常发生,
nologging 引起频繁的数据文件更改,I/O 系统性能缓慢。
log file sync:一般此类等待时间是由于 LGWR 进程讲 redo log buffer 写入 redo log 中发生。如果此类事件频繁
发生,可以判断为:
commit 次数是否过多
I/O 系统问题
重做日志是否不必要被创建
redo log buffer 是否过大
2-1 Time Model Statistics
Time Model Statistics DB/Inst: ITSCMP/itscmp2 Snaps: 70719-70723
-> Total time in database user-calls (DB Time): 883542.2s
-> Statistics including the word "background" measure background process
time, and so do not contribute to the DB time statistic
-> Ordered by % or DB time desc, Statistic name
Statistic Name Time (s) % of DB Time
------------------------------------------ ------------------ ------------
sql execute elapsed time 805,159.7 91.1
sequence load elapsed time 41,159.2 4.7
DB CPU 20,649.1 2.3

上海 Oracle 用户组 -- SHOUG -- ShangHai Oracle Users Group http://www.shoug.info/
parse time elapsed 1,112.8 .1
hard parse elapsed time 995.2 .1
hard parse (sharing criteria) elapsed time 237.3 .0
hard parse (bind mismatch) elapsed time 227.6 .0
connection management call elapsed time 29.7 .0
PL/SQL execution elapsed time 9.2 .0
PL/SQL compilation elapsed time 6.6 .0
failed parse elapsed time 2.0 .0
repeated bind elapsed time 0.4 .0
DB time 883,542.2
background elapsed time 25,439.0
background cpu time 1,980.9
-------------------------------------------------------------
Time Model Statistics 几个特别有用的时间指标:
parse time elapsed、hard parse elapsed time 结合起来看解析是否是主要矛盾,若是则重点是软解析还是硬
解析
sequence load elapsed time sequence 序列争用是否是问题焦点
PL/SQL compilation elapsed time PL/SQL 对象编译的耗时
注意 PL/SQL execution elapsed time 纯耗费在 PL/SQL 解释器上的时间。不包括花在执行和解析其包含
SQL 上的时间
connection management call elapsed time 建立数据库 session 连接和断开的耗时
failed parse elapsed time 解析失败,例如由于 ORA-4031
hard parse (sharing criteria) elapsed time 由于无法共享游标造成的硬解析
hard parse (bind mismatch) elapsed time 由于 bind type or bind size 不一致造成的硬解析
注意该时间模型中的指标存在包含关系所以 Time Model Statistics 加起来超过 100%再正常不过
1) background elapsed time
2) background cpu time
3) RMAN cpu time (backup/restore)

上海 Oracle 用户组 -- SHOUG -- ShangHai Oracle Users Group http://www.shoug.info/
1) DB time
2) DB CPU
2) connection management call elapsed time
2) sequence load elapsed time
2) sql execute elapsed time
2) parse time elapsed
3) hard parse elapsed time
4) hard parse (sharing criteria) elapsed time
5) hard parse (bind mismatch) elapsed time
3) failed parse elapsed time
4) failed parse (out of shared memory) elapsed time
2) PL/SQL execution elapsed time
2) inbound PL/SQL rpc elapsed time
2) PL/SQL compilation elapsed time
2) Java execution elapsed time
2) repeated bind elapsed time
2-2 Foreground Wait Class
Foreground Wait Class
-> s - second, ms - millisecond - 1000th of a second
-> ordered by wait time desc, waits desc
-> %Timeouts: value of 0 indicates value was < .5%. Value of null is truly 0
-> Captured Time accounts for 102.7% of Total DB time 883,542.21 (s)
-> Total FG Wait Time: 886,957.73 (s) DB CPU time: 20,649.06 (s)

上海 Oracle 用户组 -- SHOUG -- ShangHai Oracle Users Group http://www.shoug.info/
Avg
%Time Total Wait wait
Wait Class Waits -outs Time (s) (ms) %DB time
-------------------- ---------------- ----- ---------------- -------- ---------
Cluster 9,825,884 1 525,134 53 59.4
Concurrency 688,375 0 113,782 165 12.9
User I/O 34,405,042 0 76,695 2 8.7
Commit 172,193 0 62,776 365 7.1
Application 11,422 0 57,760 5057 6.5
Configuration 19,418 1 48,889 2518 5.5
DB CPU 20,649 2.3
Other 1,757,896 94 924 1 0.1
System I/O 30,165 0 598 20 0.1
Network 171,955,673 0 400 0 0.0
Administrative 2 100 0 101 0.0
-------------------------------------------------------------
select distinct wait_class from v$event_name;
WAIT_CLASS
----------------------------------------------------------------
Concurrency
User I/O
System I/O
Administrative

上海 Oracle 用户组 -- SHOUG -- ShangHai Oracle Users Group http://www.shoug.info/
Other
Configuration
Scheduler
Cluster
Application
Queueing
Idle
Network
Commit
Wait Class: 等待事件的类型,如上查询所示,被分作 12 个类型。 10.2.0.5 有 916 个等待事件,其中 Other
类型占 622 个。
Waits: 该类型所属等待事件在快照时间内的等待次数
%Time Out 等待超时的比率, 未 超时次数/waits * 100 (%)
Total Wait Time: 该类型所属等待事件总的耗时,单位为秒
Avg Wait(ms) : 该类型所属等待事件的平均单次等待时间,单位为 ms ,实际这个指标对 commit 和 user
i/o 以及 system i/o 类型有点意义,其他等待类型由于等待事件差异较大所以看平均值的意义较小
waits / txn: 该类型所属等待事件的等待次数和事务比
Other 类型,遇到该类型等待事件 的话 常见的原因是 Oracle Bug 或者 网络、I/O 存在问题, 一般推荐联系
Maclean。
Concurrency 类型 并行争用类型的等待事件, 典型的如 latch: shared pool、latch: library cache、row cache lock、
library cache pin/lock
Cluster 类型 为 Real Application Cluster RAC 环境中的等待事件, 需要注意的是 如果启用了 RAC option,那么
即使你的集群中只启动了一个实例,那么该实例也可能遇到 Cluster 类型的等待事件, 例如 gc buffer busy
System I/O 主要是后台进程维护数据库所产生的 I/O,例如 control file parallel write 、log file parallel write、db
file parallel write。
User I/O 主要是前台进程做了一些 I/O 操作,并不是说后台进程不会有这些等待事件。 典型的如 db file se-
quential/scattered read、direct path read
Configuration 由于配置引起的等待事件, 例如 日志切换的 log file switch completion (日志文件 大小/数目 不
够),sequence 的 enq: SQ – contention (Sequence 使用 nocache) ; Oracle 认为它们是由于配置不当引起的,但实
际未必真是这样的配置引起的。
Application 应用造成的等待事件, 例如 enq: TM – contention 和 enq: TX – row lock contention; Oracle 认为这
是由于应用设计不当造成的等待事件, 但实际这些 Application class 等待可能受到 Concurrency、Cluster、
System I/O 、User I/O 等多种类型等待的影响,例如本来 commit 只要 1ms ,则某一行数据仅被锁定 1ms, 但
由于 commit 变慢 从而释放行锁变慢,引发大量的 enq: TX – row lock contention 等待事件。
Commit 仅 log file sync ,log file sync 的影响十分广泛,值得我们深入讨论。

上海 Oracle 用户组 -- SHOUG -- ShangHai Oracle Users Group http://www.shoug.info/
Network : 网络类型的等待事件 例如 SQL*Net more data to client 、SQL*Net more data to dblink
Idle 空闲等待事件 ,最为常见的是 rdbms ipc message (等待实例内部的 ipc 通信才干活,即别人告知我有活干,
我才干,否则我休息==》Idle), SQL*Net message from client(等待 SQL*NET 传来信息,否则目前没事干)
2-3 前台等待事件
Foreground Wait Events Snaps: 70719-70723
-> s - second, ms - millisecond - 1000th of a second
-> Only events with Total Wait Time (s) >= .001 are shown
-> ordered by wait time desc, waits desc (idle events last)
-> %Timeouts: value of 0 indicates value was < .5%. Value of null is truly 0
Avg
%Time Total Wait wait Waits % DB
Event Waits -outs Time (s) (ms) /txn time
-------------------------- ------------ ----- ---------- ------- -------- ------
gc buffer busy acquire 3,274,352 3 303,088 93 13.3 34.3
gc buffer busy release 387,673 2 128,114 330 1.6 14.5
enq: TX - index contention 193,918 0 97,375 502 0.8 11.0
cell single block physical 30,738,730 0 63,606 2 124.8 7.2
log file sync 172,193 0 62,776 365 0.7 7.1
gc current block busy 146,154 0 53,027 363 0.6 6.0
enq: TM - contention 1,060 0 47,228 44555 0.0 5.3
enq: SQ - contention 17,431 0 35,683 2047 0.1 4.0
gc cr block busy 105,204 0 33,746 321 0.4 3.8
buffer busy waits 279,721 0 12,646 45 1.1 1.4
enq: HW - contention 1,201 3 12,192 10151 0.0 1.4

上海 Oracle 用户组 -- SHOUG -- ShangHai Oracle Users Group http://www.shoug.info/
enq: TX - row lock content 9,231 0 10,482 1135 0.0 1.2
cell multiblock physical r 247,903 0 6,547 26 1.0 .7
Foreground Wait Events 前台等待事件,数据主要来源于 DBA_HIST_SYSTEM_EVENT
Event 等待事件名字
Waits 该等待事件在快照时间内等待的次数
%Timeouts : 每一个等待事件有其超时的设置,例如 buffer busy waits 一般为 3 秒, Write Complete Waits 的
timeout 为 1 秒,如果等待事件 单次等待达到 timeout 的时间,则会进入下一次该等待事件
Total Wait Time 该等待事件 总的消耗的时间 ,单位为秒
Avg wait(ms): 该等待事件的单次平均等待时间,单位为毫秒
Waits/Txn: 该等待事件的等待次数和事务比
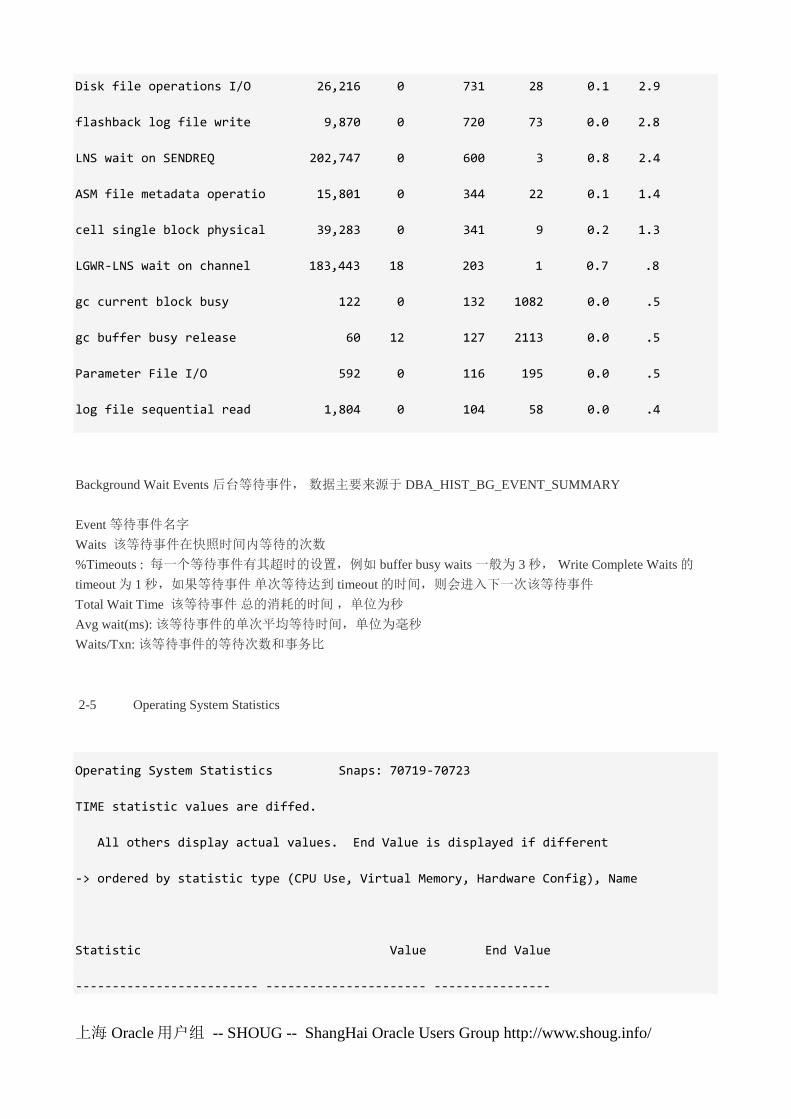
2-4 后台等待事件
Background Wait Events Snaps: 70719-70723
-> ordered by wait time desc, waits desc (idle events last)
-> Only events with Total Wait Time (s) >= .001 are shown
-> %Timeouts: value of 0 indicates value was < .5%. Value of null is truly 0
Avg
%Time Total Wait wait Waits % bg
Event Waits -outs Time (s) (ms) /txn time
-------------------------- ------------ ----- ---------- ------- -------- ------
db file parallel write 90,979 0 7,831 86 0.4 30.8
gcs log flush sync 4,756,076 6 4,714 1 19.3 18.5
enq: CF - contention 2,123 40 4,038 1902 0.0 15.9
control file sequential re 90,227 0 2,380 26 0.4 9.4
log file parallel write 108,383 0 1,723 16 0.4 6.8
control file parallel writ 4,812 0 988 205 0.0 3.9
上海 Oracle 用户组 -- SHOUG -- ShangHai Oracle Users Group http://www.shoug.info/
Disk file operations I/O 26,216 0 731 28 0.1 2.9
flashback log file write 9,870 0 720 73 0.0 2.8
LNS wait on SENDREQ 202,747 0 600 3 0.8 2.4
ASM file metadata operatio 15,801 0 344 22 0.1 1.4
cell single block physical 39,283 0 341 9 0.2 1.3
LGWR-LNS wait on channel 183,443 18 203 1 0.7 .8
gc current block busy 122 0 132 1082 0.0 .5
gc buffer busy release 60 12 127 2113 0.0 .5
Parameter File I/O 592 0 116 195 0.0 .5
log file sequential read 1,804 0 104 58 0.0 .4
Background Wait Events 后台等待事件, 数据主要来源于 DBA_HIST_BG_EVENT_SUMMARY
Event 等待事件名字
Waits 该等待事件在快照时间内等待的次数
%Timeouts : 每一个等待事件有其超时的设置,例如 buffer busy waits 一般为 3 秒, Write Complete Waits 的
timeout 为 1 秒,如果等待事件 单次等待达到 timeout 的时间,则会进入下一次该等待事件
Total Wait Time 该等待事件 总的消耗的时间 ,单位为秒
Avg wait(ms): 该等待事件的单次平均等待时间,单位为毫秒
Waits/Txn: 该等待事件的等待次数和事务比
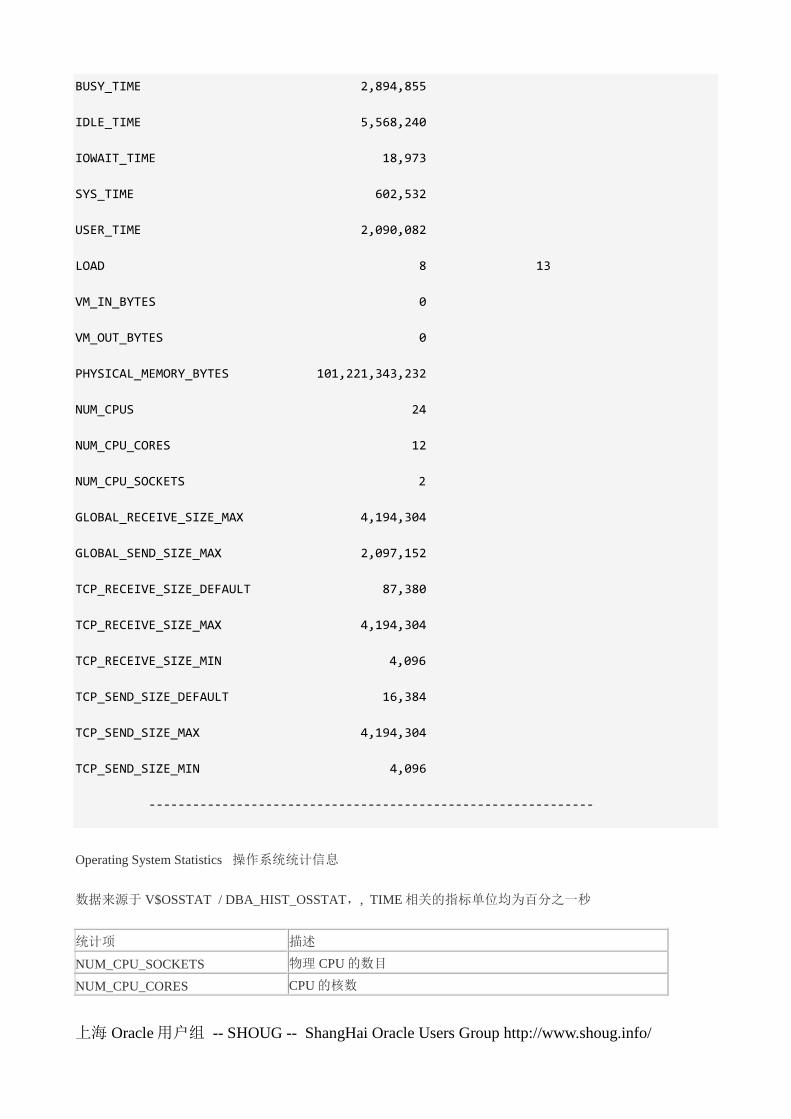
2-5 Operating System Statistics
Operating System Statistics Snaps: 70719-70723
TIME statistic values are diffed.
All others display actual values. End Value is displayed if different
-> ordered by statistic type (CPU Use, Virtual Memory, Hardware Config), Name
Statistic Value End Value
------------------------- ---------------------- ----------------
上海 Oracle 用户组 -- SHOUG -- ShangHai Oracle Users Group http://www.shoug.info/
BUSY_TIME 2,894,855
IDLE_TIME 5,568,240
IOWAIT_TIME 18,973
SYS_TIME 602,532
USER_TIME 2,090,082
LOAD 8 13
VM_IN_BYTES 0
VM_OUT_BYTES 0
PHYSICAL_MEMORY_BYTES 101,221,343,232
NUM_CPUS 24
NUM_CPU_CORES 12
NUM_CPU_SOCKETS 2
GLOBAL_RECEIVE_SIZE_MAX 4,194,304
GLOBAL_SEND_SIZE_MAX 2,097,152
TCP_RECEIVE_SIZE_DEFAULT 87,380
TCP_RECEIVE_SIZE_MAX 4,194,304
TCP_RECEIVE_SIZE_MIN 4,096
TCP_SEND_SIZE_DEFAULT 16,384
TCP_SEND_SIZE_MAX 4,194,304
TCP_SEND_SIZE_MIN 4,096
-------------------------------------------------------------
Operating System Statistics 操作系统统计信息
数据来源于 V$OSSTAT / DBA_HIST_OSSTAT,, TIME 相关的指标单位均为百分之一秒
统计项 描述
NUM_CPU_SOCKETS 物理 CPU 的数目
NUM_CPU_CORES CPU 的核数

上海 Oracle 用户组 -- SHOUG -- ShangHai Oracle Users Group http://www.shoug.info/
NUM_CPUS 逻辑 CPU 的数目
SYS_TIME 在内核态被消耗掉的 CPU 时间片,单位为百分之一秒
USER_TIME 在用户态被消耗掉的 CPU 时间片,单位为百分之一秒
BUSY_TIME Busy_Time=SYS_TIME+USER_TIME 消耗的 CPU 时间片,单位
为百分之一秒
AVG_BUSY_TIME AVG_BUSY_TIME= BUSY_TIME/NUM_CPUS
IDLE_TIME 空闲的 CPU 时间片,单位为百分之一秒
所有 CPU 所能提供总的时间片 BUSY_TIME + IDLE_TIME = ELAPSED_TIME * CPU_COUNT
OS_CPU_WAIT_TIME 进程等 OS 调度的时间,cpu queuing
VM_IN_BYTES 换入页的字节数
VM_OUT_BYTES
换出页的字节数,部分版本下并不准确,例如 Bug 11712010 Ab-
stract: VIRTUAL MEMORY PAGING ON 11.2.0.2 DATABASES,
仅供参考
IOWAIT_TIME 所有 CPU 花费在等待 I/O 完成上的时间 单位为百分之一秒
RSRC_MGR_CPU_WAIT_TIME
是指当 resource manager 控制 CPU 调度时,需要控制对应进程暂
时不使用 CPU 而进程到内部运行队列中,以保证该进程对应的
consumer group(消费组)没有消耗比指定 resource manager 指令更
多的 CPU。RSRC_MGR_CPU_WAIT_TIME 指等在内部运行队列
上的时间,在等待时不消耗 CPU
2-6 Service Statistcs
Service Statistics Snaps: 70719-70723
-> ordered by DB Time
Physical Logical
Service Name DB Time (s) DB CPU (s) Reads (K) Reads (K)
---------------------------- ------------ ------------ ------------ ------------
itms-contentmasterdb-prod 897,099 20,618 35,668 1,958,580
SYS$USERS 4,312 189 5,957 13,333
itmscmp 1,941 121 14,949 18,187
itscmp 331 20 114 218
上海 Oracle 用户组 -- SHOUG -- ShangHai Oracle Users Group http://www.shoug.info/
itscmp_dgmgrl 121 1 0 0
SYS$BACKGROUND 0 0 142 30,022
ITSCMP1_PR 0 0 0 0
its-reference-prod 0 0 0 0
itscmpXDB 0 0 0 0
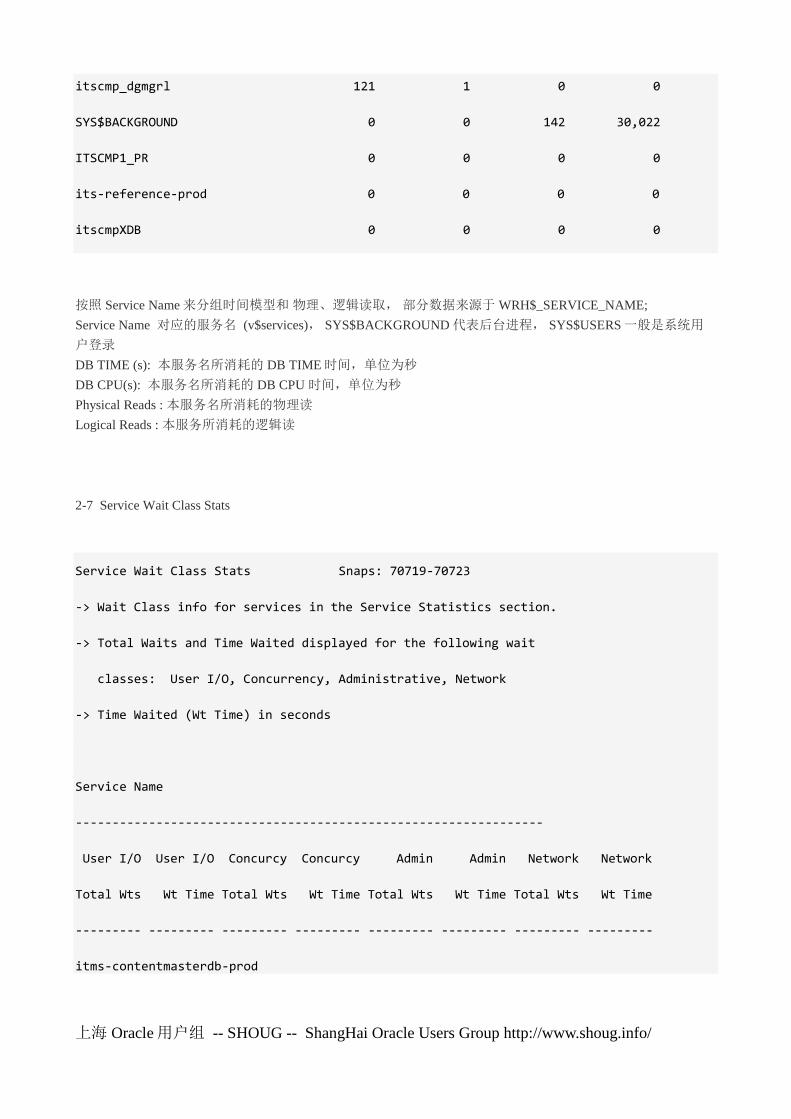
按照 Service Name 来分组时间模型和 物理、逻辑读取, 部分数据来源于 WRH$_SERVICE_NAME;
Service Name 对应的服务名 (v$services), SYS$BACKGROUND 代表后台进程, SYS$USERS 一般是系统用
户登录
DB TIME (s): 本服务名所消耗的 DB TIME 时间,单位为秒
DB CPU(s): 本服务名所消耗的 DB CPU 时间,单位为秒
Physical Reads : 本服务名所消耗的物理读
Logical Reads : 本服务所消耗的逻辑读
2-7 Service Wait Class Stats
Service Wait Class Stats Snaps: 70719-70723
-> Wait Class info for services in the Service Statistics section.
-> Total Waits and Time Waited displayed for the following wait
classes: User I/O, Concurrency, Administrative, Network
-> Time Waited (Wt Time) in seconds
Service Name
----------------------------------------------------------------
User I/O User I/O Concurcy Concurcy Admin Admin Network Network
Total Wts Wt Time Total Wts Wt Time Total Wts Wt Time Total Wts Wt Time
--------- --------- --------- --------- --------- --------- --------- ---------
itms-contentmasterdb-prod

上海 Oracle 用户组 -- SHOUG -- ShangHai Oracle Users Group http://www.shoug.info/
33321670 71443 678373 113759 0 0 1.718E+08 127
SYS$USERS
173233 3656 6738 30 2 0 72674 3
itmscmp
676773 1319 1831 0 0 0 2216 0
itscmp
219577 236 1093 0 0 0 18112 0
itscmp_dgmgrl
34 0 8 0 0 0 9 0
SYS$BACKGROUND
71940 1300 320677 56 0 0 442252 872
-------------------------------------------------------------
User I/O Total Wts : 对应该服务名下 用户 I/O 类等待的总的次数
User I/O Wt Time : 对应该服务名下 用户 I/O 累等待的总时间,单位为 1/100 秒
Concurcy Total Wts: 对应该服务名下 Concurrency 类型等待的总次数
Concurcy Wt Time :对应该服务名下 Concurrency 类型等待的总时间, 单位为 1/100 秒
Admin Total Wts: 对应该服务名下 Admin 类等待的总次数
Admin Wt Time: 对应该服务名下 Admin 类等待的总时间,单位为 1/100 秒
Network Total Wts : 对应服务名下 Network 类等待的总次数
Network Wt Time: 对应服务名下 Network 类等待的总事件, 单位为 1/100 秒
2-8 Host CPU
Host CPU (CPUs: 24 Cores: 12 Sockets: 2)
~~~~~~~~ Load Average
Begin End %User %System %WIO %Idle
--------- --------- --------- --------- --------- ---------
8.41 12.84 24.7 7.1 0.2 65.8
上海 Oracle 用户组 -- SHOUG -- ShangHai Oracle Users Group http://www.shoug.info/
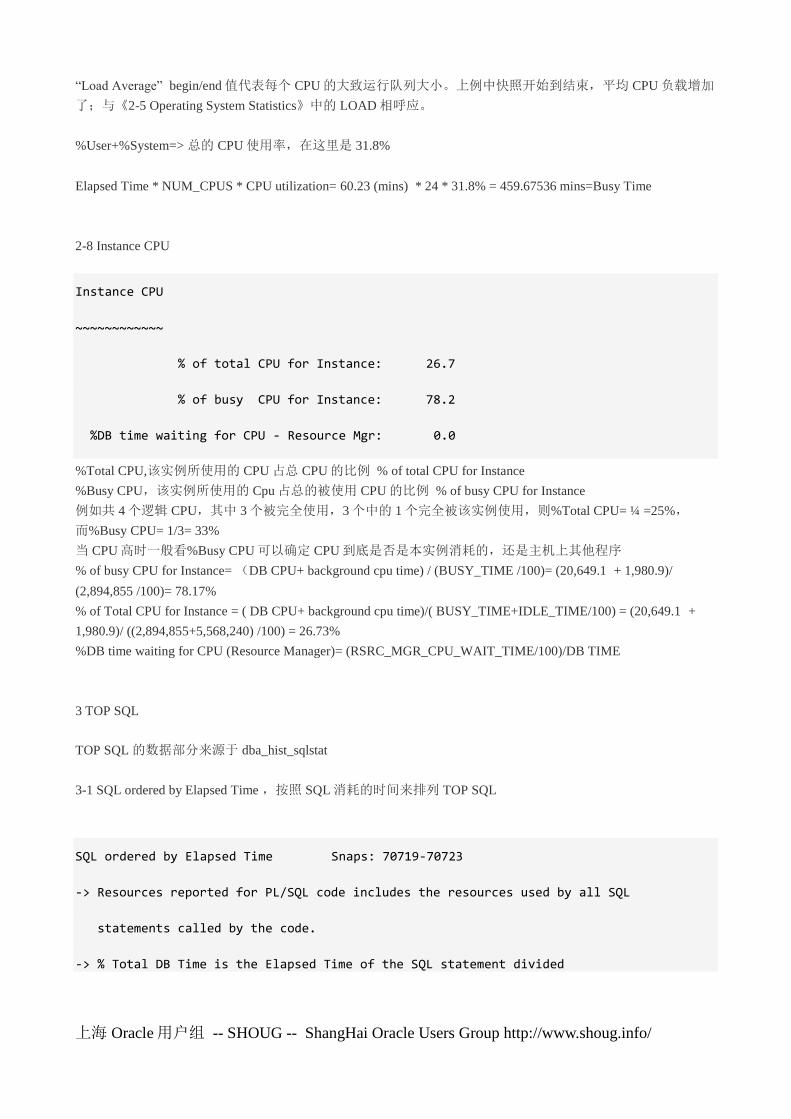
―Load Average‖ begin/end 值代表每个 CPU 的大致运行队列大小。上例中快照开始到结束,平均 CPU 负载增加
了;与《2-5 Operating System Statistics》中的 LOAD 相呼应。
%User+%System=> 总的 CPU 使用率,在这里是 31.8%
Elapsed Time * NUM_CPUS * CPU utilization= 60.23 (mins) * 24 * 31.8% = 459.67536 mins=Busy Time
2-8 Instance CPU
Instance CPU
~~~~~~~~~~~~
% of total CPU for Instance: 26.7
% of busy CPU for Instance: 78.2
%DB time waiting for CPU - Resource Mgr: 0.0
%Total CPU,该实例所使用的 CPU 占总 CPU 的比例 % of total CPU for Instance
%Busy CPU,该实例所使用的 Cpu 占总的被使用 CPU 的比例 % of busy CPU for Instance
例如共 4 个逻辑 CPU,其中 3 个被完全使用,3 个中的 1 个完全被该实例使用,则%Total CPU= ¼ =25%,
而%Busy CPU= 1/3= 33%
当 CPU 高时一般看%Busy CPU 可以确定 CPU 到底是否是本实例消耗的,还是主机上其他程序
% of busy CPU for Instance= (DB CPU+ background cpu time) / (BUSY_TIME /100)= (20,649.1 + 1,980.9)/
(2,894,855 /100)= 78.17%
% of Total CPU for Instance = ( DB CPU+ background cpu time)/( BUSY_TIME+IDLE_TIME/100) = (20,649.1 +
1,980.9)/ ((2,894,855+5,568,240) /100) = 26.73%
%DB time waiting for CPU (Resource Manager)= (RSRC_MGR_CPU_WAIT_TIME/100)/DB TIME
3 TOP SQL
TOP SQL 的数据部分来源于 dba_hist_sqlstat
3-1 SQL ordered by Elapsed Time ,按照 SQL 消耗的时间来排列 TOP SQL
SQL ordered by Elapsed Time Snaps: 70719-70723
-> Resources reported for PL/SQL code includes the resources used by all SQL
statements called by the code.
-> % Total DB Time is the Elapsed Time of the SQL statement divided
上海 Oracle 用户组 -- SHOUG -- ShangHai Oracle Users Group http://www.shoug.info/
into the Total Database Time multiplied by 100
-> %Total - Elapsed Time as a percentage of Total DB time
-> %CPU - CPU Time as a percentage of Elapsed Time
-> %IO - User I/O Time as a percentage of Elapsed Time
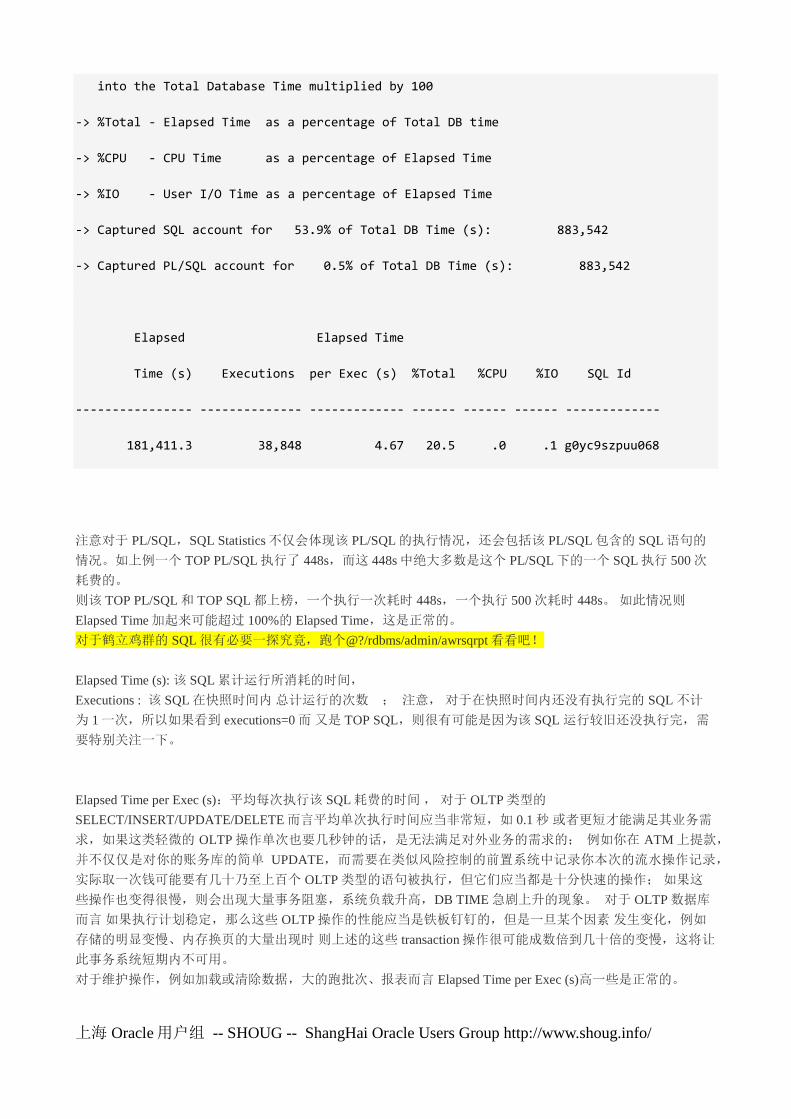
-> Captured SQL account for 53.9% of Total DB Time (s): 883,542
-> Captured PL/SQL account for 0.5% of Total DB Time (s): 883,542
Elapsed Elapsed Time
Time (s) Executions per Exec (s) %Total %CPU %IO SQL Id
---------------- -------------- ------------- ------ ------ ------ -------------
181,411.3 38,848 4.67 20.5 .0 .1 g0yc9szpuu068
注意对于 PL/SQL,SQL Statistics 不仅会体现该 PL/SQL 的执行情况,还会包括该 PL/SQL 包含的 SQL 语句的
情况。如上例一个 TOP PL/SQL 执行了 448s,而这 448s 中绝大多数是这个 PL/SQL 下的一个 SQL 执行 500 次
耗费的。
则该 TOP PL/SQL 和 TOP SQL 都上榜,一个执行一次耗时 448s,一个执行 500 次耗时 448s。 如此情况则
Elapsed Time 加起来可能超过 100%的 Elapsed Time,这是正常的。
对于鹤立鸡群的 SQL 很有必要一探究竟,跑个@?/rdbms/admin/awrsqrpt 看看吧!
Elapsed Time (s): 该 SQL 累计运行所消耗的时间,
Executions : 该 SQL 在快照时间内 总计运行的次数 ; 注意, 对于在快照时间内还没有执行完的 SQL 不计
为 1 一次,所以如果看到 executions=0 而 又是 TOP SQL,则很有可能是因为该 SQL 运行较旧还没执行完,需
要特别关注一下。
Elapsed Time per Exec (s):平均每次执行该 SQL 耗费的时间 , 对于 OLTP 类型的
SELECT/INSERT/UPDATE/DELETE 而言平均单次执行时间应当非常短,如 0.1 秒 或者更短才能满足其业务需
求,如果这类轻微的 OLTP 操作单次也要几秒钟的话,是无法满足对外业务的需求的; 例如你在 ATM 上提款,
并不仅仅是对你的账务库的简单 UPDATE,而需要在类似风险控制的前置系统中记录你本次的流水操作记录,
实际取一次钱可能要有几十乃至上百个 OLTP 类型的语句被执行,但它们应当都是十分快速的操作; 如果这
些操作也变得很慢,则会出现大量事务阻塞,系统负载升高,DB TIME 急剧上升的现象。 对于 OLTP 数据库
而言 如果执行计划稳定,那么这些 OLTP 操作的性能应当是铁板钉钉的,但是一旦某个因素 发生变化,例如
存储的明显变慢、内存换页的大量出现时 则上述的这些 transaction 操作很可能成数倍到几十倍的变慢,这将让
此事务系统短期内不可用。
对于维护操作,例如加载或清除数据,大的跑批次、报表而言 Elapsed Time per Exec (s)高一些是正常的。

上海 Oracle 用户组 -- SHOUG -- ShangHai Oracle Users Group http://www.shoug.info/
%Total 该 SQL 所消耗的时间占总的 DB Time 的百分比, 即 (SQL Elapsed Time / Total DB TIME)
% CPU 该 SQL 所消耗的 CPU 时间 占 该 SQL 消耗的时间里的比例, 即 (SQL CPU Time / SQL Elapsed Time) ,
该指标说明了该语句是否是 CPU 敏感的
%IO 该 SQL 所消耗的 I/O 时间 占 该 SQL 消耗的时间里的比例, 即(SQL I/O Time/SQL Elapsed Time) ,该指标
说明了该语句是否是 I/O 敏感的
SQL Id : 通过计算 SQL 文本获得的 SQL_ID ,不同的 SQL 文本必然有不同的 SQL_ID, 对于 10g~11g 而言 只
要 SQL 文本不变那么在数据库之间 该 SQL 对应的 SQL_ID 应当不不变的, 12c 中修改了 SQL_ID 的计算方法
Captured SQL account for 53.9% of Total DB Time (s) 对于不绑定变量的应用来说 Top SQL 有可能失准,所以要
参考本项
3-2 SQL ordered by CPU Time
SQL ordered by CPU Time Snaps: 70719-70723
-> Resources reported for PL/SQL code includes the resources used by all SQL
statements called by the code.
-> %Total - CPU Time as a percentage of Total DB CPU
-> %CPU - CPU Time as a percentage of Elapsed Time
-> %IO - User I/O Time as a percentage of Elapsed Time
-> Captured SQL account for 34.9% of Total CPU Time (s): 20,649
-> Captured PL/SQL account for 0.5% of Total CPU Time (s): 20,649
CPU CPU per Elapsed
Time (s) Executions Exec (s) %Total Time (s) %CPU %IO SQL Id
---------- ------------ ---------- ------ ---------- ------ ------ -------------
1,545.0 1,864,424 0.00 7.5 4,687.8 33.0 65.7 8g6a701j83c8q
Module: MZIndexer
SELECT t0.BOOLEAN_VALUE, t0.CLASS_CODE, t0.CREATED, t0.END_DATE, t0.PRODUCT_ATTR
IBUTE_ID, t0.LAST_MODIFIED, t0.OVERRIDE_FLAG, t0.PRICE, t0.PRODUCT_ATTRIBUTE_TYP
E_ID, t0.PRODUCT_ID, t0.PRODUCT_PUB_RELEASE_TYPE_ID, t0.PRODUCT_VOD_TYPE_ID, t0.

上海 Oracle 用户组 -- SHOUG -- ShangHai Oracle Users Group http://www.shoug.info/
SAP_PRODUCT_ID, t0.START_DATE, t0.STRING_VALUE FROM mz_product_attribute t0 WHER
CPU TIME : 该 SQL 在快照时间内累计执行所消耗的 CPU 时间片,单位为 s
Executions : 该 SQL 在快照时间内累计执行的次数
CPU per Exec (s) :该 SQL 平均单次执行所消耗的 CPU 时间 , 即 ( SQL CPU TIME / SQL Executions )
%Total : 该 SQL 累计消耗的 CPU 时间 占 该时段总的 DB CPU 的比例, 即 ( SQL CPU TIME / Total DB CPU)
% CPU 该 SQL 所消耗的 CPU 时间 占 该 SQL 消耗的时间里的比例, 即 (SQL CPU Time / SQL Elapsed Time) ,
该指标说明了该语句是否是 CPU 敏感的
%IO 该 SQL 所消耗的 I/O 时间 占 该 SQL 消耗的时间里的比例, 即(SQL I/O Time/SQL Elapsed Time) ,该指标
说明了该语句是否是 I/O 敏感的
3-3 Buffer Gets SQL ordered by Gets
SQL ordered by Gets DB/Inst: ITSCMP/itscmp2 Snaps: 70719-70723
-> Resources reported for PL/SQL code includes the resources used by all SQL
statements called by the code.
-> %Total - Buffer Gets as a percentage of Total Buffer Gets
-> %CPU - CPU Time as a percentage of Elapsed Time
-> %IO - User I/O Time as a percentage of Elapsed Time
-> Total Buffer Gets: 2,021,476,421
-> Captured SQL account for 68.2% of Total
Buffer Gets Elapsed
Gets Executions per Exec %Total Time (s) %CPU %IO SQL Id
----------- ----------- ------------ ------ ---------- ------ ------ -----------
4.61155E+08 1,864,424 247.3 22.8 4,687.8 33.0 65.7 8g6a701j83c
注意 buffer gets 逻辑读是消耗 CPU TIME 的重要源泉, 但并不是说消耗 CPU TIME 的只有 buffer gets。 大多数
情况下 SQL order by CPU TIME 和 SQL order by buffers gets 2 个部分的 TOP SQL 及其排列顺序都是一样的,此
种情况说明消耗最多 buffer gets 的 就是消耗最多 CPU 的 SQL ,如果我们希望降低系统的 CPU 使用率,那么
只需要调优 SQL 降低 buffer gets 即可。

上海 Oracle 用户组 -- SHOUG -- ShangHai Oracle Users Group http://www.shoug.info/
但也并不是 100%的情况都是如此, CPU TIME 的消耗者 还包括 函数运算、PL/SQL 控制、Latch /Mutex 的
Spin 等等, 所以 SQL order by CPU TIME 和 SQL order by buffers gets 2 个部分的 TOP SQL 完全不一样也是有
可能的, 需要因地制宜来探究到底是什么问题导致的 High CPU,进而裁度解决之道。
Buffer Gets : 该 SQL 在快照时间内累计运行所消耗的 buffer gets,包括了 consistent read 和 current read
Executions : 该 SQL 在快照时间内累计执行的次数
Gets per Exec : 该 SQL 平均单次的 buffer gets , 对于事务型 transaction 操作而言 一般该单次 buffer gets 小于
2000
% Total 该 SQL 累计运行所消耗的 buffer gets 占 总的 db buffer gets 的比率, (SQL buffer gets / DB total buffer
gets)
3-4 Physical Reads SQL ordered by Reads
SQL ordered by Reads DB/Inst: ITSCMP/itscmp2 Snaps: 70719-70723
-> %Total - Physical Reads as a percentage of Total Disk Reads
-> %CPU - CPU Time as a percentage of Elapsed Time
-> %IO - User I/O Time as a percentage of Elapsed Time
-> Total Disk Reads: 56,839,035
-> Captured SQL account for 34.0% of Total
Physical Reads Elapsed
Reads Executions per Exec %Total Time (s) %CPU %IO SQL Id
----------- ----------- ---------- ------ ---------- ------ ------ -------------
9,006,163 1 9.0062E+06 15.8 720.9 5.9 80.9 4g36tmp70h185
Physical reads : 该 SQL 累计运行所消耗的物理读
Executions : 该 SQL 在快照时间内累计执行的次数
Reads per Exec : 该 SQL 单次运行所消耗的物理读, (SQL Physical reads/Executions) , 对于 OLTP transaction
类型的操作而言单次一般不超过 100
%Total : 该 SQL 累计消耗的物理读 占 该时段总的 物理读的比例, 即 ( SQL physical read / Total DB physical
read )
3-5 Executions SQL ordered by Executions
上海 Oracle 用户组 -- SHOUG -- ShangHai Oracle Users Group http://www.shoug.info/
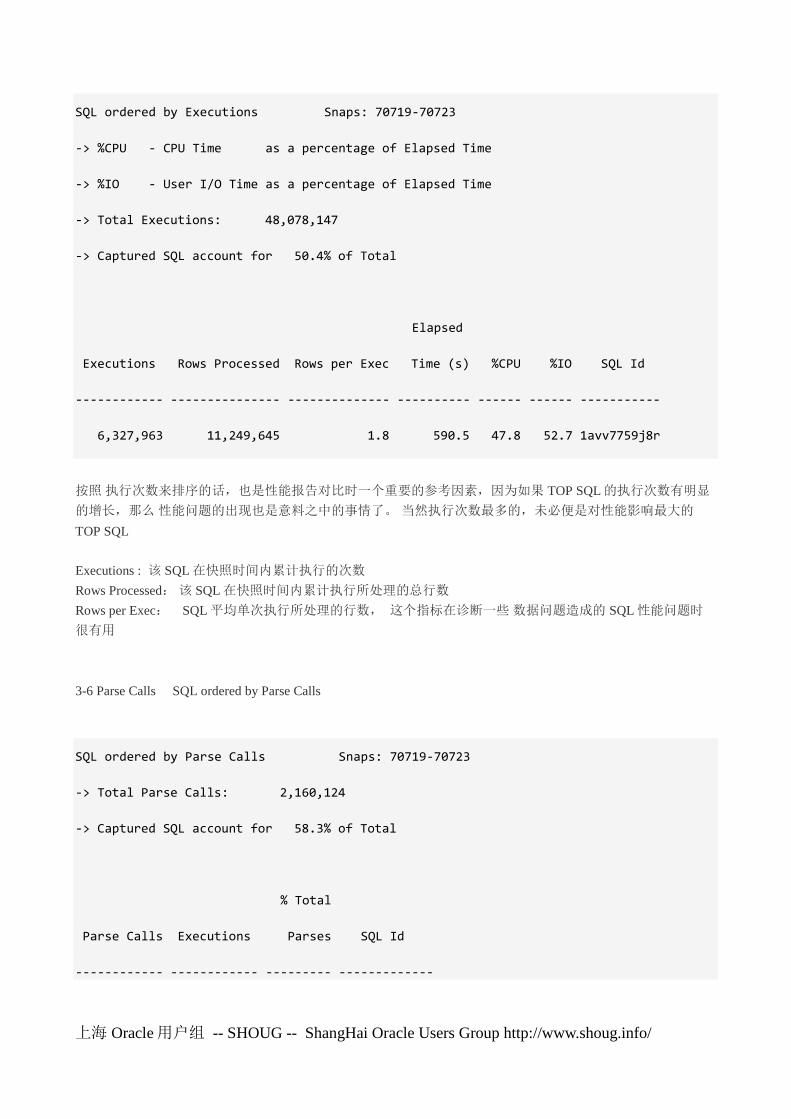
SQL ordered by Executions Snaps: 70719-70723
-> %CPU - CPU Time as a percentage of Elapsed Time
-> %IO - User I/O Time as a percentage of Elapsed Time
-> Total Executions: 48,078,147
-> Captured SQL account for 50.4% of Total
Elapsed
Executions Rows Processed Rows per Exec Time (s) %CPU %IO SQL Id
------------ --------------- -------------- ---------- ------ ------ -----------
6,327,963 11,249,645 1.8 590.5 47.8 52.7 1avv7759j8r
按照 执行次数来排序的话,也是性能报告对比时一个重要的参考因素,因为如果 TOP SQL 的执行次数有明显
的增长,那么 性能问题的出现也是意料之中的事情了。 当然执行次数最多的,未必便是对性能影响最大的
TOP SQL
Executions : 该 SQL 在快照时间内累计执行的次数
Rows Processed: 该 SQL 在快照时间内累计执行所处理的总行数
Rows per Exec: SQL 平均单次执行所处理的行数, 这个指标在诊断一些 数据问题造成的 SQL 性能问题时
很有用
3-6 Parse Calls SQL ordered by Parse Calls
SQL ordered by Parse Calls Snaps: 70719-70723
-> Total Parse Calls: 2,160,124
-> Captured SQL account for 58.3% of Total
% Total
Parse Calls Executions Parses SQL Id
------------ ------------ --------- -------------

上海 Oracle 用户组 -- SHOUG -- ShangHai Oracle Users Group http://www.shoug.info/
496,475 577,357 22.98 d07gaa3wntdff
Parse Calls : 解析调用次数, 与上文的 Load Profile 中的 Parse 数一样 包括 软解析 soft parse 和硬解析 hard parse
Executions : 该 SQL 在快照时间内累计执行的次数
%Total Parses : 本 SQL 解析调用次数 占 该时段数据库总解析次数的比率, 为 (SQL Parse Calls / Total DB Parse
Calls)
3-7 SQL ordered by Sharable Memory
SQL ordered by Sharable Memory Snaps: 70719-70723
-> Only Statements with Sharable Memory greater than 1048576 are displayed
Sharable Mem (b) Executions % Total SQL Id
---------------- ------------ -------- -------------
8,468,359 39 0.08 au89sasqfb2yn
Module: MZContentBridge
SELECT t0.ASPECT_RATIO, t0.CREATED, t0.FILE_EXTENSION, t0.HEIGHT, t0.VIDEO_FILE_
DIMENSIONS_ID, t0.LAST_MODIFIED, t0.NAME, t0.WIDTH FROM MZ_VIDEO_FILE_DIMENSIONS
t0 WHERE (t0.HEIGHT = :1 AND t0.WIDTH = :2 )
SQL ordered by Sharable Memory , 一般该部分仅列出 Sharable Mem (b)为 1 MB 以上的 SQL 对象 (Only State-
ments with Sharable Memory greater than 1048576 are displayed) 数据来源是
DBA_HIST_SQLSTAT.SHARABLE_MEM
Shareable Mem(b): SQL 对象所占用的共享内存使用量
Executions : 该 SQL 在快照时间内累计执行的次数
%Total : 该 SQL 对象锁占共享内存 占总的共享内存的比率
3-8 SQL ordered by Version Count
Version Count Oracle 中的执行计划可以是多版本的,即对于同一个 SQL 语句有多个不同版本的执行计划,这
些执行计划又称作子游标, 而一个 SQL 语句的文本可以称作一个父游标。 一个父游标对应多个子游标,产生

上海 Oracle 用户组 -- SHOUG -- ShangHai Oracle Users Group http://www.shoug.info/
不同子游标的原因是 SQL 在被执行时无法共享之前已经生成的子游标, 原因是多种多样的,例如 在本 session
中做了一个优化器参数的修改 例如 optimizer_index_cost_adj 从 100 修改到 99,则本 session 的优化环境
optimizer env 将不同于之前的子游标生成环境,这样就需要生成一个新的子游标,例如:
SQL> create table emp as select * from scott.emp;
Table created.
SQL> select * from emp where empno=1;
no rows selected
SQL> select /*+ MACLEAN */ * from emp where empno=1;
no rows selected
SQL> select SQL_ID,version_count from V$SQLAREA WHERE SQL_TEXT like '%MACLEAN%' and
SQL_TEXT not like '%like%';
SQL_ID VERSION_COUNT
------------- -------------
bxnnm7z1qmg26 1
SQL> select count(*) from v$SQL where SQL_ID='bxnnm7z1qmg26';
COUNT(*)
----------

上海 Oracle 用户组 -- SHOUG -- ShangHai Oracle Users Group http://www.shoug.info/
1
SQL> alter session set optimizer_index_cost_adj=99;
Session altered.
SQL> select /*+ MACLEAN */ * from emp where empno=1;
no rows selected
SQL> select SQL_ID,version_count from V$SQLAREA WHERE SQL_TEXT like '%MACLEAN%' and
SQL_TEXT not like '%like%';
SQL_ID VERSION_COUNT
------------- -------------
bxnnm7z1qmg26 2
SQL> select count(*) from v$SQL where SQL_ID='bxnnm7z1qmg26';
COUNT(*)
----------
2
SQL> select child_number ,OPTIMIZER_ENV_HASH_VALUE,PLAN_HASH_VALUE from v$SQL where
SQL_ID='bxnnm7z1qmg26';
CHILD_NUMBER OPTIMIZER_ENV_HASH_VALUE PLAN_HASH_VALUE
上海 Oracle 用户组 -- SHOUG -- ShangHai Oracle Users Group http://www.shoug.info/
------------ ------------------------ ---------------
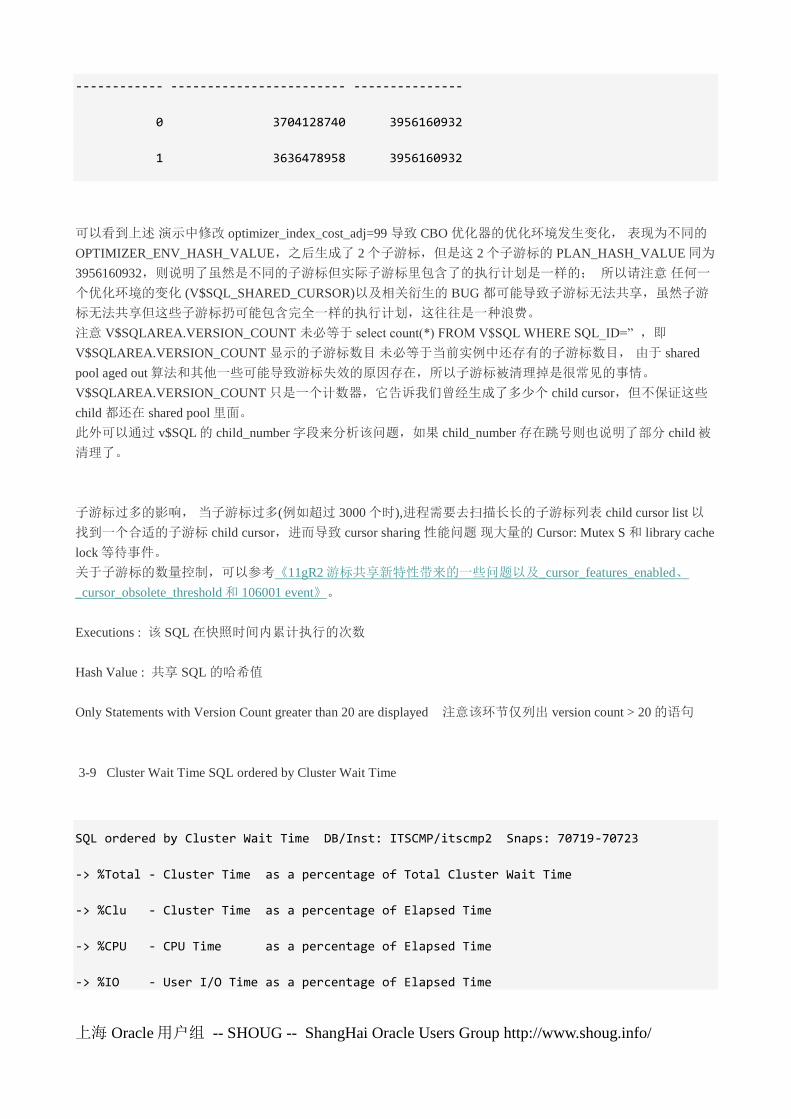
0 3704128740 3956160932
1 3636478958 3956160932
可以看到上述 演示中修改 optimizer_index_cost_adj=99 导致 CBO 优化器的优化环境发生变化, 表现为不同的
OPTIMIZER_ENV_HASH_VALUE,之后生成了 2 个子游标,但是这 2 个子游标的 PLAN_HASH_VALUE 同为
3956160932,则说明了虽然是不同的子游标但实际子游标里包含了的执行计划是一样的; 所以请注意 任何一
个优化环境的变化 (V$SQL_SHARED_CURSOR)以及相关衍生的 BUG 都可能导致子游标无法共享,虽然子游
标无法共享但这些子游标扔可能包含完全一样的执行计划,这往往是一种浪费。
注意 V$SQLAREA.VERSION_COUNT 未必等于 select count(*) FROM V$SQL WHERE SQL_ID=‖ ,即
V$SQLAREA.VERSION_COUNT 显示的子游标数目 未必等于当前实例中还存有的子游标数目, 由于 shared
pool aged out 算法和其他一些可能导致游标失效的原因存在,所以子游标被清理掉是很常见的事情。
V$SQLAREA.VERSION_COUNT 只是一个计数器,它告诉我们曾经生成了多少个 child cursor,但不保证这些
child 都还在 shared pool 里面。
此外可以通过 v$SQL 的 child_number 字段来分析该问题,如果 child_number 存在跳号则也说明了部分 child 被
清理了。
子游标过多的影响, 当子游标过多(例如超过 3000 个时),进程需要去扫描长长的子游标列表 child cursor list 以
找到一个合适的子游标 child cursor,进而导致 cursor sharing 性能问题 现大量的 Cursor: Mutex S 和 library cache
lock 等待事件。
关于子游标的数量控制,可以参考《11gR2 游标共享新特性带来的一些问题以及_cursor_features_enabled、
_cursor_obsolete_threshold 和 106001 event》。
Executions : 该 SQL 在快照时间内累计执行的次数
Hash Value : 共享 SQL 的哈希值
Only Statements with Version Count greater than 20 are displayed 注意该环节仅列出 version count > 20 的语句
3-9 Cluster Wait Time SQL ordered by Cluster Wait Time
SQL ordered by Cluster Wait Time DB/Inst: ITSCMP/itscmp2 Snaps: 70719-70723
-> %Total - Cluster Time as a percentage of Total Cluster Wait Time
-> %Clu - Cluster Time as a percentage of Elapsed Time
-> %CPU - CPU Time as a percentage of Elapsed Time
-> %IO - User I/O Time as a percentage of Elapsed Time

上海 Oracle 用户组 -- SHOUG -- ShangHai Oracle Users Group http://www.shoug.info/
-> Only SQL with Cluster Wait Time > .005 seconds is reported
-> Total Cluster Wait Time (s): 525,480
-> Captured SQL account for 57.2% of Total
Cluster Elapsed
Wait Time (s) Executions %Total Time(s) %Clu %CPU %IO SQL Id
-------------- ------------ ------ ---------- ------ ------ ------ -------------
132,639.3 38,848 25.2 181,411.3 73.1 .0 .1 g0yc9szpuu068
Only SQL with Cluster Wait Time > .005 seconds is reported 这个环节仅仅列出 Cluster Wait Time > 0.005 s 的 SQL
该环节的数据主要来源 于 DBA_HIST_SQLSTAT.CLWAIT_DELTA Delta value of cluster wait time
Cluster Wait Time : 该 SQL 语句累计执行过程中等待在集群等待上的时间,单位为秒, 你可以理解为 当一个
SQL 执行过程中遇到了 gc buffer busy、gc cr multi block request 之类的 Cluster 等待,则这些等待消耗的时间全
部算在 Cluster Wait Time 里。
Executions : 该 SQL 在快照时间内累计执行的次数
%Total: 该 SQL 所消耗的 Cluster Wait time 占 总的 Cluster Wait time 的比率, 为(SQL cluster wait time / DB total
cluster Wait Time)
%Clu: 该 SQL 所消耗的 Cluster Wait time 占该 SQL 总的耗时的比率,为(SQL cluster wait time / SQL elapsed
Time),该指标说明了该语句是否是集群等待敏感的
% CPU 该 SQL 所消耗的 CPU 时间 占 该 SQL 消耗的时间里的比例, 即 (SQL CPU Time / SQL Elapsed Time) ,
该指标说明了该语句是否是 CPU 敏感的
%IO 该 SQL 所消耗的 I/O 时间 占 该 SQL 消耗的时间里的比例, 即(SQL I/O Time/SQL Elapsed Time) ,该指标
说明了该语句是否是 I/O 敏感的
4 Instance Activity Stats
Instance Activity Stats DB/Inst: ITSCMP/itscmp2 Snaps: 70719-70723
-> Ordered by statistic name
Statistic Total per Second per Trans
-------------------------------- ------------------ -------------- -------------

上海 Oracle 用户组 -- SHOUG -- ShangHai Oracle Users Group http://www.shoug.info/
Batched IO (bound) vector count 450,449 124.6 1.8
Batched IO (full) vector count 5,485 1.5 0.0
Batched IO (space) vector count 1,467 0.4 0.0
Batched IO block miss count 4,119,070 1,139.7 16.7
Batched IO buffer defrag count 39,710 11.0 0.2
Batched IO double miss count 297,357 82.3 1.2
Batched IO same unit count 1,710,492 473.3 7.0
Batched IO single block count 329,521 91.2 1.3
Batched IO slow jump count 47,104 13.0 0.2
Batched IO vector block count 2,069,852 572.7 8.4
Batched IO vector read count 262,161 72.5 1.1
Block Cleanout Optim referenced 37,574 10.4 0.2
CCursor + sql area evicted 1,457 0.4 0.0
...............
Instance Activity Stats 的数据来自于 DBA_HIST_SYSSTAT,DBA_HIST_SYSSTAT 来自于 V$SYSSTAT。
这里每一个指标都代表一种数据库行为的活跃度,例如 redo size 是指生成 redo 的量,sorts (disk) 是指磁盘排序
的次数,table scans (direct read) 是指直接路径扫描表的次数。
虽然这些指标均只有 Total、per Second 每秒、 per Trans 每事务 三个维度,但对诊断问题十分有用。
我们来举几个例子:
1、 例如当 Top Event 中存在 direct path read 为 Top 等待事件, 则需要分清楚是对普通堆表的 direct read 还是由
于大量 LOB 读造成的 direct path read, 这个问题可以借助 table scans (direct read)、table scans (long tables)、
physical reads direct 、physical reads direct (lob) 、physical reads direct temporary 几个指标来分析, 假设 physi-
cal reads direct >> 远大于 physical reads direct (lob)+physical reads direct temporary , 且有较大的 table scans (di-
rect read)、table scans (long tables) (注意这 2 个指标代表的是 扫描表的次数 不同于上面的 phsical reads 的单位
为 块数*次数), 则说明了是 大表扫描引起的 direct path read。
2、 例如当 Top Event 中存在 enq Tx:index contention 等待事件, 则需要分析 root node splits 、branch node
splits 、leaf node 90-10 splits 、leaf node splits 、failed probes on index block rec 几个指标,具体可以见文档
《Oracle 索引块分裂 split 信息汇总》

上海 Oracle 用户组 -- SHOUG -- ShangHai Oracle Users Group http://www.shoug.info/
3、系统出现 IO 类型的等待事件为 TOp Five 例如 db file sequential/scattered read ,我们需要通过 AWR 来获得
系统 IO 吞吐量和 IOPS:
physical read bytes 主要是应用造成的物理读取(Total size in bytes of all disk reads by application activity (and not
other instance activity) only.) 而 physical read total bytes 则包括了 rman 备份恢复 和后台维护任务所涉及的物理读
字节数,所以我们在研究 IO 负载时一般参考 physical read total bytes;以下 4 对指标均存在上述的关系
physical read bytes physical read total bytes 物理读的吞吐量/秒
physical read IO requests physical read total IO requests 物理读的 IOPS
physical write bytes physical write total bytes 物理写的吞吐量/秒
physical write IO requests physical write total IO requests 物理写的 IOPS
总的物理吞吐量/秒=physical read total bytes+physical write total bytes
总的物理 IOPS= physical read total IO requests+ physical write total IO requests
IO 的主要指标 吞吐量、IOPS 和延迟 均可以从 AWR 中获得了, IO 延迟的信息可以从 User I/O 的 Wait Class
Avg Wait time 获得,也可以参考 11g 出现的 IOStat by Function summary
Instance Activity Stats 有大量的指标,但是对于这些指标的介绍 没有那一份文档有完整详尽的描述,即便在
Oracle 原厂内部要没有(或者是 Maclean 没找到),实际是开发人员要引入某一个 Activity Stats 是比较容易的,
并不像申请引入一个新后台进程那样麻烦,Oracle 对于新版本中新后台进程的引入有严格的要求,但 Activity
Stats 却很容易,往往一个 one-off patch 中就可以引入了,实际上 Activity Stats 在源代码层仅仅是一些计数器。‘
较为基础的 statistics,大家可以参考官方文档的 Statistics Descriptions 描述,地址在这里。
对于深入的指标 例如 ―Batched IO (space) vector count‖这种由于某些新特性被引入的,一般没有很详细的材料,
需要到源代码中去阅读相关模块才能总结其用途,对于这个工作一般原厂是很延迟去完成的,所以没有一个完
整的列表。 如果大家有对此的疑问,请去 t.askmaclean.com 发一个帖子提问。
Instance Activity Stats - Absolute Values Snaps: 7071
-> Statistics with absolute values (should not be diffed)
Statistic Begin Value End Value
-------------------------------- --------------- ---------------
session pga memory max 1.157882826E+12 1.154290304E+12
session cursor cache count 157,042,373 157,083,136
session uga memory 5.496429019E+14 5.496775467E+14
opened cursors current 268,916 265,694

上海 Oracle 用户组 -- SHOUG -- ShangHai Oracle Users Group http://www.shoug.info/
workarea memory allocated 827,704 837,487
logons current 2,609 2,613
session uga memory max 1.749481584E+13 1.749737418E+13
session pga memory 4.150306913E+11 4.150008177E+11
Instance Activity Stats – Absolute Values 是显示快照 起点 和终点的一些指标的绝对值
logon current 当前时间点的登录数
opened cursors current 当前打开的游标数
session cursor cache count 当前存在的 session 缓存游标数
Instance Activity Stats - Thread ActivityDB/Inst: G10R25/G10R25 Snaps: 3663-3
-> Statistics identified by '(derived)' come from sources other than SYSSTAT
Statistic Total per Hour
-------------------------------- ------------------ ---------
log switches (derived) 17 2,326.47
log switches (derived) 日志切换次数 , 见 《理想的在线重做日志切换时间是多长?》
5 IO 统计
5-1 Tablespace IO Stats 基于表空间分组的 IO 信息
Tablespace IO Stats DB/Inst: ITSCMP/itscmp2 Snaps: 70719-70723
-> ordered by IOs (Reads + Writes) desc

上海 Oracle 用户组 -- SHOUG -- ShangHai Oracle Users Group http://www.shoug.info/
Tablespace
------------------------------
Av Av Av Av Buffer Av Buf
Reads Reads/s Rd(ms) Blks/Rd Writes Writes/s Waits Wt(ms)
-------------- ------- ------- ------- ------------ -------- ---------- -------
DATA_TS
17,349,398 4,801 2.3 1.5 141,077 39 4,083,704 5.8
INDEX_TS
9,193,122 2,544 2.0 1.0 238,563 66 3,158,187 46.1
UNDOTBS1
1,582,659 438 0.7 1.0 2 0 12,431 69.0
reads : 指 该表空间上发生的物理读的次数(单位不是块,而是次数)
Av Reads/s : 指该表空间上平均每秒的物理读次数 (单位不是块,而是次数)
Av Rd(ms): 指该表空间上每次读的平均读取延迟
Av Blks/Rd: 指该表空间上平均每次读取的块数目,因为一次物理读可以读多个数据块;如果 Av Blks/Rd>>1 则
可能系统有较多 db file scattered read 可能是诊断 FULL TABLE SCAN 或 FAST FULL INDEX SCAN,需要关注
table scans (long tables) 和 index fast full scans (full) 2 个指标
Writes : 该表空间上发生的物理写的次数 ; 对于那些 Writes 总是等于 0 的表空间 不妨了解下是否数据为只读,
如果是可以通过 read only tablespace 来解决 RAC 中的一些性能问题。
Av Writes/s : 指该表空间上平均每秒的物理写次数
buffer Waits: 该表空间上发生 buffer busy waits 和 read by other session 的次数( 9i 中 buffer busy waits 包含了 read
by other session)。
Av Buf Wt(ms): 该表空间上发生 buffer Waits 的平均等待时间,单位为 ms
5-2 File I/O
File IO Stats Snaps: 70719-70723
-> ordered by Tablespace, File

上海 Oracle 用户组 -- SHOUG -- ShangHai Oracle Users Group http://www.shoug.info/
Tablespace Filename
------------------------ ----------------------------------------------------
Av Av Av Av Buffer Av Buf
Reads Reads/s Rd(ms) Blks/Rd Writes Writes/s Waits Wt(ms)
-------------- ------- ------- ------- ------------ -------- ---------- -------
AMG_ALBUM_IDX_TS +DATA/itscmp/plugged/data2/amg_album_idx_ts01.dbf
23,298 6 0.6 1.0 2 0 0 0.0
AMG_ALBUM_IDX_TS +DATA/itscmp/plugged/data3/amg_album_idx_ts02.dbf
3,003 1 0.6 1.0 2 0 0 0.0
Tablespace 表空间名
FileName 数据文件的路径
Reads: 该数据文件上累计发生过的物理读次数,不是块数
Av Reads/s: 该数据文件上平均每秒发生过的物理读次数,不是块数
Av Rd(ms): 该数据文件上平均每次物理读取的延迟,单位为 ms
Av Blks/Rd: 该数据文件上平均每次读取涉及到的块数,OLTP 环境该值接近 1
Writes : 该数据文件上累计发生过的物理写次数,不是块数
Av Writes/s: 该数据文件上平均每秒发生过的物理写次数,不是块数
buffer Waits: 该数据文件上发生 buffer busy waits 和 read by other session 的次数( 9i 中 buffer busy waits 包含了
read by other session)。
Av Buf Wt(ms): 该数据文件上发生 buffer Waits 的平均等待时间,单位为 ms
若某个表空间上有较高的 IO 负载,则有必要分析一下 是否其所属的数据文件上的 IO 较为均匀 还是存在倾斜,
是否需要结合存储特征来 将数据均衡分布到不同磁盘上的数据文件上,以优化 I/O
6 缓冲池统计 Buffer Pool Statistics
Buffer Pool Statistics Snaps: 70719-70723
-> Standard block size Pools D: default, K: keep, R: recycle
-> Default Pools for other block sizes: 2k, 4k, 8k, 16k, 32k

上海 Oracle 用户组 -- SHOUG -- ShangHai Oracle Users Group http://www.shoug.info/
Free Writ Buffer
Number of Pool Buffer Physical Physical Buff Comp Busy
P Buffers Hit% Gets Reads Writes Wait Wait Waits
--- ---------- ---- ------------ ------------ ----------- ------ ------ --------
16k 15,720 N/A 0 0 0 0 0 0
D 2,259,159 98 2.005084E+09 42,753,650 560,460 0 1 8.51E+06
该环节的数据主要来源于 WRH$_BUFFER_POOL_STATISTICS, 而 WRH$_BUFFER_POOL_STATISTICS 是
定期汇总 v$SYSSTAT 中的数据
P pool 池的名字 D: 默认的缓冲池 default buffer pool , K : Keep Pool , R: Recycle Pool ; 2k 4k 8k 16k 32k: 代表
各种非标准块大小的缓冲池
Number of buffers: 实际的 缓冲块数目, 约等于 池的大小 / 池的块大小
Pool Hit % : 该缓冲池的命中率
Buffer Gets: 对该缓冲池的中块的访问次数 包括 consistent gets 和 db block gets
Physical Reads: 该缓冲池 Buffer Cache 引起了多少物理读, 其实是 physical reads cache ,单位为 块数*次数
Physical Writes :该缓冲池中 Buffer cache 被写的物理写, 其实是 physical writes from cache, 单位为 块数*次
数
Free Buffer Waits: 等待空闲缓冲的次数, 可以看做该 buffer pool 发生 free buffer waits 等待的次数
Write Comp Wait: 等待 DBWR 写入脏 buffer 到磁盘的次数, 可以看做该 buffer pool 发生 write complete waits
等待的次数
Buffer Busy Waits: 该缓冲池发生 buffer busy wait 等待的次数
7-1 Checkpoint Activity 检查点与 Instance Recovery Stats 实例恢复
Checkpoint Activity Snaps: 70719-70723
-> Total Physical Writes: 590,563
Other Autotune Thread
MTTR Log Size Log Ckpt Settings Ckpt Ckpt
Writes Writes Writes Writes Writes Writes
----------- ----------- ----------- ----------- ----------- -----------
0 0 0 0 12,899 0

上海 Oracle 用户组 -- SHOUG -- ShangHai Oracle Users Group http://www.shoug.info/
-------------------------------------------------------------
Instance Recovery Stats Snaps: 70719-70723
-> B: Begin Snapshot, E: End Snapshot
Estd
Targt Estd Log Ckpt Log Ckpt Opt RAC
MTTR MTTR Recovery Actual Target Log Sz Timeout Interval Log Avail
(s) (s) Estd IOs RedoBlks RedoBlks RedoBlks RedoBlks RedoBlks Sz(M) Time
- ----- ----- -------- -------- -------- -------- -------- -------- ------ -----
B 0 6 12828 477505 1786971 5096034 1786971 N/A N/A 3
E 0 7 16990 586071 2314207 5096034 2314207 N/A N/A 3
-------------------------------------------------------------
该环节的数据来源于 WRH$_INSTANCE_RECOVERY
MTTR Writes : 为了满足 FAST_START_MTTR_TARGET 指定的 MTTR 值 而做出的物理写 WRITES_MTTR
Log Size Writes :由于最小的 redo log file 而做出的物理写 WRITES_LOGFILE_SIZE
Log Ckpt writes: 由于 LOG_CHECKPOINT_INTERVAL 和 LOG_CHECKPOINT_TIMEOUT 驱动的增量检查点
而做出的物理写 WRITES_LOG_CHECKPOINT_SETTINGS
Other Settings Writes :由于其他设置(例如 FAST_START_IO_TARGET)而引起的物理
写, WRITES_OTHER_SETTINGS
Autotune Ckpt Writes : 由于自动调优检查点而引起的物理写, WRITES_AUTOTUNE
Thread Ckpt Writes :由于 thread checkpoint 而引起的物理写,WRITES_FULL_THREAD_CKPT
B 代表 开始点, E 代表结尾
Targt MTTR (s) : 目标 MTTR (mean time to recover)意为有效恢复时间,单位为秒。 TARGET_MTTR 的计算基
于 给定的参数 FAST_START_MTTR_TARGET,而 TARGET_MTTR 作为内部使用。 实际在使用中 Target
MTTR 未必能和 FAST_START_MTTR_TARGET 一样。 如果 FAST_START_MTTR_TARGET 过小,那么
TARGET_MTTR 将是系统条件所允许的最小估算值; 如果 FAST_START_MTTR_TARGET 过大,则
TARGET_MTTR 以保守算法计算以获得完成恢复的最长估算时间。
estimated_mttr (s): 当前基于 脏 buffer 和重做日志块的数量,而评估出的有效恢复时间 。 它的估算告诉用户
以当下系统的负载若发生实例 crash,则需要多久时间来做 crash recovery 的前滚操作,之后才能打开数据库。
Recovery Estd IOs :实际是当前 buffer cache 中的脏块数量,一旦实例崩溃 这些脏块要被前滚
Actual RedoBlks : 当前实际需要恢复的 redo 重做块数量

上海 Oracle 用户组 -- SHOUG -- ShangHai Oracle Users Group http://www.shoug.info/
Target RedoBlks :是 Log Sz RedoBlks 、Log Ckpt Timeout RedoBlks、 Log Ckpt Interval RedoBlks 三者的最小
值
Log Sz RedoBlks : 代表 必须在 log file switch 日志切换之前完成的 checkpoint 中涉及到的 redo block,也叫 max
log lag; 数据来源 select LOGFILESZ from X$targetrba; select LOG_FILE_SIZE_REDO_BLKS from
v$instance_recovery;
Log Ckpt Timeout RedoBlks : 为了满足 LOG_CHECKPOINT_TIMEOUT 所需要处理的 redo block 数,lag for
checkpoint timeout ; 数据来源 select CT_LAG from x$targetrba;
Log Ckpt Interval RedoBlks :为了满足 LOG_CHECKPOINT_INTERVAL 所需要处理的 redo block 数, lag for
checkpoint interval; 数据来源 select CI_LAG from x$targetrba;
Opt Log Sz(M) : 基于 FAST_START_MTTR_TARGET 而估算出来的 redo logfile 的大小,单位为 MB 。 Oracle
官方推荐创建的重做日志大小至少大于这个估算值
Estd RAC Avail Time :指评估的 RAC 中节点失败后 集群从冻结到部分可用的时间, 这个指标仅在 RAC 中可
用,单位为秒。 ESTD_CLUSTER_AVAILABLE_TIME
7-2 Buffer Pool Advisory 缓冲池建议
Buffer Pool Advisory DB/Inst: ITSCMP/itscmp2 Snap: 70723
-> Only rows with estimated physical reads >0 are displayed
-> ordered by Block Size, Buffers For Estimate
Est
Phys Estimated Est
Size for Size Buffers Read Phys Reads Est Phys %DBtime
P Est (M) Factor (thousands) Factor (thousands) Read Time for Rds
--- -------- ------ ------------ ------ -------------- ------------ -------
D 1,920 .1 227 4.9 1,110,565,597 1 1.0E+09
D 3,840 .2 454 3.6 832,483,886 1 7.4E+08
D 5,760 .3 680 2.8 634,092,578 1 5.6E+08
D 7,680 .4 907 2.2 500,313,589 1 4.3E+08
D 9,600 .5 1,134 1.8 410,179,557 1 3.5E+08
D 11,520 .6 1,361 1.5 348,214,283 1 2.9E+08

上海 Oracle 用户组 -- SHOUG -- ShangHai Oracle Users Group http://www.shoug.info/
D 13,440 .7 1,588 1.3 304,658,441 1 2.5E+08
D 15,360 .8 1,814 1.2 273,119,808 1 2.2E+08
D 17,280 .9 2,041 1.1 249,352,943 1 2.0E+08
D 19,200 1.0 2,268 1.0 230,687,206 1 1.8E+08
D 19,456 1.0 2,298 1.0 228,664,269 1 1.8E+08
D 21,120 1.1 2,495 0.9 215,507,858 1 1.7E+08
D 23,040 1.2 2,722 0.9 202,816,787 1 1.6E+08
D 24,960 1.3 2,948 0.8 191,974,196 1 1.5E+08
D 26,880 1.4 3,175 0.8 182,542,765 1 1.4E+08
D 28,800 1.5 3,402 0.8 174,209,199 1 1.3E+08
D 30,720 1.6 3,629 0.7 166,751,631 1 1.2E+08
D 32,640 1.7 3,856 0.7 160,002,420 1 1.2E+08
D 34,560 1.8 4,082 0.7 153,827,351 1 1.1E+08
D 36,480 1.9 4,309 0.6 148,103,338 1 1.1E+08
D 38,400 2.0 4,536 0.6 142,699,866 1 1.0E+08
缓冲池的颗粒大小 可以参考 SELECT * FROM V$SGAINFO where name like(‗Granule%‘);
P 指 缓冲池的名字 可能包括 有 D default buffer pool , K Keep Pool , R recycle Pool
Size For Est(M): 指以该尺寸的 buffer pool 作为评估的对象,一般是 目前 current size 的 10% ~ 200%,以便了解
buffer pool 增大 ~减小 对物理读的影响
Size Factor : 尺寸因子, 只 对应 buffer pool 大小 对 当前设置的比例因子, 例如 current_size 是 100M , 则如
果评估值是 110M 那么 size Factor 就是 1.1
Buffers (thousands) :指这个 buffer pool 尺寸下的 buffer 数量, 要乘以 1000 才是实际值
Est Phys Read Factor :评估的物理读因子, 例如当前尺寸的 buffer pool 会引起 100 个物理读, 则别的尺寸
的 buffer pool 如果引起 120 个物理读, 那么 对应尺寸的 Est Phys Read Factor 就是 1.2
Estimated Phys Reads (thousands):评估的物理读数目, 要乘以 1000 才是实际值, 显然不同尺寸的 buffer
pool 对应不同的评估的物理读数目
Est Phys Read Time : 评估的物理读时间
Est %DBtime for Rds:评估的物理读占 DB TIME 的比率
我们 看 buffer pool advisory 一般有 2 个目的:
上海 Oracle 用户组 -- SHOUG -- ShangHai Oracle Users Group http://www.shoug.info/
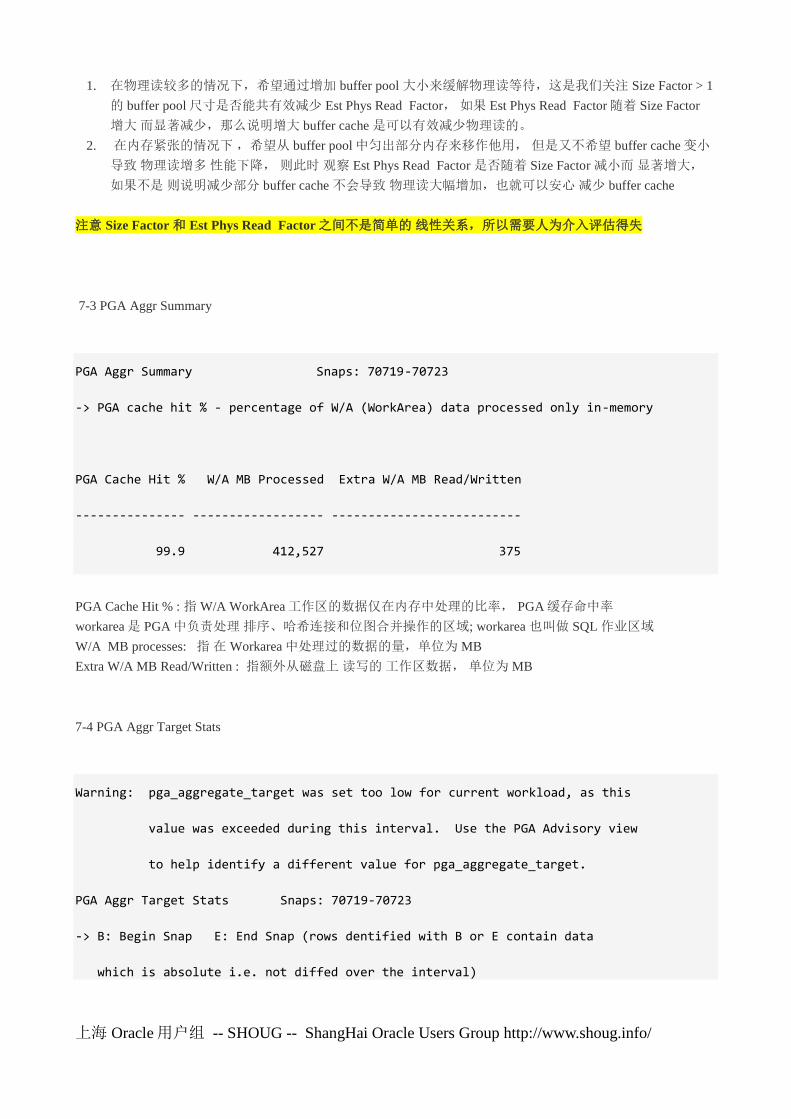
1. 在物理读较多的情况下,希望通过增加 buffer pool 大小来缓解物理读等待,这是我们关注 Size Factor > 1
的 buffer pool 尺寸是否能共有效减少 Est Phys Read Factor, 如果 Est Phys Read Factor 随着 Size Factor
增大 而显著减少,那么说明增大 buffer cache 是可以有效减少物理读的。
2. 在内存紧张的情况下 ,希望从 buffer pool 中匀出部分内存来移作他用, 但是又不希望 buffer cache 变小
导致 物理读增多 性能下降, 则此时 观察 Est Phys Read Factor 是否随着 Size Factor 减小而 显著增大,
如果不是 则说明减少部分 buffer cache 不会导致 物理读大幅增加,也就可以安心 减少 buffer cache
注意 Size Factor 和 Est Phys Read Factor 之间不是简单的 线性关系,所以需要人为介入评估得失
7-3 PGA Aggr Summary
PGA Aggr Summary Snaps: 70719-70723
-> PGA cache hit % - percentage of W/A (WorkArea) data processed only in-memory
PGA Cache Hit % W/A MB Processed Extra W/A MB Read/Written
--------------- ------------------ --------------------------
99.9 412,527 375
PGA Cache Hit % : 指 W/A WorkArea 工作区的数据仅在内存中处理的比率, PGA 缓存命中率
workarea 是 PGA 中负责处理 排序、哈希连接和位图合并操作的区域; workarea 也叫做 SQL 作业区域
W/A MB processes: 指 在 Workarea 中处理过的数据的量,单位为 MB
Extra W/A MB Read/Written : 指额外从磁盘上 读写的 工作区数据, 单位为 MB
7-4 PGA Aggr Target Stats
Warning: pga_aggregate_target was set too low for current workload, as this
value was exceeded during this interval. Use the PGA Advisory view
to help identify a different value for pga_aggregate_target.
PGA Aggr Target Stats Snaps: 70719-70723
-> B: Begin Snap E: End Snap (rows dentified with B or E contain data
which is absolute i.e. not diffed over the interval)

上海 Oracle 用户组 -- SHOUG -- ShangHai Oracle Users Group http://www.shoug.info/
-> Auto PGA Target - actual workarea memory target
-> W/A PGA Used - amount of memory used for all Workareas (manual + auto)
-> %PGA W/A Mem - percentage of PGA memory allocated to workareas
-> %Auto W/A Mem - percentage of workarea memory controlled by Auto Mem Mgmt
-> %Man W/A Mem - percentage of workarea memory under manual control
%PGA %Auto %Man
PGA Aggr Auto PGA PGA Mem W/A PGA W/A W/A W/A Global Mem
Target(M) Target(M) Alloc(M) Used(M) Mem Mem Mem Bound(K)
- ---------- ---------- ---------- ---------- ------ ------ ------ ----------
B 8,192 512 23,690.5 150.1 .6 100.0 .0 838,860
E 8,192 512 23,623.6 156.9 .7 100.0 .0 838,860
-------------------------------------------------------------
此环节的数据来源主要是 WRH$_PGASTAT
PGA Aggr Target(M) :本质上就是 pga_aggregate_target , 当然在 AMM(memory_target)环境下 这个值可能会
自动变化
Auto PGA Target(M) : 在自动 PGA 管理模式下 实际可用的工作区内存 ―aggregate PGA auto target ―, 因为
PGA 还有其他用途 ,不能全部作为 workarea memory
PGA Mem Alloc(M) :目前已分配的 PGA 内存, alloc 不等于 inuse 即分配的内存不等于在使用的内存,理
论上 PGA 会将确实不使用的内存返回给 OS(PGA memory freed back to OS) ,但是存在 PGA 占用大量内存而不
释放的场景
在上例中 pga_aggregate_target 仅为 8192M ,而实际 processes 在 2,615~ 8000 之间,如果一个进程耗费 5MB 的
PGA 也需要 10000M 的 PGA ,而实际这里 PGA Mem Alloc(M)是 23,690 M ,这说明 存在 PGA 的过载, 需要
调整 pga_aggregate_target
W/A PGA Used(M) :所有的工作区 workarea(包括 manual 和 auto)使用的内存总和量, 单位为 MB
%PGA W/A Mem: 分配给 workarea 的内存量占总的 PGA 的比例, (W/A PGA Used)/PGA Mem Alloc
%Auto W/A Mem : AUTO 自动工作区管理所控制的内存(workarea_size_policy=AUTO) 占总的 workarea 内存的
比例
%Man W/A Mem : MANUAL 手动工作区管理所控制的内存(workarea_size_policy=MANUAL)占总的 workarea
内存的比例
Global Mem Bound(K) : 指 在自动 PGA 管理模式下一个工作区所能分配的最大内存(注意 一个 SQL 执行过程中
可能有多个工作区 workarea)。 Global Mem Bound(K)这个指标在实例运行过程中将被持续性的修正,以反应数
据库当时工作区的负载情况。显然在有众多活跃工作区的系统负载下相应地 Global Mem Bound 将会下降。 但
应当保持 global bound 值不要小于 1 MB , 否则建议 调高 pga_aggregate_target

上海 Oracle 用户组 -- SHOUG -- ShangHai Oracle Users Group http://www.shoug.info/
7-5 PGA Aggr Target Histogram
PGA Aggr Target Histogram Snaps: 70719-70723
-> Optimal Executions are purely in-memory operations
Low High
Optimal Optimal Total Execs Optimal Execs 1-Pass Execs M-Pass Execs
------- ------- -------------- -------------- ------------ ------------
2K 4K 262,086 262,086 0 0
64K 128K 497 497 0 0
128K 256K 862 862 0 0
256K 512K 368 368 0 0
512K 1024K 440,585 440,585 0 0
1M 2M 68,313 68,313 0 0
2M 4M 169 161 8 0
4M 8M 50 42 8 0
8M 16M 82 82 0 0
16M 32M 1 1 0 0
32M 64M 12 12 0 0
128M 256M 2 0 2 0
-------------------------------------------------------------
数据来源:WRH$_SQL_WORKAREA_HISTOGRAM
Low Optimal: 此行所包含工作区 workarea 最适合内存要求的下限
High Optimal: 此行所包含工作区 workarea 最适合内存要求的上限
Total Execs: 在 Low Optimal~High Optimal 范围工作区内完成的总执行数

上海 Oracle 用户组 -- SHOUG -- ShangHai Oracle Users Group http://www.shoug.info/
Optimal execs: optimal 执行是指完全在 PGA 内存中完成的执行次数
1-pass Execs : 指操作过程中仅发生 1 次磁盘读取的执行次数
M-pass Execs: 指操作过程中发生了 1 次以上的磁盘读取, 频发磁盘读取的执行次数
7-6 PGA Memory Advisory
PGA Memory Advisory Snap: 70723
-> When using Auto Memory Mgmt, minimally choose a pga_aggregate_target value
where Estd PGA Overalloc Count is 0
Estd Extra Estd P Estd PGA
PGA Target Size W/A MB W/A MB Read/ Cache Overallo Estd
Est (MB) Factr Processed Written to Disk Hit % Count Time
---------- ------- ---------------- ---------------- ------ -------- -------
1,024 0.1 2,671,356,938.7 387,531,258.9 87.0 1.07E+07 7.9E+11
2,048 0.3 2,671,356,938.7 387,529,979.1 87.0 1.07E+07 7.9E+11
4,096 0.5 2,671,356,938.7 387,518,881.8 87.0 1.07E+07 7.9E+11
6,144 0.8 2,671,356,938.7 387,420,749.5 87.0 1.07E+07 7.9E+11
8,192 1.0 2,671,356,938.7 23,056,196.5 99.0 1.07E+07 6.9E+11
9,830 1.2 2,671,356,938.7 22,755,192.6 99.0 6.81E+06 6.9E+11
11,469 1.4 2,671,356,938.7 20,609,438.5 99.0 4.15E+06 6.9E+11
13,107 1.6 2,671,356,938.7 19,021,139.1 99.0 581,362 6.9E+11
14,746 1.8 2,671,356,938.7 18,601,191.0 99.0 543,531 6.9E+11
16,384 2.0 2,671,356,938.7 18,561,361.1 99.0 509,687 6.9E+11
24,576 3.0 2,671,356,938.7 18,527,422.3 99.0 232,817 6.9E+11
32,768 4.0 2,671,356,938.7 18,511,872.6 99.0 120,180 6.9E+11
49,152 6.0 2,671,356,938.7 18,500,815.3 99.0 8,021 6.9E+11

上海 Oracle 用户组 -- SHOUG -- ShangHai Oracle Users Group http://www.shoug.info/
65,536 8.0 2,671,356,938.7 18,498,733.0 99.0 0 6.9E+11
PGA Target Est (MB) 用以评估的 PGA_AGGREGATE _TARGET 值
Size Factr , 当前用以评估的 PGA_AGGREGATE _TARGET 和 当前实际设置的 PGA_AGGREGATE
_TARGET 之间的 比例因子 PGA Target Est / PGA_AGGREGATE_TARGE
W/A MB Processed :workarea 中要处理的数据量, 单位为 MB
Estd Extra W/A MB Read/ Written to Disk : 以 one-pass 、M-Pass 方式处理的数据量预估值, 单位为 MB
Estd P Cache Hit % : 预估的 PGA 缓存命中率
Estd PGA Overalloc Count: 预估的 PGA 过载量, 如上文所述 PGA_AGGREGATE _TARGET 仅是一个目标值,
无法真正限制 PGA 内存的使用,当出现 PGA 内存硬性需求时会产生 PGA overallocate 过载(When using Auto
Memory Mgmt, minimally choose a pga_aggregate_target value where Estd PGA Overalloc Count is 0)
7-7 Shared Pool Advisory
Shared Pool Advisory Snap: 70723
-> SP: Shared Pool Est LC: Estimated Library Cache Factr: Factor
-> Note there is often a 1:Many correlation between a single logical object
in the Library Cache, and the physical number of memory objects associated
with it. Therefore comparing the number of Lib Cache objects (e.g. in
v$librarycache), with the number of Lib Cache Memory Objects is invalid.
Est LC Est LC Est LC Est LC
Shared SP Est LC Time Time Load Load Est LC
Pool Size Size Est LC Saved Saved Time Time Mem Obj
Size(M) Factr (M) Mem Obj (s) Factr (s) Factr Hits (K)
-------- ----- -------- ------------ -------- ------ ------- ------ ------------
304 .8 56 3,987 7,728 1.0 61 1.4 332
352 .9 101 6,243 7,745 1.0 44 1.0 334
400 1.0 114 7,777 7,745 1.0 44 1.0 334

上海 Oracle 用户组 -- SHOUG -- ShangHai Oracle Users Group http://www.shoug.info/
448 1.1 114 7,777 7,745 1.0 44 1.0 334
496 1.2 114 7,777 7,745 1.0 44 1.0 334
544 1.4 114 7,777 7,745 1.0 44 1.0 334
592 1.5 114 7,777 7,745 1.0 44 1.0 334
640 1.6 114 7,777 7,745 1.0 44 1.0 334
688 1.7 114 7,777 7,745 1.0 44 1.0 334
736 1.8 114 7,777 7,745 1.0 44 1.0 334
784 2.0 114 7,777 7,745 1.0 44 1.0 334
832 2.1 114 7,777 7,745 1.0 44 1.0 334
-------------------------------------------------------------
Shared Pool Size(M) : 用以评估的 shared pool 共享池大小,在 AMM /ASMM 环境下 shared_pool 大小都可能浮
动
SP Size Factr :共享池大小的比例因子, (Shared Pool Size for Estim / SHARED_POOL_SIZE)
Estd LC Size(M) : 评估的 library cache 大小 ,单位为 MB , 因为是 shared pool 中包含 library cache 当然还有其
他例如 row cache
Est LC Mem Obj 指评估的指定大小的共享池内的 library cache memory object 的数
量 ESTD_LC_MEMORY_OBJECTS
Est LC Time Saved(s): 指在 指定的共享池大小情况下可找到需要的 library cache memory objects,从而节约的
解析时间 。 这些节约的解析时间也是 花费在共享池内重复加载需要的对象(reload),这些对象可能因为共享池
没有足够的 free memory 而被 aged out. ESTD_LC_TIME_SAVED
Est LC Time Saved Factr : Est LC Time Saved(s)的比例因子,( Est LC Time Saved(s)/ Current LC Time
Saved(s) ) ESTD_LC_TIME_SAVED_FACTOR
Est LC Load Time (s): 在指定的共享池大小情况下解析的耗时
Est LC Load Time Factr:Est LC Load Time (s)的比例因子, (Est LC Load Time (s)/ Current LC Load Time
(s)) ESTD_LC_LOAD_TIME_FACTOR
Est LC Mem Obj Hits (K) : 在指定的共享池大小情况下需要的 library cache memory object 正好在共享池中被找
到的次数 ESTD_LC_MEMORY_OBJECT_HITS;
对于想缩小 shared_pool_size 共享池大小的需求,可以关注 Est LC Mem Obj Hits (K) ,如上例中共享池为
352M 时 Est LC Mem Obj Hits (K) 就为 334 且之后不动,则可以考虑缩小 shared_pool_size 到该值,但要注意每
个版本/平台上对共享池的最低需求,包括 RAC 中 gcs resource 、gcs shadow等资源均驻留在 shared pool 中,增
大 db_cache_size 时要对应关注。
7-8 SGA Target Advisory

上海 Oracle 用户组 -- SHOUG -- ShangHai Oracle Users Group http://www.shoug.info/
SGA Target Advisory Snap: 70723
SGA Target SGA Size Est DB Est Physical
Size (M) Factor Time (s) Reads
---------- ---------- ------------ ----------------
3,752 0.1 1.697191E+09 1.4577142918E+12
7,504 0.3 1.222939E+09 832,293,601,354
11,256 0.4 1.000162E+09 538,390,923,784
15,008 0.5 895,087,191 399,888,743,900
18,760 0.6 840,062,594 327,287,716,803
22,512 0.8 806,389,685 282,881,041,331
26,264 0.9 782,971,706 251,988,446,808
30,016 1.0 765,293,424 228,664,652,276
33,768 1.1 751,135,535 210,005,616,650
37,520 1.3 739,350,016 194,387,820,900
41,272 1.4 733,533,785 187,299,216,679
45,024 1.5 732,921,550 187,299,216,679
48,776 1.6 732,691,962 187,299,216,679
52,528 1.8 732,538,908 187,299,216,679
56,280 1.9 732,538,917 187,299,216,679
60,032 2.0 732,462,391 187,299,458,716
-------------------------------------------------------------
该环节数据来源于 WRH$_SGA_TARGET_ADVICE
SGA target Size : 用以评估的 sga target 大小 (sga_target)
SGA Size Factor: SGA Size 的比例因子, (est SGA target Size / Current SGA target Size )
Est DB Time (s): 评估对应于该指定 sga target size 会产生多少量的 DB TIME,单位为秒
Est Physical Reads:评估对应该指定的 sga target size 会产生多少的物理读
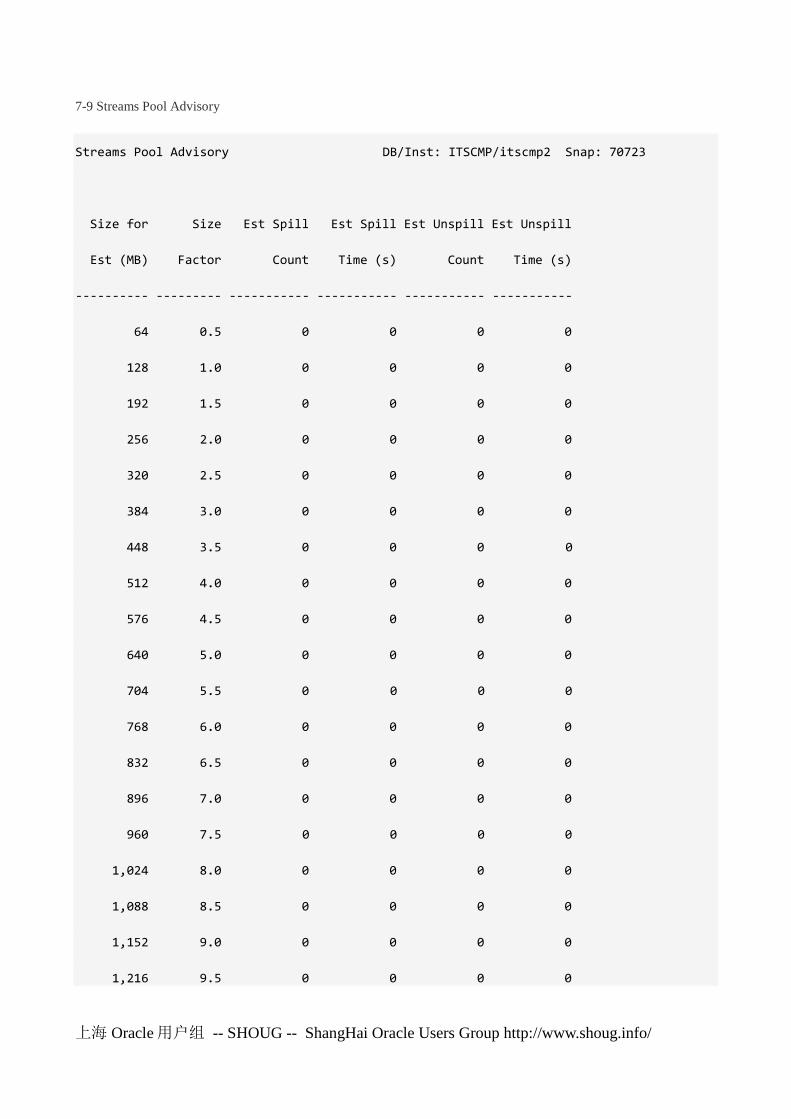
上海 Oracle 用户组 -- SHOUG -- ShangHai Oracle Users Group http://www.shoug.info/
7-9 Streams Pool Advisory
Streams Pool Advisory DB/Inst: ITSCMP/itscmp2 Snap: 70723
Size for Size Est Spill Est Spill Est Unspill Est Unspill
Est (MB) Factor Count Time (s) Count Time (s)
---------- --------- ----------- ----------- ----------- -----------
64 0.5 0 0 0 0
128 1.0 0 0 0 0
192 1.5 0 0 0 0
256 2.0 0 0 0 0
320 2.5 0 0 0 0
384 3.0 0 0 0 0
448 3.5 0 0 0 0
512 4.0 0 0 0 0
576 4.5 0 0 0 0
640 5.0 0 0 0 0
704 5.5 0 0 0 0
768 6.0 0 0 0 0
832 6.5 0 0 0 0
896 7.0 0 0 0 0
960 7.5 0 0 0 0
1,024 8.0 0 0 0 0
1,088 8.5 0 0 0 0
1,152 9.0 0 0 0 0
1,216 9.5 0 0 0 0

上海 Oracle 用户组 -- SHOUG -- ShangHai Oracle Users Group http://www.shoug.info/
1,280 10.0 0 0 0 0
该环节只有当使用了 Streams 流复制时才会有必要数据, 数据来源 WRH$_STREAMS_POOL_ADVICE
Size for Est (MB) : 用以评估的 streams pool 大小
Size Factor :streams pool 大小的比例因子
Est Spill Count :评估出的 当使用该大小的流池时 message 溢出到磁盘的数量 ESTD_SPILL_COUNT
Est Spill Time (s): 评估出的 当使用该大小的流池时 message 溢出到磁盘的耗时,单位为秒
ESTD_SPILL_TIME
Est Unspill Count:评估的 当使用该大小的流池时 message unspill 即从磁盘上读取的数量
ESTD_UNSPILL_COUNT
Est Unspill Time (s) : 评估的 当使用该大小的流池时 message unspill 即从磁盘上读取的耗时,单位为秒
ESTD_UNSPILL_TIME
7-10 Java Pool Advisory
java pool 的相关指标与 shared pool 相似,不再鏖述
8 Wait Statistics
8-1 Buffer Wait Statistics
Buffer Wait Statistics Snaps: 70719-70723
-> ordered by wait time desc, waits desc
Class Waits Total Wait Time (s) Avg Time (ms)
------------------ ----------- ------------------- --------------
data block 8,442,041 407,259 48
undo header 16,212 1,711 106
undo block 21,023 557 26
1st level bmb 1,038 266 256
2nd level bmb 540 185 342
bitmap block 90 25 276
segment header 197 13 66
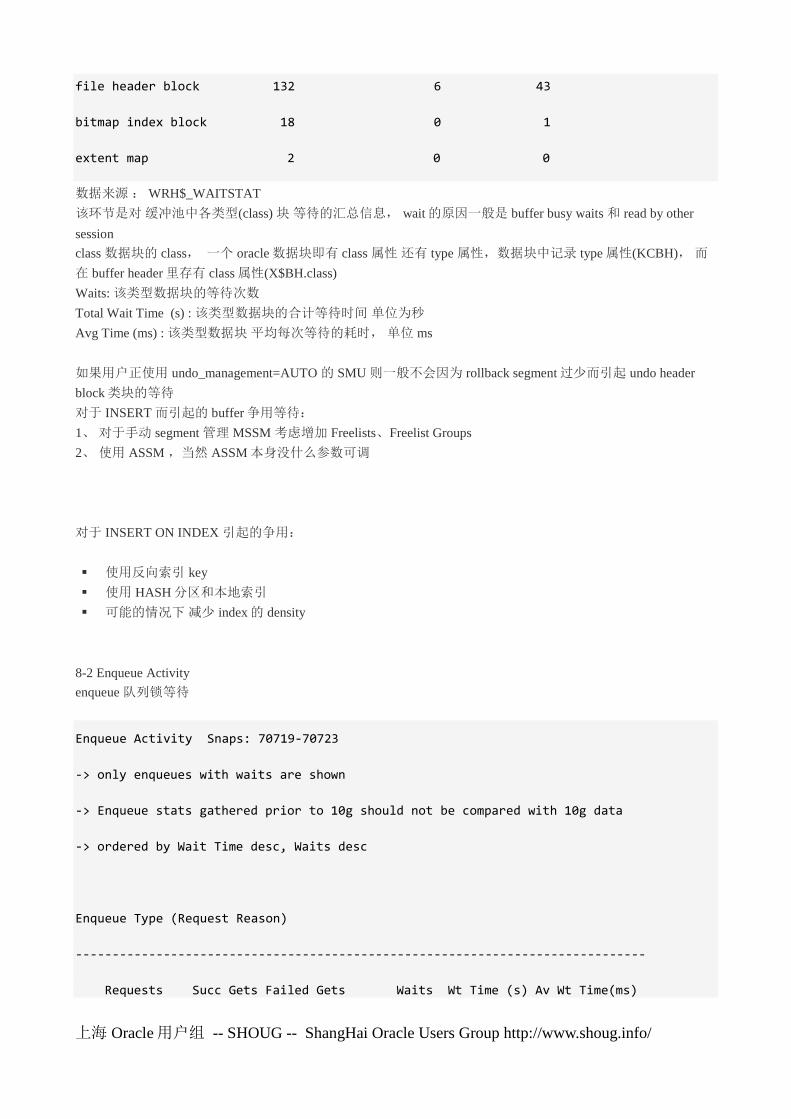
上海 Oracle 用户组 -- SHOUG -- ShangHai Oracle Users Group http://www.shoug.info/
file header block 132 6 43
bitmap index block 18 0 1
extent map 2 0 0
数据来源 : WRH$_WAITSTAT
该环节是对 缓冲池中各类型(class) 块 等待的汇总信息, wait 的原因一般是 buffer busy waits 和 read by other
session
class 数据块的 class, 一个 oracle 数据块即有 class 属性 还有 type 属性,数据块中记录 type 属性(KCBH), 而
在 buffer header 里存有 class 属性(X$BH.class)
Waits: 该类型数据块的等待次数
Total Wait Time (s) : 该类型数据块的合计等待时间 单位为秒
Avg Time (ms) : 该类型数据块 平均每次等待的耗时, 单位 ms
如果用户正使用 undo_management=AUTO 的 SMU 则一般不会因为 rollback segment 过少而引起 undo header
block 类块的等待
对于 INSERT 而引起的 buffer 争用等待:
1、 对于手动 segment 管理 MSSM 考虑增加 Freelists、Freelist Groups
2、 使用 ASSM ,当然 ASSM 本身没什么参数可调
对于 INSERT ON INDEX 引起的争用:
使用反向索引 key
使用 HASH 分区和本地索引
可能的情况下 减少 index 的 density
8-2 Enqueue Activity
enqueue 队列锁等待
Enqueue Activity Snaps: 70719-70723
-> only enqueues with waits are shown
-> Enqueue stats gathered prior to 10g should not be compared with 10g data
-> ordered by Wait Time desc, Waits desc
Enqueue Type (Request Reason)
------------------------------------------------------------------------------
Requests Succ Gets Failed Gets Waits Wt Time (s) Av Wt Time(ms)

上海 Oracle 用户组 -- SHOUG -- ShangHai Oracle Users Group http://www.shoug.info/
------------ ------------ ----------- ----------- ------------ --------------
TX-Transaction (index contention)
201,270 201,326 0 193,948 97,517 502.80
TM-DML
702,731 702,681 4 1,081 46,671 43,174.08
SQ-Sequence Cache
28,643 28,632 0 17,418 35,606 2,044.19
HW-Segment High Water Mark
9,210 8,845 376 1,216 12,505 10,283.85
TX-Transaction (row lock contention)
9,288 9,280 0 9,232 10,486 1,135.80
CF-Controlfile Transaction
15,851 14,094 1,756 2,798 4,565 1,631.64
TX-Transaction (allocate ITL entry)
471 369 102 360 169 469.28
Enqueue Type (Request Reason) enqueue 队列的类型,大家在研究 enqueue 问题前 至少搞清楚 enqueue type 和
enqueue mode , enqueue type 是队列锁所要保护的资源 如 TM 表锁 CF 控制文件锁, enqueue mode 是持有队
列锁的模式 (SS、SX 、S、SSX、X)
Requests : 申请对应的 enqueue type 资源或者队列转换(enqueue conversion 例如 S 转 SSX ) 的次数
Succ Gets :对应的 enqueue 被成功 申请或转换的次数
Failed Gets :对应的 enqueue 的申请 或者转换失败的次数
Waits :由对应的 enqueue 的申请或者转换而造成等待的次数
Wt Time (s) : 由对应的 enqueue 的申请或者转换而造成等待的等待时间
Av Wt Time(ms) :由对应的 enqueue 的申请或者转换而造成等待的平均等待时间 , Wt Time (s) / Waits ,单位为
ms
主要的 enqueue 等待事件:
enq: TX – row lock/index contention、allocate ITL 等待事件
enq: TM – contention 等待事件
Oracle 队列锁 enq:TS,Temporary Segment (also TableSpace)
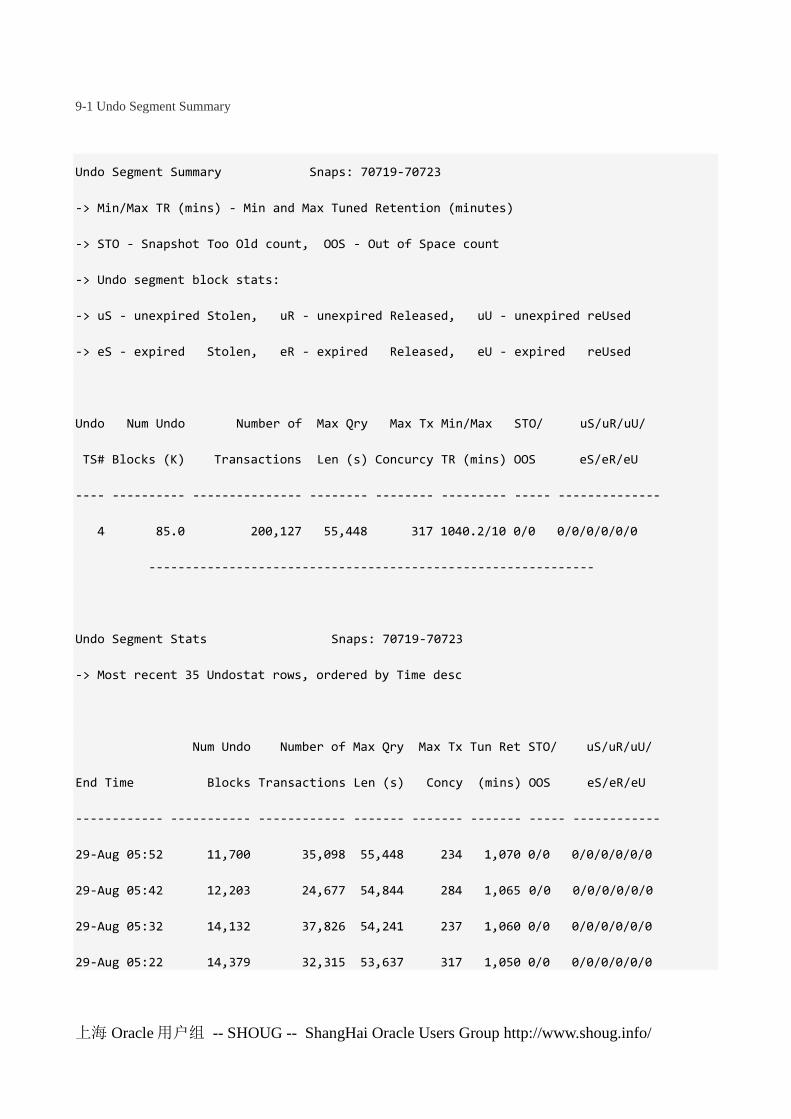
上海 Oracle 用户组 -- SHOUG -- ShangHai Oracle Users Group http://www.shoug.info/
9-1 Undo Segment Summary
Undo Segment Summary Snaps: 70719-70723
-> Min/Max TR (mins) - Min and Max Tuned Retention (minutes)
-> STO - Snapshot Too Old count, OOS - Out of Space count
-> Undo segment block stats:
-> uS - unexpired Stolen, uR - unexpired Released, uU - unexpired reUsed
-> eS - expired Stolen, eR - expired Released, eU - expired reUsed
Undo Num Undo Number of Max Qry Max Tx Min/Max STO/ uS/uR/uU/
TS# Blocks (K) Transactions Len (s) Concurcy TR (mins) OOS eS/eR/eU
---- ---------- --------------- -------- -------- --------- ----- --------------
4 85.0 200,127 55,448 317 1040.2/10 0/0 0/0/0/0/0/0
-------------------------------------------------------------
Undo Segment Stats Snaps: 70719-70723
-> Most recent 35 Undostat rows, ordered by Time desc
Num Undo Number of Max Qry Max Tx Tun Ret STO/ uS/uR/uU/
End Time Blocks Transactions Len (s) Concy (mins) OOS eS/eR/eU
------------ ----------- ------------ ------- ------- ------- ----- ------------
29-Aug 05:52 11,700 35,098 55,448 234 1,070 0/0 0/0/0/0/0/0
29-Aug 05:42 12,203 24,677 54,844 284 1,065 0/0 0/0/0/0/0/0
29-Aug 05:32 14,132 37,826 54,241 237 1,060 0/0 0/0/0/0/0/0
29-Aug 05:22 14,379 32,315 53,637 317 1,050 0/0 0/0/0/0/0/0

上海 Oracle 用户组 -- SHOUG -- ShangHai Oracle Users Group http://www.shoug.info/
29-Aug 05:12 15,693 34,157 53,033 299 1,045 0/0 0/0/0/0/0/0
29-Aug 05:02 16,878 36,054 52,428 250 1,040 0/0 0/0/0/0/0/0
数据来源: WRH$_UNDOSTAT , undo 相关的使用信息每 10 分钟刷新到 v$undostat 中
Undo Extent 有三种状态 active 、unexpired 、expired
active => extent 中 包括了活动的事务 ,active 的 undo extent 一般不允许被其他事务重用覆盖
unexpired => extent 中没有活动的事务,但相关 undo 记录从 inactive 到目前还未经过 undo retention(注意 auto
undo retention 的问题 因为这个特性 可能在观察 dba_undo_extents 时看到大部分 block 都是 unexpired,这是正常
的) 指定的时间,所以为 unexpired。 对于没有 guarantee retention 的 undo tablespace 而言,unexpired extent 可
能被 steal 为其他事物重用
expired => extent 中没有活动事务,且超过了 undo retention 的时间
Undo TS# 在使用的这个 undo 表空间的表空间号, 一个实例 同一时间只能用 1 个 undo tablespace , RAC 不同
节点可以用不同的 undo tablespace
Num Undo Blocks (K) 指被消费的 undo 数据块的数量, (K)代表要乘以 1000 才是实际值; 可以用该指标来评估
系统对 undo block 的消费量, 以便基于实际负载情况来评估 UNDO 表空间的大小
Number of Transactions 指该段时间内该 undo 表空间上执行过的事务 transaction 总量
Max Qry Len (s) 该时段内 持续最久的查询 时间, 单位为秒
Max Tx Concy 该时段内 最大的事务并发量
Min/Max TR (mins) 最小和最大的 tuned undo retention ,单位为分钟; tuned undo retention 是自动 undo 调优特
性,见 undo 自动调优介绍。
STO/ OOS STO 指 ORA-01555 Snapshot Too Old 错误出现的次数; OOS – 指 Out of Space count 错误出现的
次数
uS – unexpired Stolen 尝试从未过期的 undo extent 中偷取 undo space 的次数
uR – unexpired Released 从未过期的 undo extent 中释放的块数目
uU – unexpired reUsed 未过期的 undo extent 中的 block 被其他事务重用的 块数目
eS – expired Stolen 尝试从过期的 undo extent 中偷取 undo space 的次数
eR – expired Released 从过期的 undo extent 中释放的块数目
eU – expired reUsed 过期的 undo extent 中的 block 被其他事务重用的 块数目
UNXPSTEALCNT NUMBER Number of attempts to obtain undo space by stealing unexpired extents from other transac-
tions
UNXPBLKRELCNT NUMBER Number of unexpired blocks removed from certain undo segments so they can be used by
other transactions
UNXPBLKREUCNT NUMBER Number of unexpired undo blocks reused by transactions
EXPSTEALCNT NUMBER Number of attempts to steal expired undo blocks from other undo segments
EXPBLKRELCNT NUMBER Number of expired undo blocks stolen from other undo segments
EXPBLKREUCNT NUMBER Number of expired undo blocks reused within the same undo segments

上海 Oracle 用户组 -- SHOUG -- ShangHai Oracle Users Group http://www.shoug.info/
SSOLDERRCNT NUMBER Identifies the number of times the error ORA-01555 occurred. You can use this statistic to
decide whether or not the UNDO_RETENTION initialization parameter is set properly given
the size of the undo tablespace. Increasing the value of UNDO_RETENTION can reduce the
occurrence of this error.
10-1 Latch Activity
Latch Activity Snaps: 70719-70723
-> "Get Requests", "Pct Get Miss" and "Avg Slps/Miss" are statistics for
willing-to-wait latch get requests
-> "NoWait Requests", "Pct NoWait Miss" are for no-wait latch get requests
-> "Pct Misses" for both should be very close to 0.0
Pct Avg Wait Pct
Get Get Slps Time NoWait NoWait
Latch Name Requests Miss /Miss (s) Requests Miss
------------------------ -------------- ------ ------ ------ ------------ ------
AQ deq hash table latch 4 0.0 0 0 N/A
ASM Keyed state latch 9,048 0.1 0.2 0 0 N/A
ASM allocation 15,017 0.2 0.8 1 0 N/A
ASM db client latch 72,745 0.0 0 0 N/A
ASM map headers 5,860 0.6 0.6 1 0 N/A
ASM map load waiting lis 1,462 0.0 0 0 N/A
ASM map operation freeli 63,539 0.1 0.4 1 0 N/A
ASM map operation hash t 76,484,447 0.1 1.0 66 0 N/A
latch name Latch 闩的名字
Get Requests latch 被以 willing-to-wait 模式申请并获得的次数

上海 Oracle 用户组 -- SHOUG -- ShangHai Oracle Users Group http://www.shoug.info/
Pct Get Miss miss 是指 latch 被以 willing-to-wait 模式申请但是申请者必须等待的次数, Pct Get Miss =
Miss/Get Requests ; miss 可以从后面的 Latch Sleep Breakdown 获得
Avg Slps /Miss Sleep 是指 latch 被以 willing-to-wait 模式申请最终导致 session 需要 sleep 以等待该 latch 的次
数 ; Avg Slps /Miss = Sleeps/ Misses ; Sleeps 可以从后面的 Latch Sleep Breakdown 获得
Wait Time (s) 指花费在等待 latch 上的时间,单位为秒
NoWait Requests 指 latch 被以 no-wait 模式来申请的次数
Pct NoWait Miss 以 no-wait 模式来申请 latch 但直接失败的次数
对于高并发的 latch 例如 cache buffers chains,其 Pct Misses 应当十分接近于 0
一般的调优原则:
如果 latch : cache buffers chains 是 Top 5 事件,则需要考虑优化 SQL 减少 全表扫描 并减少 Top buffer gets SQL
语句的逻辑读
如果 latch : redo copy 、redo allocation 等待较多,则可以考虑增大 LOG_BUFFER
如果 latch:library cache 发生较多,则考虑增大 shared_pool_size
10-2 Latch Sleep Breakdown
Latch Sleep Breakdown DB/Inst: ITSCMP/itscmp2 Snaps: 70719-70723
-> ordered by misses desc
Get Spin
Latch Name Requests Misses Sleeps Gets
-------------------------- --------------- ------------ ----------- -----------
cache buffers chains 3,365,097,866 12,831,875 130,058 12,683,450
row cache objects 69,050,058 349,839 1,320 348,649
session idle bit 389,437,460 268,285 2,768 265,752
enqueue hash chains 8,698,453 239,880 22,476 219,950
ges resource hash list 8,388,730 158,894 70,728 91,104
gc element 100,383,385 135,759 6,285 129,742
gcs remastering latch 12,213,169 72,373 1 72,371
enqueues 4,662,545 46,374 259 46,155
ASM map operation hash tab 76,484,447 46,231 45,210 1,952

上海 Oracle 用户组 -- SHOUG -- ShangHai Oracle Users Group http://www.shoug.info/
Lsod array latch 72,598 24,224 24,577 1,519
latch name Latch 闩的名字
Get Requests latch 被以 willing-to-wait 模式申请并获得的次数
misses 是指 latch 被以 willing-to-wait 模式申请但是申请者必须等待的次数
9i 以后 miss 之后一般有 2 种情况 spin gets 了 或者 sleep 一睡不醒直到 被 post,具体见全面解析 9i 以后 Oracle
Latch 闩锁原理;
8i 以前的 latch 算法可以参考:Oracle Latch:一段描绘 Latch 运作的伪代码
所以一般来说 9i 以后的 misses= Sleeps+ Spin Gets ,虽然不是绝对如此
Sleeps 是指 latch 被以 willing-to-wait 模式申请最终导致 session 需要 sleep 以等待该 latch 的次数
Spin Gets 以 willing-to-wait 模式去申请 latch,在 miss 之后以 spin 方式获得了 latch 的次数
10-3 Latch Miss Sources
Latch Miss Sources Snaps: 70719-70723
-> only latches with sleeps are shown
-> ordered by name, sleeps desc
NoWait Waiter
Latch Name Where Misses Sleeps Sleeps
------------------------ -------------------------- ------- ---------- --------
ASM Keyed state latch kfksolGet 0 1 1
ASM allocation kfgpnSetDisks2 0 17 0
ASM allocation kfgpnClearDisks 0 5 0
ASM allocation kfgscCreate 0 4 0
ASM allocation kfgrpGetByName 0 1 26
ASM map headers kffmUnidentify_3 0 7 8
ASM map headers kffmAllocate 0 6 0
ASM map headers kffmIdentify 0 6 11

上海 Oracle 用户组 -- SHOUG -- ShangHai Oracle Users Group http://www.shoug.info/
ASM map headers kffmFree 0 1 0
ASM map operation freeli kffmTranslate2 0 15 8
ASM map operation hash t kffmUnidentify 0 44,677 36,784
ASM map operation hash t kffmTranslate 0 220 3,517
数据来源为 DBA_HIST_LATCH_MISSES_SUMMARY
latch name Latch 闩的名字
where : 指哪些代码路径内核函数持有过这些该 latch ,而不是哪些代码路径要申请这些 latch; 例如 kcbgtcr 函
数的作用是 Get a block for Consistent read,其持有 latch :cache buffers chain 是很正常的事情
NoWait Misses: 以 no-wait 模式来申请 latch 但直接失败的次数
Sleeps: 指 latch 被以 willing-to-wait 模式申请最终导致 session 需要 sleep 以等待该 latch 的次数 time of sleeps
resulted in making the latch request
Waiter Sleeps:等待者休眠的次数 times of sleeps that waiters did for each where; Sleep 是阻塞者等待的次数 ,
Waiter Sleeps 是被阻塞者等待的次数
10-4 Mutex Sleep Summary
Mutex Sleep Summary Snaps: 70719-70723
-> ordered by number of sleeps desc
Wait
Mutex Type Location Sleeps Time (ms)
--------------------- -------------------------------- ------------ ------------
Cursor Pin kksfbc [KKSCHLFSP2] 4,364 14,520
Cursor Pin kkslce [KKSCHLPIN2] 2,396 2,498
Library Cache kglpndl1 95 903 475
Library Cache kglpin1 4 800 458
Library Cache kglpnal2 91 799 259
Library Cache kglget1 1 553 1,697
Library Cache kglpnal1 90 489 88
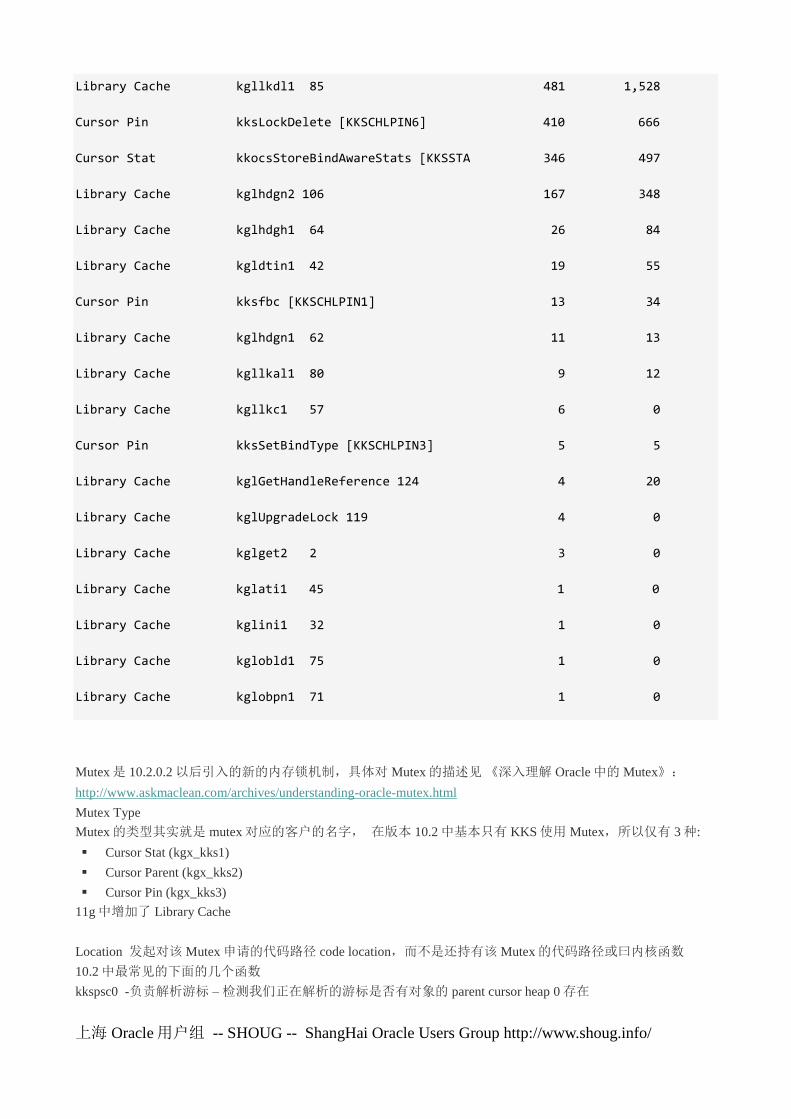
上海 Oracle 用户组 -- SHOUG -- ShangHai Oracle Users Group http://www.shoug.info/
Library Cache kgllkdl1 85 481 1,528
Cursor Pin kksLockDelete [KKSCHLPIN6] 410 666
Cursor Stat kkocsStoreBindAwareStats [KKSSTA 346 497
Library Cache kglhdgn2 106 167 348
Library Cache kglhdgh1 64 26 84
Library Cache kgldtin1 42 19 55
Cursor Pin kksfbc [KKSCHLPIN1] 13 34
Library Cache kglhdgn1 62 11 13
Library Cache kgllkal1 80 9 12
Library Cache kgllkc1 57 6 0
Cursor Pin kksSetBindType [KKSCHLPIN3] 5 5
Library Cache kglGetHandleReference 124 4 20
Library Cache kglUpgradeLock 119 4 0
Library Cache kglget2 2 3 0
Library Cache kglati1 45 1 0
Library Cache kglini1 32 1 0
Library Cache kglobld1 75 1 0
Library Cache kglobpn1 71 1 0
Mutex 是 10.2.0.2 以后引入的新的内存锁机制,具体对 Mutex 的描述见 《深入理解 Oracle 中的 Mutex》:
http://www.askmaclean.com/archives/understanding-oracle-mutex.html
Mutex Type
Mutex 的类型其实就是 mutex 对应的客户的名字, 在版本 10.2 中基本只有 KKS 使用 Mutex,所以仅有 3 种:
Cursor Stat (kgx_kks1)
Cursor Parent (kgx_kks2)
Cursor Pin (kgx_kks3)
11g 中增加了 Library Cache
Location 发起对该 Mutex 申请的代码路径 code location,而不是还持有该 Mutex 的代码路径或曰内核函数
10.2 中最常见的下面的几个函数
kkspsc0 -负责解析游标 – 检测我们正在解析的游标是否有对象的 parent cursor heap 0 存在

上海 Oracle 用户组 -- SHOUG -- ShangHai Oracle Users Group http://www.shoug.info/
kksfbc – 负责找到合适的子游标 或者创建一个新的子游标
kksFindCursorstat
Sleeps:
Mutex 的 Get 和 Sleep
当一个 Mutex 被申请时, 一般称为一个 get request。 若初始的申请未能得到授权, 则该进程会因为此次申请
而进入到 255 次 SPIN 中(_mutex_spin_count Mutex spin count),每次 SPIN 循环迭代过程中该进程都会去看看
Mutex 被释放了吗。
若该 Mutex 在 SPIN 之后仍未被释放,则该进程针对申请的 mutex 进入对应的 mutex wait 等待事件中。 实际进
程的等待事件和等待方式由 mutex 的类型锁决定,例如 Cursor pin、Cursor Parent。 举例来说,这种等待可能
是阻塞等待,也可以是 sleep。
但是请注意在 V$MUTEX_SLEEP_*视图上的 sleep 列意味着等待的次数。相关代码函数在开始进入等待时自
加这个 sleep 字段。
等待计时从进程进入等待前开始计算等待时间, 当一个进程结束其等待,则等待的时间加入都总和 total
中。 该进程再次尝试申请之前的 Mutex,若该 Mutex 仍不可用,则它再次进入 spin/wait 的循环。
V$MUTEX_SLEEP_HISTORY 视图的 GETS 列仅在成功申请到一个 Mutex 时才增加。
Wait Time (ms) 类似于 latch,spin time 不算做 mutex 的消耗时间,它只包含等待消耗的时间。
=====================================================================
11 segment statistics 段级统计
11-1 Segments by Logical Reads
Segments by Logical Reads DB/Inst: MAC/MAC2 Snaps: 70719-70723
-> Total Logical Reads: 2,021,476,421
-> Captured Segments account for 83.7% of Total
Tablespace Subobject Obj. Logical
Owner Name Object Name Name Type Reads %Total
---------- ---------- -------------------- ---------- ----- ------------ -------
CONTENT_OW INDEX_TS MZ_PRODUCT_ATTRIBUTE INDEX 372,849,920 18.44
CONTENT_OW INDEX_TS MZ_PRODUCT__LS_PK INDEX 329,829,632 16.32
CONTENT_OW DATA_TS MZ_PRODUCT_ATTRIBUTE TABLE 218,419,008 10.80
CONTENT_OW PLAYLIST_A MZ_PLAYLIST_ARTIST TABLE 182,426,240 9.02

上海 Oracle 用户组 -- SHOUG -- ShangHai Oracle Users Group http://www.shoug.info/
CONTENT_OW DATA_TS MZ_PRODUCT TABLE 108,597,376 5.37
owner : 数据段的所有者
Tablespace Name: 数据段所在表空间名
Object Name : 对象名
Subobject Name:子对象名,例如一个分区表的某个分区
obj Type: 对象类型 一般为 TABLE /INDEX 或者分区或子分区
Logical Reads :该数据段上发生过的逻辑读 , 单位为 块数*次数
%Total : 占总的逻辑读的百分比 , (当前对象上发生过的逻辑读/ Total DB 逻辑读)
11-2 Segments by Physical Reads
Segments by Physical Reads DB/Inst: MAC/MAC2 Snaps: 70719-70723
-> Total Physical Reads: 56,839,035
-> Captured Segments account for 51.9% of Total
Tablespace Subobject Obj. Physical
Owner Name Object Name Name Type Reads %Total
---------- ---------- -------------------- ---------- ----- ------------ -------
CONTENT_OW SONG_TS MZ_SONG TABLE 7,311,928 12.86
CONTENT_OW DATA_TS MZ_CS_WORK_PENDING_R TABLE 4,896,554 8.61
CONTENT_OW DATA_TS MZ_CONTENT_PROVIDER_ TABLE 3,099,387 5.45
CONTENT_OW DATA_TS MZ_PRODUCT_ATTRIBUTE TABLE 1,529,971 2.69
CONTENT_OW DATA_TS MZ_PUBLICATION TABLE 1,391,735 2.45
Physical Reads: 该数据段上发生过的物理读 , 单位为 块数*次数
%Total : 占总的物理读的百分比 , (当前对象上发生过的逻辑读/ Total DB 逻辑读)
11-3 Segments by Physical Read Requests
Segments by Physical Read Requests DB/Inst: MAC/MAC2 Snaps: 70719-70723
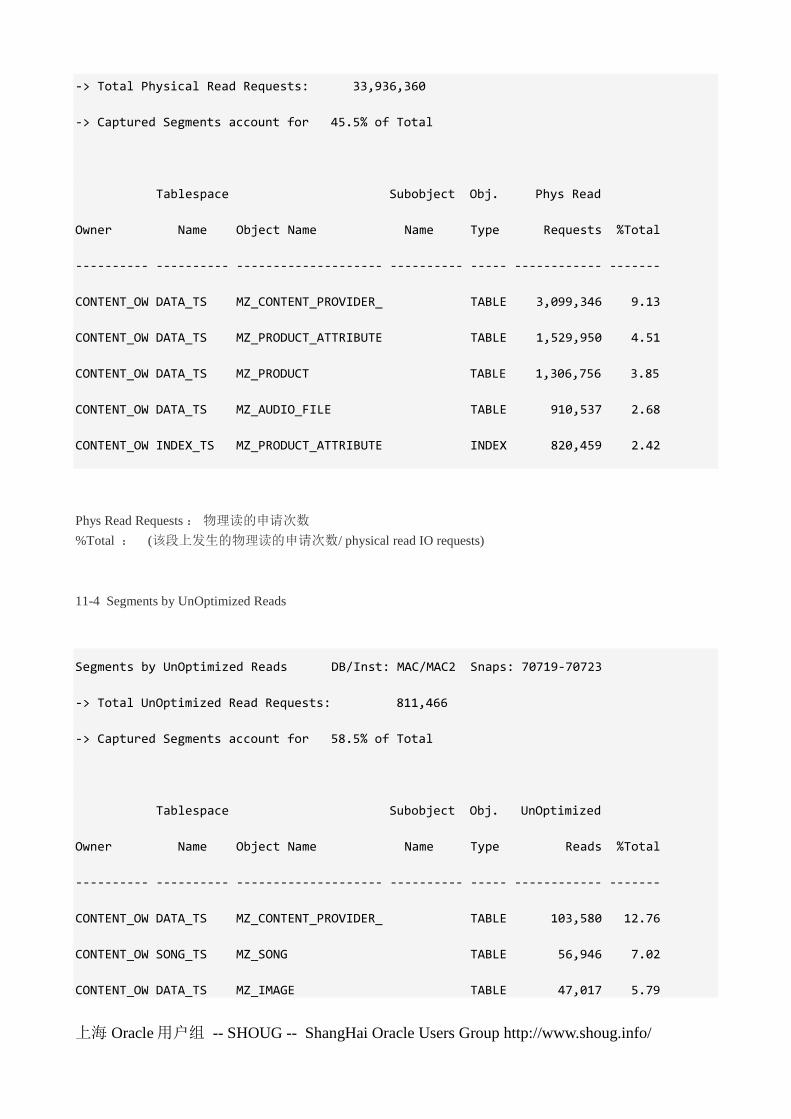
上海 Oracle 用户组 -- SHOUG -- ShangHai Oracle Users Group http://www.shoug.info/
-> Total Physical Read Requests: 33,936,360
-> Captured Segments account for 45.5% of Total
Tablespace Subobject Obj. Phys Read
Owner Name Object Name Name Type Requests %Total
---------- ---------- -------------------- ---------- ----- ------------ -------
CONTENT_OW DATA_TS MZ_CONTENT_PROVIDER_ TABLE 3,099,346 9.13
CONTENT_OW DATA_TS MZ_PRODUCT_ATTRIBUTE TABLE 1,529,950 4.51
CONTENT_OW DATA_TS MZ_PRODUCT TABLE 1,306,756 3.85
CONTENT_OW DATA_TS MZ_AUDIO_FILE TABLE 910,537 2.68
CONTENT_OW INDEX_TS MZ_PRODUCT_ATTRIBUTE INDEX 820,459 2.42
Phys Read Requests : 物理读的申请次数
%Total : (该段上发生的物理读的申请次数/ physical read IO requests)
11-4 Segments by UnOptimized Reads
Segments by UnOptimized Reads DB/Inst: MAC/MAC2 Snaps: 70719-70723
-> Total UnOptimized Read Requests: 811,466
-> Captured Segments account for 58.5% of Total
Tablespace Subobject Obj. UnOptimized
Owner Name Object Name Name Type Reads %Total
---------- ---------- -------------------- ---------- ----- ------------ -------
CONTENT_OW DATA_TS MZ_CONTENT_PROVIDER_ TABLE 103,580 12.76
CONTENT_OW SONG_TS MZ_SONG TABLE 56,946 7.02
CONTENT_OW DATA_TS MZ_IMAGE TABLE 47,017 5.79

上海 Oracle 用户组 -- SHOUG -- ShangHai Oracle Users Group http://www.shoug.info/
CONTENT_OW DATA_TS MZ_PRODUCT_ATTRIBUTE TABLE 40,950 5.05
CONTENT_OW DATA_TS MZ_PRODUCT TABLE 30,406 3.75
UnOptimized Reads UnOptimized Read Reqs = Physical Read Reqts – Optimized Read Reqs
Optimized Read Requests 是指 哪些满足 Exadata Smart Flash Cache ( or the Smart Flash Cache in OracleExadata V2
(Note that despite same name, concept and use of
‗Smart Flash Cache‘ in Exadata V2 is different from ‗Smart Flash Cache‘ in Database Smart Flash Cache)).的物理读
次数 。 满足从 smart flash cache 走的读取申请呗认为是 optimized ,因为这些读取要比普通从磁盘走快得多。
此外通过 smart scan 读取 storage index 的情况也被认为是‘optimized read requests‘ ,源于可以避免读取不相关的
数据。
当用户不在使用 Exadata 时,则 UnOptimized Read Reqs 总是等于 Physical Read Reqts
%Total : (该段上发生的物理读的 UnOptimized Read Reqs / ( physical read IO requests – physical read requests op-
timized ))
11-5 Segments by Optimized Reads
Segments by Optimized Reads DB/Inst: MAC/MAC2 Snaps: 70719-70723
-> Total Optimized Read Requests: 33,124,894
-> Captured Segments account for 45.2% of Total
Tablespace Subobject Obj. Optimized
Owner Name Object Name Name Type Reads %Total
---------- ---------- -------------------- ---------- ----- ------------ -------
CONTENT_OW DATA_TS MZ_CONTENT_PROVIDER_ TABLE 2,995,766 9.04
CONTENT_OW DATA_TS MZ_PRODUCT_ATTRIBUTE TABLE 1,489,000 4.50
CONTENT_OW DATA_TS MZ_PRODUCT TABLE 1,276,350 3.85
CONTENT_OW DATA_TS MZ_AUDIO_FILE TABLE 890,775 2.69
CONTENT_OW INDEX_TS MZ_AM_REQUEST_IX3 INDEX 816,067 2.46
关于 optimizerd read 上面已经解释过了,这里的单位是 request 次数
%Total : (该段上发生的物理读的 Optimized Read Reqs/ physical read requests optimized )

上海 Oracle 用户组 -- SHOUG -- ShangHai Oracle Users Group http://www.shoug.info/
11-6 Segments by Direct Physical Reads
Segments by Direct Physical Reads DB/Inst: MAC/MAC2 Snaps: 70719-70723
-> Total Direct Physical Reads: 14,118,552
-> Captured Segments account for 94.2% of Total
Tablespace Subobject Obj. Direct
Owner Name Object Name Name Type Reads %Total
---------- ---------- -------------------- ---------- ----- ------------ -------
CONTENT_OW SONG_TS MZ_SONG TABLE 7,084,416 50.18
CONTENT_OW DATA_TS MZ_CS_WORK_PENDING_R TABLE 4,839,984 34.28
CONTENT_OW DATA_TS MZ_PUBLICATION TABLE 1,361,133 9.64
CONTENT_OW DATA_TS SYS_LOB0000203660C00 LOB 5,904 .04
CONTENT_OW DATA_TS SYS_LOB0000203733C00 LOB 1,656 .01
Direct reads 直接路径物理读,单位为 块数*次数
%Total (该段上发生的 direct path reads /Total physical reads direct )
11-7 Segments by Physical Writes
Segments by Physical Writes DB/Inst: MAC/MAC2 Snaps: 70719-70723
-> Total Physical Writes: 590,563
-> Captured Segments account for 38.3% of Total
Tablespace Subobject Obj. Physical
Owner Name Object Name Name Type Writes %Total
---------- ---------- -------------------- ---------- ----- ------------ -------
CONTENT_OW DATA_TS MZ_CS_WORK_PENDING_R TABLE 23,595 4.00
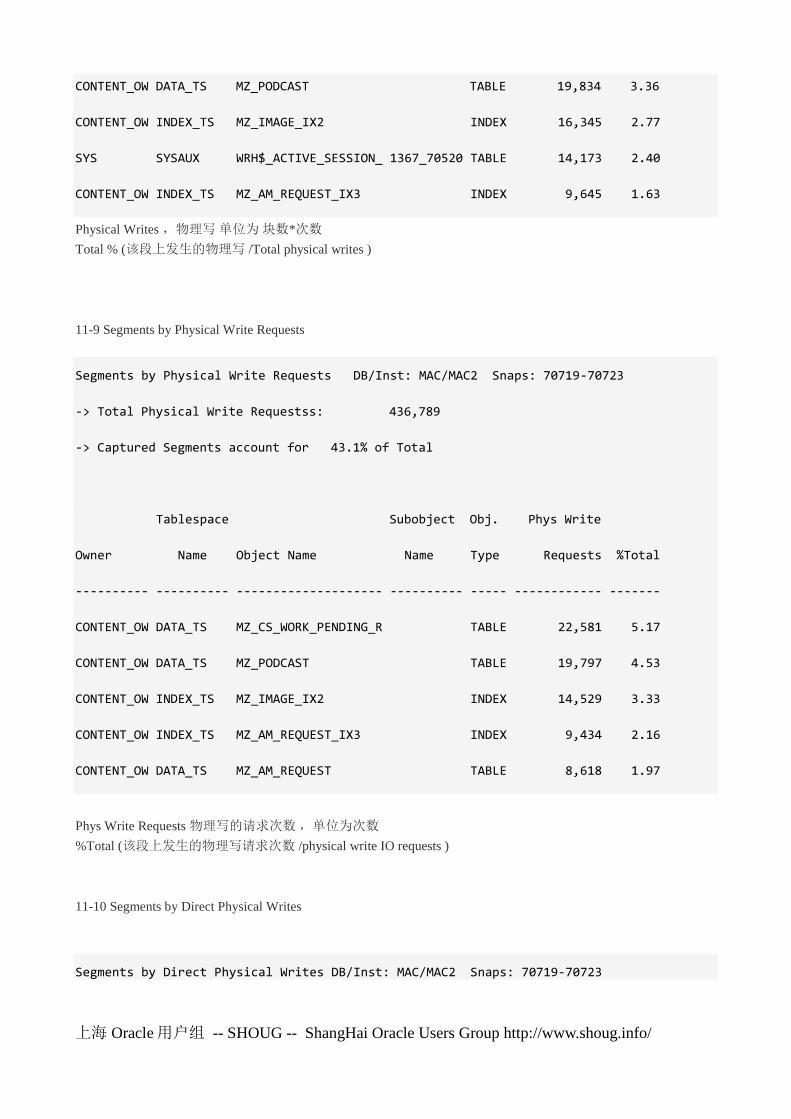
上海 Oracle 用户组 -- SHOUG -- ShangHai Oracle Users Group http://www.shoug.info/
CONTENT_OW DATA_TS MZ_PODCAST TABLE 19,834 3.36
CONTENT_OW INDEX_TS MZ_IMAGE_IX2 INDEX 16,345 2.77
SYS SYSAUX WRH$_ACTIVE_SESSION_ 1367_70520 TABLE 14,173 2.40
CONTENT_OW INDEX_TS MZ_AM_REQUEST_IX3 INDEX 9,645 1.63
Physical Writes ,物理写 单位为 块数*次数
Total % (该段上发生的物理写 /Total physical writes )
11-9 Segments by Physical Write Requests
Segments by Physical Write Requests DB/Inst: MAC/MAC2 Snaps: 70719-70723
-> Total Physical Write Requestss: 436,789
-> Captured Segments account for 43.1% of Total
Tablespace Subobject Obj. Phys Write
Owner Name Object Name Name Type Requests %Total
---------- ---------- -------------------- ---------- ----- ------------ -------
CONTENT_OW DATA_TS MZ_CS_WORK_PENDING_R TABLE 22,581 5.17
CONTENT_OW DATA_TS MZ_PODCAST TABLE 19,797 4.53
CONTENT_OW INDEX_TS MZ_IMAGE_IX2 INDEX 14,529 3.33
CONTENT_OW INDEX_TS MZ_AM_REQUEST_IX3 INDEX 9,434 2.16
CONTENT_OW DATA_TS MZ_AM_REQUEST TABLE 8,618 1.97
Phys Write Requests 物理写的请求次数 ,单位为次数
%Total (该段上发生的物理写请求次数 /physical write IO requests )
11-10 Segments by Direct Physical Writes
Segments by Direct Physical Writes DB/Inst: MAC/MAC2 Snaps: 70719-70723

上海 Oracle 用户组 -- SHOUG -- ShangHai Oracle Users Group http://www.shoug.info/
-> Total Direct Physical Writes: 29,660
-> Captured Segments account for 18.3% of Total
Tablespace Subobject Obj. Direct
Owner Name Object Name Name Type Writes %Total
---------- ---------- -------------------- ---------- ----- ------------ -------
SYS SYSAUX WRH$_ACTIVE_SESSION_ 1367_70520 TABLE 4,601 15.51
CONTENT_OW DATA_TS SYS_LOB0000203733C00 LOB 620 2.09
CONTENT_OW DATA_TS SYS_LOB0000203660C00 LOB 134 .45
CONTENT_OW DATA_TS SYS_LOB0000203779C00 LOB 46 .16
CONTENT_OW DATA_TS SYS_LOB0000203796C00 LOB 41 .14
Direct Writes 直接路径写, 单位额为块数*次数
%Total 为(该段上发生的直接路径写 /physical writes direct )
11-11 Segments by Table Scans
Segments by Table Scans DB/Inst: MAC/MAC2 Snaps: 70719-70723
-> Total Table Scans: 10,713
-> Captured Segments account for 1.0% of Total
Tablespace Subobject Obj. Table
Owner Name Object Name Name Type Scans %Total
---------- ---------- -------------------- ---------- ----- ------------ -------
CONTENT_OW DATA_TS MZ_PUBLICATION TABLE 92 .86
CONTENT_OW DATA_TS MZ_CS_WORK_PENDING_R TABLE 14 .13

上海 Oracle 用户组 -- SHOUG -- ShangHai Oracle Users Group http://www.shoug.info/
CONTENT_OW SONG_TS MZ_SONG TABLE 3 .03
CONTENT_OW DATA_TS MZ_AM_REQUEST TABLE 1 .01
Table Scans 来源为 dba_hist_seg_stat.table_scans_delta 不过这个指标并不十分精确
11-12 Segments by DB Blocks Changes
Segments by DB Blocks Changes DB/Inst: MAC/MAC2 Snaps: 70719-70723
-> % of Capture shows % of DB Block Changes for each top segment compared
-> with total DB Block Changes for all segments captured by the Snapshot
Tablespace Subobject Obj. DB Block % of
Owner Name Object Name Name Type Changes Capture
---------- ---------- -------------------- ---------- ----- ------------ -------
CONTENT_OW INDEX_TS MZ_AM_REQUEST_IX8 INDEX 347,856 10.21
CONTENT_OW INDEX_TS MZ_AM_REQUEST_IX3A INDEX 269,504 7.91
CONTENT_OW INDEX_TS MZ_AM_REQUEST_PK INDEX 251,904 7.39
CONTENT_OW DATA_TS MZ_AM_REQUEST TABLE 201,056 5.90
CONTENT_OW INDEX_TS MZ_PRODUCT_ATTRIBUTE INDEX 199,888 5.86
DB Block Changes ,单位为块数*次数
%Total : (该段上发生 block changes / db block changes )
11-13 Segments by Row Lock Waits
Segments by Row Lock Waits DB/Inst: MAC/MAC2 Snaps: 70719-70723
-> % of Capture shows % of row lock waits for each top segment compared
-> with total row lock waits for all segments captured by the Snapshot

上海 Oracle 用户组 -- SHOUG -- ShangHai Oracle Users Group http://www.shoug.info/
Row
Tablespace Subobject Obj. Lock % of
Owner Name Object Name Name Type Waits Capture
---------- ---------- -------------------- ---------- ----- ------------ -------
CONTENT_OW LOB_8K_TS MZ_ASSET_WORK_EVENT_ INDEX 72,005 43.86
CONTENT_OW LOB_8K_TS MZ_CS_WORK_NOTE_RE_I _2013_1_36 INDEX 13,795 8.40
CONTENT_OW LOB_8K_TS MZ_CS_WORK_INFO_PART _2013_5_35 INDEX 12,383 7.54
CONTENT_OW INDEX_TS MZ_AM_REQUEST_IX3A INDEX 8,937 5.44
CONTENT_OW DATA_TS MZ_AM_REQUEST TABLE 8,531 5.20
Row Lock Waits 是指行锁的等待次数 数据来源于 dba_hist_seg_stat.ROW_LOCK_WAITS_DELTA
11-14 Segments by ITL WAITS
Segments by ITL Waits DB/Inst: MAC/MAC2 Snaps: 70719-70723
-> % of Capture shows % of ITL waits for each top segment compared
-> with total ITL waits for all segments captured by the Snapshot
Tablespace Subobject Obj. ITL % of
Owner Name Object Name Name Type Waits Capture
---------- ---------- -------------------- ---------- ----- ------------ -------
CONTENT_OW LOB_8K_TS MZ_ASSET_WORK_EVENT_ INDEX 95 30.16
CONTENT_OW LOB_8K_TS MZ_CS_WORK_NOTE_RE_I _2013_1_36 INDEX 48 15.24
CONTENT_OW LOB_8K_TS MZ_CS_WORK_INFO_PART _2013_5_35 INDEX 21 6.67
CONTENT_OW INDEX_TS MZ_SALABLE_FIRST_AVA INDEX 21 6.67
CONTENT_OW DATA_TS MZ_CS_WORK_PENDING_R TABLE 20 6.35

上海 Oracle 用户组 -- SHOUG -- ShangHai Oracle Users Group http://www.shoug.info/
关于 ITL 的介绍详见: http://www.askmaclean.com/archives/enqueue-tx-row-lock-index-itl-wait-event.html
ITL Waits 等待 ITL 的次数,数据来源为 dba_hist_seg_stat.itl_waits_delta
11-14 Segments by Buffer Busy Waits
Segments by Buffer Busy Waits DB/Inst: MAC/MAC2 Snaps: 70719-70723
-> % of Capture shows % of Buffer Busy Waits for each top segment compared
-> with total Buffer Busy Waits for all segments captured by the Snapshot
Buffer
Tablespace Subobject Obj. Busy % of
Owner Name Object Name Name Type Waits Capture
---------- ---------- -------------------- ---------- ----- ------------ -------
CONTENT_OW LOB_8K_TS MZ_ASSET_WORK_EVENT_ INDEX 251,073 57.07
CONTENT_OW LOB_8K_TS MZ_CS_WORK_NOTE_RE_I _2013_1_36 INDEX 36,186 8.23
CONTENT_OW LOB_8K_TS MZ_CS_WORK_INFO_PART _2013_5_35 INDEX 31,786 7.23
CONTENT_OW INDEX_TS MZ_AM_REQUEST_IX3A INDEX 15,663 3.56
CONTENT_OW INDEX_TS MZ_CS_WORK_PENDING_R INDEX 11,087 2.52
Buffer Busy Waits 该数据段上发生 buffer busy wait 的次数 数据来源 dba_hist_seg_stat.buffer_busy_waits_delta
11-15 Segments by Global Cache Buffer
Segments by Global Cache Buffer BusyDB/Inst: MAC/MAC2 Snaps: 70719-7072
-> % of Capture shows % of GC Buffer Busy for each top segment compared
-> with GC Buffer Busy for all segments captured by the Snapshot

上海 Oracle 用户组 -- SHOUG -- ShangHai Oracle Users Group http://www.shoug.info/
GC
Tablespace Subobject Obj. Buffer % of
Owner Name Object Name Name Type Busy Capture
---------- ---------- -------------------- ---------- ----- ------------ -------
CONTENT_OW INDEX_TS MZ_AM_REQUEST_IX3 INDEX 2,135,528 50.07
CONTENT_OW DATA_TS MZ_CONTENT_PROVIDER_ TABLE 652,900 15.31
CONTENT_OW LOB_8K_TS MZ_ASSET_WORK_EVENT_ INDEX 552,161 12.95
CONTENT_OW LOB_8K_TS MZ_CS_WORK_NOTE_RE_I _2013_1_36 INDEX 113,042 2.65
CONTENT_OW LOB_8K_TS MZ_CS_WORK_INFO_PART _2013_5_35 INDEX 98,134 2.30
GC Buffer Busy 数据段上发挥僧 gc buffer busy 的次数, 数据源 dba_hist_seg_stat.gc_buffer_busy_delta
11-15 Segments by CR Blocks Received
Segments by CR Blocks Received DB/Inst: MAC/MAC2 Snaps: 70719-70723
-> Total CR Blocks Received: 763,037
-> Captured Segments account for 40.9% of Total
CR
Tablespace Subobject Obj. Blocks
Owner Name Object Name Name Type Received %Total
---------- ---------- -------------------- ---------- ----- ------------ -------
CONTENT_OW DATA_TS MZ_AM_REQUEST TABLE 69,100 9.06
CONTENT_OW DATA_TS MZ_CS_WORK_PENDING_R TABLE 44,491 5.83
CONTENT_OW INDEX_TS MZ_AM_REQUEST_IX3A INDEX 36,830 4.83
CONTENT_OW DATA_TS MZ_PODCAST TABLE 36,632 4.80

上海 Oracle 用户组 -- SHOUG -- ShangHai Oracle Users Group http://www.shoug.info/
CONTENT_OW INDEX_TS MZ_AM_REQUEST_PK INDEX 19,646 2.57
CR Blocks Received :是指 RAC 中本地节点接收到 global cache CR blocks 的数量; 数据来源
为 dba_hist_seg_stat.gc_cu_blocks_received_delta
%Total : (该段上在本节点接收的 Global CR blocks / gc cr blocks received )
11-16 Segments by Current Blocks Received
Segments by Current Blocks ReceivedDB/Inst: MAC/MAC2 Snaps: 70719-70723
-> Total Current Blocks Received: 704,731
-> Captured Segments account for 61.8% of Total
Current
Tablespace Subobject Obj. Blocks
Owner Name Object Name Name Type Received %Total
---------- ---------- -------------------- ---------- ----- ------------ -------
CONTENT_OW INDEX_TS MZ_AM_REQUEST_IX3 INDEX 56,287 7.99
CONTENT_OW INDEX_TS MZ_AM_REQUEST_IX3A INDEX 45,139 6.41
CONTENT_OW DATA_TS MZ_AM_REQUEST TABLE 40,350 5.73
CONTENT_OW DATA_TS MZ_CS_WORK_PENDING_R TABLE 22,808 3.24
CONTENT_OW INDEX_TS MZ_AM_REQUEST_IX8 INDEX 13,343 1.89
Current Blocks Received :是指 RAC 中本地节点接收到 global cache Current blocks 的数量 ,数据来源
DBA_HIST_SEG_STAT.gc_cu_blocks_received_delta
%Total : (该段上在本节点接收的 global cache current blocks / gc current blocks received)
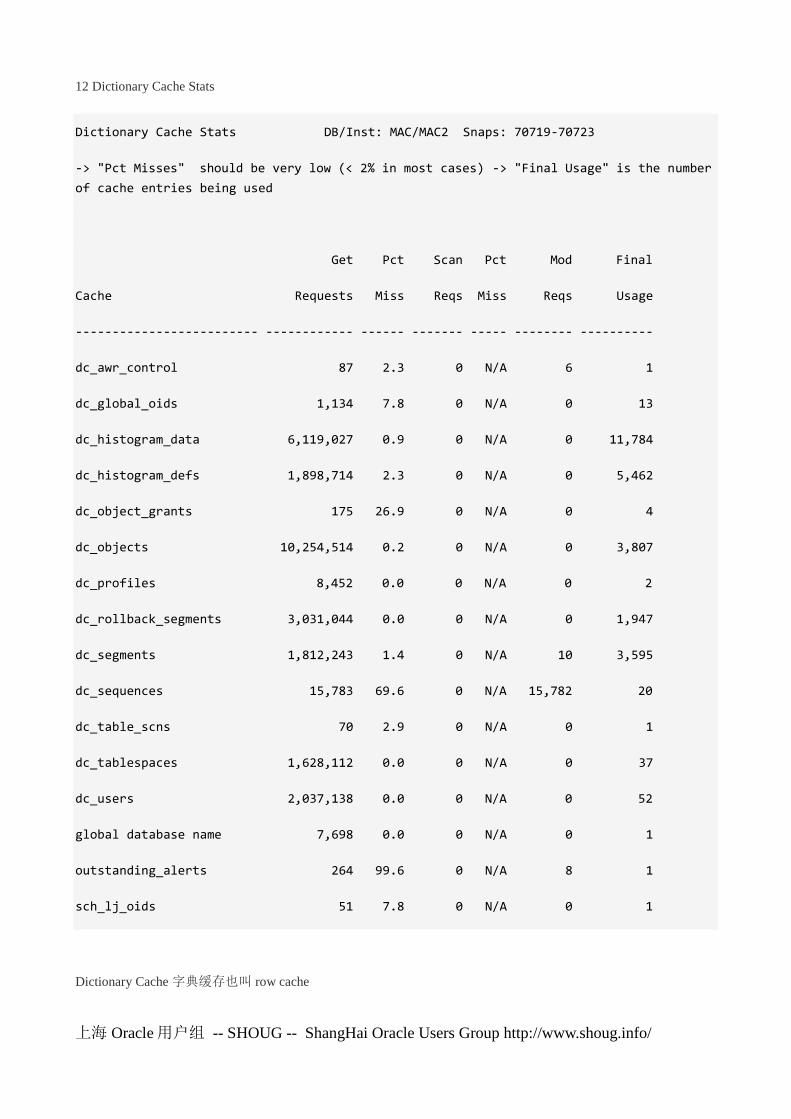
上海 Oracle 用户组 -- SHOUG -- ShangHai Oracle Users Group http://www.shoug.info/
12 Dictionary Cache Stats
Dictionary Cache Stats DB/Inst: MAC/MAC2 Snaps: 70719-70723
-> "Pct Misses" should be very low (< 2% in most cases) -> "Final Usage" is the number
of cache entries being used
Get Pct Scan Pct Mod Final
Cache Requests Miss Reqs Miss Reqs Usage
------------------------- ------------ ------ ------- ----- -------- ----------
dc_awr_control 87 2.3 0 N/A 6 1
dc_global_oids 1,134 7.8 0 N/A 0 13
dc_histogram_data 6,119,027 0.9 0 N/A 0 11,784
dc_histogram_defs 1,898,714 2.3 0 N/A 0 5,462
dc_object_grants 175 26.9 0 N/A 0 4
dc_objects 10,254,514 0.2 0 N/A 0 3,807
dc_profiles 8,452 0.0 0 N/A 0 2
dc_rollback_segments 3,031,044 0.0 0 N/A 0 1,947
dc_segments 1,812,243 1.4 0 N/A 10 3,595
dc_sequences 15,783 69.6 0 N/A 15,782 20
dc_table_scns 70 2.9 0 N/A 0 1
dc_tablespaces 1,628,112 0.0 0 N/A 0 37
dc_users 2,037,138 0.0 0 N/A 0 52
global database name 7,698 0.0 0 N/A 0 1
outstanding_alerts 264 99.6 0 N/A 8 1
sch_lj_oids 51 7.8 0 N/A 0 1
Dictionary Cache 字典缓存也叫 row cache

上海 Oracle 用户组 -- SHOUG -- ShangHai Oracle Users Group http://www.shoug.info/
数据来源为 dba_hist_rowcache_summary
Cache 字典缓存类名 kqrstcid <=> kqrsttxt cid=3(dc_rollback_segments)
Get Requests 申请获取该数据字典缓存对象的次数 gets
Miss : GETMISSES 申请获取该数据字典缓存对象但 miss 的次数
Pct Miss : GETMISSES /Gets , Miss 的比例 ,这个 pct miss 应当非常低 小于 2%,否则有出现大量 row
cache lock 的可能
Scan Reqs:扫描申请的次数 ,kqrssc 、kqrpScan 、kqrpsiv 时发生 scan 会导致扫描数增加 kqrstsrq++(scan re-
quests) ,例如 migrate tablespace 时调用 kttm2b 函数 为了安全删除 uet$中的记录会 callback kqrpsiv (used extent
cache),实际很少见
Pct Miss:SCANMISSES/SCANS
Mod Reqs: 申请修改字典缓存对象的次数,从上面的数据可以看到 dc_sequences 的 mod reqs 很高,这是因为
sequence 是变化较多的字典对象
Final Usage :包含有有效数据的字典缓存记录的总数 也就是正在被使用的 row cache 记录 USAGE Number of
cache entries that contain valid data
Dictionary Cache Stats (RAC) DB/Inst: MAC/MAC2 Snaps: 70719-70723
GES GES GES
Cache Requests Conflicts Releases
------------------------- ------------ ------------ ------------
dc_awr_control 14 2 0
dc_global_oids 88 0 102
dc_histogram_defs 43,518 0 43,521
dc_objects 21,608 17 21,176
dc_profiles 1 0 1
dc_segments 24,974 14 24,428
dc_sequences 25,178 10,644 347
dc_table_scns 2 0 2
dc_tablespaces 165 0 166
dc_users 119 0 119
outstanding_alerts 478 8 250

上海 Oracle 用户组 -- SHOUG -- ShangHai Oracle Users Group http://www.shoug.info/
sch_lj_oids 4 0 4
GES Request kqrstilr total instance lock requests ,通过全局队列服务 GES 来申请 instance lock 的次数
GES request 申请的原因可能是 dump cache object、kqrbfr LCK 进程要 background free some parent objects 释放一
些 parent objects 等
GES Conflicts kqrstifr instance lock forced-releases , LCK 进程以 AST 方式 释放锁的次数 ,仅出现在 kqrbrl
中
GES Releases kqrstisr instance lock self-releases ,LCK 进程要 background free some parent objects 释放一些
parent objects 时可能自增
上述数据中可以看到仅有 dc_sequences 对应的 GES Conflicts 较多, 对于 sequence 使用 ordered 和 non-cache
选项会导致 RAC 中的一个边际效应,即‖row cache lock‖等待源于 DC_SEQUENCES ROW CACHE。
DC_SEQUENCES 上的 GETS request、modifications 、GES requests 和 GES conflict 与引发生成一个新的 se-
quence number 的特定 SQL 执行频率相关。
在 Oracle 10g 中,ORDERED Sequence 还可能在高并发下造成大量 DFS lock Handle 等待,由于 bug 5209859
13 Library Cache Activity
Library Cache Activity DB/Inst: MAC/MAC2 Snaps: 70719-70723
-> "Pct Misses" should be very low
Get Pct Pin Pct Invali-
Namespace Requests Miss Requests Miss Reloads dations
--------------- ------------ ------ -------------- ------ ---------- --------
ACCOUNT_STATUS 8,436 0.3 0 N/A 0 0
BODY 8,697 0.7 15,537 0.7 49 0
CLUSTER 317 4.7 321 4.7 0 0
DBLINK 9,212 0.1 0 N/A 0 0
EDITION 4,431 0.0 8,660 0.0 0 0
HINTSET OBJECT 1,027 9.5 1,027 14.4 0 0

上海 Oracle 用户组 -- SHOUG -- ShangHai Oracle Users Group http://www.shoug.info/
INDEX 792 18.2 792 18.2 0 0
QUEUE 10 0.0 1,733 0.0 0 0
RULESET 0 N/A 8 87.5 7 0
SCHEMA 8,169 0.0 0 N/A 0 0
SQL AREA 533,409 4.8 -4,246,727,944 101.1 44,864 576
SQL AREA BUILD 71,500 65.5 0 N/A 0 0
SQL AREA STATS 41,008 90.3 41,008 90.3 1 0
TABLE/PROCEDURE 320,310 0.6 1,033,991 3.6 25,378 0
TRIGGER 847 0.0 38,442 0.3 110 0
NameSpace library cache 的命名空间
GETS Requests 该命名空间所包含对象的 library cache lock 被申请的次数
GETHITS 对象的 library cache handle 正好在内存中被找到的次数
Pct Misses : ( 1- ( GETHITS /GETS Requests)) *100
Pin Requests 该命名空间所包含对象上 pin 被申请的次数
PINHITS 要 pin 的对象的 heap metadata 正好在 shared pool 中的次数
Pct Miss ( 1- ( PINHITS /Pin Requests)) *100
Reloads 指从 object handle 被重建开始不是第一次 PIN 该对象的 PIN ,且该次 PIN 要求对象从磁盘上读取加载
的次数 ;Reloads 值较高的情况 建议增大 shared_pool_size
INVALIDATIONS 由于以来对象被修改导致该命名空间所包含对象被标记为无效的次数
Library Cache Activity (RAC) DB/Inst: MAC/MAC2 Snaps: 70719-70723
GES Lock GES Pin GES Pin GES Inval GES Invali-
Namespace Requests Requests Releases Requests dations
--------------- ------------ ------------ ------------ ----------- -----------
ACCOUNT_STATUS 8,436 0 0 0 0
BODY 0 15,497 15,497 0 0
CLUSTER 321 321 321 0 0
DBLINK 9,212 0 0 0 0

上海 Oracle 用户组 -- SHOUG -- ShangHai Oracle Users Group http://www.shoug.info/
EDITION 4,431 4,431 4,431 0 0
HINTSET OBJECT 1,027 1,027 1,027 0 0
INDEX 792 792 792 0 0
QUEUE 8 1,733 1,733 0 0
RULESET 0 8 8 0 0
SCHEMA 4,226 0 0 0 0
TABLE/PROCEDURE 373,163 704,816 704,816 0 0
TRIGGER 0 38,430 38,430 0 0
GES Lock Request: dlm_lock_requests Lock instance-lock ReQuests 申请获得 lock instance lock 的次数
GES PIN request : DLM_PIN_REQUESTS Pin instance-lock ReQuests 申请获得 pin instance lock 的次数
GES Pin Releases DLM_PIN_RELEASES release the pin instance lock 释放 pin instance lock 的次数
GES Inval Requests DLM_INVALIDATION_REQUESTS get the invalidation instance lock 申请获得 invalidation
instance lock 的次数
GES Invali- dations DLM_INVALIDATIONS 接收到其他节点的 invalidation pings 次数
14 Process Memory Summary
Process Memory Summary DB/Inst: MAC/MAC2 Snaps: 70719-70723
-> B: Begin Snap E: End Snap
-> All rows below contain absolute values (i.e. not diffed over the interval)
-> Max Alloc is Maximum PGA Allocation size at snapshot time
-> Hist Max Alloc is the Historical Max Allocation for still-connected processes
-> ordered by Begin/End snapshot, Alloc (MB) desc
Hist
Avg Std Dev Max Max
Alloc Used Alloc Alloc Alloc Alloc Num Num

上海 Oracle 用户组 -- SHOUG -- ShangHai Oracle Users Group http://www.shoug.info/
Category (MB) (MB) (MB) (MB) (MB) (MB) Proc Alloc
- -------- --------- --------- -------- -------- ------- ------- ------ ------
B Other 16,062.7 N/A 6.1 66.6 3,370 3,370 2,612 2,612
SQL 5,412.2 4,462.9 2.2 89.5 4,483 4,483 2,508 2,498
Freeable 2,116.4 .0 .9 6.3 298 N/A 2,266 2,266
PL/SQL 94.0 69.8 .0 .0 1 1 2,610 2,609
E Other 15,977.3 N/A 6.1 66.9 3,387 3,387 2,616 2,616
SQL 5,447.9 4,519.0 2.2 89.8 4,505 4,505 2,514 2,503
Freeable 2,119.9 .0 .9 6.3 297 N/A 2,273 2,273
PL/SQL 93.2 69.2 .0 .0 1 1 2,614 2,613
数据来源为 dba_hist_process_mem_summary, 这里是对 PGA 使用的一个小结,帮助我们了解到底谁用掉了
PGA
B: 开始快照 E: 结束快照
该环节列出 PGA 中各分类的使用量
Category 分类名,包括‖SQL‖, ―PL/SQL‖, ―OLAP‖ 和‖JAVA‖. 特殊分类是 ―Freeable‖ 和‖Other‖. Free memory
是指哪些 OS 已经分配给进程,但没有分配给任何分类的内存。 ―Other‖是已经分配给分类的内存,但不是已命
名的分类
Alloc (MB) allocated_total 该分类被分配的总内存
Used (MB) used_total 该分类已使用的内存
Avg Alloc (MB) allocated_avg 平均每个进程中该分类分配的内存量
Std Dev Alloc (MB) :该分类分配的内存在每个进程之间的标准差
Max Alloc (MB) ALLOCATED_MAX :在快照时间内单个进程该分类最大分配过的内存量:Max Alloc is
Maximum PGA Allocation size at snapshot time
Hist Max Alloc (MB) MAX_ALLOCATED_MAX: 目前仍链接着的进程该分类最大分配过的内存量:Hist Max
Alloc is the Historical Max Allocation for still-connected processes
Num Proc num_processes 进程数目
Num Alloc NON_ZERO_ALLOCS 分配了该类型 内存的进程数目
14 SGA 信息
14 -1 SGA Memory Summary
SGA Memory Summary DB/Inst: MAC/MAC2 Snaps: 70719-70723

上海 Oracle 用户组 -- SHOUG -- ShangHai Oracle Users Group http://www.shoug.info/
End Size (Bytes)
SGA regions Begin Size (Bytes) (if different)
------------------------------ ------------------- -------------------
Database Buffers 20,669,530,112
Fixed Size 2,241,880
Redo Buffers 125,669,376
Variable Size 10,536,094,376
-------------------
sum 31,333,535,744
粗粒度的 sga 区域内存使用信息, End Size 仅在于 begin size 不同时打印
14-2 SGA breakdown difference
SGA breakdown difference DB/Inst: MAC/MAC2 Snaps: 70719-70723
-> ordered by Pool, Name
-> N/A value for Begin MB or End MB indicates the size of that Pool/Name was
insignificant, or zero in that snapshot
Pool Name Begin MB End MB % Diff
------ ------------------------------ -------------- -------------- -------
java free memory 64.0 64.0 0.00
large PX msg pool 7.8 7.8 0.00
large free memory 247.8 247.8 0.00
shared Checkpoint queue 140.6 140.6 0.00

上海 Oracle 用户组 -- SHOUG -- ShangHai Oracle Users Group http://www.shoug.info/
shared FileOpenBlock 2,459.2 2,459.2 0.00
shared KGH: NO ACCESS 1,629.6 1,629.6 0.00
shared KGLH0 997.7 990.5 -0.71
shared KKSSP 312.2 308.9 -1.06
shared SQLA 376.6 370.6 -1.61
shared db_block_hash_buckets 178.0 178.0 0.00
shared dbktb: trace buffer 156.3 156.3 0.00
shared event statistics per sess 187.1 187.1 0.00
shared free memory 1,208.9 1,220.6 0.97
shared gcs resources 435.0 435.0 0.00
shared gcs shadows 320.6 320.6 0.00
shared ges enqueues 228.9 228.9 0.00
shared ges resource 118.3 118.3 0.00
shared init_heap_kfsg 1,063.6 1,068.1 0.43
shared kglsim object batch 124.3 124.3 0.00
shared ksunfy : SSO free list 174.7 174.7 0.00
stream free memory 128.0 128.0 0.00
buffer_cache 19,712.0 19,712.0 0.00
fixed_sga 2.1 2.1 0.00
log_buffer 119.8 119.8 0.00
-------------------------------------------------------------
Pool 内存池的名字
Name 内存池中细分组件的名字 例如 KGLH0 存放 KEL Heap 0 、SQLA 存放 SQL 执行计划等
Begin MB 快照开始时该组件的内存大小
End MB 快照结束时该组件的内存大小
% Diff 差异百分比
特别注意 由于 AMM /ASMM 引起的 shared pool 收缩 一般在 sga breakdown 中可以提现 例如 SQLA 、KQR 等
组件大幅缩小 ,可能导致一系列的解析等待 cursor: Pin S on X 、row cache lock 等

上海 Oracle 用户组 -- SHOUG -- ShangHai Oracle Users Group http://www.shoug.info/
此处的 free memory 信息也值得我们关注, 一般推荐 shared pool 应当有 300~400 MB 的 free memory 为宜
15 Streams 统计
Streams CPU/IO Usage DB/Inst: ORCL/orcl1 Snaps: 556-559
-> Streams processes ordered by CPU usage
-> CPU and I/O Time in micro seconds
Session Type CPU Time User I/O Time Sys I/O Time
------------------------- -------------- -------------- --------------
QMON Coordinator 101,698 0 0
QMON Slaves 63,856 0 0
-------------------------------------------------------------
Streams Capture DB/Inst: CATGT/catgt Snaps: 911-912
-> Lag Change should be small or negative (in seconds)
Captured Enqueued Pct Pct Pct Pct
Per Per Lag RuleEval Enqueue Redo-
Wait Pause
Capture Name Second Se-
cond Change Time Time Time Time
------------ -------- -------- -------- -------- -------- -------- --------
CAPTU-
TU-
RE_CAT 650 391 93 0 23 0 71
-------------------------------------------------------------

上海 Oracle 用户组 -- SHOUG -- ShangHai Oracle Users Group http://www.shoug.info/
Streams Apply DB/Inst: CATGT/catgt Snaps: 911-912
-> Pct DB is the percentage of all DB transactions that this apply handled
-> WDEP is the wait for dependency
-> WCMT is the wait for commit
-> RBK is rollbacks -> MPS is messages per second
-> TPM is time per message in milli-seconds
-> Lag Change should be small or negative (in seconds)
Applied Pct Pct Pct Pct Applied Dequeue Apply Lag
Apply Name TPS DB WDEP WCMT RBK MPS TPM TPM Change
------------ -------- ---- ---- ---- --- -------- -------- -------- --------
AP-
PLY_CAT 0 0 0 0 0 0 0 0
0
-------------------------------------------------------------
Capture Name : Streams 捕获进程名
Captured Per Second :每秒挖掘出来的 message 条数
Enqueued Per Second: 每秒入队的 message 条数
lag change: 指日志生成的时间到挖掘到该日志生成 message 的时间延迟
Pct Enqueue Time: 入队时间的比例
Pct redoWait Time : 等待 redo 的时间比例
Pct Pause Time : Pause 时间的比例
Apply Name Streams 应用 Apply 进程的名字
Applied TPS : 每秒应用的事务数
Pct DB: 所有的 DB 事务中 apply 处理的比例
Pct WDEP: 由于等待依赖的数据而耗费的时间比例
Pct WCMT: 由于等待 commit 而耗费的时间比例
Pct RBK: 事务 rollback 回滚的比例
Applied MPS: 每秒应用的 message 数
Dequeue TPM: 每毫秒出队的 message 数

上海 Oracle 用户组 -- SHOUG -- ShangHai Oracle Users Group http://www.shoug.info/
Lag Change:指最新 message 生成的时间到其被 Apply 收到的延迟
16 Resource Limit
Resource Limit Stats DB/Inst: MAC/MAC2 Snap: 70723
-> only rows with Current or Maximum Utilization > 80% of Limit are shown
-> ordered by resource name
Current Maximum Initial
Resource Name Utilization Utilization Allocation Limit
------------------------------ ------------ ------------ ---------- ----------
ges_procs 2,612 8,007 10003 10003
processes 2,615 8,011 10000 10000
数据源于 dba_hist_resource_limit
注意这里仅列出当前使用或最大使用量>80% *最大限制的资源名,如果没有列在这里则说明 资源使用量安全
Current Utilization 当前对该资源(包括 Enqueue Resource、Lock 和 processes)的使用量
Maximum Utilization 从最近一次实例启动到现在该资源的最大使用量
Initial Allocation 初始分配值,一般等于参数文件中指定的值
Limit 实际上限值
17 init.ora Parameters
init.ora Parameters DB/Inst: MAC/MAC2 Snaps: 70719-70723
End value
Parameter Name Begin value (if different)
----------------------------- --------------------------------- --------------
_compression_compatibility 11.2.0

上海 Oracle 用户组 -- SHOUG -- ShangHai Oracle Users Group http://www.shoug.info/
_kghdsidx_count 4
_ksmg_granule_size 67108864
_shared_pool_reserved_min_all 4100
archive_lag_target 900
audit_file_dest /u01/app/oracle/admin/MAC/adum
audit_trail OS
cluster_database TRUE
compatible 11.2.0.2.0
control_files +DATA/MAC/control01.ctl, +RECO
db_16k_cache_size 268435456
db_block_size 8192
db_cache_size 19327352832
db_create_file_dest +DATA
Parameter Name 参数名
Begin value 开始快照时的参数值
End value 结束快照时的参数值 (仅在发生变化时打印)
18 Global Messaging Statistics
Global Messaging Statistics DB/Inst: MAC/MAC2 Snaps: 70719-70723
Statistic Total per Second per Trans
--------------------------------- ---------------- ------------ ------------
acks for commit broadcast(actual) 53,705 14.9 0.2
acks for commit broadcast(logical 311,182 86.1 1.3
broadcast msgs on commit(actual) 317,082 87.7 1.3
broadcast msgs on commit(logical) 317,082 87.7 1.3

上海 Oracle 用户组 -- SHOUG -- ShangHai Oracle Users Group http://www.shoug.info/
broadcast msgs on commit(wasted) 263,332 72.9 1.1
dynamically allocated gcs resourc 0 0.0 0.0
dynamically allocated gcs shadows 0 0.0 0.0
flow control messages received 267 0.1 0.0
flow control messages sent 127 0.0 0.0
gcs apply delta 0 0.0 0.0
gcs assume cvt 55,541 15.4 0.2
全局通信统计信息,数据来源 WRH$_DLM_MISC;
20 Global CR Served Stats
Global CR Served Stats DB/Inst: MAC/MAC2 Snaps: 70719-70723
Statistic Total
------------------------------ ------------------
CR Block Requests 403,703
CURRENT Block Requests 444,896
Data Block Requests 403,705
Undo Block Requests 94,336
TX Block Requests 307,896
Current Results 652,746
Private results 21,057
Zero Results 104,720
Disk Read Results 69,418
Fail Results 508
Fairness Down Converts 102,844
Fairness Clears 15,207

上海 Oracle 用户组 -- SHOUG -- ShangHai Oracle Users Group http://www.shoug.info/
Free GC Elements 0
Flushes 105,052
Flushes Queued 0
Flush Queue Full 0
Flush Max Time (us) 0
Light Works 71,793
Errors 117
LMS 传输 CR BLOCK 的统计信息,数据来源 WRH$_CR_BLOCK_SERVER
21 Global CURRENT Served Stats
Global CURRENT Served Stats DB/Inst: MAC/MAC2 Snaps: 70719-70723
-> Pins = CURRENT Block Pin Operations
-> Flushes = Redo Flush before CURRENT Block Served Operations
-> Writes = CURRENT Block Fusion Write Operations
Statistic Total % <1ms % <10ms % <100ms % <1s % <10s
---------- ------------ -------- -------- -------- -------- --------
Pins 73,018 12.27 75.96 8.49 2.21 1.08
Flushes 79,336 5.98 50.17 14.45 19.45 9.95
Writes 102,189 3.14 35.23 19.34 33.26 9.03
数据来源 dba_hist_current_block_server
Time to process current block request = (pin time + flush time + send time)

上海 Oracle 用户组 -- SHOUG -- ShangHai Oracle Users Group http://www.shoug.info/
Pins CURRENT Block Pin Operations , PIN 的内涵是处理一个 BAST 不包含对 global current block 的 flush 和实
际传输
The pin time represents how much time is required to process a BAST. It does not include the flush time and
the send time. The average pin time per block served should be very low because the processing consists
mainly of code path and should never be blocked.
Flush 指 脏块被 LMS 进程传输出去之前,其相关的 redo 必须由 LGWR 已经 flush 到磁盘上
Write 指 fusion write number of writes which were mediated; 节点之间写脏块需求相互促成的行为
KJBL.KJBLREQWRITE gcs write request msgs 、gcs writes refused
% <1ms % <10ms % <100ms % <1s % <10s 分别对应为 pin、flush、write 行为耗时的比例
例如在上例中 flush 和 write 在 1s 到 10s 之间的有 9%,在 100ms 和 1s 之间的有 19%和 33%,因为 flush 和
write 都是 IO 操作 所以这里可以预见 IO 存在问题,延迟较高
22 Global Cache Transfer Stats
Global Cache Transfer Stats DB/Inst: MAC/MAC2 Snaps: 70719-70723
-> Immediate (Immed) - Block Transfer NOT impacted by Remote Processing Delays
-> Busy (Busy) - Block Transfer impacted by Remote Contention
-> Congested (Congst) - Block Transfer impacted by Remote System Load
-> ordered by CR + Current Blocks Received desc
CR Current
----------------------------- -----------------------------
Inst Block Blocks % % % Blocks % % %
No Class Received Immed Busy Congst Received Immed Busy Congst
---- ----------- -------- ------ ------ ------ -------- ------ ------ ------
1 data block 133,187 76.3 22.6 1.1 233,138 75.2 23.0 1.7
4 data block 143,165 74.1 24.9 1.0 213,204 76.6 21.8 1.6
3 data block 122,761 75.9 23.0 1.1 220,023 77.7 21.0 1.3
1 undo header 104,219 95.7 3.2 1.1 941 93.4 5.8 .7
4 undo header 95,823 95.2 3.7 1.1 809 93.4 5.3 1.2
3 undo header 95,592 95.6 3.3 1.1 912 94.6 4.5 .9

上海 Oracle 用户组 -- SHOUG -- ShangHai Oracle Users Group http://www.shoug.info/
1 undo block 25,002 95.8 3.4 .9 0 N/A N/A N/A
4 undo block 23,303 96.0 3.1 .9 0 N/A N/A N/A
3 undo block 21,672 95.4 3.7 .9 0 N/A N/A N/A
1 Others 1,909 92.0 6.8 1.2 6,057 89.6 8.9 1.5
4 Others 1,736 92.4 6.1 1.5 5,841 88.8 9.9 1.3
3 Others 1,500 92.4 5.9 1.7 4,405 87.7 10.8 1.6
数据来源 DBA_HIST_INST_CACHE_TRANSFER
Inst No 节点号
Block Class 块的类型
CR Blocks Received 该节点上 该类型 CR 块的接收数量
CR Immed %: CR 块请求立即接收到的比例
CR Busy%:CR 块请求由于远端争用而没有立即接收到的比例
CR Congst%: CR 块请求由于远端负载高而没有立即接收到的比例
Current Blocks Received 该节点上 该类型 Current 块的接收数量
Current Immed %: Current 块请求立即接收到的比例
Current Busy%:Current 块请求由于远端争用而没有立即接收到的比例
Current Congst%: Current 块请求由于远端负载高而没有立即接收到的比例
Congst%的比例应当非常低 不高于 2%, Busy%很大程度受到 IO 的影响,如果超过 10% 一般会有严重的 gc
buffer busy acquire/release
参考文档
Statistics Descriptions http://docs.oracle.com/cd/B19306_01/server.102/b14237/stats002.htm
Memory Configuration and Use http://docs.oracle.com/cd/B19306_01/server.102/b14211/memory.htm
Library Cache Hit
(%) http://docs.oracle.com/cd/B16240_01/doc/doc.102/e16282/oracle_database_help/oracle_database_instance_
efficiency_libcache_hit_pct.html
Oracle® Database Performance Tuning Guide 12c Release 1 (12.1)
How to Interpret the ―SQL ordered by Physical Reads (UnOptimized)‖ Section in AWR Reports (11.2 onwards)
[ID 1466035.1]
© 2013, www.askmaclean.com. 版权所有.文章允许转载,但必须以链接方式注明源地址,否则追求法律责任.

上海 Oracle 用户组 -- SHOUG -- ShangHai Oracle Users Group http://www.shoug.info/
作者个人简介
SHOUG 成员- 刘相兵
(Maclean Liu)
刘相兵 - 网名 Maclean Liu
Shanghai Oracle Users Group (SHOUG) 创始人之一
邮箱和 Gtalk 均是:[email protected]
个人技术博客地址:http://www.askmaclean.com
Maclean Liu 拥有7年数据库领域从业经验,目前在甲骨文公司中国上海工作。
主要客户包括:
工商银行、交通银行、外汇交易中心、中国人寿保险、浦发银行、上海银行、人民银行、银联数据、银
商资讯、太平人寿保险
上海电信、上海联通、上海移动、浙江电信、湖北电信、湖北联通、湖北移动、江苏移动、德邦物流
Maclean Liu 对研究 Oracle 内部原理、新特性、高可用和性能调优饶有兴趣,同时撰写了大量 Oracle 数据
库技术相关的专题文章。
Maclean Liu 愿意通过网络同大家分享 Oracle 知识和经验,也愿意在能力范围能帮助大家解决实际工作中

上海 Oracle 用户组 -- SHOUG -- ShangHai Oracle Users Group http://www.shoug.info/
遇到的问题。