Embed Size (px)
Citation preview

Seite 1 von 16
Product features MAXQDA 2018
MAXQDA Standard MAXQDA Plus
MAXQDA Analytics Pro

Data Types (Import & Analysis) ....................................................... 1 Data Management & Usability ....................................................... 3 Transcription .................................................................................. 4 Qualitative Data Analysis ................................................................ 5 Mixed Methods Analysis ................................................................ 7 Visualization .................................................................................. 8 Teamwork ................................................................................... 10 Report & Publish .......................................................................... 11 User Community, Language Support and Support ....................... 12 Quantitative Text Analysis ............................................................ 13 Statistical Data Analysis ................................................................ 14
MAXQDA Standard
MAXQDA Plus
MAXQDA Analytics Pro
Feature available
Feature not available n.a.
Support, Distribution:
VERBI Software – Consult – Sozialforschung GmbH
[email protected] http://www.maxqda.com
All rights reserved, especially the right of duplication, redistribution, and translation. No part of this document may be reproduced in any form (via photocopy, microfilm, etc.) or reworked without express written consent.
© VERBI Software – Consult – Sozialforschung. GmbH, Berlin 2017.

Product features – MAXQDA 2018, October 10th, 2017 1
Data Types (Import & Analysis)
Standard Plus
Analytics Pro
Text and PDF documents Import text documents from common file formats (.txt, .rtf, .doc/x, .odt). Text documents can be edited in MAXQDA after import. Import PDF files in original format.
Focus groups Import focus group transcripts or other multi-speaker texts with automatic speaker detection & speaker based analysis tools.
Multimedia Import media files from common file formats. Analyze media files directly. Transcribe media. MAXQDA Media player displays waveform, allows analysis down to 10th of a second. Audio Windows: MP3, WAV, WMA, AAC, M4A Audio Mac: MP3, WAV, AAC, CAF, M4A Video Windows/Mac: MP4, MOV, MPG, AVI, M4V, 3GP, 3GGP Video Windows only: WMV
Surveys Import survey data from excel with automatic precoding. Import SPSS data sets (.sav). Import surveys directly from SurveyMonkey.
Spreadsheets Import table documents (.xls/.xlsx). Table view includes common table functionality: sort alphabetically, hide columns, edit or enter text into cells.
Social media Import tweets directly from twitter. Detailed search for tweets, authors, #hashtags languages, locations, etc. Automatically code tweets with #hashtags and @authors. Filter and statistically analyze tweets in new interactive table.
Images Import photos and images (png, jpg, gif, tif). Images can be rotated and zoomed.

Product features – MAXQDA 2018, October 10th, 2017 2
Standard Plus
Analytics Pro
Bibliographical data Import meta information about articles, textbooks, etc. from bibliographical software, like Endnote, Citavi or Zotero, in RIS-format.
MAXApp projects Import projects that were created on a smartphone or tablet with the free field research app "MAXApp" (iOS / Android).
Prestrucutured text documents Import text data from one document, that is automatically coded and split into multiple cases.
Create data in MAXQDA Create new text and table documents to type information directly in MAXQDA, to write down notes, excerpts, etc.
Product features – MAXQDA 2018, October 10th, 2017 3
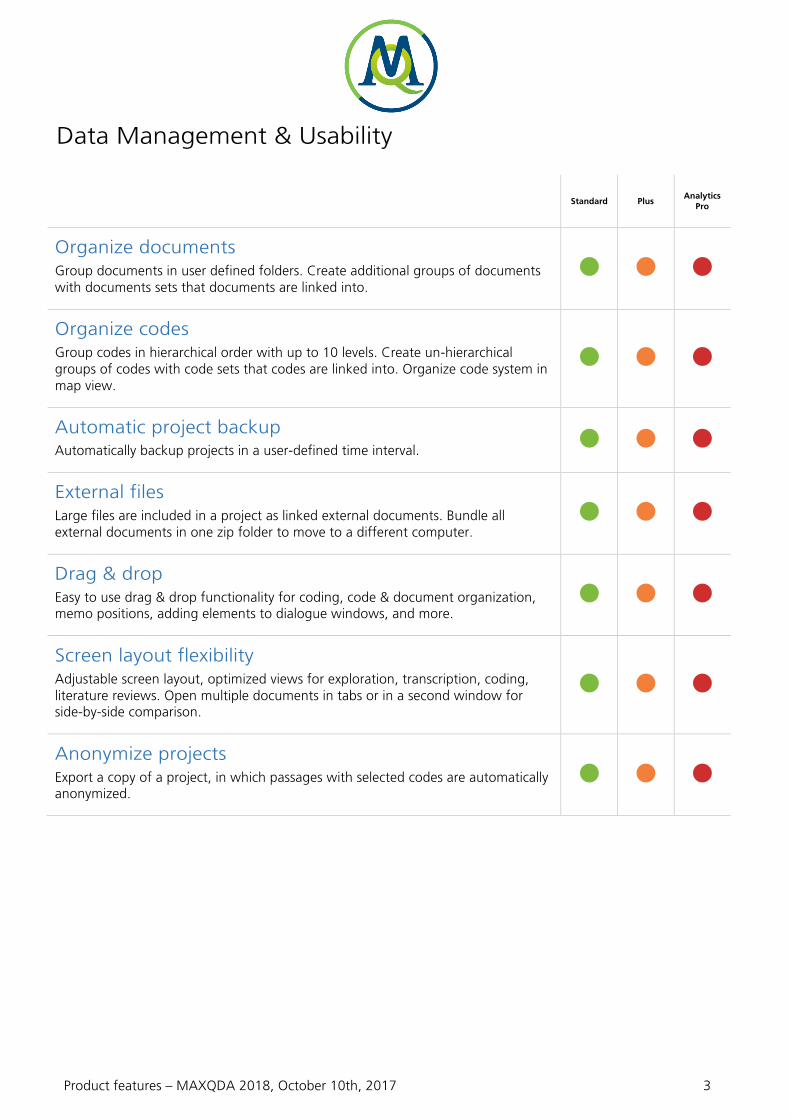
Data Management & Usability
Standard Plus
Analytics Pro
Organize documents Group documents in user defined folders. Create additional groups of documents with documents sets that documents are linked into.
Organize codes Group codes in hierarchical order with up to 10 levels. Create un-hierarchical groups of codes with code sets that codes are linked into. Organize code system in map view.
Automatic project backup Automatically backup projects in a user-defined time interval.
External files Large files are included in a project as linked external documents. Bundle all external documents in one zip folder to move to a different computer.
Drag & drop Easy to use drag & drop functionality for coding, code & document organization, memo positions, adding elements to dialogue windows, and more.
Screen layout flexibility Adjustable screen layout, optimized views for exploration, transcription, coding, literature reviews. Open multiple documents in tabs or in a second window for side-by-side comparison.
Anonymize projects Export a copy of a project, in which passages with selected codes are automatically anonymized.

Product features – MAXQDA 2018, October 10th, 2017 4
Transcription
Standard Plus
Analytics Pro
Transcribe audio and video Speed control, rewind control, automatic timestamps that link media to transcription. Keyboard shortcuts to insert text segment and automatic speaker labels for new paragraphs.
Foot pedal support Increase transcription speed by using foot pedals. Supported foot pedals include Science I and Science II pedals.
Import transcripts with time stamps Time stamp recognition when importing finished transcriptions from another software that uses a supported time stamp format.
Product features – MAXQDA 2018, October 10th, 2017 5
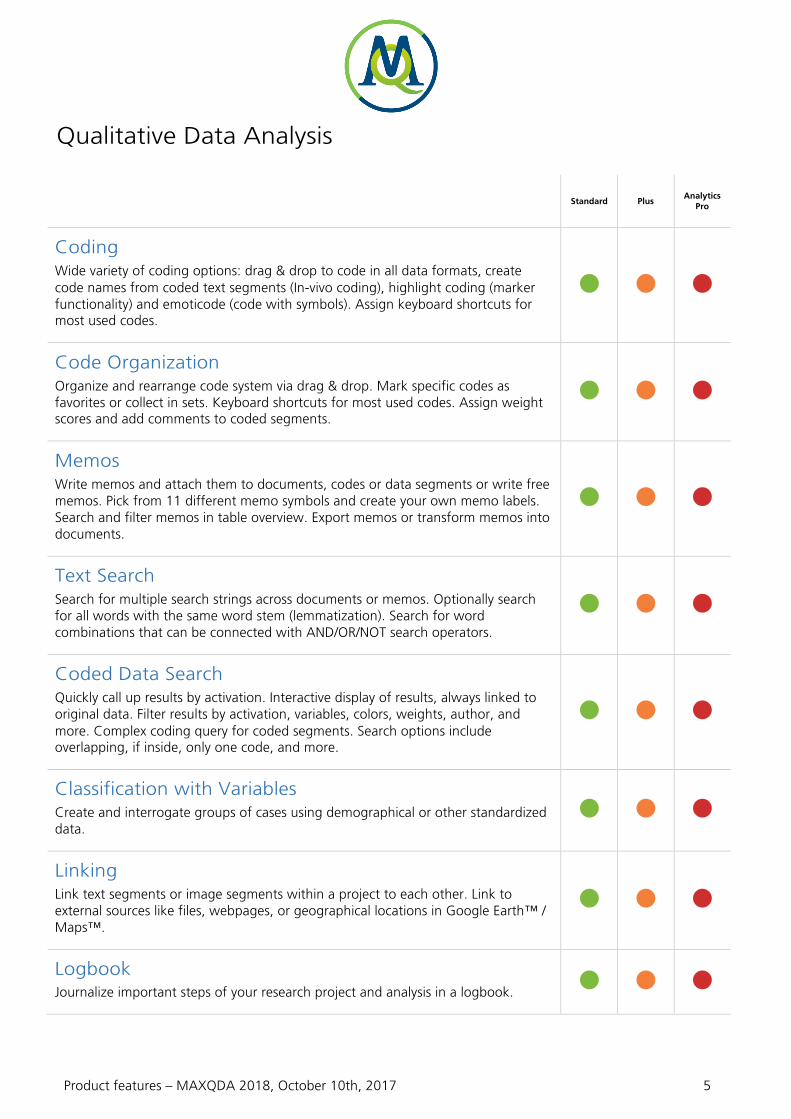
Qualitative Data Analysis
Standard Plus
Analytics Pro
Coding Wide variety of coding options: drag & drop to code in all data formats, create code names from coded text segments (In-vivo coding), highlight coding (marker functionality) and emoticode (code with symbols). Assign keyboard shortcuts for most used codes.
Code Organization Organize and rearrange code system via drag & drop. Mark specific codes as favorites or collect in sets. Keyboard shortcuts for most used codes. Assign weight scores and add comments to coded segments.
Memos Write memos and attach them to documents, codes or data segments or write free memos. Pick from 11 different memo symbols and create your own memo labels. Search and filter memos in table overview. Export memos or transform memos into documents.
Text Search Search for multiple search strings across documents or memos. Optionally search for all words with the same word stem (lemmatization). Search for word combinations that can be connected with AND/OR/NOT search operators.
Coded Data Search Quickly call up results by activation. Interactive display of results, always linked to original data. Filter results by activation, variables, colors, weights, author, and more. Complex coding query for coded segments. Search options include overlapping, if inside, only one code, and more.
Classification with Variables Create and interrogate groups of cases using demographical or other standardized data.
Linking Link text segments or image segments within a project to each other. Link to external sources like files, webpages, or geographical locations in Google Earth™ / Maps™.
Logbook Journalize important steps of your research project and analysis in a logbook.
Product features – MAXQDA 2018, October 10th, 2017 6
Standard Plus
Analytics Pro
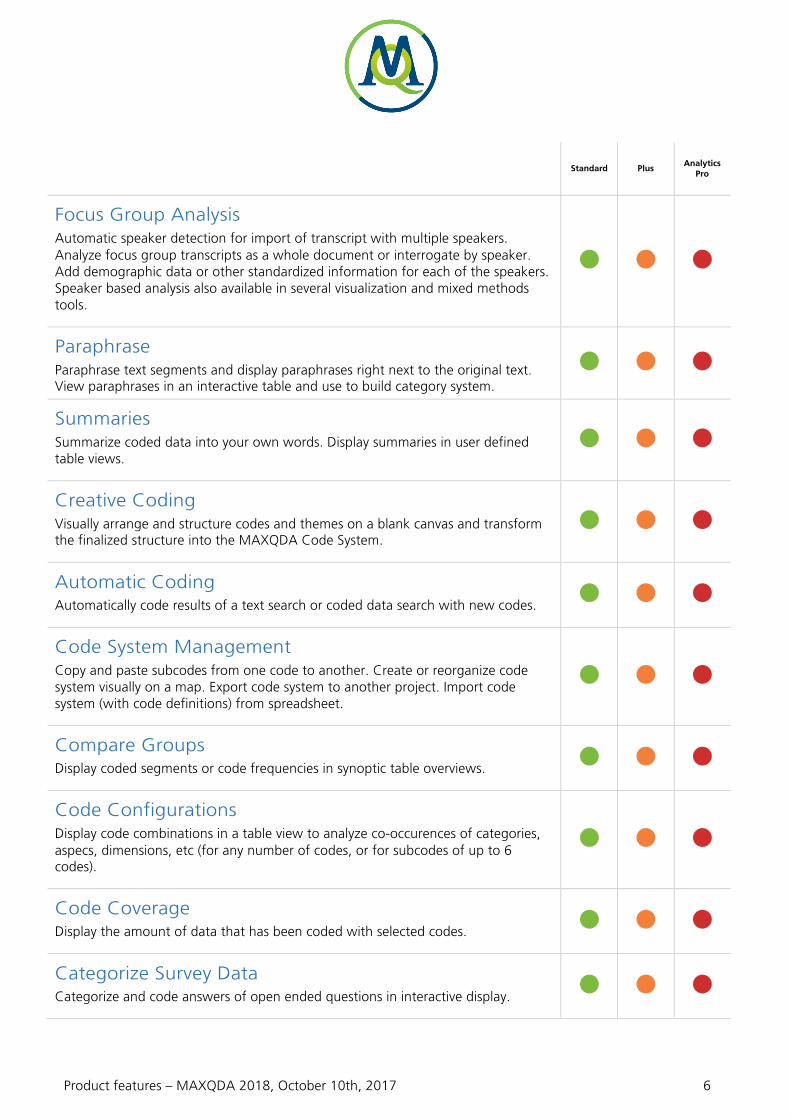
Focus Group Analysis Automatic speaker detection for import of transcript with multiple speakers. Analyze focus group transcripts as a whole document or interrogate by speaker. Add demographic data or other standardized information for each of the speakers. Speaker based analysis also available in several visualization and mixed methods tools.
Paraphrase Paraphrase text segments and display paraphrases right next to the original text. View paraphrases in an interactive table and use to build category system.
Summaries Summarize coded data into your own words. Display summaries in user defined table views.
Creative Coding Visually arrange and structure codes and themes on a blank canvas and transform the finalized structure into the MAXQDA Code System.
Automatic Coding Automatically code results of a text search or coded data search with new codes.
Code System Management Copy and paste subcodes from one code to another. Create or reorganize code system visually on a map. Export code system to another project. Import code system (with code definitions) from spreadsheet.
Compare Groups Display coded segments or code frequencies in synoptic table overviews.
Code Configurations Display code combinations in a table view to analyze co-occurences of categories, aspecs, dimensions, etc (for any number of codes, or for subcodes of up to 6 codes).
Code Coverage Display the amount of data that has been coded with selected codes.
Categorize Survey Data Categorize and code answers of open ended questions in interactive display.
T
T
T
Product features – MAXQDA 2018, October 10th, 2017 7
Mixed Methods Analysis
Standard Plus
Analytics Pro
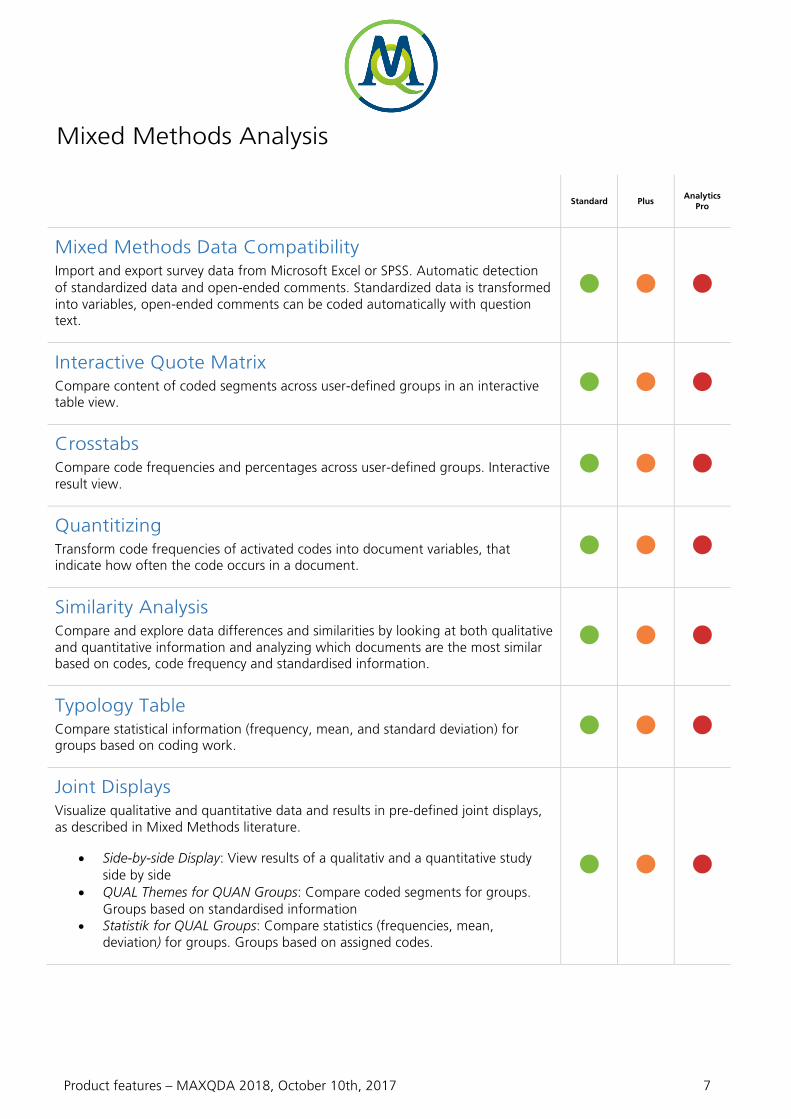
Mixed Methods Data Compatibility Import and export survey data from Microsoft Excel or SPSS. Automatic detection of standardized data and open-ended comments. Standardized data is transformed into variables, open-ended comments can be coded automatically with question text.
Interactive Quote Matrix Compare content of coded segments across user-defined groups in an interactive table view.
Crosstabs Compare code frequencies and percentages across user-defined groups. Interactive result view.
Quantitizing Transform code frequencies of activated codes into document variables, that indicate how often the code occurs in a document.
Similarity Analysis Compare and explore data differences and similarities by looking at both qualitative and quantitative information and analyzing which documents are the most similar based on codes, code frequency and standardised information.
Typology Table Compare statistical information (frequency, mean, and standard deviation) for groups based on coding work.
Joint Displays Visualize qualitative and quantitative data and results in pre-defined joint displays, as described in Mixed Methods literature.
• Side-by-side Display: View results of a qualitativ and a quantitative study side by side
• QUAL Themes for QUAN Groups: Compare coded segments for groups. Groups based on standardised information
• Statistik for QUAL Groups: Compare statistics (frequencies, mean, deviation) for groups. Groups based on assigned codes.

Product features – MAXQDA 2018, October 10th, 2017 8
Visualization
Standard Plus
Analytics Pro
Code visualization Display or hide unlimited amount of coding stripes next to documents, highlight coded segments inside documents with code colors. Choose from millions of user defined code colors.
Memo visualization Visualize memo types with 1 out of 11 memo type icons. Memos visually displayed in text margin, code system, document system. View memo preview at mouse over.
Interactivity Visualizations are interactively connected to project data. Double click on any visualization element to view source data.
MAXMaps Visualize data and findings in map view. Add project data (documents, codes, memos, coded segments) as well as external data (images, links, georeferences) to a map. Add free objects and text fields. Freely arrange, group, or link elements with labeled arrows. Elements stay connected to original source data.
MAXMap - Models Pre-defined models to automatically create concept maps.
• Single-Case Model: Visualize document, a document group or a focus group transcript with memos, codes, and coded segments.
• Single-Code Model with Code Hierarchy: Visualize a document or a group of documents with memos and codes in hierarchical order.
• Two-Cases Model:Visualize two documents and which codes occur in both, or only one.
• Single-Code Model: Visualize code with memos and coded segments. • Code Theory Model: Visualize one or more codes with linked memos. • Code-Subcode-Segment Model: Visualize code with subcodes and coded
segments • Hierarchical Code-Subcodes Model: Visualize a code and its subcode in
hierarchical order. • Code Co-Occurrence Model: Visualize overlapping of codes.
Document Comparison Chart Visually compare code patterns of multiple text documents by paragraph.
Product features – MAXQDA 2018, October 10th, 2017 9
Standard Plus
Analytics Pro
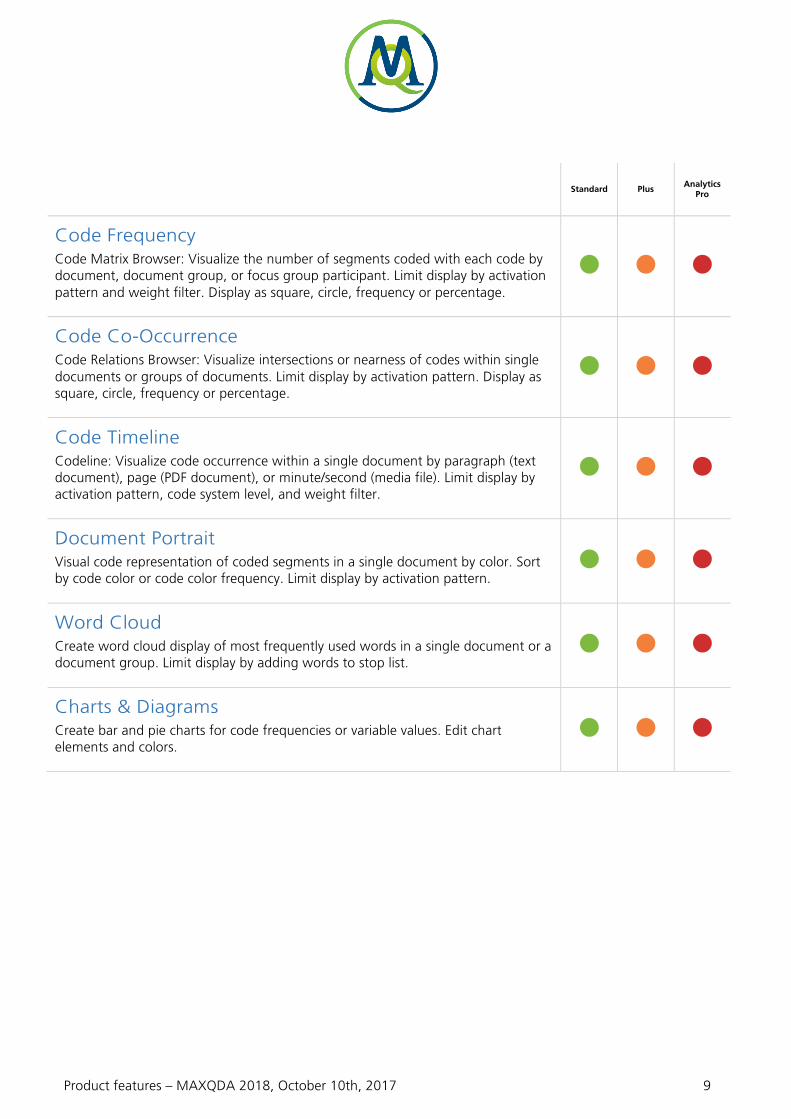
Code Frequency Code Matrix Browser: Visualize the number of segments coded with each code by document, document group, or focus group participant. Limit display by activation pattern and weight filter. Display as square, circle, frequency or percentage.
Code Co-Occurrence Code Relations Browser: Visualize intersections or nearness of codes within single documents or groups of documents. Limit display by activation pattern. Display as square, circle, frequency or percentage.
Code Timeline Codeline: Visualize code occurrence within a single document by paragraph (text document), page (PDF document), or minute/second (media file). Limit display by activation pattern, code system level, and weight filter.
Document Portrait Visual code representation of coded segments in a single document by color. Sort by code color or code color frequency. Limit display by activation pattern.
Word Cloud Create word cloud display of most frequently used words in a single document or a document group. Limit display by adding words to stop list.
Charts & Diagrams Create bar and pie charts for code frequencies or variable values. Edit chart elements and colors.

Product features – MAXQDA 2018, October 10th, 2017 10
Teamwork
Standard Plus
Analytics Pro
Merge Projects Merge several projects into one project file
Transfer Project Elements Transfer specific project elements from one project file to another, e.g. transfer codes you applied to documents to the same documents in a team members project file.
Intercoder Agreement Analyze and discuss how different team members coded the same data. Check intercoder agreement based on code occurrence, code frequency, or code position. Calculate kappa coefficient.
User Roles Assign user roles and permissions to team members (e.g. admin, project manager, coding assistant) to protect your data from unwanted changes. Password protected login for project files.

Product features – MAXQDA 2018, October 10th, 2017 11
Report & Publish
Standard Plus
Analytics Pro
Smart Publisher Create professional and customizable reports of coded data that are ready-for-print. Advanced filtering, sorting and formatting options. Include images, e.g. logo of your institution, on front page.
Table Overviews Export table overviewy for coded segments, memos, codes, links, and summaries.
Codebook Export code system together with code definitions to present category system in reports.
Project Information Export Display project data overview containing the project memo and automatically updated list of standardized project information.
MAXQDA Reader Compatibility Created projects can be opened and viewed with the free MAXQDA Reader software.

Product features – MAXQDA 2018, October 10th, 2017 12
User Community, Language Support and Support
Standard Plus
Analytics Pro
Online Material Full online manual in English and German. Video tutorials for many features. Getting Started Guide for new users.
Context Sensitive Help Help button in every dialogue window jumps directly to corresponding chapter in online help.
Worldwide Trainer Network Global network of professional MAXQDA trainers with detailed profiles on MAXQDA webpage that can be contacted for workshops and consulting.
Free support Free online support for all users of the current and preceding version.
User Forum Active user community discussing technical questions and best-practices in MAXQDA user forum.
Interface language User interface in 15 languages: English, German, Spanish, French, Japanese, Italian, Chinese simplified, Chinese traditional, Portuguese-PT, Portuguese-BR, Russian, Turkish, Thai, Polish, Czech
Data language Analyze data in any language (unicode support), including symbol based languages, for example Chinese, Japanese, or Korean. Supports left-to-right and right-to-left languages.

Product features – MAXQDA 2018, October 10th, 2017 13
Quantitative Text Analysis
Standard Plus
Analytics Pro
Word & Word Combination Frequency List frequencies of words and combinations of up to five words for selected texts or text segments. Interactive display of results. Use stop and go lists to exclude or include words.
Interactive Word Tree Visualize frequencies of word combinations in interactive, tree-like structure. Analyze text leading to and from single words or word combinations.
Keyword-In-Context Search for keywords and display search results including surrounding context in a well-arranged table.
Dictionary based analysis Create and edit dictionaries and queries. Automatically code dictionary entries. Analyze frequencies of dictionary entries differentiated by texts or text groups.
Category Matrix Browser Visualize frequencies of dictionary word categories in a matrix display by document, document group or set.
Lemmatisation Lemmatization of text search results; different forms of a word (feel, feels, feeling) can be grouped together. Available for these languages: Bulgarian, Catalan, Czech, English, Estonian, French, German, Hungarian, Italian, Polish, Portuguese, Spanish, Swedish, Ukrainian.
Product features – MAXQDA 2018, October 10th, 2017 14
Statistical Data Analysis
Standard Plus Analytics
Pro
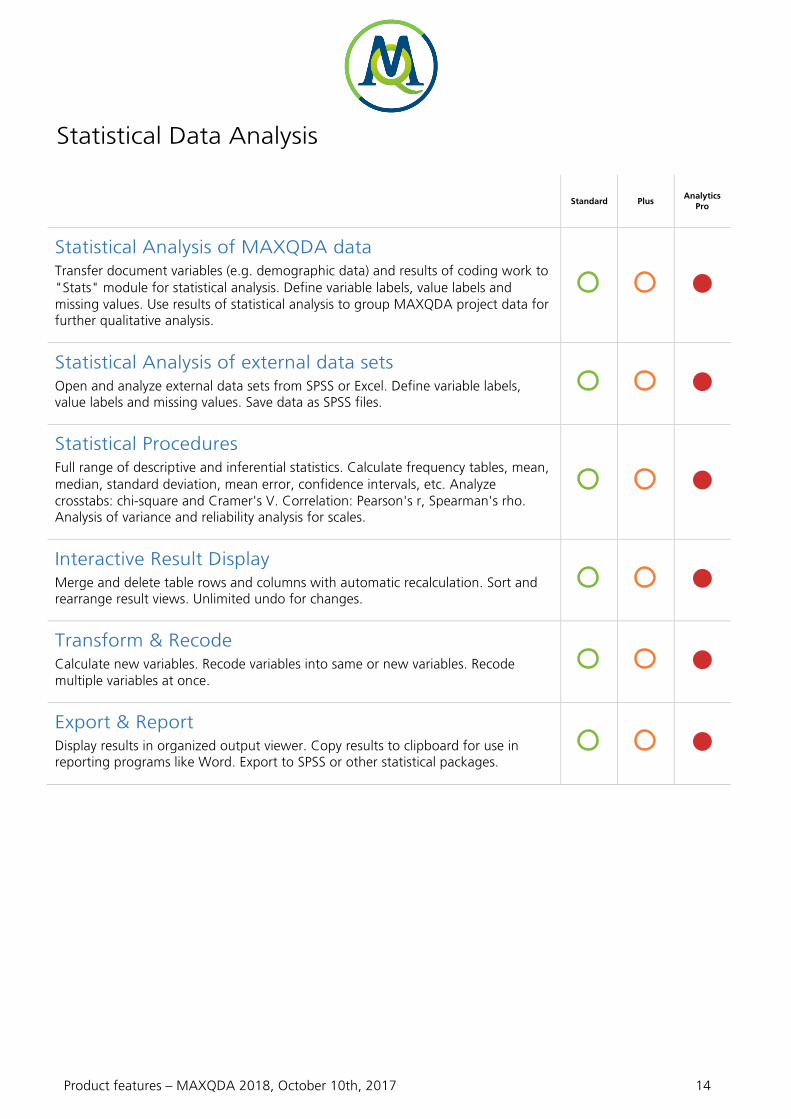
Statistical Analysis of MAXQDA data Transfer document variables (e.g. demographic data) and results of coding work to "Stats" module for statistical analysis. Define variable labels, value labels and missing values. Use results of statistical analysis to group MAXQDA project data for further qualitative analysis.
Statistical Analysis of external data sets Open and analyze external data sets from SPSS or Excel. Define variable labels, value labels and missing values. Save data as SPSS files.
Statistical Procedures Full range of descriptive and inferential statistics. Calculate frequency tables, mean, median, standard deviation, mean error, confidence intervals, etc. Analyze crosstabs: chi-square and Cramer's V. Correlation: Pearson's r, Spearman's rho. Analysis of variance and reliability analysis for scales.
Interactive Result Display Merge and delete table rows and columns with automatic recalculation. Sort and rearrange result views. Unlimited undo for changes.
Transform & Recode Calculate new variables. Recode variables into same or new variables. Recode multiple variables at once.
Export & Report Display results in organized output viewer. Copy results to clipboard for use in reporting programs like Word. Export to SPSS or other statistical packages.