Embed Size (px)
Citation preview

Smart Emission Data Platform
Just van den Broecke, Michel Grothe, Hans Nouwens
RIVM - Bijeenkomst Bilthoven Jan 17, 2017
On behalf of

Intro

Intro
“project EU en gemeenschappelijke voorzieningen, onderdeel van het programma INSPIRE in Nederland”
•2014/2015 - SOSPilot - RIVM http://sensors.geonovum.nl
•2015-2016 1. Smart Emission Nijmegen
http://data.smartemission.nl 2. AirSensEUR 3. OGC SensorThings API (SensorUp, Steve Liang) 4. FIWARE 5. LoRa - TheThingsNetwork

Smart Emission
Inclusive Citizen Sensing ▪ Citizen-sensor-networks for fine-grained measurements,
with new low-cost sensing devices ▪ Transparency and democracy of pollution monitoring,
‘making the externalities (e.g. noise, air pollution) visible’ ▪ Cost-effective environmental monitoring, Open Data.
Making LML AQD IPR and INSPIRE compliant

1. Deployment of a local air quality network using low-cost sensors
- What is the quality of low-cost sensors in general? - Which type of low cost sensors to deploy? - How to calibrate the low-cost sensors? - How many and at what locations (spatial pattern) to deploy the sensors? - What data platform for data collection and distribution? - Which standards for data acquisition and distribution? - Which (interpolation) models for further processing air quality data? - How to visualize the results?
2. Involvement of citizens in the deployment and maintenance of the sensor network
– Which method to use for citizen engagement? – Do we need to train citizens to deploy and maintain the sensor?
3. Involvement of citizens in the analysis of the results of local air quality monitoring
– How to engage citizens? – How to preprocess and visualize the data for citizens? – How to interact with citizens? – How and when to meetup with citizens? – What applications will the citizens need?
Issues and questions to deal with

Which type of low cost sensors to deploy?
Quality and price
Number of sensors applied in a city
Smart Emission “Jose”
Aireas “Airbox”
“Smart Citizen Kit”
National Air Quality stations

Jose Multi-Purpose Sensor Station - Intemo
Temperature
Sound pressure
Light intensity, light colorGasses (CO, CO2, NO2, O3 )
Rainfall
Air pressure
Tilting (x-y-z)
HumidityGeolocation

Open Data!
Data open available for citizens, researchers, students, government, companies, …
Data available for download in tabular and (OGC) geospatial formats: WMS-Time WFS SOS STA

Data Platform

Data Processing Platform
Data Collection Platform
WMS WFS SOS STA
Client Apps
Data Infrastructure The Big Picture

Data Processing Platform
Data Architecture with ETL
ETL = Extract Transform Load

Data Processing Platform
Data Architecture with 3-Step ETL
Postgres/GIS DB + InfluxDB
SOS Harvester
RIVM SOS

Platform Functioneel: Lagen
WebHeron Viewer
Smart App
52North SOSViewer
Grafana Website data.smartemission.nl Beheer
AppServers GeoServer52North
SOSSensorUp
STA
Databases PostGIS InfluxDB
Processing (ETL)
Calibrator RefinerSOS
PublisherSTA
Publisher
HarvestersCityGIS
HarvesterSOS
Harvester


Viewers
http://data.smartemission.nl (data platform)
Heron Viewer
Smart App
52North JSClient
Grafana
In SE Platform
Extern

Kalibratie ETL

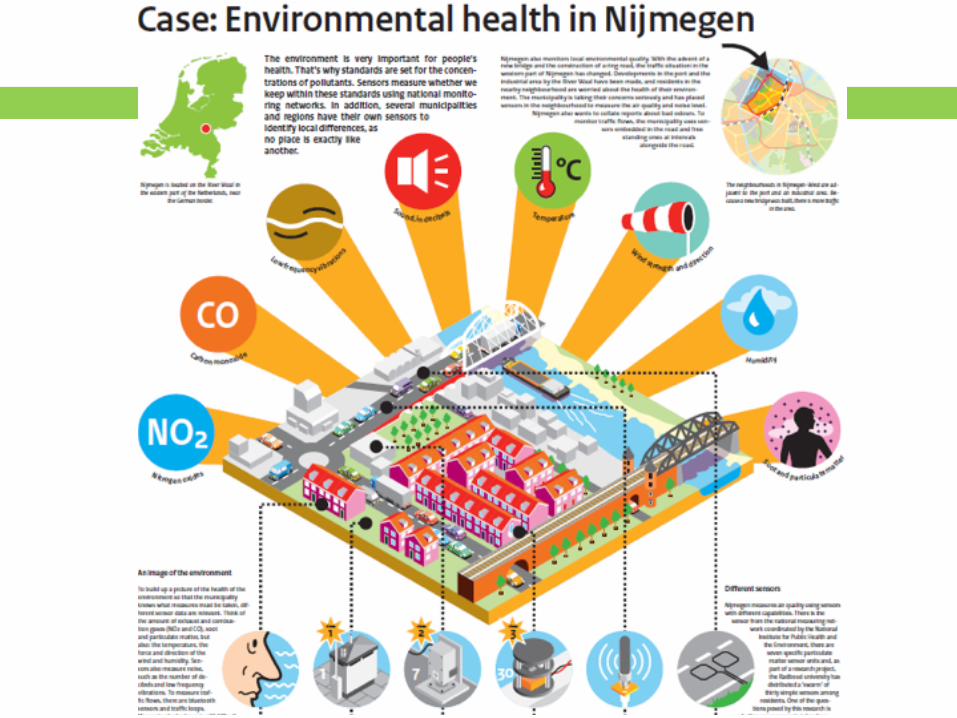
How to calibrate the low-cost sensor for air quality?
Calibration at two national air quality locations by and in the City of Nijmegen and in laboratory setting at the National Institute of Environment and Health (RIVM)

ETL Implementation Details• Python • Stetl “Streaming ETL” - base ETL framework: http://stetl.org • Docker deployment • Crontab scheduling • Open Source: https://github.com/Geonovum/smartemission/tree/master/etl • Artificial Neural Networks (ANN) for Gas Calibration (by Pieter Marsman)
- R (preprocessing) - sklearn http://scikit-learn.org

Calibration ETL
▪ InfluxDB - timeseries database ▪ Grafana - Dashboard voor visualisatie
▪ Harvesting van RIVM LML data uit RIVM SOS ▪ Kalibratie via ETL met ANN Models in PostGIS ▪ Publicatie vanuit AirSensEUR naar InfluxDB ▪ Ruwe en gekalibreerde data beschikbaar via InfluxDB en Grafana
Componenten
Functioneel

Data Processing Platform
Datastroom Kalibratie
RIVM 52N SOS (REST) Jose Intemo Data
Harvesters
InfluxDB
ANN Kalibratie
InfluxDB API
PostGIS
SOSWMSSTA GrafanaWFS

RIVM LML in InfluxDB

Grafana Dashboard + InfluxDB

Grafana Dashboard + InfluxDB

OGC SensorThings API
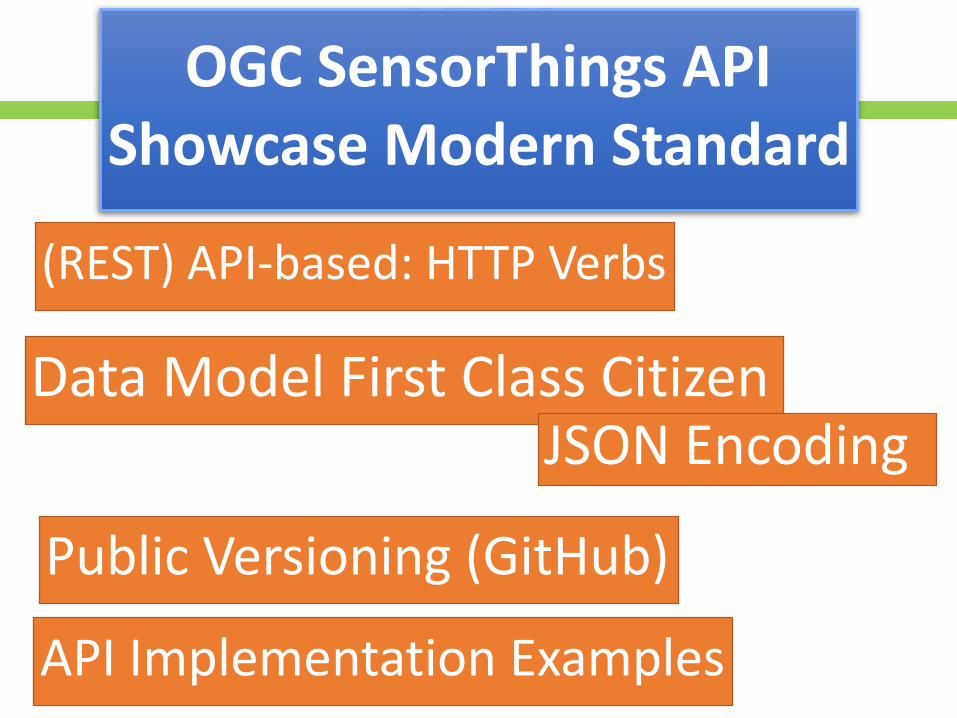
OGC SensorThings API Showcase Modern Standard
(REST) API-based: HTTP Verbs
Data Model First Class Citizen
Public Versioning (GitHub)
API Implementation Examples
JSON Encoding

SensorThings API Model

Bevindingen
▪ Probeer online community te faciliteren ▪ Onderschat kalibratie niet
▪ Ontsluit met meerdere standaarden: WMS-Time, WFS en SOS, STA (WCS)
▪ Facilities bulk download in meerdere formaten: GML, JSON, CSV, Excel etc
▪ Bulk download prima via WFS ▪ SOS verbleekt bij STA
▪ Docker maakt deployment eenvoudig

Dank U!Links:
Smart Emission http://www.smartemission.nl (website) http://data.smartemission.nl (data platform) https://github.com/Geonovum/smartemission (broncode) http://smartplatform.readthedocs.io (documentation)
Making Sense for Society http://www.geonovum.nl/onderwerpen/sensor-geo-informatie/algemeen-living-lab-internet-everything
We would like to acknowledge for their valuable input: All partners of the Smart Emission Consortium
Contact