Embed Size (px)
Citation preview

Predictive Analytics Что такое предиктивная аналитика и кому она
нужна
Надежда Ручанова, Михаил Аветисов
Октябрь 10, 2015
Public

© 2015 SAP or an SAP affiliate company. All rights reserved. 2Public
Massive amounts of data lead to
new opportunities...
Transactions Conversations Machines
2© 2015 SAP SE or an SAP affiliate company. All rights reserved.

© 2015 SAP or an SAP affiliate company. All rights reserved. 4Public
Simplify Innovate Accelerate
Creating business value
4© 2015 SAP SE or an SAP affiliate company. All rights reserved.

© 2015 SAP or an SAP affiliate company. All rights reserved. 6Public
Extend your analytics capabilities to where you want to
be…C
om
peti
tive a
dvan
tag
e
Analytics maturity
Sense and respond Predict and act
Raw
data
Cleaned
data
Standard
reports
Ad hoc
reports
and OLAP
Generic
predictive
analytics
Predictive
modeling
Optimization
What happened?
Why did it happen?
What will happen?
What is the best that
could happen?
The key is unlocking data to move decision making from sense and respond to predict and act
6© 2015 SAP SE or an SAP affiliate company. All rights reserved.

© 2015 SAP or an SAP affiliate company. All rights reserved. 7Public
It’s no longer enough to sense and respond
Challenging to
detect meaningful
signals in Big Data
Severe analytics
skills shortage 50%-60% shortfall for experienced
data analystsDun & Bradstreet and McKinsey Global Institute
analysis
68% of organizations
that used predictive
analytics realized a
competitive advantageVentana Research
Difficult to embed
predictive tools into
end-user apps and
business process
to have impact on
business
7© 2015 SAP SE or an SAP affiliate company. All rights reserved.

© 2015 SAP or an SAP affiliate company. All rights reserved. 8Public
Predictive analytics – vision
Bringing predictive
analytics to a broad
spectrum of users
Operationalize predictive
and optimization models
across the enterprise
Reduce decision latency
with advanced analytics
Embed smart, agile analytics into decision
processes to deliver business impact
Easy Fast Efficient
8© 2015 SAP SE or an SAP affiliate company. All rights reserved.

© 2015 SAP or an SAP affiliate company. All rights reserved. 9Public
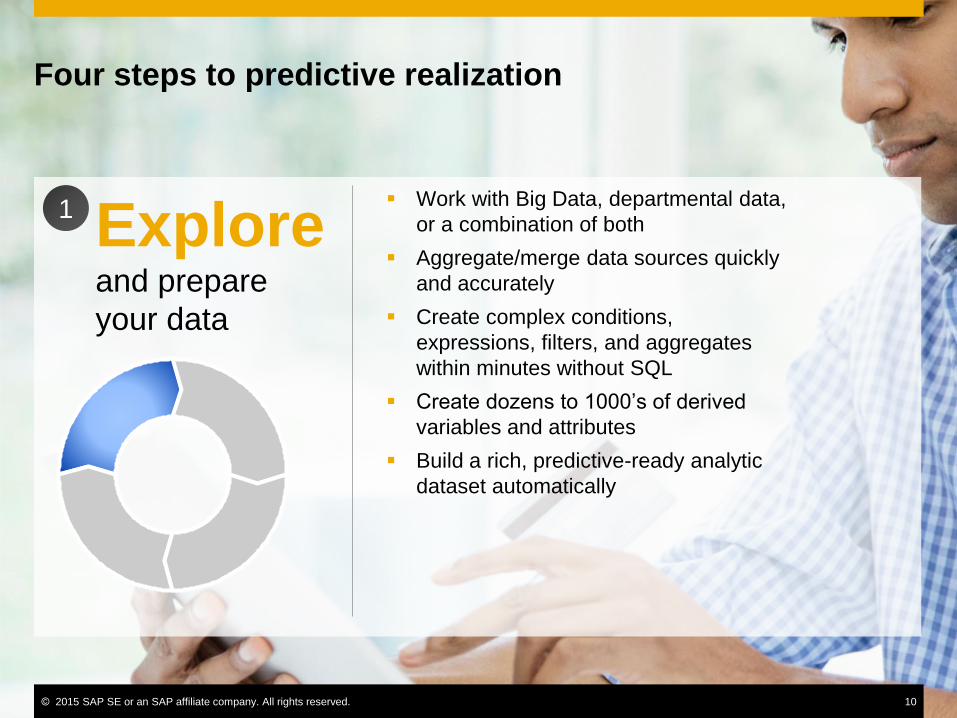
Four steps to predictive realization
Exploreand prepare
your data
Design and validate
your model
Deployprocesses and
actions
Analyze and optimize
the results
1 2
34
9© 2015 SAP SE or an SAP affiliate company. All rights reserved.
© 2015 SAP or an SAP affiliate company. All rights reserved. 10Public
Four steps to predictive realization
Exploreand prepare
your data
1 Work with Big Data, departmental data,
or a combination of both
Aggregate/merge data sources quickly
and accurately
Create complex conditions,
expressions, filters, and aggregates
within minutes without SQL
Create dozens to 1000’s of derived
variables and attributes
Build a rich, predictive-ready analytic
dataset automatically
10© 2015 SAP SE or an SAP affiliate company. All rights reserved.

© 2015 SAP or an SAP affiliate company. All rights reserved. 11Public
Four steps to predictive realization
Design and validate
your model
2 Fully automated modeling process for:
Regression & Classification
Clustering/Segmenting
Forecasting
Social & Link Analysis
Textual Analysis
Geolocation
Model in confidence with automated
optimization techniques or manual
techniques
Ensure training data passes validation
and estimation processes
11© 2015 SAP SE or an SAP affiliate company. All rights reserved.

© 2015 SAP or an SAP affiliate company. All rights reserved. 12Public
Four steps to predictive realization
Analyze and optimize
the results
3 Measure performance of training and
test data sets for accuracy and
confidence
Create simulations to maximize gain
and apply model to new data
View statistical and graphical reports of
performance, gain/lift, and more
Visualize predictive information in BI
Tools, MS Excel, and other analytic
platforms
12© 2015 SAP SE or an SAP affiliate company. All rights reserved.

© 2015 SAP or an SAP affiliate company. All rights reserved. 13Public
Four steps to predictive realization
Deployprocesses and
actions
4 One-click deployment of results, scores,
recommendations, etc. into production
In-database scoring (SQL)
Interface with business apps via scoring
equations in:
Databases
ERP/CRM solutions
JAVA, C, and more
Refresh analytic data sets and models
automatically when changes occur
Alert on data and model deviations
13© 2015 SAP SE or an SAP affiliate company. All rights reserved.

© 2015 SAP or an SAP affiliate company. All rights reserved. 14Public
Increase your predictive adoption
Low learning curve for novice
users
Intuitive user interface with code-
free experience
Modeling automation for fast
results
Algorithms and model types are
fine-tuned automatically
Creation of rich visualizations,
analytic stories, and publishing
Business User
ONE SOLUTION, MULTIPLE MODES
Expert User
Similar learning curve for expert
users
User interface that supports rapid
model fine-tuning
Smart variable selection and
simulation capabilities
Algorithms are configurable with
ability to use custom R
Use of statistical reports to confirm
reliability of model
14© 2015 SAP SE or an SAP affiliate company. All rights reserved.
© 2015 SAP or an SAP affiliate company. All rights reserved. 15Public
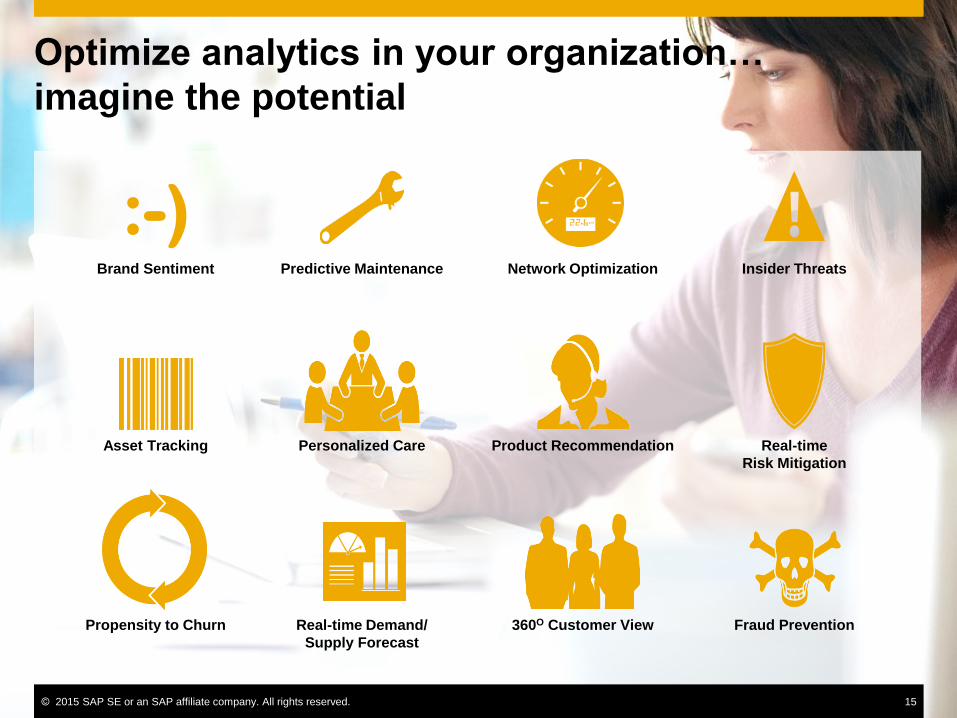
Optimize analytics in your organization…
imagine the potential
:-)Brand Sentiment
360O Customer View
Product Recommendation
Propensity to Churn Real-time Demand/
Supply Forecast
Predictive Maintenance
Fraud Prevention
Network Optimization Insider Threats
Real-time
Risk Mitigation
Asset Tracking Personalized Care
15© 2015 SAP SE or an SAP affiliate company. All rights reserved.

© 2015 SAP or an SAP affiliate company. All rights reserved. 16Public
Categorical uses of predictive
analytics
CRM Risk
Operations Fraud
Predictive
Analytics
• Customer targeting
• Churn reduction
• Cross Sell / Up Sell
• Viral campaigns
• Segmentation
• Forecasting
• Predictive
maintenance
• Usage forecasting
• Credit scoring
• Compliance
• Crime/Terrorism
• Impact analysis
• Credit card fraud
• Online fraud
• Insurance fraud
• Tax fraud
16© 2015 SAP SE or an SAP affiliate company. All rights reserved.

© 2015 SAP or an SAP affiliate company. All rights reserved. 20Public
The SAP difference
Completeend-to-end
analytics solution#1 leader
in analytics*
65,000+analytics
customers
13,000+ partners with proven
track record of success
*Gartner, Market Share Analysis:
Business Intelligence and Analytics Software, 2013
20© 2015 SAP SE or an SAP affiliate company. All rights reserved.

© 2015 SAP or an SAP affiliate company. All rights reserved. 21Public
Unleash your collective insight today
Engage SAP in a design thinking workshop today
sapbusinessobjectsbi.com sap.com/predictivesaplumira.com
ENGAGE PREDICTVISUALIZE
Real-time platformsaphana.com
21© 2015 SAP SE or an SAP affiliate company. All rights reserved.

© 2015 SAP or an SAP affiliate company. All rights reserved. 22Public
Next Steps
DEMONSTRATION!
1 Read customers case studies www.sap.com/predict-and-me
Learn more and watch it in actionwww.sap.com/predictive & http://scn.sap.com/docs/DOC-32651
2
© 2014 SAP AG or an SAP affiliate company. All rights reserved. 23
Thank you
23© 2015 SAP SE or an SAP affiliate company. All rights reserved.
Nadezhda Ruchanova
Deputy Country Manager, RU-RCIS-Belarus
Minsk, Nemiga Street 40, 220004, Minsk, Belarus
T +375 17 226-5400, M +375 29 7521246, E [email protected]

© 2015 SAP SE or an SAP affiliate company. All rights reserved. Customer 1
Как работает прогнозная аналитика
С
вероятностью
60% уйдёт от
нас
Готова
заказать
ещё кофе
Если предложить
доп. скидку, будет
приходить в 2 раза
чаще
Вероятность активации нашей
карты, присланной по почте
29%
Ожидаемый
доход для нас: 50
р/мес

© 2015 SAP SE or an SAP affiliate company. All rights reserved. Customer 2
Готова
заказать
ещё кофе
Пол Возраст Дети Последний
контакт …
Заказал
2 кофе
Жен 32 Да 23-06-2014 ДА
Муж 21 Да Нет
Жен 43 Нет ДА
Муж 35 Да 12-07-2014 ДА
Муж 28 Нет ДА
Жен 17 Да Нет
Муж 30 Да Нет
Муж 44 Нет Нет
Жен 18 Нет ДА
Муж 25 Да Нет
Построение
Модель
Пол Возраст Дети Последний
контакт …
Заказал
2 кофе
Жен 29 Да 01-10-2014 ?
История Понимание Прогноз Оптимизация Действие
Применение

© 2015 SAP SE or an SAP affiliate company. All rights reserved. Customer 3
Какие задачи решает прогнозная аналитика?
Классификация
Кто (купит | смошенничает | уйдёт …) в следующем (месяце | квартале | году…) ?
Регрессия
Какой будет (выручка | отток … ) в следующем (месяце | квартале)?
Прогноз Как будет меняться ((выручка | отток … ) в следующем году по месяцам?
Рекомендации Что предложить моему клиенту вместе с тем, что он уже (купил | посмотрел | отложил)?
Сегментация
Какие группы клиентов с общим (поведением | профилем …) у меня есть?
Анализ связей
Анализ взаимодействий для выявления (сообществ | лидеров…)

© 2015 SAP SE or an SAP affiliate company. All rights reserved. Customer 4
Теория минимизации структурного риска
Основной проблемой при построении прогнозной модели является её
переобучение, то есть ситуация, когда ошибка модели на тестовых
данных намного превышает ошибку модели на обучающих данных
Владимир Вапник и Алексей Червоненкис показали, что разница
между ошибкой на обучающих и тестовых данных а) вычисляема, б)
зависит только от двух показателей: сложности модели и количества
наблюдений
Они предложили меру сложности моделей, называемую VC-
Dimension (размерность Вапника-Червоненкиса)
«Вапник, это Ньютон сегодня»
Недообученная модель Обученная модель Переобученная модель

Задача 1: Кредитный скоринг
Задача построения моделей
оценки вероятности дефолта
• По историческим данным
связать известные данные о
клиенте с фактом
невозврата кредита
• По новым данным оценить
вероятность невозврата
кредита
ID Пол Возр Долж … atr n Дефолт
1 М 32 Нач.отд 60 000 НЕТ
2 Ж 25 бухг 45 000 ДА
ID Пол Возр Долж … atr n Дефолт Прогноз
1102 М 42 директ 120 000 ? 0,5
1103 Ж 21 секрет 25 000 ? 0,2
Построение Модель
Применение

© 2015 SAP SE or an SAP affiliate company. All rights reserved. Customer 6
Задача 2. Управление качеством
Задача прогнозирования
возникновения дефектов
• По историческим данным
связать параметры
процесса разливки стали с
фактом вознкновения
дефекта
• Выбрать для контроля
слябы с наибольшей
вероятностью дефектов
• Подобрать для нового
ковша стали параметры
литья, снижающие
вероятность
возникновения дефекта
Машина непрерывного литья стали

© 2015 SAP SE or an SAP affiliate company. All rights reserved. Customer 7
От отчетов, через понимание причин, к прогнозам
Исходные
данные
Очищенные
данные
Жесткие
отчёты
Отчёты
«на лету»
и OLAP
Визуальный
анализ
Прогнозное
моделирование
Оптимизация
Что происходило
и происходит?
Почему это
произошло?
Что произойдёт?
Что сделать, чтобы
произошло самое
лучшее?
Отд
ач
а д
ля
би
зн
еса
Развитие аналитических возможностей
Business Intelligence
Общая
прогнозная
аналитика
Прогнозная
Аналитика:
Понимание
Симуляция
Прогноз
Оптимизация

© 2015 SAP SE or an SAP affiliate company. All rights reserved. Customer 8
Данные – материнское молоко анализа
Традиционный аналитик
Думает, что ещё можно сделать с
данными
Поменять атрибуты
Применить сглаживание
Перебалансировать выборку
Применить другой алгоритм
…
Современный Аналитик
Знает, что модель уже извлекла всё
что можно из данных…
и думает, какие ещё можно взять
данные
Скомбинировав существующие
Добавив данные из других источников
Поведенческие данные – важный источник информации об объектах
В случае недостаточно хорошей модели

© 2015 SAP SE or an SAP affiliate company. All rights reserved. Customer 9
Задача 4. Построение системы персональных рекомендаций
2 клиента связаны если они
Смотрят одинаковые фильмы
или покупают в одних и тех же местах
или посещают одинаковые страницы
Действия:
Связанные клиенты образуют «сообщества»
Предложить клиенту продукты, популярные в его
«сообществе»
Bipartite Graph
Client 1 Product 1
Client 2
Client 3
Client 4
Product 2
Product 3
Product 4
Client 4
Client 1
Client 2
Client 3
2
1 1
Микросегменты
клиентов
2
Product 3
Product 2
Product 1
Product 4
1
Микросегменты
продуктов