Embed Size (px)
Citation preview
The Basic Activities of JSC Lenenergo
2
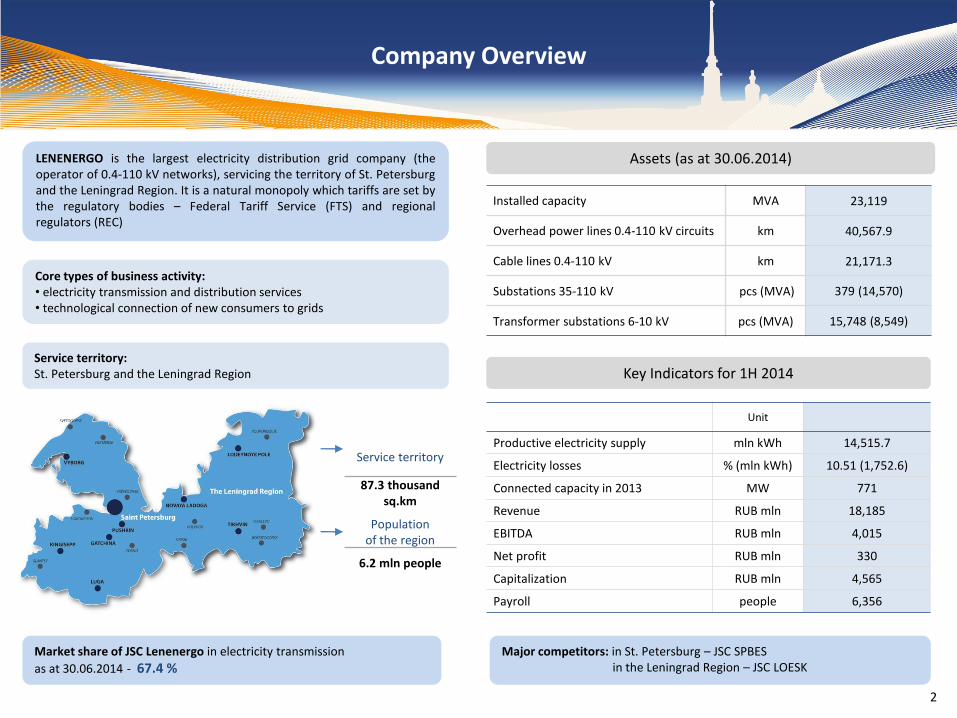
Core types of business activity: • electricity transmission and distribution services • technological connection of new consumers to grids
Service territory: St. Petersburg and the Leningrad Region
Service territory
87.3 thousand sq.km
Population of the region
6.2 mln people
Market share of JSC Lenenergo in electricity transmission
as at 30.06.2014 - 67.4 % Major competitors: in St. Petersburg – JSC SPBES in the Leningrad Region – JSC LOESK
Assets (as at 30.06.2014)
Unit
Productive electricity supply mln kWh 14,515.7
Electricity losses % (mln kWh) 10.51 (1,752.6)
Connected capacity in 2013 MW 771
Revenue RUB mln 18,185
EBITDA RUB mln 4,015
Net profit RUB mln 330
Capitalization RUB mln 4,565
Payroll people 6,356
Key Indicators for 1H 2014
Installed capacity MVA 23,119
Overhead power lines 0.4-110 kV circuits km 40,567.9
Cable lines 0.4-110 kV km 21,171.3
Substations 35-110 kV pcs (MVA) 379 (14,570)
Transformer substations 6-10 kV pcs (MVA) 15,748 (8,549)
LENENERGO is the largest electricity distribution grid company (the operator of 0.4-110 kV networks), servicing the territory of St. Petersburg and the Leningrad Region. It is a natural monopoly which tariffs are set by the regulatory bodies – Federal Tariff Service (FTS) and regional regulators (REC)
Company Overview
3
Company Structure
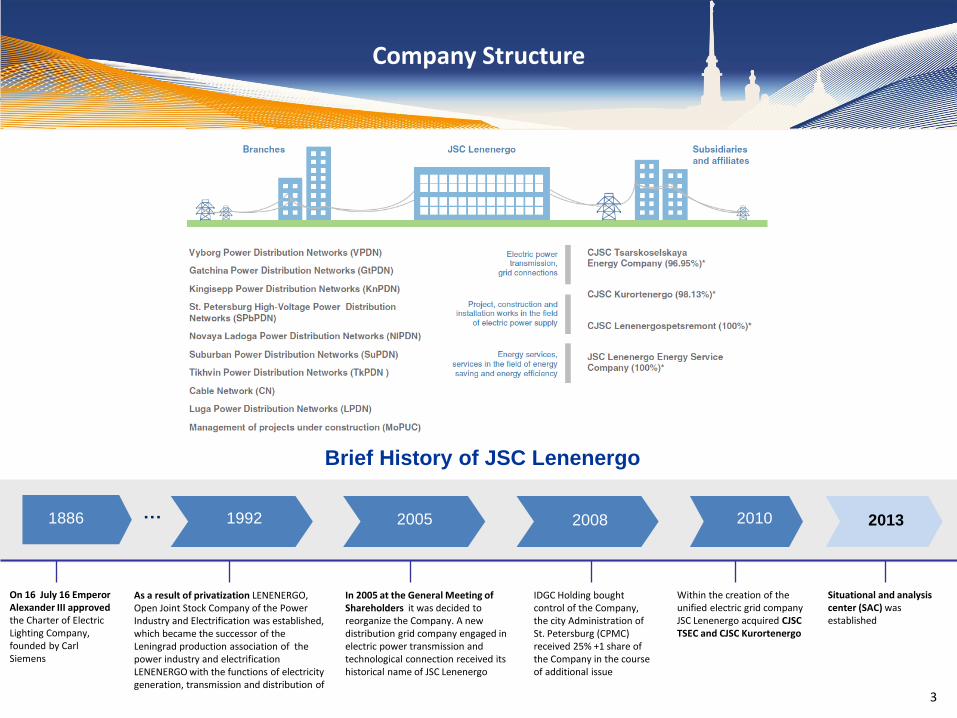
IDGC Holding bought control of the Company, the city Administration of St. Petersburg (CPMC) received 25% +1 share of the Company in the course of additional issue
On 16 July 16 Emperor Alexander III approved the Charter of Electric Lighting Company, founded by Carl Siemens
1886 1992 … 2005 2008
In 2005 at the General Meeting of Shareholders it was decided to reorganize the Company. A new distribution grid company engaged in electric power transmission and technological connection received its historical name of JSC Lenenergo
As a result of privatization LENENERGO, Open Joint Stock Company of the Power Industry and Electrification was established, which became the successor of the Leningrad production association of the power industry and electrification LENENERGO with the functions of electricity generation, transmission and distribution of
2010
Within the creation of the unified electric grid company JSC Lenenergo acquired CJSC TSEC and CJSC Kurortenergo
2013
Brief History of JSC Lenenergo
Situational and analysis center (SAC) was established
Business Model
4
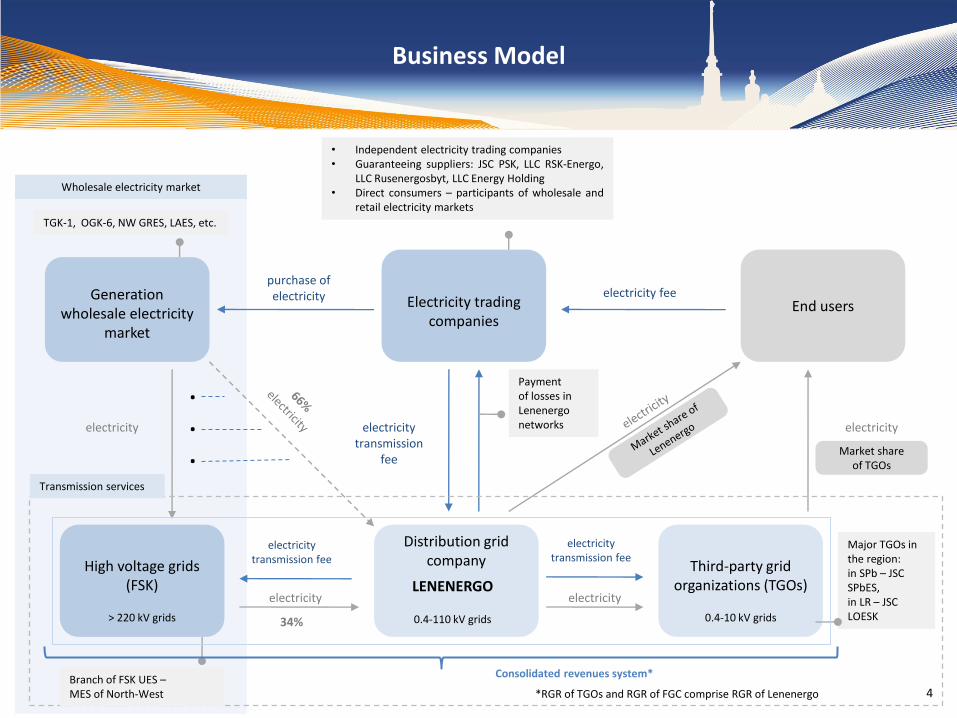
High voltage grids (FSK) LENENERGO
Third-party grid organizations (TGOs)
Electricity trading companies
End users Generation
wholesale electricity market
Major TGOs in the region: in SPb – JSC SPbES, in LR – JSC LOESK
• Independent electricity trading companies • Guaranteeing suppliers: JSC PSK, LLC RSK-Energo,
LLC Rusenergosbyt, LLC Energy Holding • Direct consumers – participants of wholesale and
retail electricity markets
Payment of losses in Lenenergo networks
TGK-1, OGK-6, NW GRES, LAES, etc.
Consolidated revenues system*
electricity fee purchase of electricity
electricity transmission
fee
electricity transmission fee
electricity
electricity electricity
0.4-110 kV grids 0.4-10 kV grids > 220 kV grids
electricity
*RGR of TGOs and RGR of FGC comprise RGR of Lenenergo
Transmission services
Distribution grid company
electricity transmission fee
Market share of TGOs
.
.
.
Branch of FSK UES – MES of North-West
Wholesale electricity market
34%
5
Securities
Capitalization** of JSC Lenenergo, RUB mln
*** In accordance with the Charter of JSC Lenenergo dividends are accrued on A-type preferred shares in the amount of 10% of Net profit following the results of the completed fiscal year. The sum of dividends for 2013 amounted to 25% of the Company’s Net profit for 2013.
Dividends payment***
** Calculation of the capitalization was produced at a weighted average price on MICEX Stock Exchange at the end of the period
Capitalization on
MICEX SE, RUB mln
(at a weighted
average price)
31.12.2011 31.12.2012 31.12.2013 29.08.2014
11,139 7,759 3,742 4,484
Year Dividends on
ordinary shares, RUB per 1 ordinary share
Dividends on preferred shares,
RUB per 1 preferred share
Accrued dividends, RUB thousand
For 2011 No 1.5198 141,742
For 2012 0.163119 1.32347 308,583
For 2013 0.0391 0.4556 106,000
Authorized capital 1,752,079,150.05
Ordinary shares* 1,658,814 839.05
Preferred shares 93,264,311
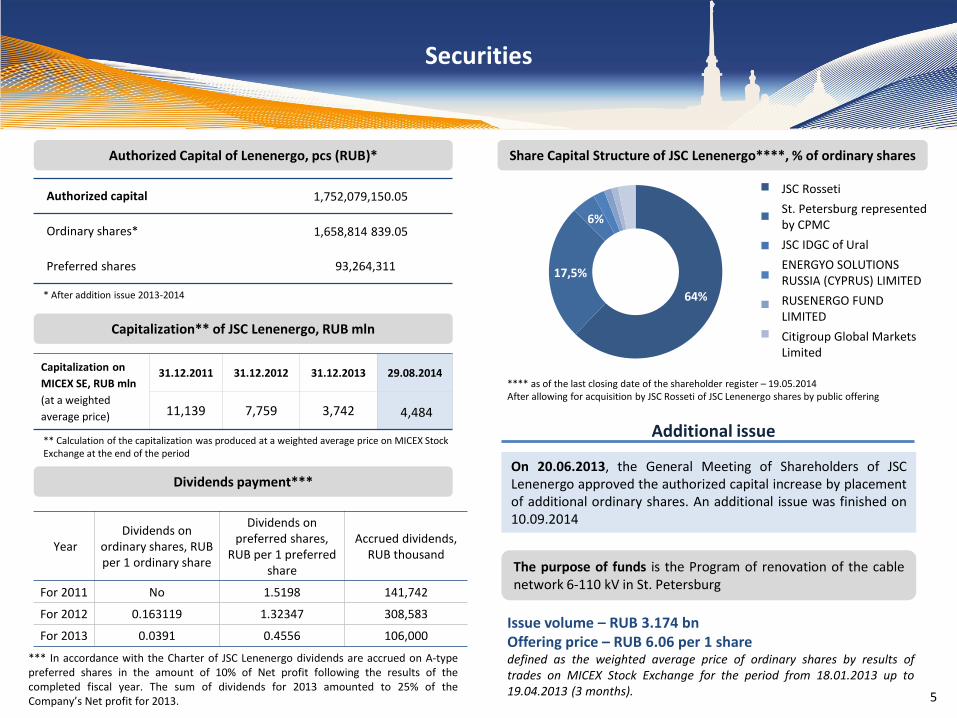
Authorized Capital of Lenenergo, pcs (RUB)* Share Capital Structure of JSC Lenenergo****, % of ordinary shares
The purpose of funds is the Program of renovation of the cable network 6-110 kV in St. Petersburg
Issue volume – RUB 3.174 bn Offering price – RUB 6.06 per 1 share defined as the weighted average price of ordinary shares by results of trades on MICEX Stock Exchange for the period from 18.01.2013 up to 19.04.2013 (3 months).
On 20.06.2013, the General Meeting of Shareholders of JSC Lenenergo approved the authorized capital increase by placement of additional ordinary shares. An additional issue was finished on 10.09.2014
Additional issue
**** as of the last closing date of the shareholder register – 19.05.2014 After allowing for acquisition by JSC Rosseti of JSC Lenenergo shares by public offering
64%
17,5%
6%
ОАО Россети
г. Санкт-Петербург в лице КУГИ ОАО МРСК Урала
ENERGYO SOLUTIONSRUSSIA (CYPRUS) LIMITEDRUSENERGO FUNDLIMITEDCitigroup Global MarketsLimited
JSC Rosseti
St. Petersburg represented by CPMC
JSC IDGC of Ural
ENERGYO SOLUTIONS RUSSIA (CYPRUS) LIMITED
RUSENERGO FUND LIMITED
Citigroup Global Markets Limited
* After addition issue 2013-2014
6
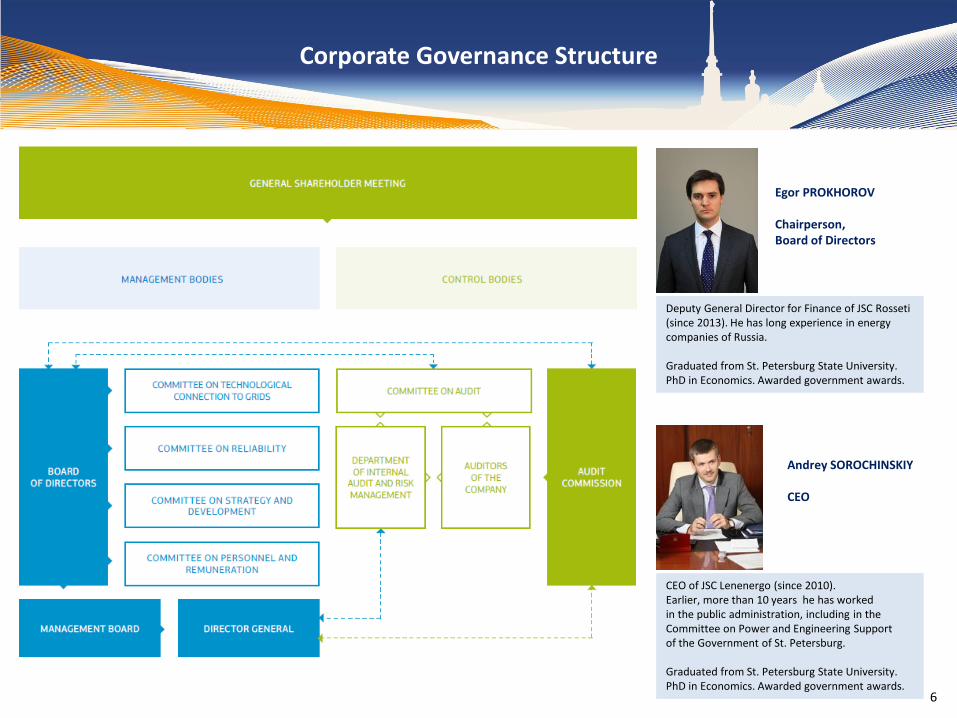
Corporate Governance Structure
CEO of JSC Lenenergo (since 2010). Earlier, more than 10 years he has worked in the public administration, including in the Committee on Power and Engineering Support of the Government of St. Petersburg. Graduated from St. Petersburg State University. PhD in Economics. Awarded government awards.
Deputy General Director for Finance of JSC Rosseti (since 2013). He has long experience in energy companies of Russia. Graduated from St. Petersburg State University. PhD in Economics. Awarded government awards.
Egor PROKHOROV Chairperson, Board of Directors
Andrey SOROCHINSKIY CEO
7
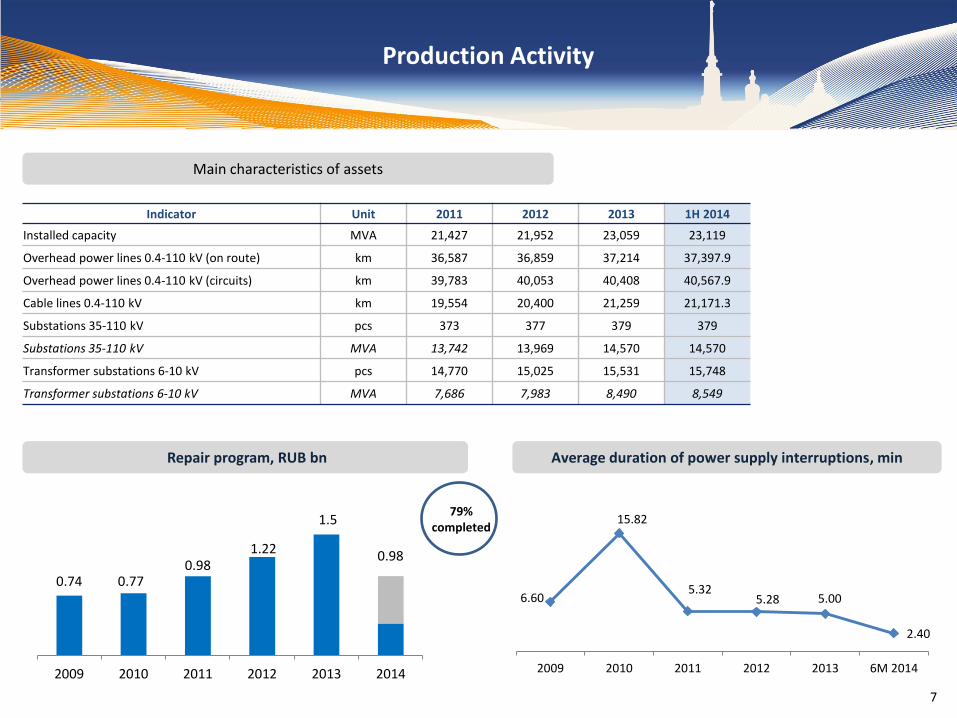
Production Activity
Indicator Unit 2011 2012 2013 1H 2014
Installed capacity MVA 21,427 21,952 23,059 23,119
Overhead power lines 0.4-110 kV (on route) km 36,587 36,859 37,214 37,397.9
Overhead power lines 0.4-110 kV (circuits) km 39,783 40,053 40,408 40,567.9
Cable lines 0.4-110 kV km 19,554 20,400 21,259 21,171.3
Substations 35-110 kV pcs 373 377 379 379
Substations 35-110 kV MVA 13,742 13,969 14,570 14,570
Transformer substations 6-10 kV pcs 14,770 15,025 15,531 15,748
Transformer substations 6-10 kV MVA 7,686 7,983 8,490 8,549
Main characteristics of assets
Repair program, RUB bn Average duration of power supply interruptions, min
79% completed
0.74 0.77 0.98
1.22
1.5
0.98
2009 2010 2011 2012 2013 2014
6.60
15.82
5.32 5.28 5.00
2.40
2009 2010 2011 2012 2013 6M 2014
8
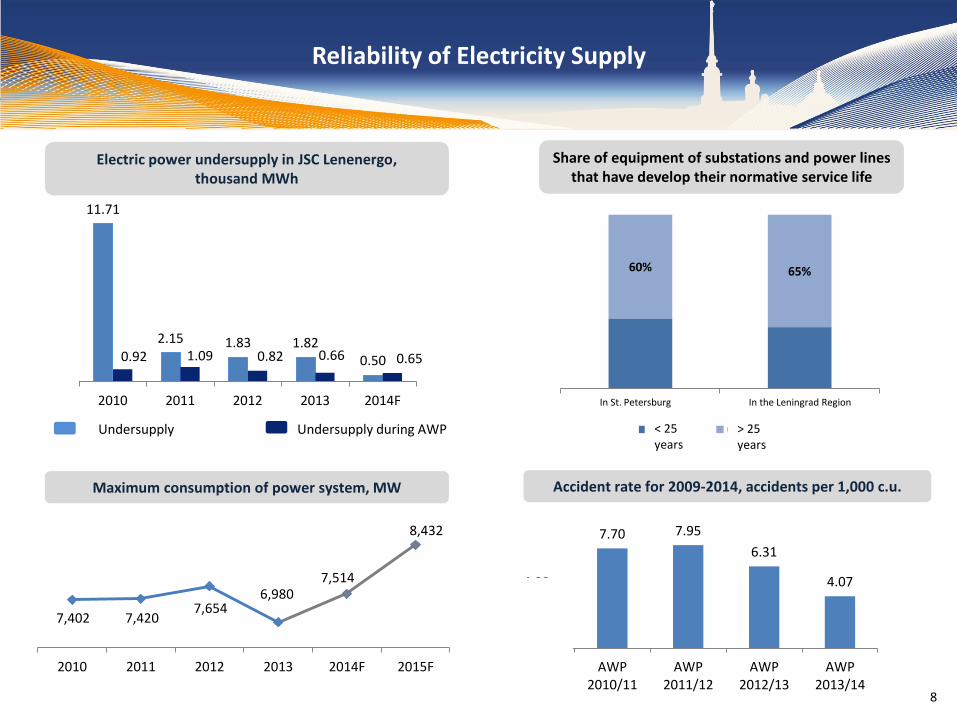
2.01
11.71
2.15 1.83 1.82 0.50 0.9 0.92 1.09 0.82 0.66 0.65
2009 2010 2011 2012 2013 2014F
Reliability of Electricity Supply
Undersupply Undersupply during AWP
Electric power undersupply in JSC Lenenergo, thousand MWh
Maximum consumption of power system, MW
7,402 7,420 7,654
6,980 7,514
8,432
2010 2011 2012 2013 2014F 2015F
Accident rate for 2009-2014, accidents per 1,000 c.u.
4.00
7.70 7.95
6.31
4.07
AWP2009/10
AWP2010/11
AWP2011/12
AWP2012/13
AWP2013/14
Share of equipment of substations and power lines that have develop their normative service life
60% 65%
по Санкт-Петербургу по Ленинградской области
до 25 лет более 25 лет < 25 years
> 25 years
In the Leningrad Region In St. Petersburg
9
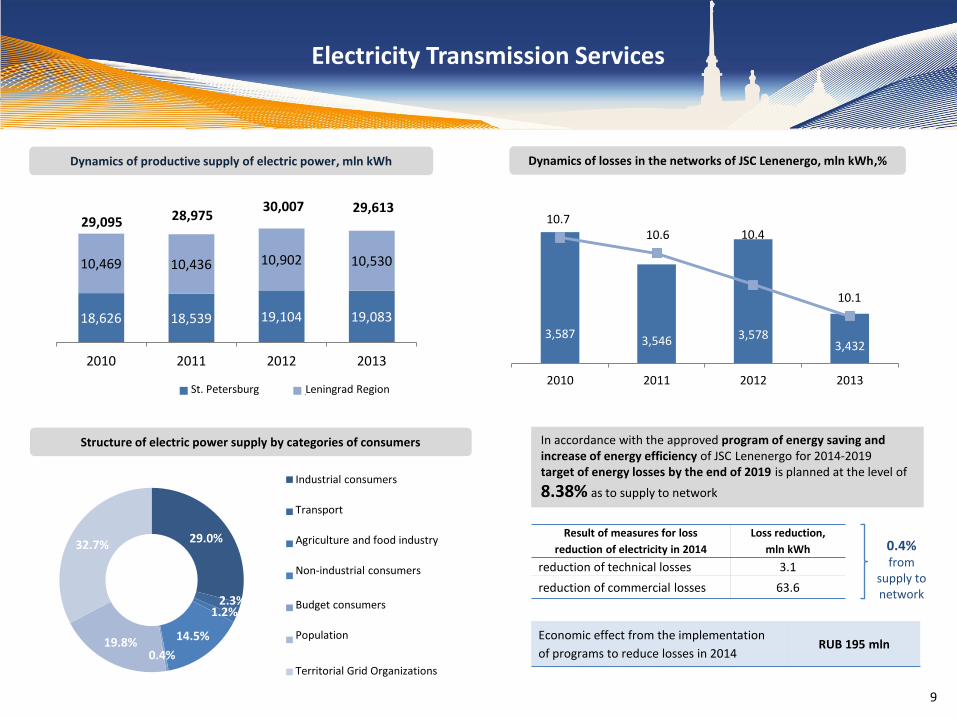
Electricity Transmission Services
Dynamics of productive supply of electric power, mln kWh Dynamics of losses in the networks of JSC Lenenergo, mln kWh,%
Structure of electric power supply by categories of consumers
29.0%
2.3% 1.2%
14.5%
0.4% 19.8%
32.7%
Промышленные потребители
Транспорт
Сел. хоз-во и пищ. пром.
Непромышленные потребители
Бюджетные потребители
Население
ТСО
18,626 18,539 19,104 19,083
10,469 10,436 10,902 10,530
2010 2011 2012 2013
СПб ЛО
28,975 30,007 29,613
29,095
3,587 3,546 3,578
3,432
10.7 10.6 10.4
10.1
9,9
10,1
10,3
10,5
10,7
10,9
3420
3470
3520
3570
3620
2010 2011 2012 2013
Result of measures for loss
reduction of electricity in 2014
Loss reduction,
mln kWh
reduction of technical losses 3.1
reduction of commercial losses 63.6
Economic effect from the implementation
of programs to reduce losses in 2014 RUB 195 mln
0.4% from
supply to network
Industrial consumers
Transport
Agriculture and food industry
Non-industrial consumers
Budget consumers
Population
Territorial Grid Organizations
St. Petersburg Leningrad Region
In accordance with the approved program of energy saving and increase of energy efficiency of JSC Lenenergo for 2014-2019 target of energy losses by the end of 2019 is planned at the level of
8.38% as to supply to network
10
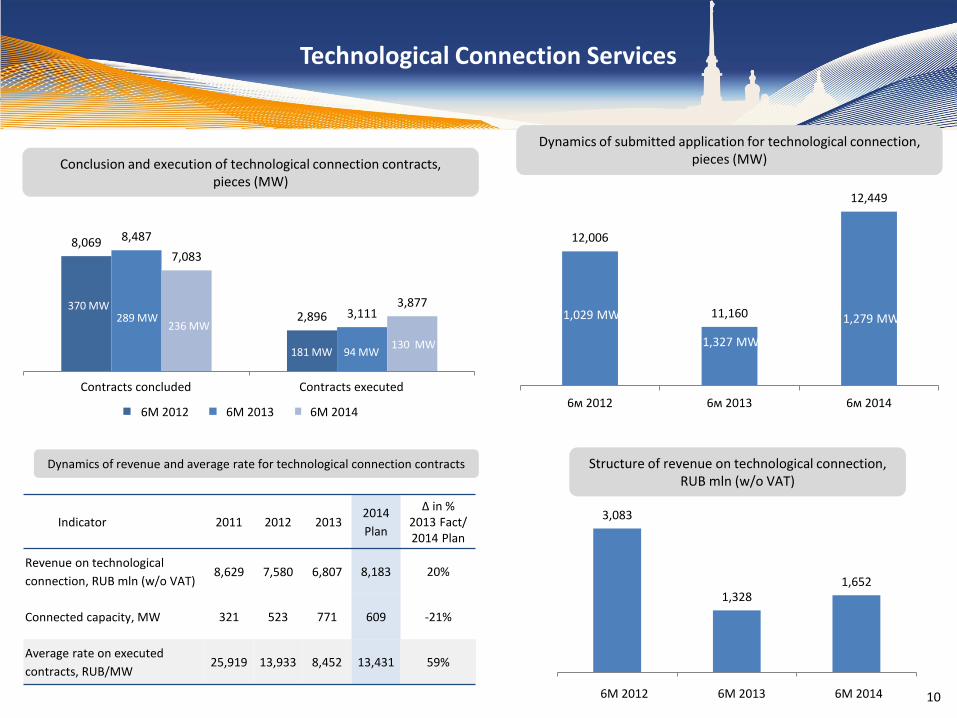
Technological Connection Services
Dynamics of revenue and average rate for technological connection contracts
Conclusion and execution of technological connection contracts, pieces (MW)
Dynamics of submitted application for technological connection, pieces (MW)
8,069
2,896
8,487
3,111
7,083
3,877
Заключено договоров Закрыто договоров
6 мес 2012 6 мес 2013 6 мес 2014
370 MW 289 MW
236 MW
181 MW 94 MW 130 MW
Indicator 2011 2012 2013 2014
Plan
Δ in % 2013 Fact/ 2014 Plan
Revenue on technological
connection, RUB mln (w/o VAT) 8,629 7,580 6,807 8,183 20%
Connected capacity, MW 321 523 771 609 -21%
Average rate on executed
contracts, RUB/MW 25,919 13,933 8,452 13,431 59%
Structure of revenue on technological connection, RUB mln (w/o VAT)
3,083
1,328 1,652
6м 2012 6м 2013 6м 2014
Contracts concluded Contracts executed
6M 2012 6M 2013 6M 2014
6M 2012 6M 2013 6M 2014
12,006
11,160
12,449
6м 2012 6м 2013 6м 2014
1,029 MW
1,327 MW
1,279 MW
11
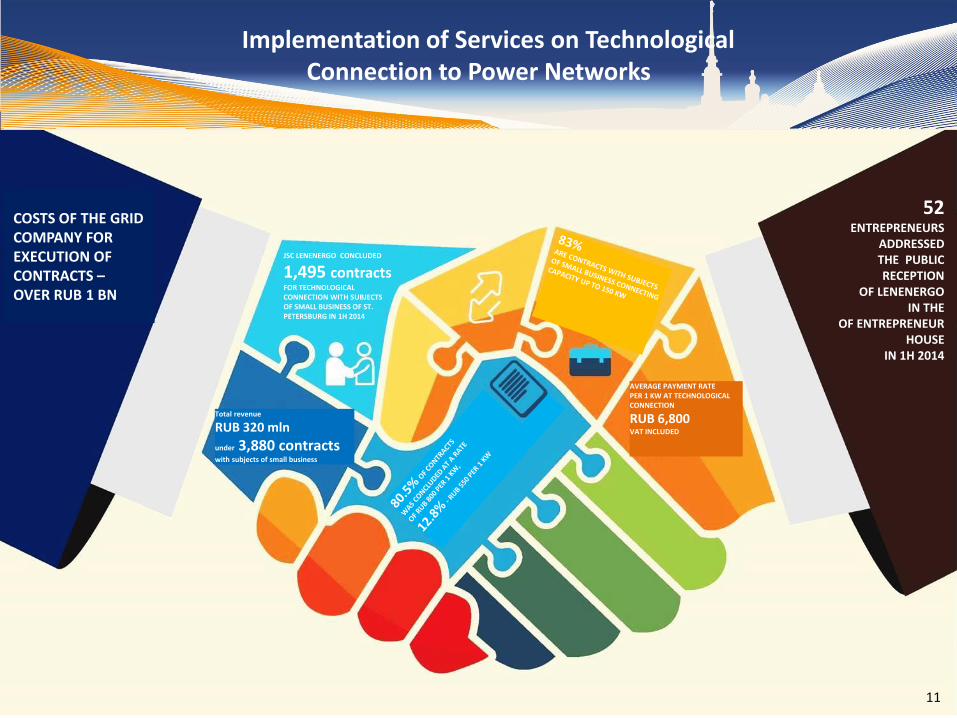
JSC LENENERGO CONCLUDED
1,495 contracts FOR TECHNOLOGICAL CONNECTION WITH SUBJECTS OF SMALL BUSINESS OF ST. PETERSBURG IN 1H 2014
52 ENTREPRENEURS
ADDRESSED THE PUBLIC RECEPTION
OF LENENERGO IN THE
OF ENTREPRENEUR HOUSE
IN 1H 2014
Implementation of Services on Technological Connection to Power Networks
11
COSTS OF THE GRID COMPANY FOR EXECUTION OF CONTRACTS – OVER RUB 1 BN
Total revenue
RUB 320 mln
under 3,880 contracts with subjects of small business
AVERAGE PAYMENT RATE PER 1 KW AT TECHNOLOGICAL CONNECTION
RUB 6,800 VAT INCLUDED
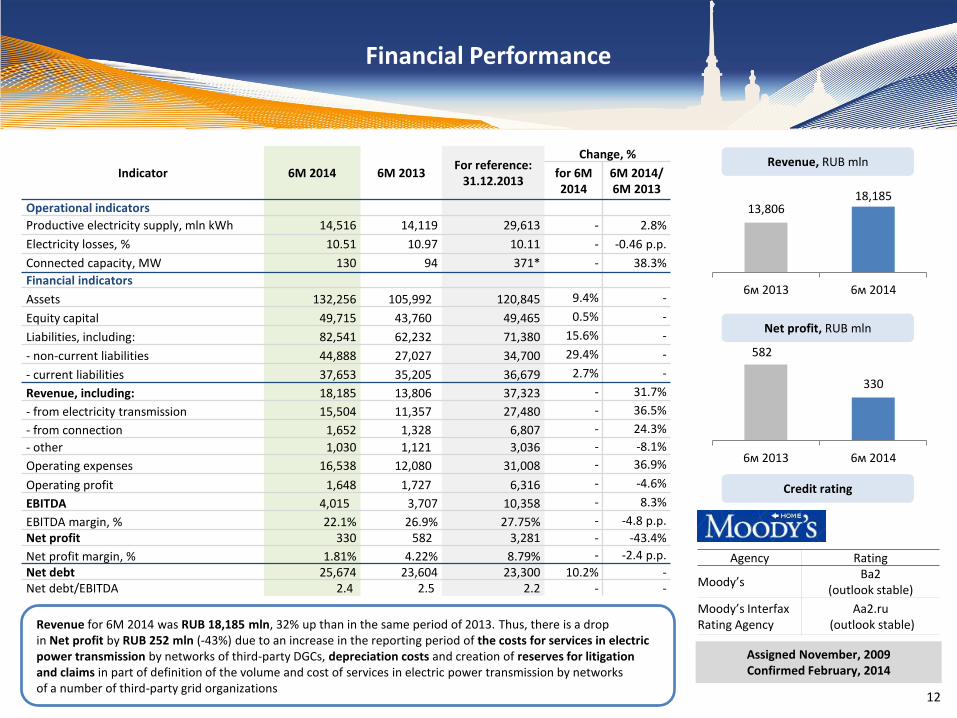
12
582
330
6м 2013 6м 2014
Financial Performance
Indicator 6M 2014 6M 2013 For reference:
31.12.2013
Change, %
for 6M 2014
6M 2014/ 6M 2013
Operational indicators
Productive electricity supply, mln kWh 14,516 14,119 29,613 - 2.8%
Electricity losses, % 10.51 10.97 10.11 - -0.46 p.p.
Connected capacity, MW 130 94 371* - 38.3%
Financial indicators
Assets 132,256 105,992 120,845 9.4% -
Equity capital 49,715 43,760 49,465 0.5% -
Liabilities, including: 82,541 62,232 71,380 15.6% -
- non-current liabilities 44,888 27,027 34,700 29.4% -
- current liabilities 37,653 35,205 36,679 2.7% -
Revenue, including: 18,185 13,806 37,323 - 31.7%
- from electricity transmission 15,504 11,357 27,480 - 36.5%
- from connection 1,652 1,328 6,807 - 24.3%
- other 1,030 1,121 3,036 - -8.1%
Operating expenses 16,538 12,080 31,008 - 36.9%
Operating profit 1,648 1,727 6,316 - -4.6%
EBITDA 4,015 3,707 10,358 - 8.3%
EBITDA margin, % 22.1% 26.9% 27.75% - -4.8 p.p.
Net profit 330 582 3,281 - -43.4%
Net profit margin, % 1.81% 4.22% 8.79% - -2.4 p.p.
Net debt 25,674 23,604 23,300 10.2% - Net debt/EBITDA 2.4 2.5 2.2 - -
Agency Rating
Moody’s Ba2
(outlook stable)
Moody’s Interfax Rating Agency
Aa2.ru (outlook stable)
Credit rating
Assigned November, 2009 Confirmed February, 2014
Revenue, RUB mln
Net profit, RUB mln
13,806 18,185
6м 2013 6м 2014
Revenue for 6M 2014 was RUB 18,185 mln, 32% up than in the same period of 2013. Thus, there is a drop in Net profit by RUB 252 mln (-43%) due to an increase in the reporting period of the costs for services in electric power transmission by networks of third-party DGCs, depreciation costs and creation of reserves for litigation and claims in part of definition of the volume and cost of services in electric power transmission by networks of a number of third-party grid organizations
13
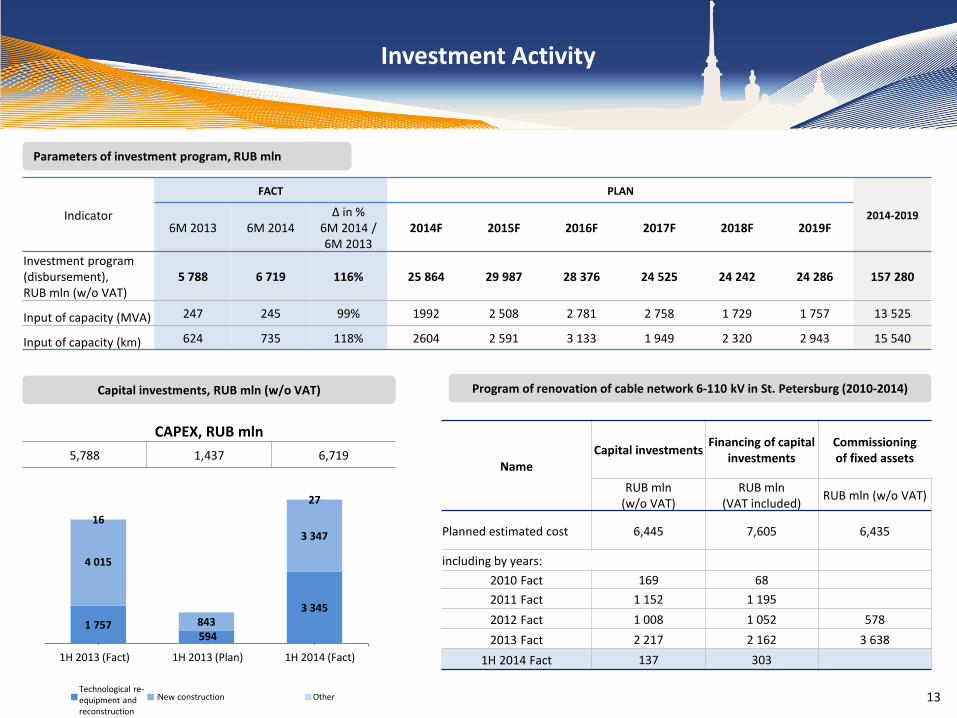
Investment Activity
Parameters of investment program, RUB mln
Program of renovation of cable network 6-110 kV in St. Petersburg (2010-2014) Capital investments, RUB mln (w/o VAT)
CAPEX, RUB mln
5,788 1,437 6,719
1 757 594
3 345
4 015
843
3 347
16
27
Факт 1 пл. 2013 План 1пл. 2014 Факт 1 пл. 2014
ТПиР Новое строительство Прочие
1H 2013 (Fact) 1H 2013 (Plan) 1H 2014 (Fact)
Technological re-equipment and reconstruction
New construction Other
Indicator
FACT PLAN
2014-2019 6M 2013 6M 2014
Δ in % 6M 2014 / 6M 2013
2014F 2015F 2016F 2017F 2018F 2019F
Investment program (disbursement), RUB mln (w/o VAT)
5 788 6 719 116% 25 864 29 987 28 376 24 525 24 242 24 286 157 280
Input of capacity (MVA) 247 245 99% 1992 2 508 2 781 2 758 1 729 1 757 13 525
Input of capacity (km) 624 735 118% 2604 2 591 3 133 1 949 2 320 2 943 15 540
Name Capital investments
Financing of capital investments
Commissioning of fixed assets
RUB mln (w/o VAT)
RUB mln (VAT included)
RUB mln (w/o VAT)
Planned estimated cost 6,445 7,605 6,435
including by years:
2010 Fact 169 68
2011 Fact 1 152 1 195
2012 Fact 1 008 1 052 578
2013 Fact 2 217 2 162 3 638
1H 2014 Fact 137 303
14
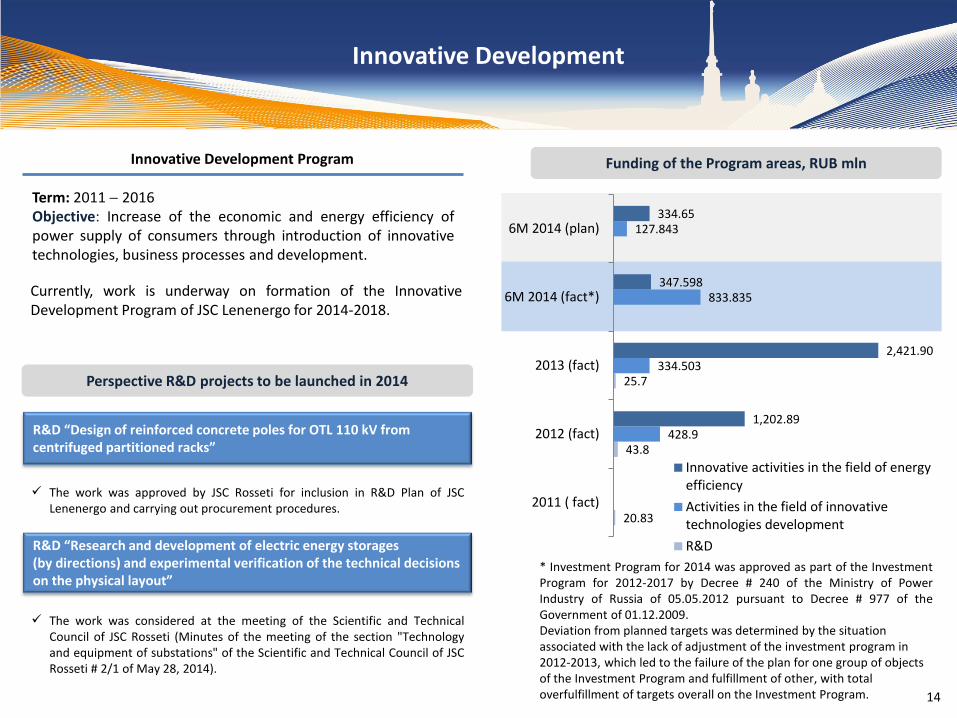
20.83
43.8
25.7
428.9
334.503
833.835
127.843
1,202.89
2,421.90
347.598
334.65
2011 ( fact)
2012 (fact)
2013 (fact)
6M 2014 (fact*)
6M 2014 (plan)
Innovative activities in the field of energyefficiency
Activities in the field of innovativetechnologies development
R&D
Innovative Development
Currently, work is underway on formation of the Innovative Development Program of JSC Lenenergo for 2014-2018.
Innovative Development Program
Term: 2011 2016 Objective: Increase of the economic and energy efficiency of power supply of consumers through introduction of innovative technologies, business processes and development.
Funding of the Program areas, RUB mln
R&D “Design of reinforced concrete poles for OTL 110 kV from centrifuged partitioned racks”
R&D “Research and development of electric energy storages (by directions) and experimental verification of the technical decisions on the physical layout”
The work was approved by JSC Rosseti for inclusion in R&D Plan of JSC Lenenergo and carrying out procurement procedures.
The work was considered at the meeting of the Scientific and Technical Council of JSC Rosseti (Minutes of the meeting of the section "Technology and equipment of substations" of the Scientific and Technical Council of JSC Rosseti # 2/1 of May 28, 2014).
Perspective R&D projects to be launched in 2014
* Investment Program for 2014 was approved as part of the Investment Program for 2012-2017 by Decree # 240 of the Ministry of Power Industry of Russia of 05.05.2012 pursuant to Decree # 977 of the Government of 01.12.2009. Deviation from planned targets was determined by the situation associated with the lack of adjustment of the investment program in 2012-2013, which led to the failure of the plan for one group of objects of the Investment Program and fulfillment of other, with total overfulfillment of targets overall on the Investment Program.
15
THANK YOU!