Embed Size (px)
Citation preview
BOX OFFICE TRENDS
Executive Insights | SPOTLIGHT ON MEDIA & ENTERTAINMENT
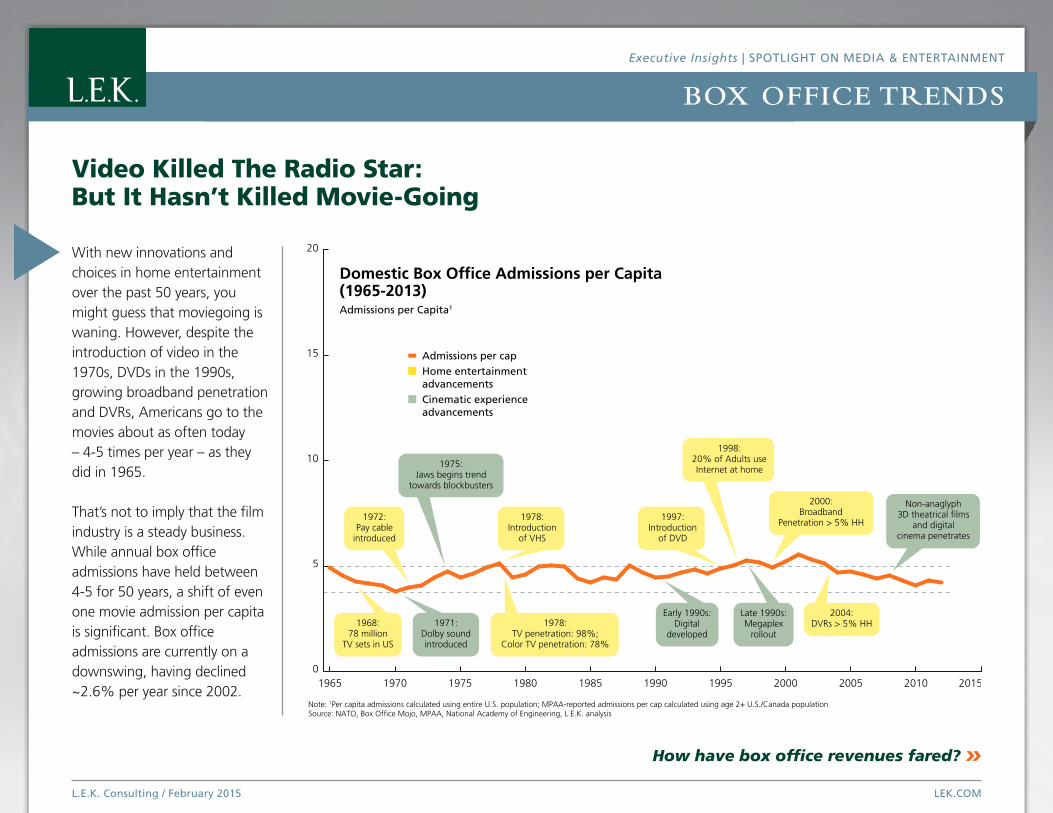
With new innovations and choices in home entertainment over the past 50 years, you might guess that moviegoing is waning. However, despite the introduction of video in the 1970s, DVDs in the 1990s, growing broadband penetration and DVRs, Americans go to the movies about as often today – 4-5 times per year – as they did in 1965.
That’s not to imply that the film industry is a steady business. While annual box office admissions have held between 4-5 for 50 years, a shift of even one movie admission per capita is significant. Box office admissions are currently on a downswing, having declined ~2.6% per year since 2002.
How have box office revenues fared? »
Video Killed The Radio Star: But It Hasn’t Killed Movie-Going
L.E.K. Consulting / February 2015 LEK.COM
0
5
10
15
20
1965 1970 1975 1980 1985 1990 1995 2000 2005 2010 2015
Admissions per capHome entertainmentadvancementsCinematic experience advancements
Domestic Box Office Admissions per Capita (1965-2013)Admissions per Capita1
Note: 1Per capita admissions calculated using entire U.S. population; MPAA-reported admissions per cap calculated using age 2+ U.S./Canada populationSource: NATO, Box Office Mojo, MPAA, National Academy of Engineering, L.E.K. analysis
1968:78 million
TV sets in US
1971:Dolby soundintroduced
1978:TV penetration: 98%;
Color TV penetration: 78%
Early 1990s:Digital
developed
Late 1990s:Megaplex
rollout
2004:DVRs > 5% HH
Non-anaglyph3D theatrical films
and digitalcinema penetrates
2000:Broadband
Penetration > 5% HH
1998:20% of Adults useInternet at home
1997:Introduction
of DVD
1972:Pay cable
introduced
1975:Jaws begins trend
towards blockbusters
1978:Introduction
of VHS
BOX OFFICE TRENDS
Executive Insights | SPOTLIGHT ON MEDIA & ENTERTAINMENT
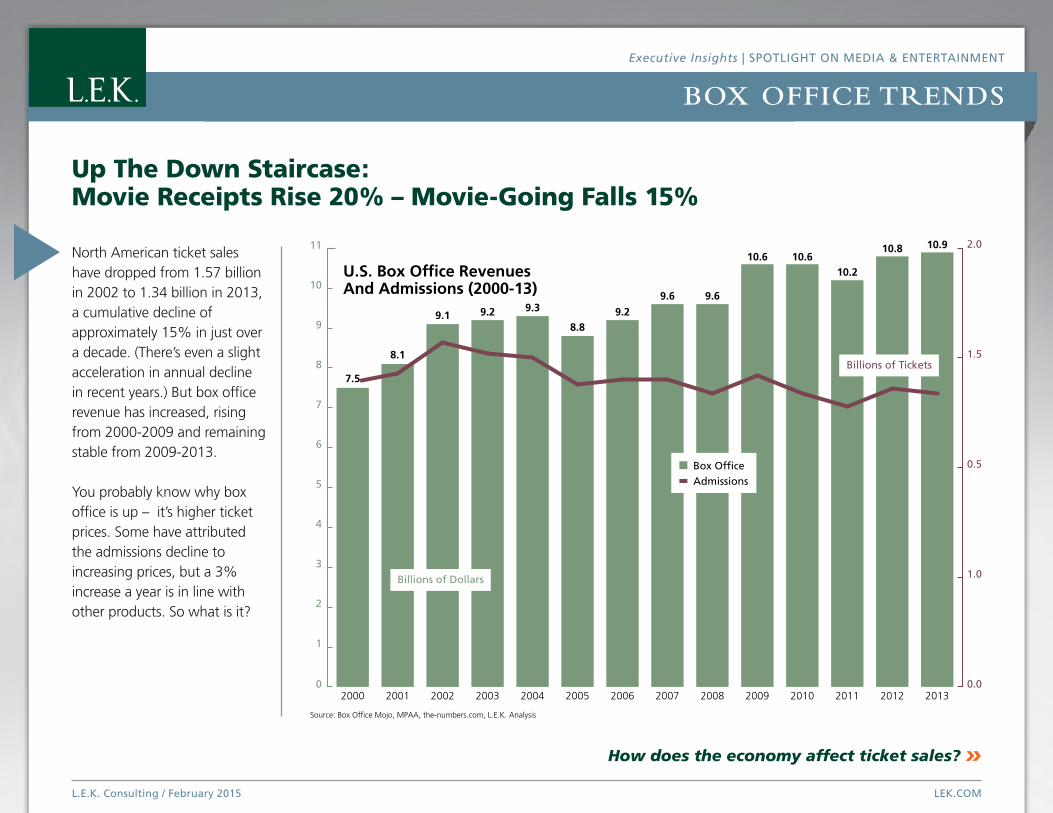
North American ticket sales have dropped from 1.57 billion in 2002 to 1.34 billion in 2013, a cumulative decline of approximately 15% in just over a decade. (There’s even a slight acceleration in annual decline in recent years.) But box office revenue has increased, rising from 2000-2009 and remaining stable from 2009-2013.
You probably know why box office is up – it’s higher ticket prices. Some have attributed the admissions decline to increasing prices, but a 3% increase a year is in line with other products. So what is it?
How does the economy affect ticket sales? »
Up The Down Staircase: Movie Receipts Rise 20% – Movie-Going Falls 15%
L.E.K. Consulting / February 2015 LEK.COM
2000 2001 2002 2003 2004 2005 2006 2007 2008 2009 2010 2011 2012 2013
U.S. Box Office Revenues And Admissions (2000-13)
0
1
2
3
4
5
6
7
8
9
10
11
0.0
0.5
1.0
1.5
2.0
Source: Box Office Mojo, MPAA, the-numbers.com, L.E.K. Analysis
Billions of Dollars
Billions of Tickets
Box OfficeAdmissions
7.5
10.910.8
10.210.610.6
9.69.6
9.28.8
9.39.29.1
8.1

L.E.K. Consulting / February 2015 LEK.COM
BOX OFFICE TRENDS
Executive Insights | SPOTLIGHT ON MEDIA & ENTERTAINMENT
Despite recent declines in box office admissions, evidence shows that recessions don’t really affect the cinema business. In this chart, the yellow bars call out the recessionary periods in the last 45 years. The gray line is the GDP per capita, showing a relatively steady increase of 1.8% per year since 1970. The erratic red bar shows the number of movies attended per person in North America, clearly indicating no correlation between admissions and GDP, or even admissions and recessions.
We all tighten our belts a little and watch our spending in tougher economic times. But if that alone is not the major factor impacting the recent decline, what is?
What other factors affect ticket sales? »
Does A Recession Affect Ticket Sales? If You Film It, They Will Come
1970 1975 1980 1985 1990 1995 2000 2005 2010 20152
3
4
5
6
7
Note: 1Per capita admissions calculated using entire U.S. population; MPAA-reported admissions per cap calculated using age 2+ U.S./Canada populationSource: MPAA, Box Office Mojo, NATO, BEA, U.S. Census Bureau, L.E.K. analysis
0
10
20
30
40
50
Admissions Per Capita(left scale)
Admissionsper Capita
Real GDP per Capita (right scale)
Real GDPper capita$K in 2009
dollars
Avg = 4.7
Admissions per Capita1 And Real GDP per Capita (1970-2013)
Recessionary Period2002-’13 Trendline
L.E.K. Consulting / February 2015 LEK.COM
L.E.K. Consulting / February 2015 LEK.COM
BOX OFFICE TRENDS
Executive Insights | SPOTLIGHT ON MEDIA & ENTERTAINMENT
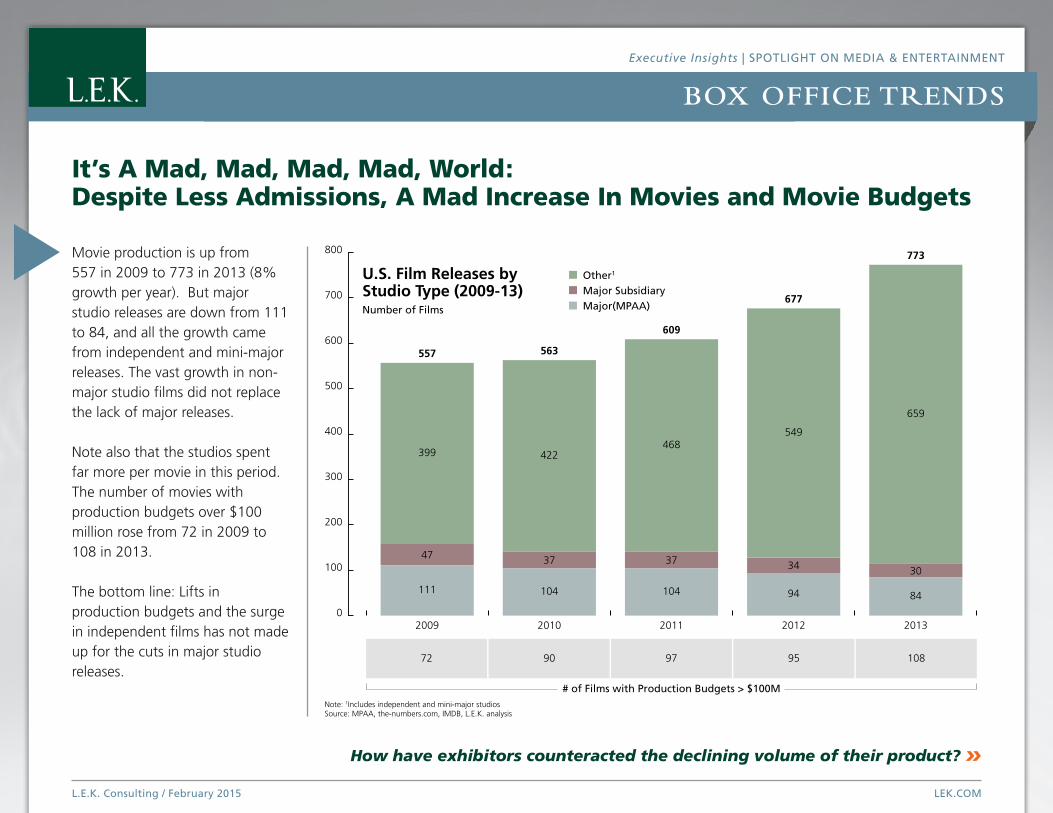
Movie production is up from 557 in 2009 to 773 in 2013 (8% growth per year). But major studio releases are down from 111 to 84, and all the growth came from independent and mini-major releases. The vast growth in non-major studio films did not replace the lack of major releases.
Note also that the studios spent far more per movie in this period. The number of movies with production budgets over $100 million rose from 72 in 2009 to 108 in 2013.
The bottom line: Lifts in production budgets and the surge in independent films has not made up for the cuts in major studio releases.
How have exhibitors counteracted the declining volume of their product? »
It’s A Mad, Mad, Mad, Mad, World:Despite Less Admissions, A Mad Increase In Movies and Movie Budgets
L.E.K. Consulting / February 2015 LEK.COM
Note: 1Includes independent and mini-major studiosSource: MPAA, the-numbers.com, IMDB, L.E.K. analysis
0
100
200
300
400
500
600
700
800
677
549
94
34
2012
95
U.S. Film Releases by Studio Type (2009-13)Number of Films
Other1
Major SubsidiaryMajor(MPAA)
# of Films with Production Budgets > $100M
557
399
111
47
2009
72
609
468
104
37
2011
97
563
422
104
37
2010
90
773
659
84
30
2013
108
L.E.K. Consulting / February 2015 LEK.COM
BOX OFFICE TRENDS
Executive Insights | SPOTLIGHT ON MEDIA & ENTERTAINMENT
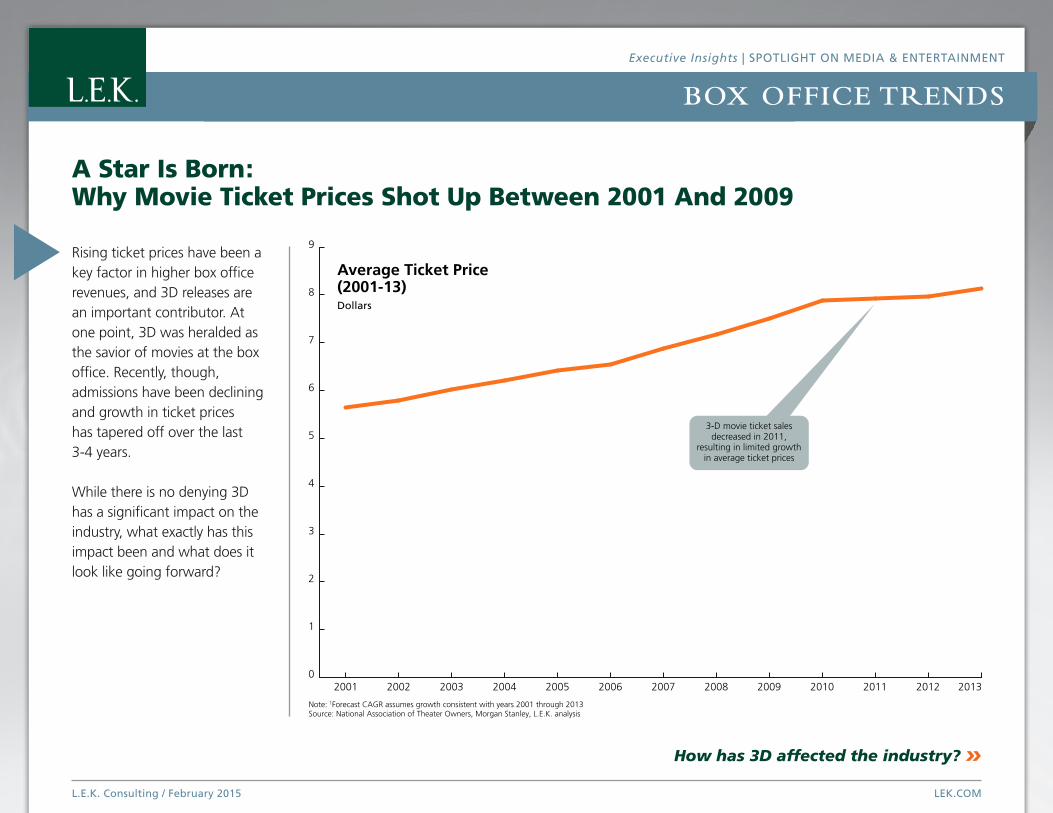
Rising ticket prices have been a key factor in higher box office revenues, and 3D releases are an important contributor. At one point, 3D was heralded as the savior of movies at the box office. Recently, though, admissions have been declining and growth in ticket prices has tapered off over the last 3-4 years.
While there is no denying 3D has a significant impact on the industry, what exactly has this impact been and what does it look like going forward?
How has 3D affected the industry? »
A Star Is Born:Why Movie Ticket Prices Shot Up Between 2001 And 2009
0
1
2
3
4
5
6
7
8
9
Note: 1Forecast CAGR assumes growth consistent with years 2001 through 2013Source: National Association of Theater Owners, Morgan Stanley, L.E.K. analysis
2001 2002 2003 2004 2005 2006 2007 2008 2009 2010 2011 2012 2013
Average Ticket Price (2001-13)Dollars
3-D movie ticket salesdecreased in 2011,
resulting in limited growthin average ticket prices
L.E.K. Consulting / February 2015 LEK.COM
BOX OFFICE TRENDS
Executive Insights | SPOTLIGHT ON MEDIA & ENTERTAINMENT
L.E.K. Consulting / February 2015 LEK.COM
0
5
10
15
20
25
30
35
40
2000 2001 2002 2003 2004 2005 2006 2007 2008 2009 2010 20122011 2013
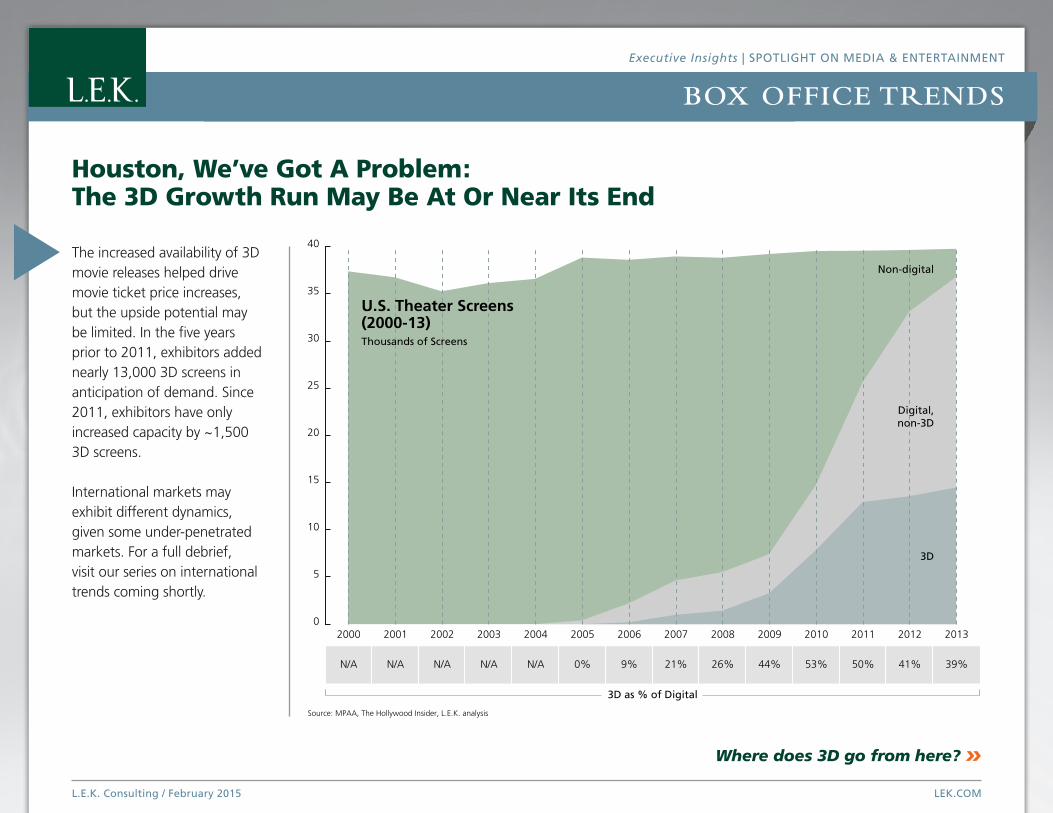
N/A N/A N/A N/A N/A 0% 9% 21% 26% 44% 53% 41%50% 39%
3D as % of Digital
Source: MPAA, The Hollywood Insider, L.E.K. analysis
Non-digital
Digital,non-3D
3D
U.S. Theater Screens(2000-13)Thousands of Screens
Where does 3D go from here? »
The increased availability of 3D movie releases helped drive movie ticket price increases, but the upside potential may be limited. In the five years prior to 2011, exhibitors added nearly 13,000 3D screens in anticipation of demand. Since 2011, exhibitors have only increased capacity by ~1,500 3D screens.
International markets may exhibit different dynamics, given some under-penetrated markets. For a full debrief, visit our series on international trends coming shortly.
Houston, We’ve Got A Problem:The 3D Growth Run May Be At Or Near Its End
BOX OFFICE TRENDS
Executive Insights | SPOTLIGHT ON MEDIA & ENTERTAINMENT
L.E.K. Consulting / February 2015 LEK.COM
What’s the value and growth potential of 3D? »
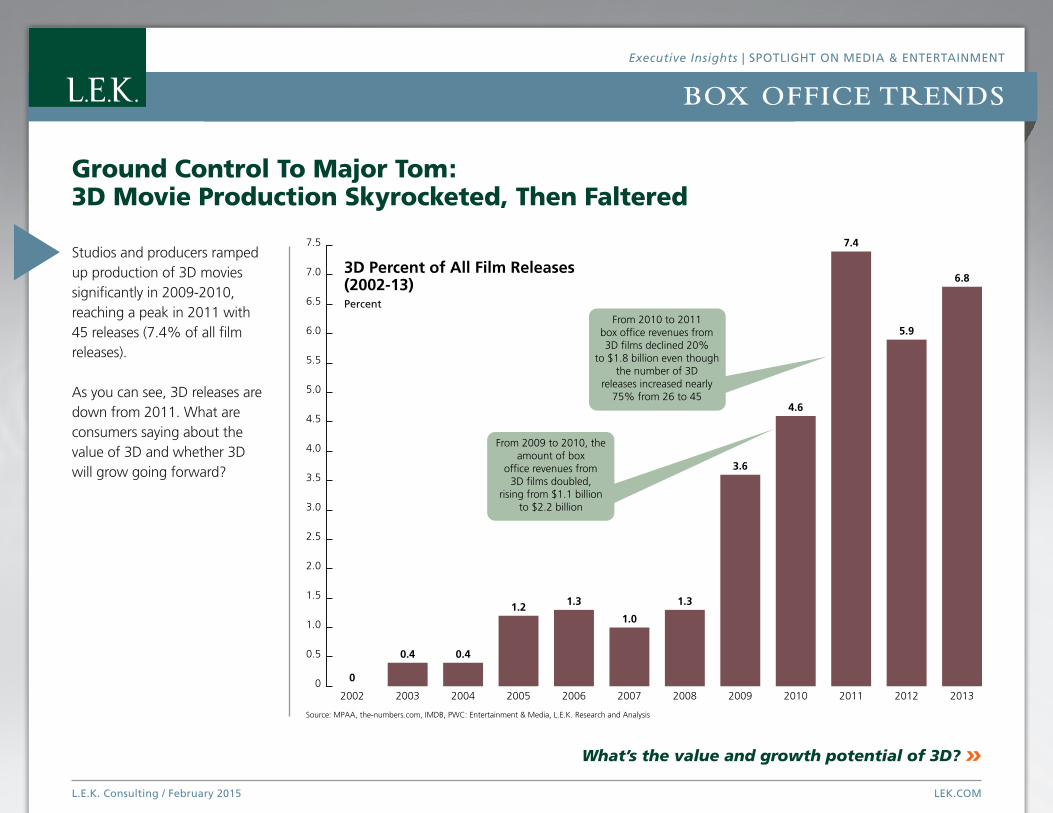
Studios and producers ramped up production of 3D movies significantly in 2009-2010, reaching a peak in 2011 with 45 releases (7.4% of all film releases).
As you can see, 3D releases are down from 2011. What are consumers saying about the value of 3D and whether 3D will grow going forward?
Ground Control To Major Tom:3D Movie Production Skyrocketed, Then Faltered
Source: MPAA, the-numbers.com, IMDB, PWC: Entertainment & Media, L.E.K. Research and Analysis
0
0.5
1.0
1.5
2.0
2.5
3.0
3.5
4.0
4.5
5.0
5.5
6.0
6.5
7.0
7.5
0
0.4 0.4
1.2 1.3
1.0
1.3
3.6
4.6
7.4
5.9
6.8
2002 2003 2004 2005 2006 2007 2008 2009 2010 2011 2012 2013
3D Percent of All Film Releases(2002-13)Percent
From 2009 to 2010, theamount of box
office revenues from3D films doubled,
rising from $1.1 billionto $2.2 billion
From 2010 to 2011box office revenues from3D films declined 20%
to $1.8 billion even thoughthe number of 3D
releases increased nearly75% from 26 to 45
BOX OFFICE TRENDS
Executive Insights | SPOTLIGHT ON MEDIA & ENTERTAINMENT
L.E.K. Consulting / February 2015 LEK.COM
What’s next for the movie industry? »
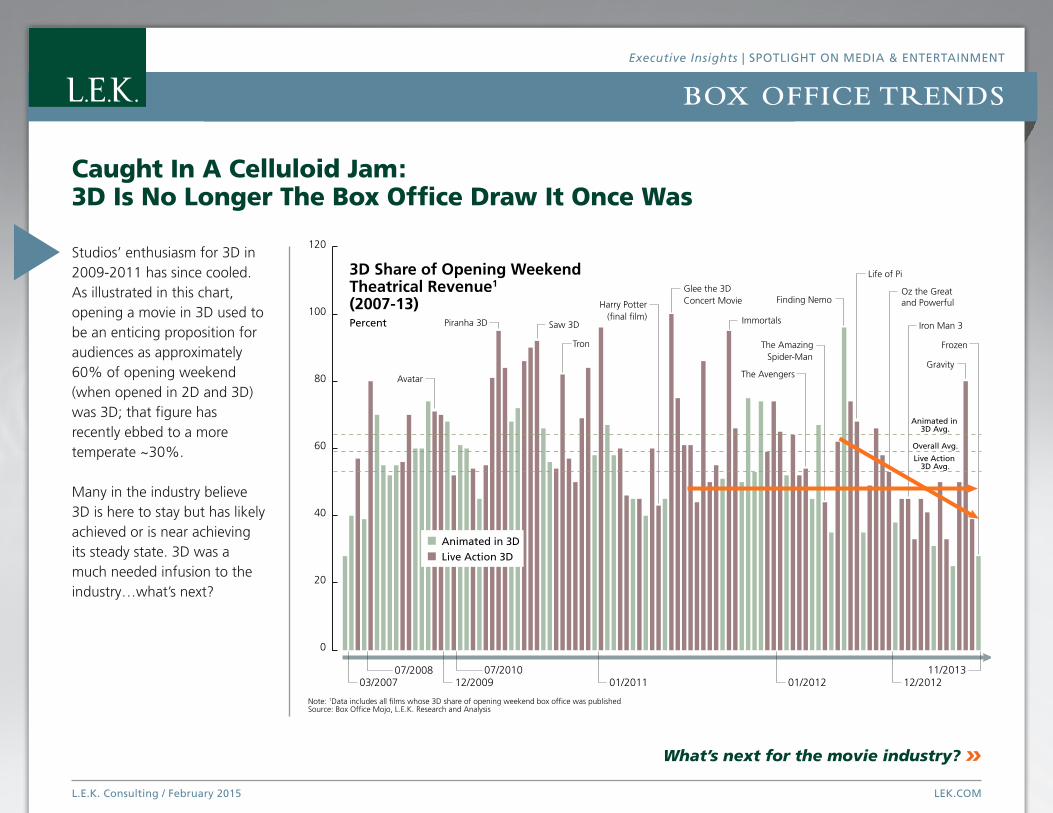
Studios’ enthusiasm for 3D in 2009-2011 has since cooled. As illustrated in this chart, opening a movie in 3D used to be an enticing proposition for audiences as approximately 60% of opening weekend (when opened in 2D and 3D) was 3D; that figure has recently ebbed to a more temperate ~30%.
Many in the industry believe 3D is here to stay but has likely achieved or is near achieving its steady state. 3D was a much needed infusion to the industry…what’s next?
Caught In A Celluloid Jam:3D Is No Longer The Box Office Draw It Once Was
Note: 1Data includes all films whose 3D share of opening weekend box office was publishedSource: Box Office Mojo, L.E.K. Research and Analysis
0
20
40
60
80
100
120
03/200707/2008
12/200907/2010
01/2011 01/2012 12/201211/2013
3D Share of Opening Weekend Theatrical Revenue1
(2007-13)Percent
Avatar The Avengers
The AmazingSpider-Man
Piranha 3D Saw 3D
Tron
Life of Pi
Iron Man 3
Oz the Great and Powerful
Glee the 3DConcert Movie
Immortals
Finding Nemo
Gravity
Frozen
Live Action 3D Avg.
Overall Avg.
Animated in 3D Avg.
Harry Potter(final film)
Animated in 3DLive Action 3D

L.E.K. Consulting / February 2015 LEK.COM
BOX OFFICE TRENDS
Executive Insights | SPOTLIGHT ON MEDIA & ENTERTAINMENT
In summary to our series of posts on box office trends where we discussed the decline in admissions, increasing ticket prices, and the leveling off of 3D’s impact, we ask: what’s next for the movie business?
While it is impossible to forecast outcomes with certainty, it is likely that exhibitors will continue to face pressures that will require a break from the norm. In addition, studios will find that recent successes in franchise management may cause an uptick in acquisitions of mass-appeal franchises.
Our takeaway: while studios can prosper with more special effects, exhibitors will need new ideas.
Source: L.E.K. analysis
Our Outlook:Back To The Future?
• Continued pressure from declining traffic and flat box office
• Decreasing benefit from 3D
• Increased focus on driving dollars per visit (e.g. dynamic pricing, premium features and benefits)
• Subscription pricing a future game changer?
EXHIBITORS
• Continued focus on tentpole releases with established fan bases
• Continued acquisition of libraries and franchises as studios seek next big thing
• Action/adventure, horror/thriller and animated titles are studio favorites
• Increased gigantism in movie selection, more special effects and fewer releases
STUDIOS
L.E.K. Consulting / February 2015 LEK.COM


![[ Cocoa Gurus] Spotlight](https://img.pdfslide.tips/doc/110x75/55a7c17c1a28ab3a128b45a5/-cocoa-gurus-spotlight.jpg)