Embed Size (px)
Citation preview
Personalized Diapause: Reducing Radio Energy Consumption of Smartphones
by Network-Context Aware Dormancy Predictions
2012 Workshop on Power-Aware Computing and Systems
October 7, 2012
1
Yeseong Kim and Jihong Kim
Computer Architecture & Embedded Systems Lab.
Department of Computer Science and Engineering
Seoul National University
A period of suspended growth
accompanied by decreased metabolism in insects
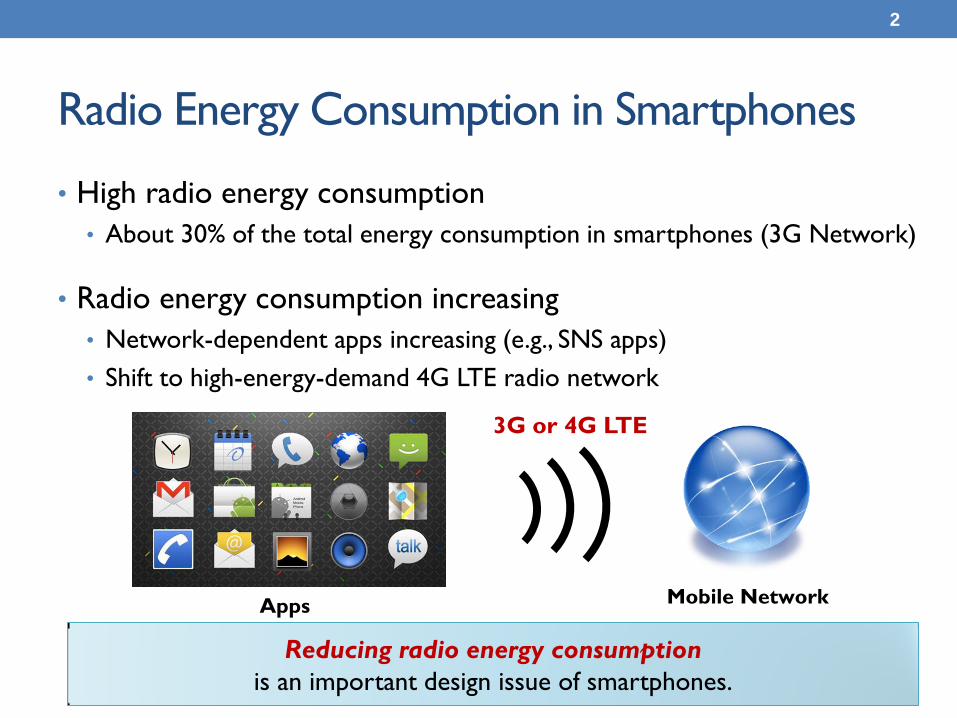
Radio Energy Consumption in Smartphones
• High radio energy consumption
• About 30% of the total energy consumption in smartphones (3G Network)
• Radio energy consumption increasing
• Network-dependent apps increasing (e.g., SNS apps)
• Shift to high-energy-demand 4G LTE radio network
2
Mobile Network
3G or 4G LTE
Apps
Reducing radio energy consumption
is an important design issue of smartphones.

Radio Energy Consumption in Tail Time
• A significant portion of radio energy is consumed during “tail time”
• After a packet transmission, a high power level is maintained
expecting a subsequent transmission.
3
0
200
400
600
800
1000
1200
0 5000 10000 15000 20000 25000
Po
we
r (m
W)
Time (ms)
TAIL (10~20 Seconds)
No reconnection
New Transmission End of Transmission

Wasted Radio Energy during Tail Time
• A significant radio energy is wasted during “tail time”.
• From our measurement study of 25 smartphone users
4
Time
Pow
er
End of Transmission
Tail Energy
Tail time
Wasted Tail Energy
If there is no
transmission
0%
10%
20%
30%
40%
50%
Was
ted
tail
en
erg
y o
f to
tal
rad
io e
ne
rgy (
%)
33% of the total radio
energy is wasted
in the tail time
Reducing wasted radio energy is very important.
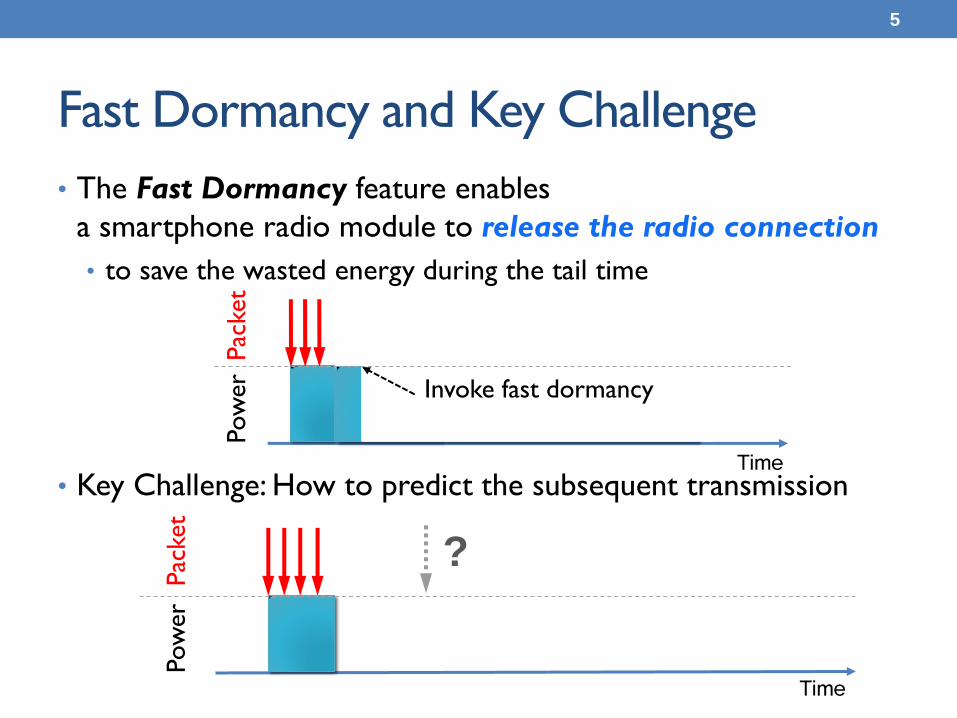
Fast Dormancy and Key Challenge
• The Fast Dormancy feature enables
a smartphone radio module to release the radio connection
• to save the wasted energy during the tail time
• Key Challenge: How to predict the subsequent transmission
5
Time
Invoke fast dormancy
Pow
er
Pac
ket
Time
Pow
er
Pac
ket
?

Fast Dormancy and Key Challenge
• The Fast Dormancy feature enables
a smartphone radio module to release the radio connection
• to save the wasted energy during the tail time
• Key Challenge: How to predict the subsequent transmission
6
Time
Invoke fast dormancy
Pow
er
Pac
ket
Time
Pow
er
Pac
ket
Right prediction: Saving radio energy
Invoke fast dormancy

Fast Dormancy and Key Challenge
• The Fast Dormancy feature enables
a smartphone radio module to release the radio connection
• to save the wasted energy during the tail time
• Key Challenge: How to predict the subsequent transmission
7
Time
Invoke fast dormancy
Pow
er
Pac
ket
Time
Pow
er
Pac
ket Wrong prediction: Additional Reconnection
; Long delay (e.g.,, 2 secs) to smartphone,
Signaling overhead to mobile network
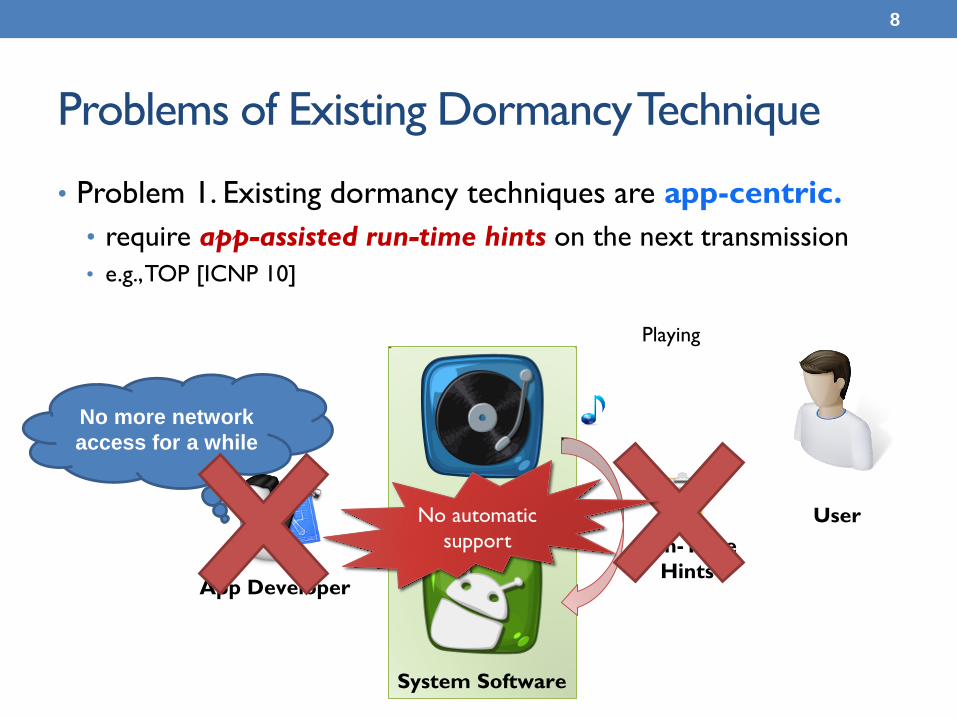
Problems of Existing Dormancy Technique
• Problem 1. Existing dormancy techniques are app-centric.
• require app-assisted run-time hints on the next transmission
• e.g., TOP [ICNP 10]
8
Streaming App User
Playing
System Software
No more network
access for a while
App Developer
Run-Time
Hints
No automatic
support
?
App Developer
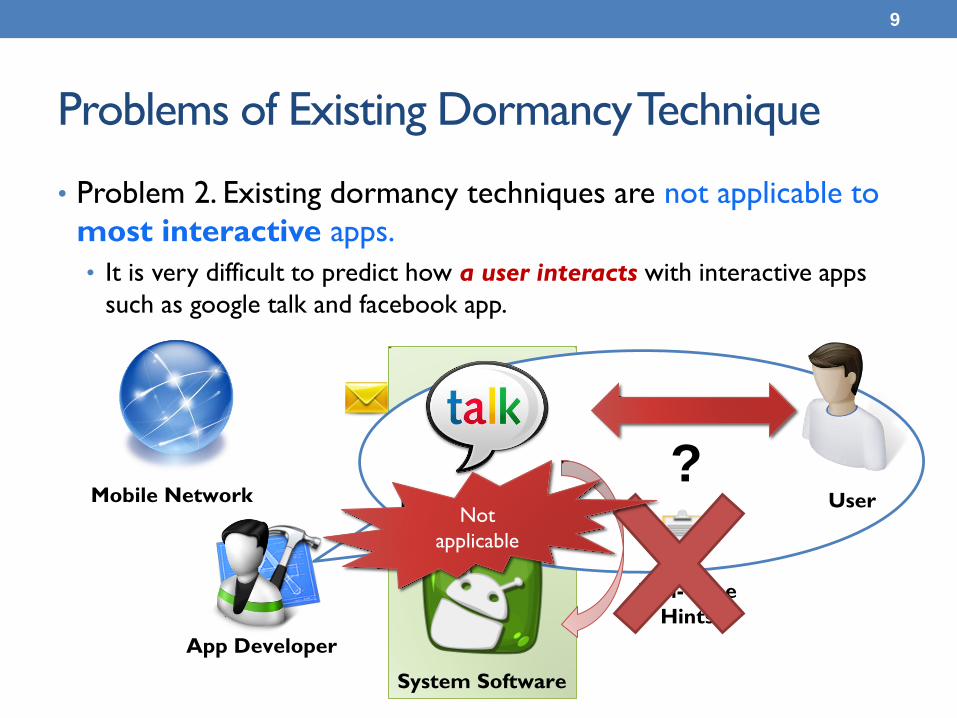
Problems of Existing Dormancy Technique
• Problem 2. Existing dormancy techniques are not applicable to
most interactive apps.
• It is very difficult to predict how a user interacts with interactive apps
such as google talk and facebook app.
9
Interactive Apps User Mobile Network
System Software
Run-Time
Hints
Not
applicable

Contributions
• We propose Personalized Diapause,
a general-purpose automatic predictive dormancy technique
for supporting the fast dormancy feature
• Not depending on app-assisted future network usage hints
• Applicable to most of apps with general network transmission patterns
• Personalized Diapause was implemented on
Android 2.3 (Gingerbread) Nexus S smartphones
• Radio energy consumption saving by up to 36% with 10% increase in the
radio reconnection over when no fast dormancy feature is used.
10
Outline
• Introduction
• Overview of Personalized Diapause
• Key Steps of Personalized Diapause
• Extraction of Network Context
• Estimation of Network Transmission Trend
• Predictive Dormancy Analysis
• Experimental Results
• Conclusion
11
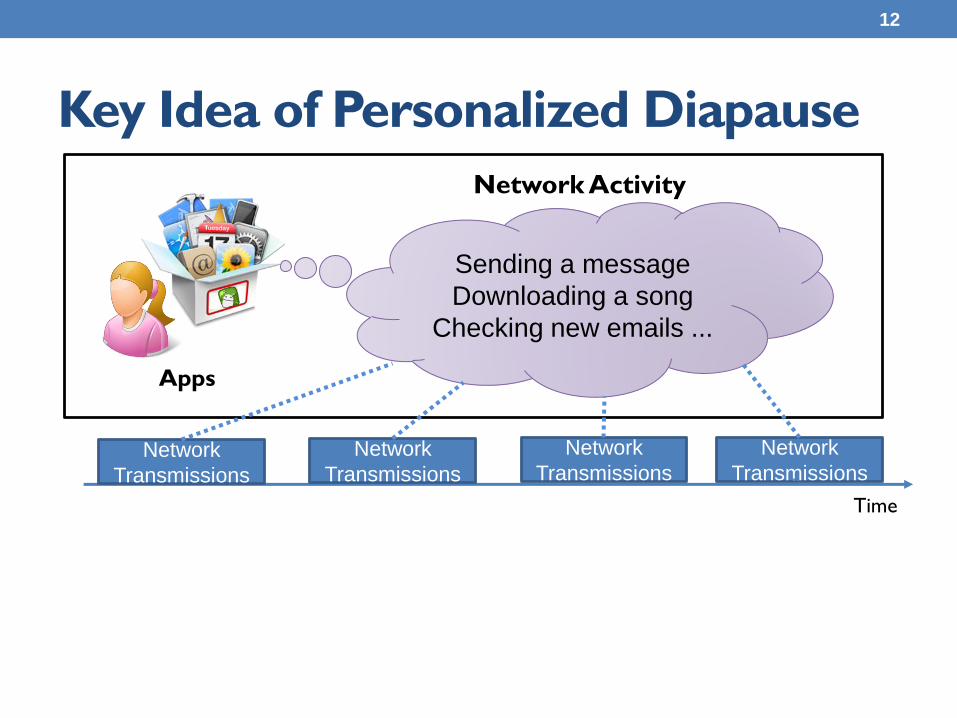
Key Idea of Personalized Diapause
12
Time
Network
Transmissions
Network
Transmissions
Network
Transmissions
Network
Transmissions
Sending a message
Downloading a song
Checking new emails ...
Network Activity
Apps
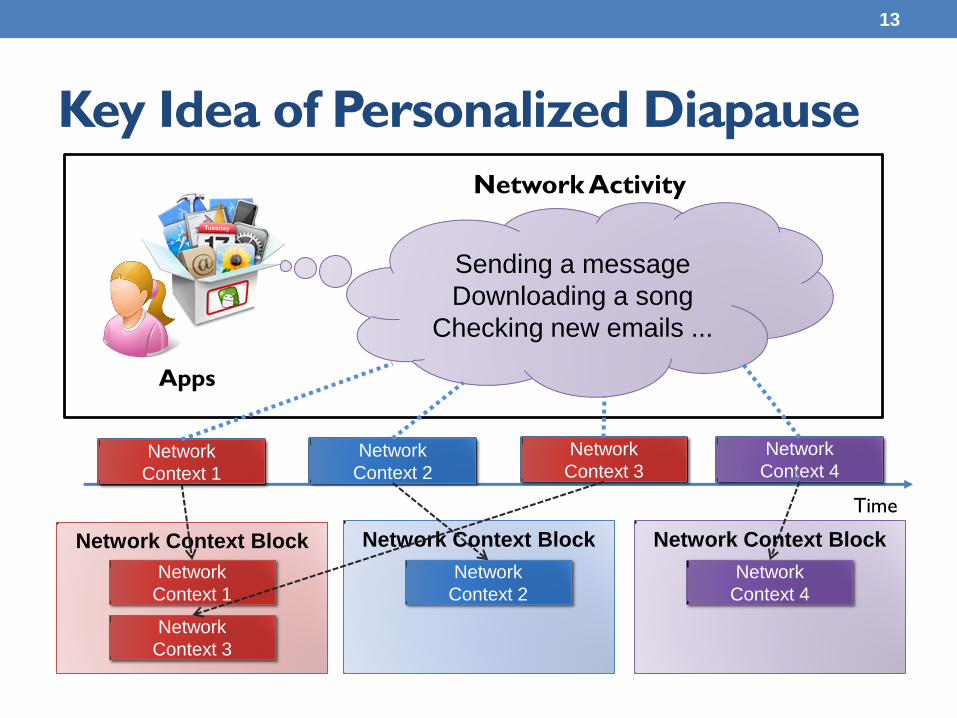
Key Idea of Personalized Diapause
13
Time
Network
Transmissions
Network
Transmissions
Network
Transmissions
Network
Transmissions Network
Context 1
Network
Context 2
Network
Context 3
Network
Context 4
Network Context Block Network Context Block Network Context Block
Network
Context 1
Network
Context 3
Network
Context 2
Network
Context 4
Sending a message
Downloading a song
Checking new emails ...
Network Activity
Apps
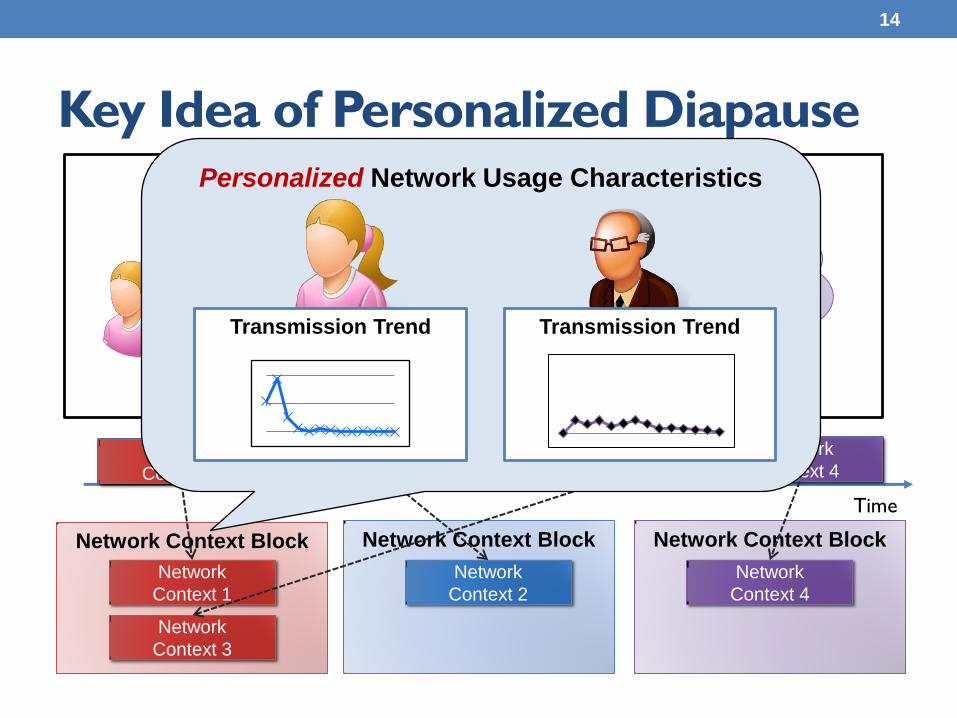
Key Idea of Personalized Diapause
14
Time
Network
Transmissions
Network
Transmissions
Network
Transmissions
Network
Transmissions Network
Context 1
Network
Context 2
Network
Context 3
Network
Context 4
Network Context Block Network Context Block Network Context Block
Network
Context 1
Network
Context 3
Network
Context 2
Network
Context 4
Sending a message
Downloading a song
Checking new emails ...
Network Activity
Apps
Personalized Network Usage Characteristics
Transmission Trend Transmission Trend
Transmission Trend Predictive Dormancy
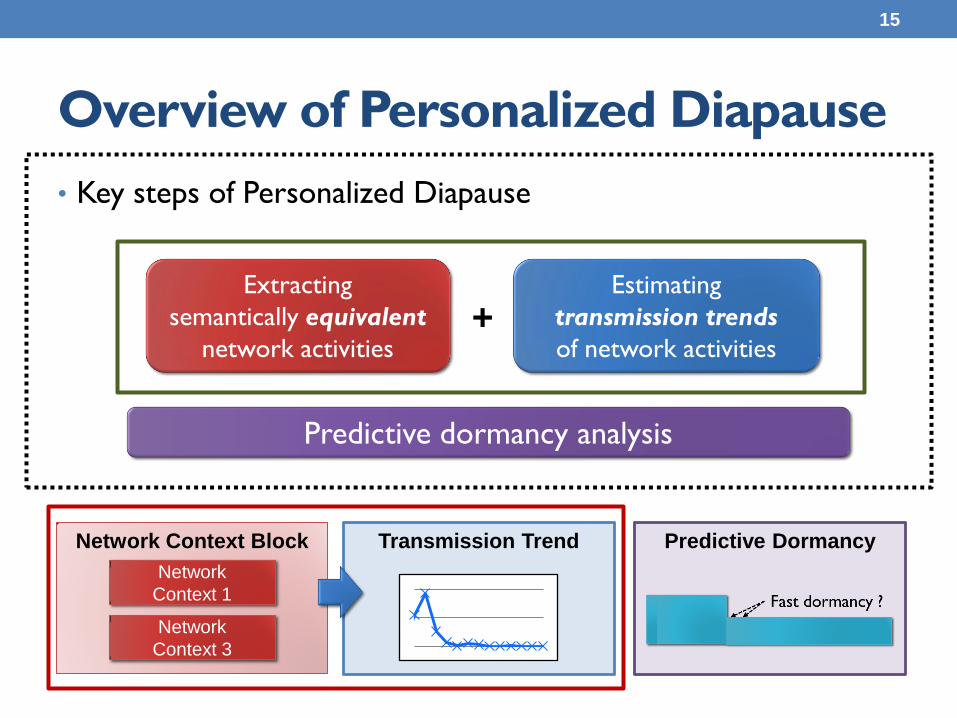
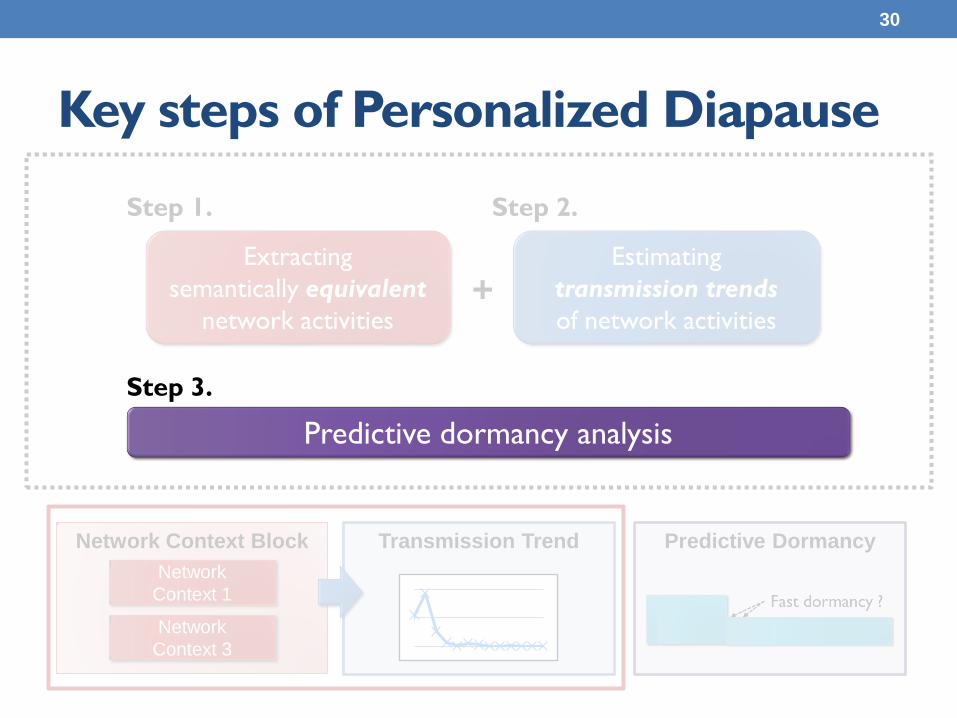
Overview of Personalized Diapause
15
Extracting
semantically equivalent
network activities
Estimating
transmission trends
of network activities +
Predictive dormancy analysis
Network Context Block
Network
Context 1
Network
Context 3
• Key steps of Personalized Diapause
Outline
• Introduction
• Overview of Personalized Diapause
• Key Steps of Personalized Diapause
• Extraction of Network Context
• Estimation of Network Transmission Trend
• Predictive Dormancy Analysis
• Experimental Results
• Conclusion
16

• Network Transmissions are transferred due to network activities.
Network
Context
Network
Context
Network
Context
Step 1. Extraction of Network Context
17
Network
Context
Time
Netw
ork
Tra
nsm
issi
on
~
~
Apps Downloading
a song
Downloading
a song
Fetching
new emails
Sending
an email
Network Activity

• Network Transmissions are transferred due to network activities.
Network
Context
Network
Context
Network
Context
Step 1. Extraction of Network Context
18
Network
Context
Time
Netw
ork
Tra
nsm
issi
on
~
~
Apps Downloading
a song
Downloading
a song
Fetching
new emails
Sending
an email
Execution Path
A
Execution Path
A
Execution Path
B
Execution Path
C System
Software
The network activities can be systematically
distinguished from their execution paths.
Network
Context 2 Network
Context 1
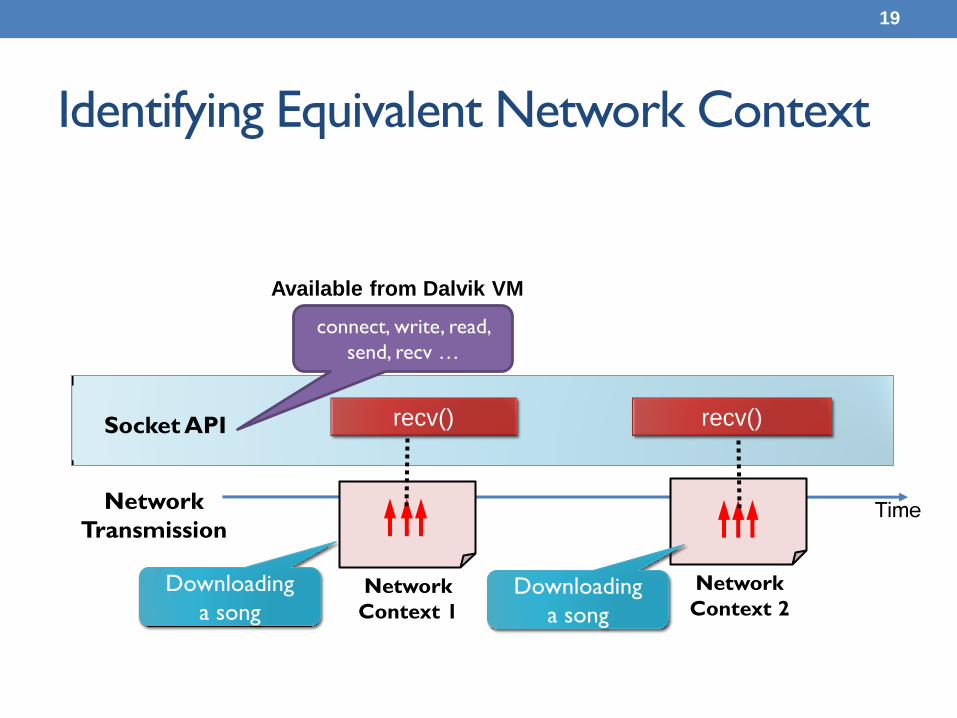
Identifying Equivalent Network Context
19
Time Network
Transmission
recv() recv() Socket API
Downloading
a song
Available from Dalvik VM
connect, write, read,
send, recv …
Downloading
a song
Network
Context 2 Network
Context 1
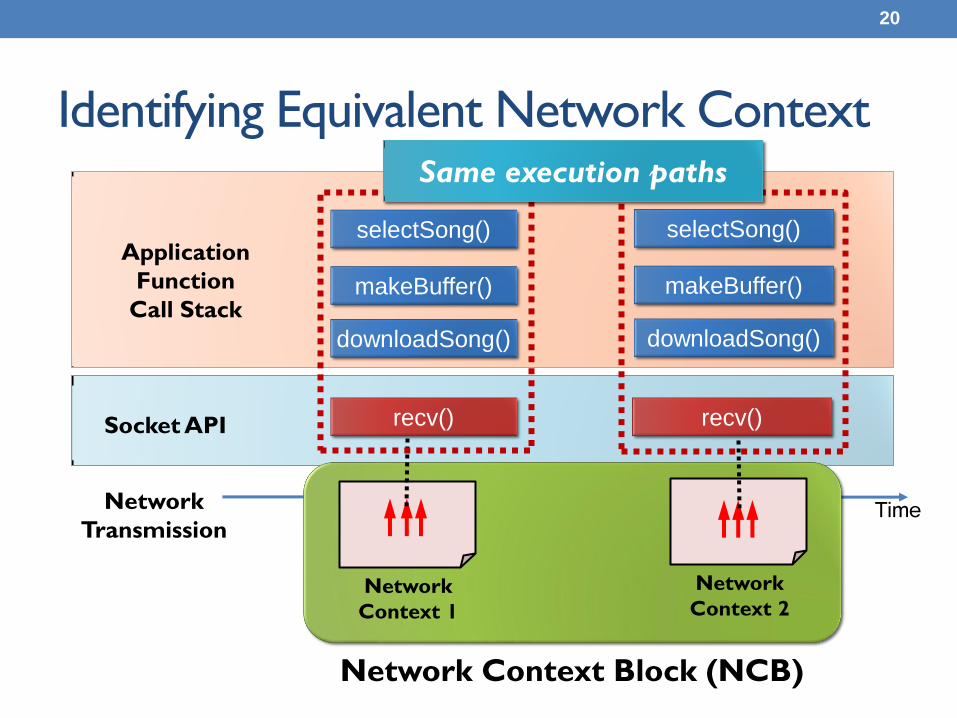
selectSong()
makeBuffer()
downloadSong()
selectSong()
makeBuffer()
downloadSong()
Application
Function
Call Stack
Identifying Equivalent Network Context
20
Time Network
Transmission
recv() recv() Socket API
Same execution paths
Network Context Block (NCB)
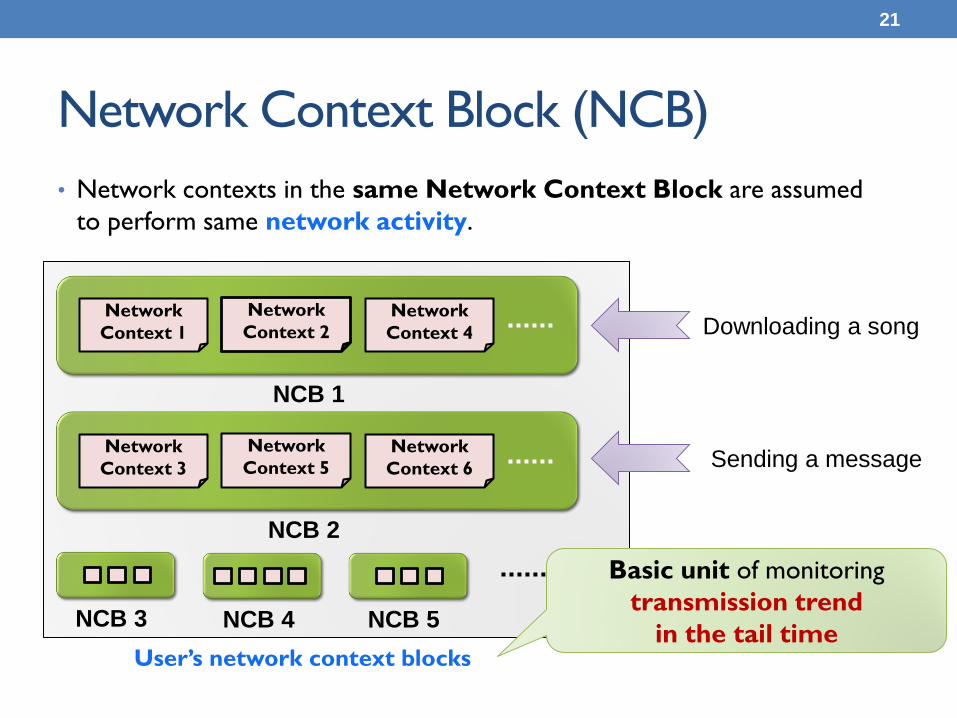
• Network contexts in the same Network Context Block are assumed
to perform same network activity.
Network Context Block (NCB)
21
Network
Context 1
Network
Context 2
Network
Context 4
Network
Context 3
Network
Context 5
Network
Context 6
NCB 1
NCB 2
NCB 3 NCB 4 NCB 5
Downloading a song
Sending a message
User’s network context blocks
Basic unit of monitoring
transmission trend
in the tail time
Predictive Dormancy Transmission Trend
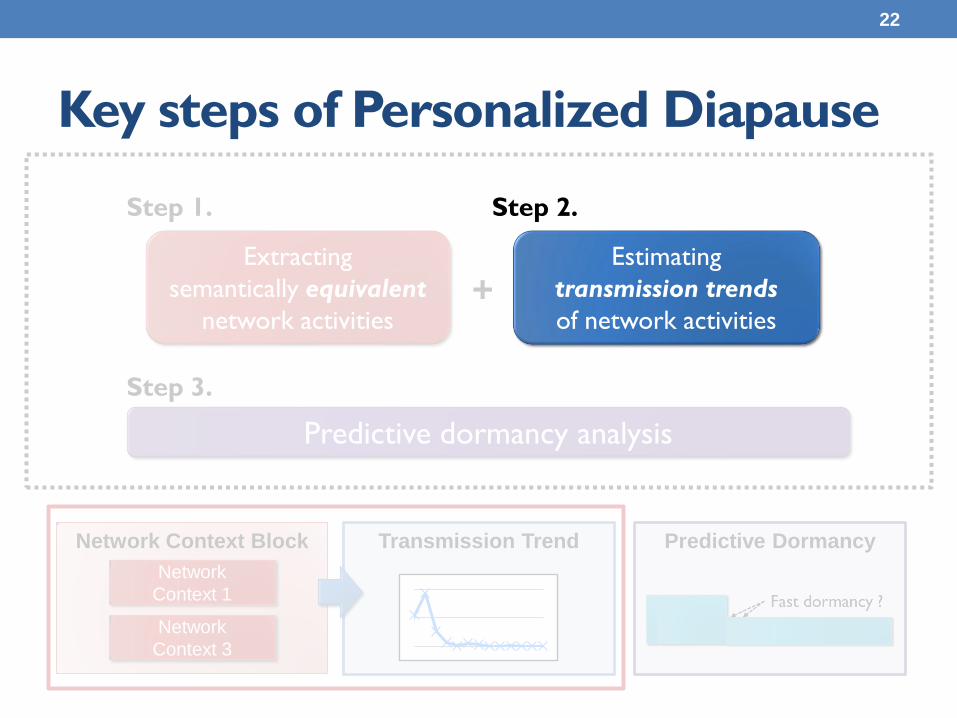
Key steps of Personalized Diapause
22
Extracting
semantically equivalent
network activities +
Predictive dormancy analysis
Network Context Block
Network
Context 1
Network
Context 3
Step 1.
Step 3.
Estimating
transmission trends
of network activities
Step 2.
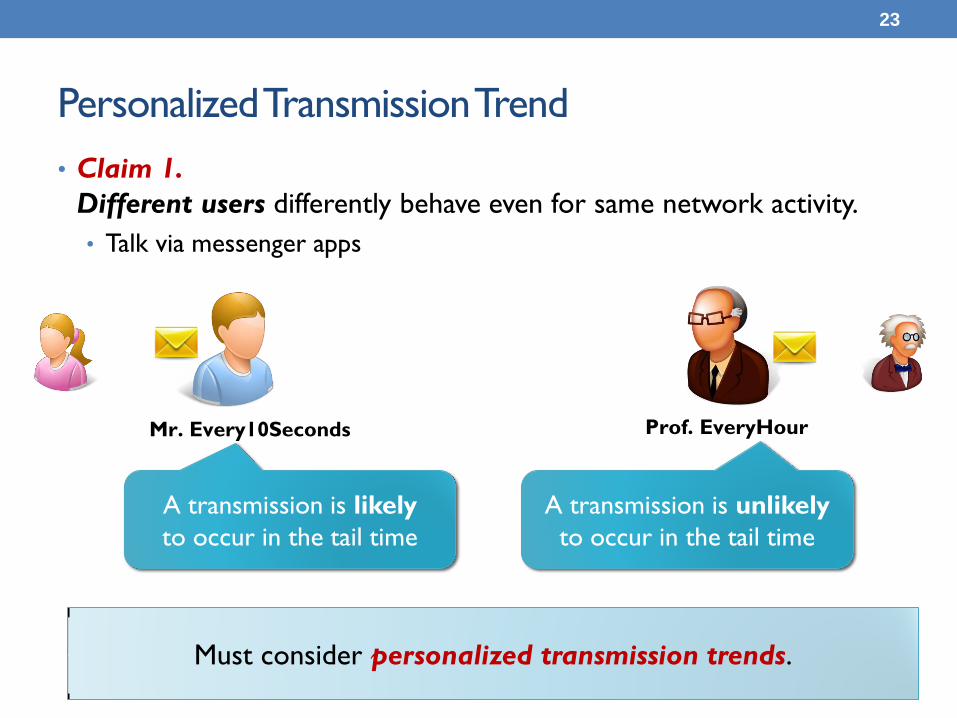
Personalized Transmission Trend
• Claim 1.
Different users differently behave even for same network activity.
• Talk via messenger apps
23
Mr. Every10Seconds Prof. EveryHour
A transmission is unlikely
to occur in the tail time
Must consider personalized transmission trends.
A transmission is likely
to occur in the tail time
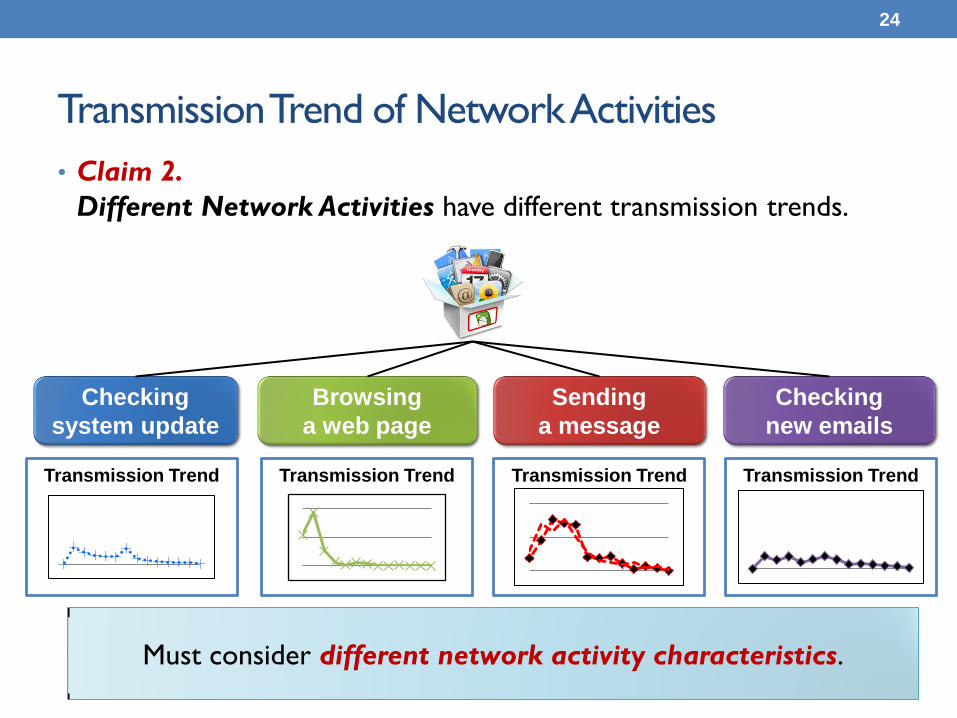
Transmission Trend of Network Activities
• Claim 2.
Different Network Activities have different transmission trends.
24
Must consider different network activity characteristics.
Checking
system update
Browsing
a web page
Checking
new emails
Sending
a message
Transmission Trend Transmission Trend Transmission Trend Transmission Trend
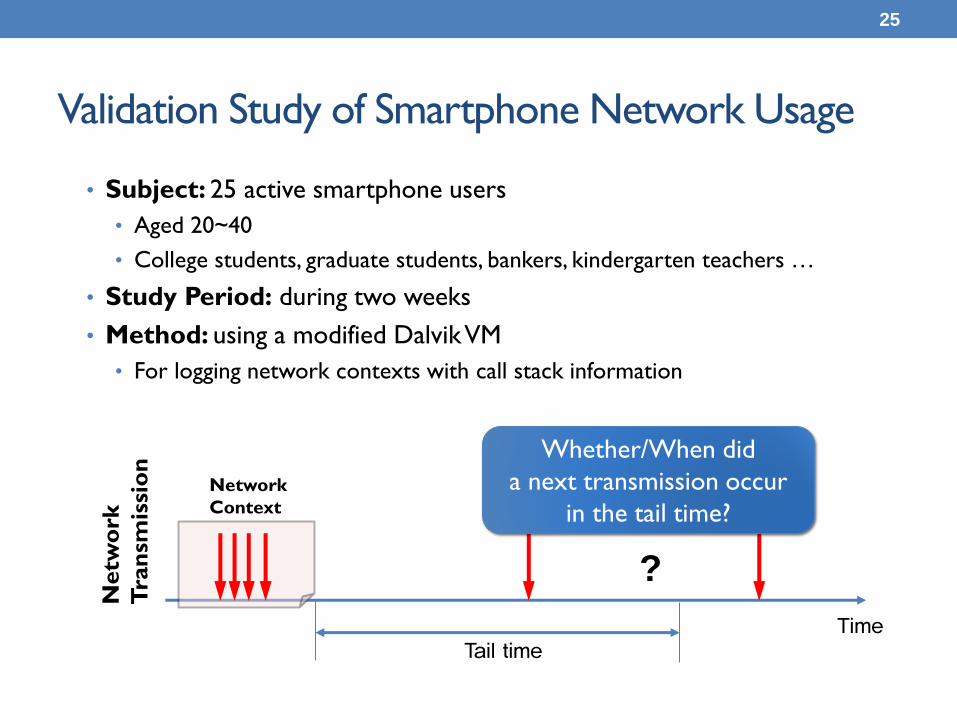
Validation Study of Smartphone Network Usage
• Subject: 25 active smartphone users
• Aged 20~40
• College students, graduate students, bankers, kindergarten teachers …
• Study Period: during two weeks
• Method: using a modified Dalvik VM
• For logging network contexts with call stack information
25
Network
Context
Time Tail time
Netw
ork
Tra
nsm
issi
on
Whether/When did
a next transmission occur
in the tail time?
?
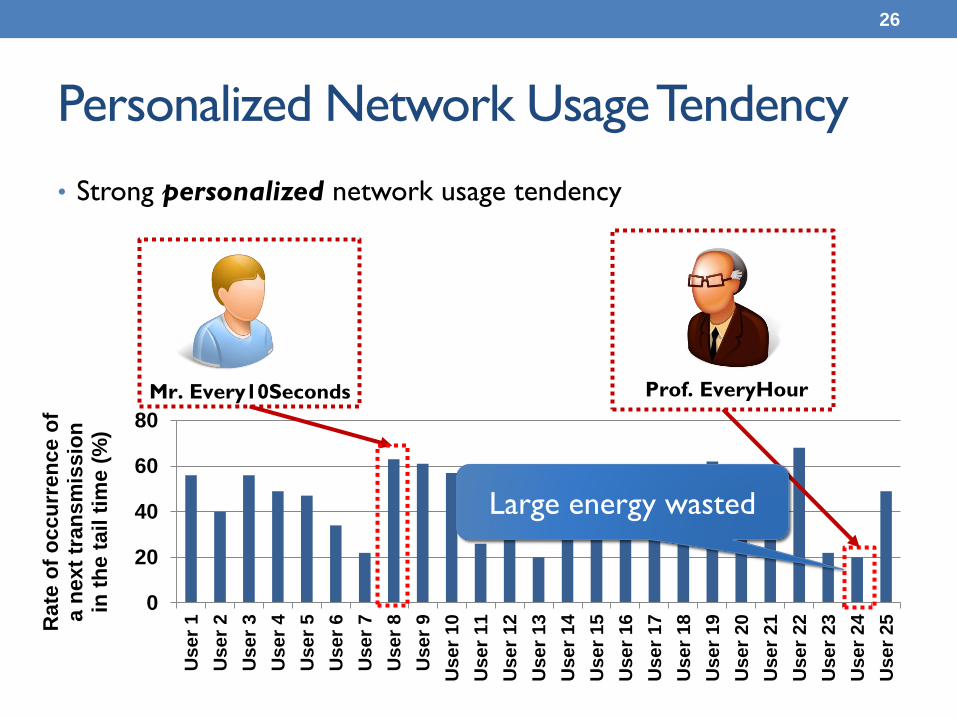
Personalized Network Usage Tendency
• Strong personalized network usage tendency
26
Mr. Every10Seconds Prof. EveryHour
0
20
40
60
80
Us
er
1
Us
er
2
Us
er
3
Us
er
4
Us
er
5
Us
er
6
Us
er
7
Us
er
8
Us
er
9
Us
er
10
User
11
Us
er
12
User
13
Us
er
14
User
15
Us
er
16
Us
er
17
Us
er
18
Us
er
19
Us
er
20
Us
er
21
Us
er
22
Us
er
23
Us
er
24
Us
er
25Rate
of
occu
rren
ce o
f a n
ext
tran
sm
issio
n
in t
he t
ail t
ime (
%)
Large energy wasted
0
10
20
30
40
50
60
3 4 5 6 7 8 9 10 11 12 13 14 15
Rate
of
occu
rren
ce o
f a n
ext
tran
sm
issio
n (
%)
Time of occurrence of a next transmission (sec)
Week 1
Week 2
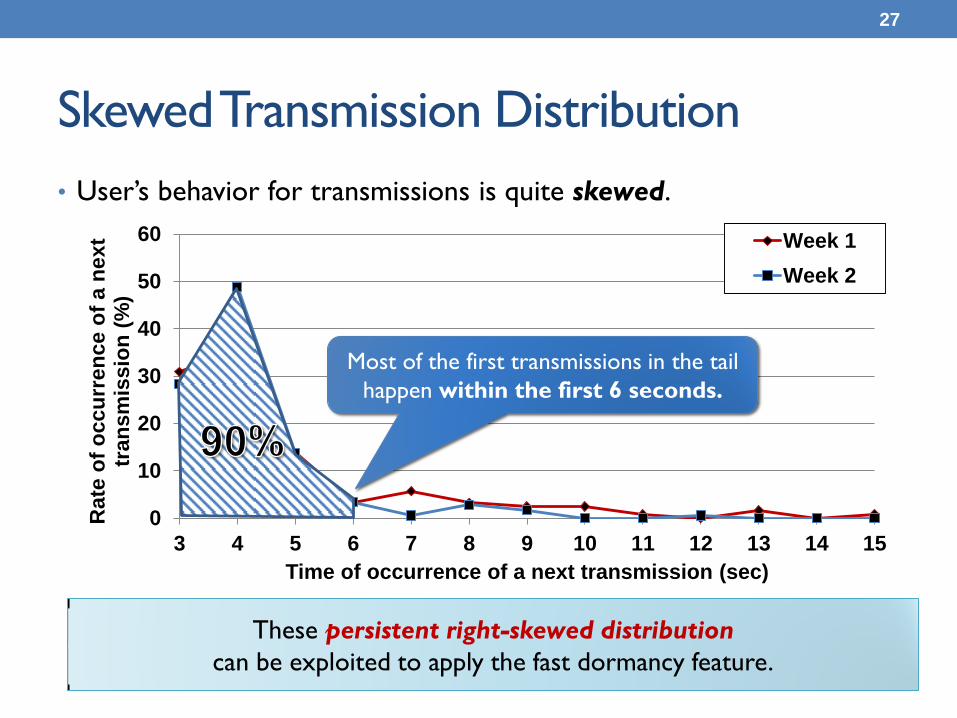
Skewed Transmission Distribution
• User’s behavior for transmissions is quite skewed.
27
Most of the first transmissions in the tail
happen within the first 6 seconds.
These persistent right-skewed distribution
can be exploited to apply the fast dormancy feature.

Transmission Characteristics
for Different Network Activities Per User • Different transmission characteristics for different network activities
• The transmission trend of each NCB persists over long time.
28
0
10
20
30
40
50
60
70
80
1 2 3 4
Rate
of
occu
rren
ce o
f a n
ext
tran
sm
issio
n
in t
he t
ail t
ime (
%)
Week 1 Week 2
Checking
system update
Browsing
a web page
Sending
a message
Fetching
new emails
Exploiting these persistent transmission trends over different
NCBs ,we can estimate transmissions in the tail time.
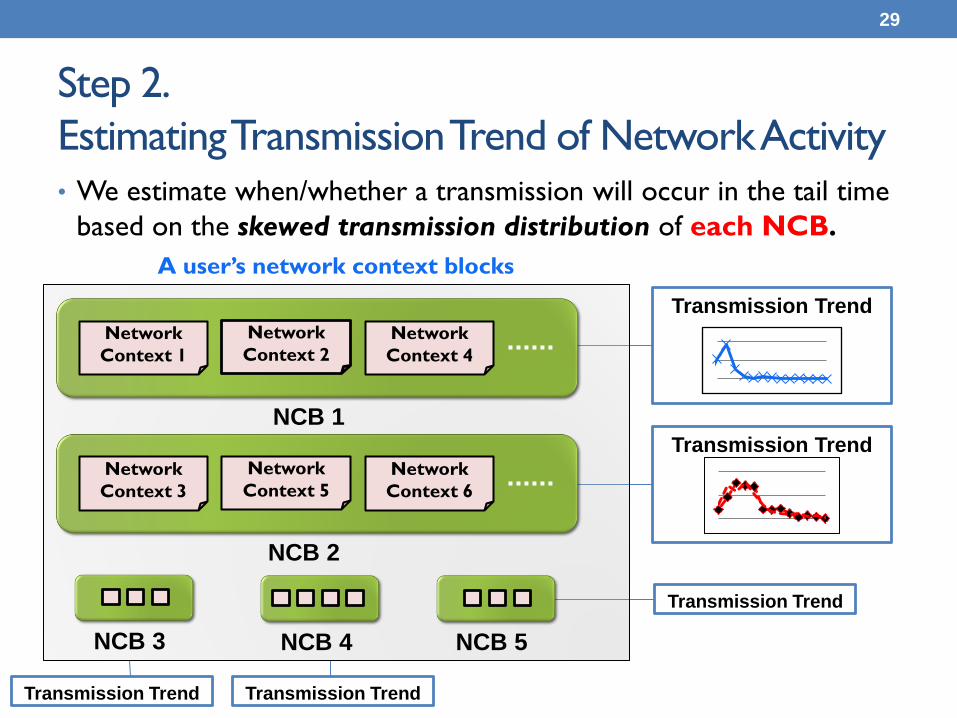
Step 2.
Estimating Transmission Trend of Network Activity
• We estimate when/whether a transmission will occur in the tail time
based on the skewed transmission distribution of each NCB.
29
A user’s network context blocks
Transmission Trend
Transmission Trend
Transmission Trend Transmission Trend
Transmission Trend
Network
Context 1
Network
Context 2
Network
Context 4
Network
Context 3
Network
Context 5
Network
Context 6
NCB 1
NCB 2
NCB 3 NCB 4 NCB 5
Predictive Dormancy Transmission Trend
Key steps of Personalized Diapause
30
Extracting
semantically equivalent
network activities +
Network Context Block
Network
Context 1
Network
Context 3
Step 1. Step 2.
Estimating
transmission trends
of network activities
Predictive dormancy analysis
Step 3.
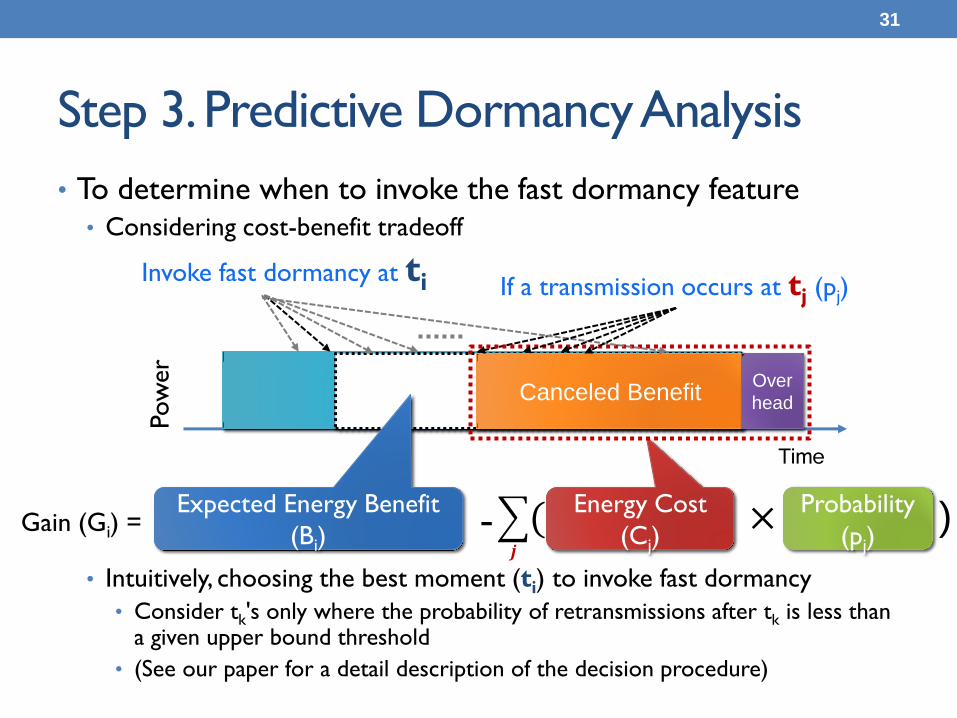
Step 3. Predictive Dormancy Analysis
• To determine when to invoke the fast dormancy feature • Considering cost-benefit tradeoff
• Intuitively, choosing the best moment (ti) to invoke fast dormancy
• Consider tk's only where the probability of retransmissions after tk is less than a given upper bound threshold
• (See our paper for a detail description of the decision procedure)
31
Time
Tail Energy
Invoke fast dormancy at ti
Pow
er
Expected Energy Benefit
(Bi)
Canceled Benefit
Energy Cost
(Cj)
If a transmission occurs at tj (pj)
Over
head
- ( × ) Probability
(pj) Gain (Gi) =
𝒋
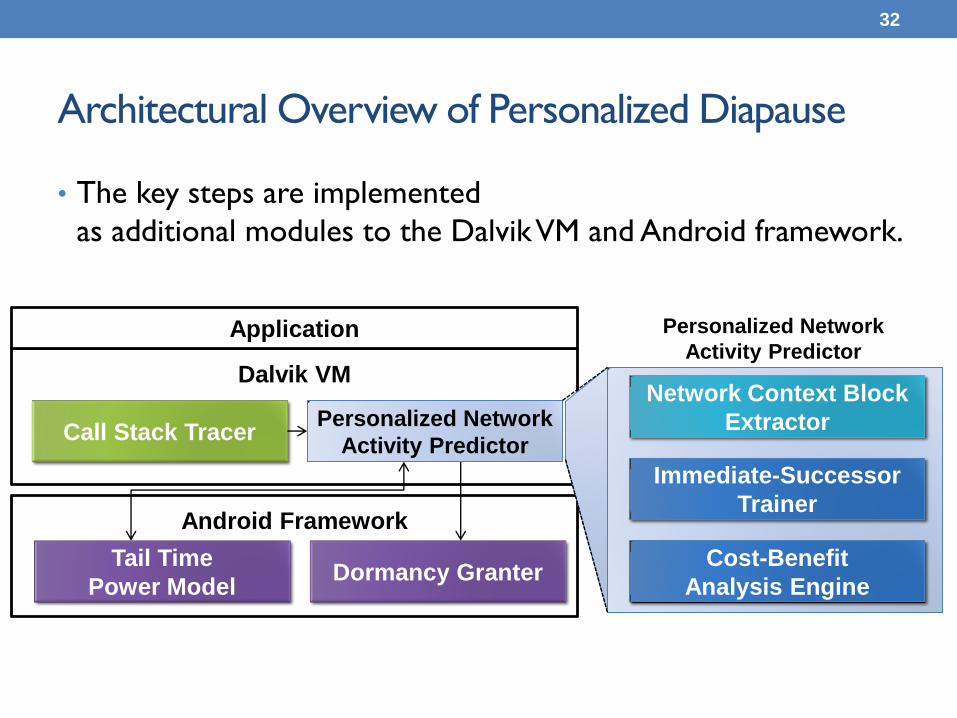
Architectural Overview of Personalized Diapause
32
Android Framework
Dalvik VM
Application
Call Stack Tracer
Network Context Block
Extractor
Tail Time
Power Model Dormancy Granter
Cost-Benefit
Analysis Engine
Immediate-Successor
Trainer
Personalized Network
Activity Predictor
Personalized Network
Activity Predictor
• The key steps are implemented
as additional modules to the Dalvik VM and Android framework.
Outline
• Introduction
• Overview of Personalized Diapause
• Key Steps of Personalized Diapause
• Extraction of Network Context
• Estimation of Network Transmission Trend
• Predictive Dormancy Analysis
• Experimental Results
• Conclusion
33

• Implemented the Personalized Diapause (PD) technique
on Nexus S Android reference smartphones
• Running Android 2.3 (Gingerbread)
• To Dalvik VM and Android framework
• Using the collected network transmission logs from 25 users
• A custom log replayer tool reproduced network contexts logs.
• A 3G energy simulator was used for energy consumption comparison.
Experimental Environment
34
Log Replayer
Nexus S
(Target Device)
3G Energy Simulator User Log Transmission &
Fast dormancy Log
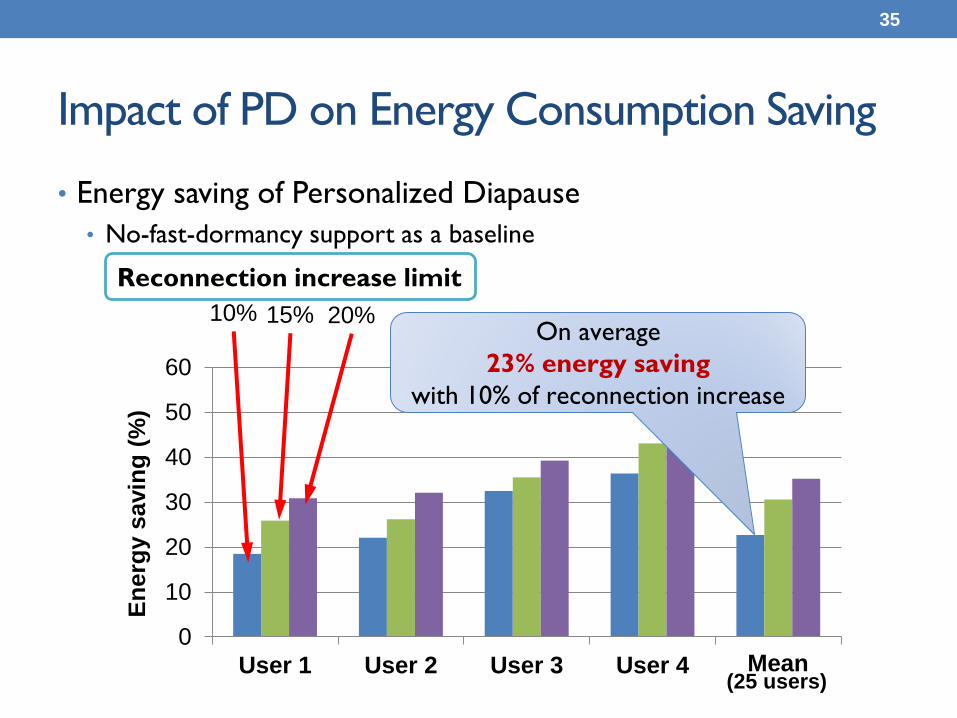
Impact of PD on Energy Consumption Saving
• Energy saving of Personalized Diapause
• No-fast-dormancy support as a baseline
35
0
10
20
30
40
50
60
User 1 User 2 User 3 User 4 Mean
En
erg
y s
avin
g (
%)
Mean (25 users)
10% 15% 20%
Reconnection increase limit
On average
23% energy saving
with 10% of reconnection increase

Impact of NCB Classification Technique
• Comparison with Per-user PD
• Assuming that all network contexts are classified to a single NCB.
36
0
5
10
15
20
25
30
35
40
User 1 User 2 User 3 User 4 Mean
En
erg
y S
avin
g (
%)
PD Per-user PD
Mean (25 users)
The fine-grained NCB separation based on semantic differences is
important in achieving a high energy efficiency.
Very poor energy saving
Per-NCB
Per-user Per-user vs
Conclusions
• We presented a general-purpose automatic predictive dormancy technique, Personalized Diapause. • Optimizing the radio energy consumption of smartphones with the fast
dormancy feature
• Personalized Diapause takes advantages of personalized network context usage in deciding when to release a radio connection. • Based on an automatic extraction technique of meaningful network
activities
• Future work • Extend for other types of system optimizations using other useful
information available from the network context.
37
Thank you
38