Embed Size (px)
Citation preview

Corporate Data
会社情報
11月30日に終了した事業年度/Year ended November 30 *事業年度末/At Year-end
連結業績ハイライト/Consolidated Performance Highlights
400
300
200
100
0
(十億円 /¥ billion) 456
468 474 452471
482
20
15
10
5
0
(十億円 /¥ billion)
14.2
15.814.0
17.7
22.122.4
20
15
10
5
0
(十億円 /¥ billion)
10.0
7.5
5.0
2.5
0
(十億円 /¥ billion)
6.1
7.37.7
9.0
10.6 10.8
240
180
120
60
0
(十億円 /¥ billion)
290 293 292 276288
160
120
80
40
0
(十億円 /¥ billion)
156161
164171
181
売上高Net sales
14.315.8
14.2
18.4
22.8 22.6
20062007 2008 2009 2010 2011E*
2006 2007 2008 2009 2010 2011E*
2006 2007 2008 2009 2010 2011E*
2006 2007 2008 2009 2010 2011E*
20062007
20082009
2010
20062007
20082009
2010
営業利益Operating income
経常利益Ordinary income
当期純利益Net income
総資産Total assets
純資産Net assets
2010年11月期は、フードサービス戦略の本格的展開とグループコストの低減により、増収・増益となりましたSales and profits for the Kewpie Group in this fiscal year increased through our efforts
such as full-fledged execution of our food service strategy
and the reduction of overall costs as a Group

連結貸借対照表Consolidated Balance Sheets
Assets
Current assets
Cash and deposits
Notes and accounts receivable - trade
Securities
Purchased goods and products
Work in process
Raw materials and supplies
Deferred tax assets
Other
Allowances for doubtful accounts
Total current assets
Fixed assets
Tangible fixed assets
Buildings and structures
Accumulated depreciation
Net book value
Machinery, equipment and transportation equipment
Accumulated depreciation
Net book value
Land
Lease assets
Accumulated depreciation
Net book value
Construction in progress
Other
Accumulated depreciation
Net book value
Total tangible fixed assets
Intangible fixed assets
Computer software
Other
Total intangible fixed assets
Investments and other assets
Investment securities
Long-term loans receivable
Prepaid pension costs
Deferred tax assets
Other
Allowances for doubtful accounts
Total investments and other assets
Total fixed assets
Total assets
資産の部
流動資産:
現金及び預金
受取手形及び売掛金
有価証券
商品及び製品
仕掛品
原材料及び貯蔵品
繰延税金資産
その他
貸倒引当金
流動資産合計
固定資産:
有形固定資産
建物及び構築物
減価償却累計額
建物及び構築物(純額)
機械装置及び運搬具
減価償却累計額
機械装置及び運搬具(純額)
土地
リース資産
減価償却累計額
リース資産(純額)
建設仮勘定
その他
減価償却累計額
その他(純額)
有形固定資産合計
無形固定資産
ソフトウエア
その他
無形固定資産合計
投資その他の資産
投資有価証券
長期貸付金
前払年金費用
繰延税金資産
その他
貸倒引当金
投資その他の資産合計
固定資産合計
資産合計
2010
29,718
64,701
5,000
10,372
733
4,319
2,297
3,358
(359)
120,142
126,716
(78,482)
48,233
126,661
(103,827)
22,834
40,752
2,193
(398)
1,795
2,507
8,987
(7,417)
1,570
117,693
1,793
521
2,315
19,495
835
17,753
696
9,810
(785)
47,806
167,815
287,957
(百万円 /¥ million)2009年、2010年11月30日現在/At November 30, 2009 and 2010
2009
23,148
61,342
5,000
9,529
762
4,097
2,141
2,709
(356)
108,374
123,890
(75,054)
48,835
125,623
(102,742)
22,880
40,463
780
(83)
696
1,535
8,747
(7,134)
1,613
116,024
1,858
402
2,261
19,795
1,142
18,446
591
9,740
(726)
48,989
167,276
275,650

Liabilities
Current liabilities:
Notes and accounts payable - trade
Short-term loans payable
Accounts payable-other
Accrued expenses
Accrued income taxes
Deferred tax liabilities
Reserve for sales rebates
Reserve for bonuses
Reserve for directors’ and corporate auditors’ bonuses
Other
Total current liabilities
Long-term liabilities:
Bonds
Long-term loans payable
Deferred tax liabilities
Reserve for retirement benefits
Other
Total long-term liabilities
Total liabilities
Net assets
Shareholders’ equity
Paid-in capital
Capital surplus
Earned surplus
Treasury stock
Total shareholders’ equity
Valuation and translation adjustments
Unrealized holding gains on securities
Unrealized holding gains (or losses) on hedges
Foreign currency translation adjustment
Total valuation and translation adjustments
Minority interests
Total net assets
Total liabilities and net assets
負債の部
流動負債:
支払手形及び買掛金
短期借入金
未払金
未払費用
未払法人税等
繰延税金負債
売上割戻引当金
賞与引当金
役員賞与引当金
その他
流動負債合計
固定負債:
社債
長期借入金
繰延税金負債
退職給付引当金
その他
固定負債合計
負債合計
純資産の部
株主資本:
資本金
資本剰余金
利益剰余金
自己株式
株主資本合計
評価・換算差額等:
その他有価証券評価差額金
繰延ヘッジ損益
為替換算調整勘定
評価・換算差額等合計
少数株主持分:
純資産合計
負債純資産合計
2010
39,078
19,953
14,776
8,798
5,737
3
1,019
974
135
1,271
91,747
500
1,548
7,041
2,488
3,728
15,307
107,055
24,104
29,432
109,600
(3,847)
159,290
1,111
(20)
(4,247)
(3,156)
24,767
180,901
287,957
2009
37,023
11,537
13,292
8,535
5,929
3
1,067
643
93
651
78,778
500
12,744
7,293
2,623
2,907
26,068
104,846
24,104
29,432
101,396
(3,843)
151,089
1,213
(58)
(3,831)
(2,676)
22,391
170,804
275,650
(百万円 /¥ million)

連結損益計算書
Net sales
Cost of sales
Gross profit
Selling, general and administrative expenses
Operating income
Non-operating income
Interest income
Dividends receivable
Equity in earnings of affiliates
Other
Non-operating expenses
Interest expenses
Exchange gain, net
Other
Ordinary income
Extraordinary gains
Prior period adjustments
Gains on sales of fixed assets
Gains on sales of investment securities
Subsidies received
Reversal of allowance for doubtful accounts
Other
Extraordinary losses
Losses on sales of fixed assets
Losses on disposal of fixed assets
Losses on valuation of investment securities
Losses on impairment of fixed assets
Allowances for doubtful accounts
Other
Net income before income taxes and minority interests
Total Income taxes
Income taxes
Income taxes deferred
Minority interests
Net income
売上高
売上原価
売上総利益
販売費及び一般管理費
営業利益
営業外収益
受取利息
受取配当金
持分法による投資利益
その他
営業外費用
支払利息
為替差損
その他
経常利益
特別利益
前期損益修正益
固定資産売却益
投資有価証券売却益
補助金収入
貸倒引当金戻入額
その他
特別損失
固定資産売却損
固定資産除却損
投資有価証券評価損
減損損失
貸倒引当金繰入額
その他
税金等調整前当期純利益
法人税等合計
法人税、住民税及び事業税
法人税等調整額
少数株主利益
当期純利益
2010
471,010
354,622
116,388
94,268
22,119
1,467
196
296
196
778
824
337
117
368
22,762
218
—
41
28
40
67
41
1,608
—
1,071
360
—
—
176
21,372
9,337
9,589
(251)
1,420
10,613
2009
452,239
342,978
109,261
91,529
17,731
1,424
307
296
231
589
742
516
—
226
18,414
107
15
28
—
24
—
38
1,926
63
669
—
982
54
155
16,595
6,594
7,307
(713)
964
9,036
(百万円 /¥ million)2009年、2010年11月30日に終了した事業年度/For the years ended November 30, 2009 and 2010
Consolidated Statements of Income
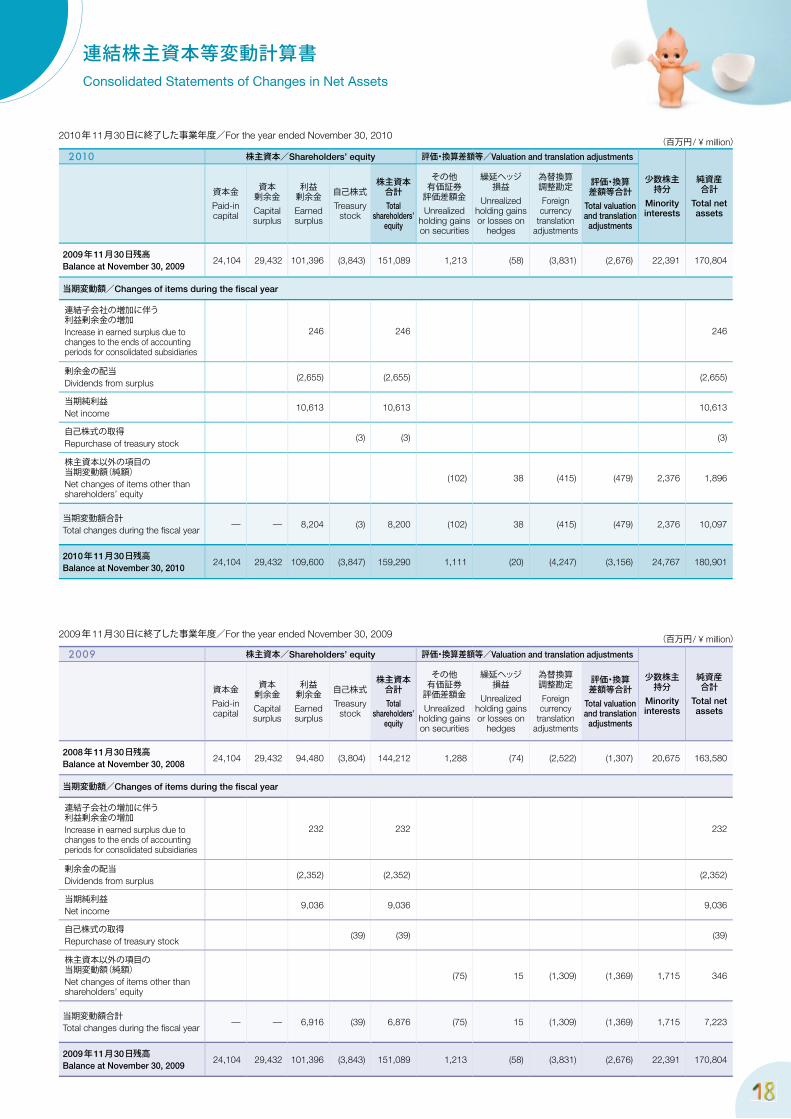
連結株主資本等変動計算書Consolidated Statements of Changes in Net Assets
2010年11月30日に終了した事業年度/For the year ended November 30, 2010
2009 株主資本/Shareholders’ equity 評価・換算差額等/Valuation and translation adjustments
少数株主持分
Minority interests
純資産合計
Total net assets
資本金Paid-in capital
資本剰余金Capital surplus
利益剰余金Earned surplus
自己株式Treasury
stock
株主資本合計Total
shareholders’ equity
その他有価証券評価差額金Unrealized
holding gains on securities
繰延ヘッジ損益
Unrealized holding gains or losses on
hedges
為替換算調整勘定Foreign currency
translation adjustments
評価・換算差額等合計
Total valuation and translation
adjustments
2008年11月30日残高Balance at November 30, 2008
24,104 29,432 94,480 (3,804) 144,212 1,288 (74) (2,522) (1,307) 20,675 163,580
当期変動額/Changes of items during the fi scal year
連結子会社の増加に伴う利益剰余金の増加Increase in earned surplus due to changes to the ends of accounting periods for consolidated subsidiaries
232 232 232
剰余金の配当Dividends from surplus
(2,352) (2,352) (2,352)
当期純利益Net income
9,036 9,036 9,036
自己株式の取得Repurchase of treasury stock
(39) (39) (39)
株主資本以外の項目の当期変動額(純額)Net changes of items other than shareholders’ equity
(75) 15 (1,309) (1,369) 1,715 346
当期変動額合計Total changes during the fi scal year
6,916 (39) 6,876 (75) 15 (1,309) (1,369) 1,715 7,223
2009年11月30日残高Balance at November 30, 2009
24,104 29,432 101,396 (3,843) 151,089 1,213 (58) (3,831) (2,676) 22,391 170,804
2009年11月30日に終了した事業年度/For the year ended November 30, 2009 (百万円 / ¥ million)
(百万円 / ¥ million)
2010 株主資本/Shareholders’ equity 評価・換算差額等/Valuation and translation adjustments
少数株主持分
Minority interests
純資産合計
Total net assets
資本金Paid-in capital
資本剰余金Capital surplus
利益剰余金Earned surplus
自己株式Treasury
stock
株主資本合計Total
shareholders’ equity
その他有価証券評価差額金Unrealized
holding gains on securities
繰延ヘッジ損益
Unrealized holding gains or losses on
hedges
為替換算調整勘定Foreign currency
translation adjustments
評価・換算差額等合計
Total valuation and translation
adjustments
2009年11月30日残高Balance at November 30, 2009
24,104 29,432 101,396 (3,843) 151,089 1,213 (58) (3,831) (2,676) 22,391 170,804
当期変動額/Changes of items during the fi scal year
連結子会社の増加に伴う利益剰余金の増加Increase in earned surplus due to changes to the ends of accounting periods for consolidated subsidiaries
246 246 246
剰余金の配当Dividends from surplus
(2,655) (2,655) (2,655)
当期純利益Net income
10,613 10,613 10,613
自己株式の取得Repurchase of treasury stock
(3) (3) (3)
株主資本以外の項目の当期変動額(純額)Net changes of items other than shareholders’ equity
(102) 38 (415) (479) 2,376 1,896
当期変動額合計Total changes during the fi scal year
8,204 (3) 8,200 (102) 38 (415) (479) 2,376 10,097
2010年11月30日残高Balance at November 30, 2010
24,104 29,432 109,600 (3,847) 159,290 1,111 (20) (4,247) (3,156) 24,767 180,901

連結キャッシュ・フロー計算書Consolidated Statements of Cash Flows
2009年、2010年11月30日に終了した事業年度/For the years ended November 30, 2009 and 2010
Cash flows from operating activities
Net income before income taxes and minority interests
Depreciation and amortization
Losses on impairment of fixed assets
Amortization of goodwill
Equity in losses (gains) of affiliates
Losses (gains) on valuation of investment securities
Losses on valuation of golf course memberships
Increase (decrease) in reserve for retirement benefits
Decrease (increase) in prepaid pension costs
Increase (decrease) in reserve for directors’ and corporate auditors’ retirement pay
Increase (decrease) in reserve for sales rebates
Increase (decrease) in reserve for directors’ and corporate auditors’ bonuses
Increase (decrease) in reserve for bonuses
Increase (decrease) in allowances for doubtful accounts
Interest income and dividends receivable
Interest expenses
Losses (gains) on sales of investment securities
Losses (gains) on sales and disposal of fixed assets
Decrease (increase) in notes and accounts receivable - trade
Decrease (increase) in inventories
Increase (decrease) in notes and accounts payable - trade
Increase (decrease) in accounts payable - other
Increase (decrease) in accrued consumption taxes
Increase (decrease) in long-term accounts payable
Other
Sub-total
Interest income and dividends received
Interest paid
Income taxes paid
Net cash provided by operating activities
Cash flows from investing activities
Purchases of tangible fixed assets
Purchases of intangible fixed assets
Purchases of investment securities
Proceeds from sales of investment securities
Acquisition of subsidiaries’ shares without change in scope of consolidation
Loans receivable made
Collection of loans receivable
Disbursements for deposit money in bank
Withdrawal of time deposits
Other
Net cash used in investing activities
Cash flows from financing activities
Net decrease in short-term loans payable
Repayment of lease obligations
Repayment of long-term loans payable
Paid in from minority shareholders
Redemption of bonds
Cash dividends paid
Cash dividends paid to minority shareholders
Repurchase of treasury stock
Net cash provided by (used in) financing activities
Effects of exchange rate changes on cash and cash equivalents
Increase (decrease) in cash and cash equivalents
Cash and cash equivalents at beginning of the term
Increase in cash and cash equivalents resulting from increase of consolidated subsidiaries
Cash and cash equivalents at end of the term
営業活動によるキャッシュ・フロー
税金等調整前当期純利益
減価償却費
減損損失
のれん償却額
持分法による投資損(益)
投資有価証券評価損(益)
ゴルフ会員権評価損
退職給付引当金の増加額(減少額)
前払年金費用の減少額(増加額)
役員退職慰労引当金の増加額(減少額)
売上割戻引当金の増加額(減少額)
役員賞与引当金の増加額(減少額)
賞与引当金の増加額(減少額)
貸倒引当金の増加額(減少額)
受取利息及び受取配当金
支払利息
投資有価証券売却損(益)
固定資産除売却損(益)
売上債権の減少額(増加額)
たな卸資産の減少額(増加額)
仕入債務の増加額(減少額)
未払金の増加額(減少額)
未払消費税等の増加額(減少額)
長期未払金の増加額(減少額)
その他
小計
利息及び配当金の受取額
利息の支払額
法人税等の支払額
営業活動によるキャッシュ・フロー
投資活動によるキャッシュ・フロー
有形固定資産の取得による支出
無形固定資産の取得による支出
投資有価証券の取得による支出
投資有価証券の売却による収入
連結範囲の変更を伴わない子会社株式の取得による支出
貸付けによる支出
貸付金の回収による収入
定期預金の預入による支出
定期預金の払戻による収入
その他
投資活動によるキャッシュ・フロー
財務活動によるキャッシュ・フロー
短期借入金の純減少額
リース債務の返済による支出
長期借入金の返済による支出
少数株主からの払込みによる収入
社債の償還による支出
配当金の支払額
少数株主への配当金の支払額
自己株式の取得による支出
財務活動によるキャッシュ・フロー
現金及び現金同等物に係る換算差額
現金及び現金同等物の増加額(減少額)
現金及び現金同等物の期首残高
新規連結に伴う現金及び現金同等物の増加額
現金及び現金同等物の期末残高
2010
21,372
13,129
—
11
(196)
360
1
(104)
735
—
(47)
16
80
61
(492)
337
(26)
1,036
(1,263)
(949)
1,471
675
(830)
(49)
57
35,388
555
(342)
(9,870)
25,731
(11,261)
(797)
(1,076)
182
(52)
(619)
250
(2,946)
2,659
(1,459)
(15,120)
(1,094)
(353)
(1,287)
281
—
(2,655)
(269)
(3)
(5,381)
(144)
5,085
27,831
205
33,121
2009
16,595
12,980
982
0
(231)
2
15
360
(770)
(147)
374
40
(121)
447
(604)
516
(0)
704
10,480
4,023
(12,059)
(1,867)
941
(48)
2,083
34,698
625
(517)
(3,505)
31,301
(10,730)
(798)
(3,461)
1,001
—
(459)
815
(463)
3,554
(1,007)
(11,548)
(900)
(108)
(4,819)
—
(10,000)
(2,352)
(241)
(39)
(18,462)
(265)
1,025
26,705
100
27,831
(百万円 /¥ million)
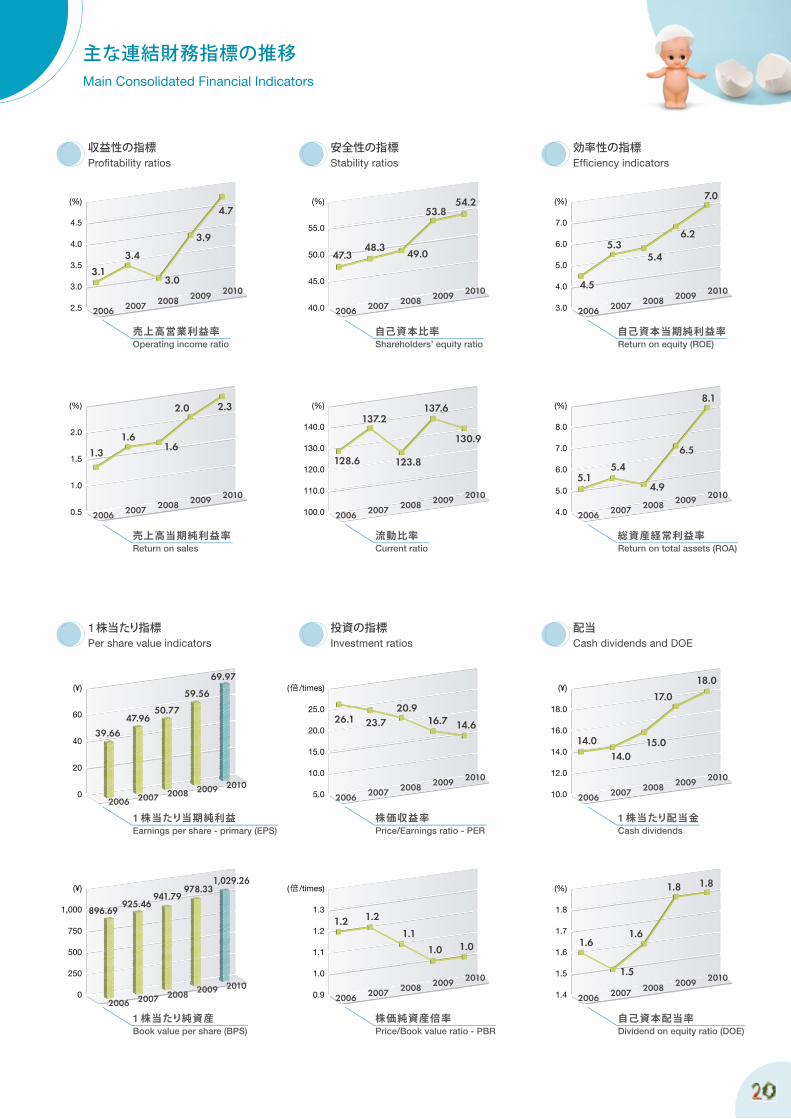
主な連結財務指標の推移Main Consolidated Financial Indicators
(%)
4.5
4.0
3.5
3.0
2.5 2006 2007 2008 2009 2010
3.1
3.4
3.0
3.9
収益性の指標Profi tability ratios
(%)
2.0
1.5
1.0
0.5 2006 2007 2008 2009 2010
1.3
1.61.6
2.0 2.3
売上高営業利益率Operating income ratio
売上高当期純利益率Return on sales
(%)
55.0
50.0
45.0
40.0 2006 2007 2008 2009 2010
47.3
安全性の指標Stability ratios
(%)
140.0
130.0
120.0
110.0
100.0 2006 2007 2008 2009 2010
128.6
自己資本比率Shareholders’ equity ratio
流動比率Current ratio
(%)
7.0
6.0
5.0
4.0
3.0 2006 2007 2008 2009 20104.5
5.35.4
6.2
7.0
効率性の指標Effi ciency indicators
(%)
8.0
7.0
6.0
5.0
4.0 2006 2007 2008 2009 2010
5.15.4
4.9
6.5
8.1
自己資本当期純利益率Return on equity (ROE)
総資産経常利益率Return on total assets (ROA)
(倍 /times)
25.0
20.0
15.0
10.0
5.0 2006 2007 2008 2009 2010
26.1
(¥)
18.0
16.0
14.0
12.0
10.0 2006 2007 2008 2009 2010
14.0
配当Cash dividends and DOE
(%)
1.8
1.7
1.6
1.5
1.4 2006 2007 2008 2009 2010
1.6
1株当たり配当金Cash dividends
自己資本配当率Dividend on equity ratio (DOE)
投資の指標Investment ratios
(倍 /times)
1.3
1.2
1.1
1.0
0.9 2006 2007 2008 2009 2010
1.2
株価収益率Price/Earnings ratio - PER
株価純資産倍率Price/Book value ratio - PBR
1株当たり指標Per share value indicators
1株当たり当期純利益Earnings per share - primary (EPS)
1株当たり純資産Book value per share (BPS)
(¥)
60
40
20
02006 2007 2008 2009 2010
39.66
47.9650.77
59.56
69.97
(¥)
1,000
750
500
250
02006 2007 2008 2009 2010
896.69
4.7
48.349.0
53.854.2
137.2
123.8
137.6
130.9
23.720.9
16.7 14.6
14.015.0
17.0
18.0
925.46941.79
978.331,029.26
1.2
1.1
1.0 1.0
1.5
1.6
1.8 1.8

株主名 Trade name持株数(千株)Number of the Company’s shares held (thousand shares)
持株比率Percentage of total (%)
(株)中島董商店 Nakashimato Co., Ltd. 26,371 16.9
(株)董花 Touka Co., Ltd. 4,872 3.1
みずほ信託銀行(株) 退職給付信託 みずほ銀行口再信託受託者 資産管理サービス信託銀行(株)
Mizuho Trust & Banking Co., Ltd. employee pension trust, asset management service trust for benefi ciary of the retrust
4,585 2.9
(財)旗影会 The Kieikai Research Foundation 4,251 2.7
全国共済農業協同組合連合会 National Mutual Insurance Federation of Agricultural Cooperatives (Zenkyoren) 4,224 2.7
日本トラスティ・サービス信託銀行(株)(信託口) Japan Trustee Service Bank, Ltd. (Trust Account) 4,180 2.6
日本マスタートラスト信託銀行(株)(信託口) The Master Trust Bank of Japan, Ltd. (Trust Account) 3,597 2.3
(株)三井住友銀行 Sumitomo Mitsui Banking Corporation 3,208 2.0
日本生命保険(相) Nippon Life Insurance Company 3,132 2.0
第一生命保険(株) The Dai-ichi Life Insurance Co., Ltd. 3,012 1.9
持株数および持株比率は表示単位未満を切り捨てて表示しております。Number of company shares held less than one thousand have been rounded off. Percentage of total have been rounded off to the nearest tenth percentage point.
上記の他、当社が自己株式3,719,188株を所有しております。Besides above, the Company owns 3,719,188 treasury stock.
0
4
8
12
0
4
8
12
0
400
800
1,200
1,600
2,000
400
800
1,200
1,600
2,000
0
FY2001 FY2002 FY2003 FY2004 FY2005 FY2006 FY2007 FY2008 FY2009 FY2010
16
20
16
20
株式の状況(2010年11月30日現在)/Share Overview (at November 30, 2010)
発行可能株式総数:500,000,000株Number of Authorized Shares:500,000,000 shares
発行済株式総数:155,464,515株Number of Shares Issued:155,464,515 shares
単元株式数:100株Shares per Trading Unit:100 shares
株主数:110,554名Number of Shareholders:110,554
株価の推移/Common Stock Price Trends
所有者別株式分布/Breakdown of Shareholders
金融機関Financial institutions
29.02% 証券会社Securities fi rms
その他の法人Other corporations
外国法人等Foreign corporations, etc.
個人その他Individuals, other
自己名義株式Treasury stocks
株価(円) Common stock price range (¥) Monthly stock price range (¥)
出来高(百万株) Monthly trading volume (million shares)
0.32%
35.26%
8.73%
24.28%
2.39%
大株主の状況/Principal Shareholders
株式情報 Shareholder Information
株価(円) Common stock price range (¥) TOPIX (¥)
会社概要/Corporate Data
商号:キユーピー株式会社Corporate Name: Kewpie Corporation
設立:1919年11月30日Founded: November 30, 1919
資本金:241億400万円Paid-in Capital: ¥ 24,104 million
従業員数(連結):11,732名Number of Employees (consolidated): 11,732
本社:東京都渋谷区渋谷1丁目4番13号Location of Head Office: 4-13, Shibuya 1-chome, Shibuya-ku, Tokyo, Japan
上場証券取引所:東京証券取引所市場第一部(証券コード:2809)Stock Exchange Listings: Tokyo Stock Exchange 1st section (Ticker Code: 2809)
米国預託証券:店頭登録(証券シンボル:KWCPY)American Depositary Receipts (ADRs): OTC (Symbol: KWCPY)
株主名簿管理人:住友信託銀行株式会社Transfer Agent: The Sumitomo Trust & Banking Co., Ltd.
会社情報 Corporate Information
このインベスターズガイドに記載した予想数値は、現時点で入手可能な情報に基づき判断した見通しであり、多分に不確定な要素を含んでおります。実際の業績等は、業況の変化等により、予想数値と異なる場合があります。The foregoing forecasts are based on the information available as of the date when this information is disclosed in this Investors’ Guide. Actual Performance may differ from the forecasts due to unpredictable parameters that are probable to affect our future business performances in the end.
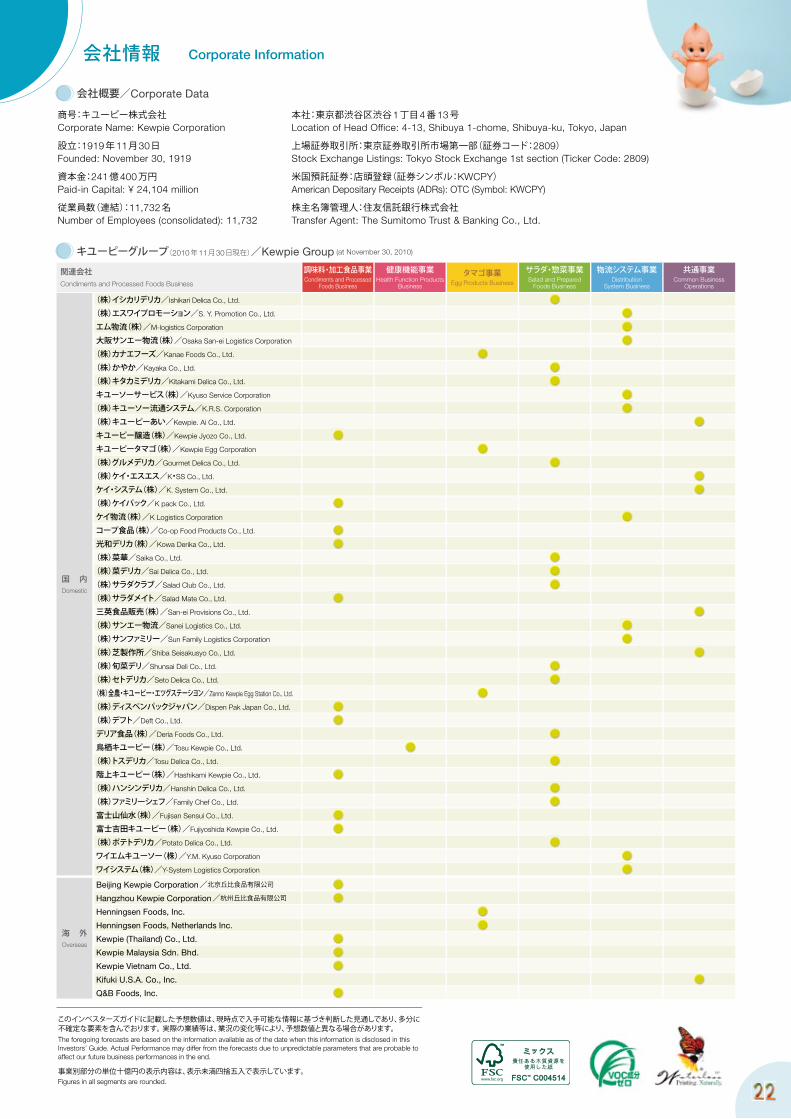
事業別部分の単位十億円の表示内容は、表示未満四捨五入で表示しています。Figures in all segments are rounded.
キユーピーグループ(2010年11月30日現在)/Kewpie Group (at November 30, 2010)
(株)イシカリデリカ/Ishikari Delica Co., Ltd.
(株)エスワイプロモーション/S. Y. Promotion Co., Ltd.
エム物流(株)/M-logistics Corporation
大阪サンエー物流(株)/Osaka San-ei Logistics Corporation
(株)カナエフーズ/Kanae Foods Co., Ltd.
(株)かやか/Kayaka Co., Ltd.
(株)キタカミデリカ/Kitakami Delica Co., Ltd.
キユーソーサービス(株)/Kyuso Service Corporation
(株)キユーソー流通システム/K.R.S. Corporation
(株)キユーピーあい/Kewpie. Ai Co., Ltd.
キユーピー醸造(株)/Kewpie Jyozo Co., Ltd.
キユーピータマゴ(株)/Kewpie Egg Corporation
(株)グルメデリカ/Gourmet Delica Co., Ltd.
(株)ケイ・エスエス/K・SS Co., Ltd.
ケイ・システム(株)/K. System Co., Ltd.
(株)ケイパック/K pack Co., Ltd.
ケイ物流(株)/K Logistics Corporation
コープ食品(株)/Co-op Food Products Co., Ltd.
光和デリカ(株)/Kowa Derika Co., Ltd.
(株)菜華/Saika Co., Ltd.
(株)菜デリカ/Sai Delica Co., Ltd.
(株)サラダクラブ/Salad Club Co., Ltd.
(株)サラダメイト/Salad Mate Co., Ltd.
三英食品販売(株)/San-ei Provisions Co., Ltd.
(株)サンエー物流/Sanei Logistics Co., Ltd.
(株)サンファミリー/Sun Family Logistics Corporation
(株)芝製作所/Shiba Seisakusyo Co., Ltd.
(株)旬菜デリ/Shunsai Deli Co., Ltd.
(株)セトデリカ/Seto Delica Co., Ltd.
(株)全農・キユーピー・エツグステーシヨン/Zenno Kewpie Egg Station Co., Ltd.
(株)ディスペンパックジャパン/Dispen Pak Japan Co., Ltd.
(株)デフト/Deft Co., Ltd.
デリア食品(株)/Deria Foods Co., Ltd.
鳥栖キユーピー(株)/Tosu Kewpie Co., Ltd.
(株)トスデリカ/Tosu Delica Co., Ltd.
階上キユーピー(株)/Hashikami Kewpie Co., Ltd.
(株)ハンシンデリカ/Hanshin Delica Co., Ltd.
(株)ファミリーシェフ/Family Chef Co., Ltd.
富士山仙水(株)/Fujisan Sensui Co., Ltd.
富士吉田キユーピー(株)/Fujiyoshida Kewpie Co., Ltd.
(株)ポテトデリカ/Potato Delica Co., Ltd.
ワイエムキユーソー(株)/Y.M. Kyuso Corporation
ワイシステム(株)/Y-System Logistics Corporation
Beijing Kewpie Corporation/北京丘比食品有限公司
Hangzhou Kewpie Corporation/杭州丘比食品有限公司
Henningsen Foods, Inc.
Henningsen Foods, Netherlands Inc.
Kewpie (Thailand) Co., Ltd.
Kewpie Malaysia Sdn. Bhd.
Kewpie Vietnam Co., Ltd.
Kifuki U.S.A. Co., Inc.
Q&B Foods, Inc.
関連会社Condiments and Processed Foods Business
調味料・加工食品事業Condiments and Processed
Foods Business
健康機能事業Health Function Products
Business
タマゴ事業Egg Products Business
サラダ・惣菜事業Salad and Prepared
Foods Business
物流システム事業Distribution
System Business
共通事業Common Business
Operations
国 内Domestic
海 外Overseas


![社団法人 日本セラミックス協会 2009年年会社団法人 日本セラミックス協会 2009年年会 2009年3月16日(月)~18日(水) [場所]東京理科大学](https://img.pdfslide.tips/doc/110x75/5f0f36317e708231d4430a34/c-oeffff-2009-c-oeffff.jpg)