Embed Size (px)
Citation preview

–
– –
1423 2003
PDF created with pdfFactory Pro trial version www.pdffactory.com

1
اإلهداء
...إلى من ربیاني فأحسنا تربیتي •
...إلى من أعیش لكسب رضاهما بعد اهللا
ضلهماإلى والدّي الكریمین برا بهما وعرفانا بف
...إلى من قاسمتني عناء البحث والتحصیل •
...إلى من ضحت ألجلي بوقتها وجهدها وحقوقها
إلى العزیزة شریكة حیاتي ونصفي اآلخر زوجتي الغالیة
.....إلى أبنائي األحباء •
مشرف وصالحة وصفاء ومحمد ومنار
اهدي ثمرة جهودهم وثمن تضحیتهم
PDF created with pdfFactory Pro trial version www.pdffactory.com

2
شكر وتقدیر
ملخص الدراسة
PDF created with pdfFactory Pro trial version www.pdffactory.com

3
451
172136143
14
MV Z2
1
0.010.05 2
3
4
5
PDF created with pdfFactory Pro trial version www.pdffactory.com
4
STUDY SUMMARY
The objective of the current study is to recognize the extent of effect of the multi alternatives response of measurement tools and school stages difference on reliability and validity coefficients. Also it tried to acknowledge the extent of difference of styles or types of the individual’s response in the light of change of the number of measurement alternatives and school stages. For data collection we used scale tension list measurement for Charles Splirger & others prepared and translated to Arabic by Dr. Nabeel Al-Zahar and Dr. Danis Hosfer. Three additional forms are made of this measurement differs only in the number of response alternatives. Hence we now have four forms of the measurement (two alternatives form, three alternatives form, four alternatives and the five alternatives). The tension feature measurement for Charles Spliger & others, prepared & translated to Arabic by Dr. Al-Behairi as external examiner for measurement of concurrence validity. All these measurements were applied on a sample consist of 451 students from different stages of general education at Jeddah city. They are used in a multi-stage punch style as follows: 172 from class (6) of elementary school, 136 student from 3rd class of intermediate school and 143 students from 3rd class of secondary school, scientific section. We took in consideration while presenting the measurement to the students the following ranking: two alternatives measurement, three alternatives measurement, five alternative measurement and at last the four alternatives (original) measurement. The time interval between each application is 14 days simultaneously at each of the application school. For reply of the study inquiries a group of statistical analysis are made (Z. V. and M) to know the difference between each of the reliability & validity coefficients as used by the statistician Ka in order to recognize the difference occur at response style of each individual according to difference of alternatives numbers and age stage. From the discussion of the study result we can conclude the following: 1) The measurement tools of the psychometrical characteristics are in general affected
by the change of the number of response alternatives, and hence it is not independent of it. If the number of response alternatives increase the values of reliability and validity coefficients increases, and with statistical function difference at level of 0.01 and 0.05.
2) The difference in school stage affects the validity co-efficient of measurement tools more than affection on reliability co-efficient. As it is noticed that the validity co-efficient of the measurement tool increases with the increase in the mental and knowledge growth of the students.
3) The five alternatives measurement showed high reliability degree compared to other measurements. On the other hand the four alternatives measurement has higher validity co-efficient value than other measurements.
4) The values of the reliability & validity coefficients increases when the alternative tools are many, particularly when the respondents are of high caliber and have high incentive for participation supported with clear perception to the measured featured and the importance of its measurement.
5) The response style of individuals differs according to number of alternatives and difference of school stage as it becomes of more spread and diversified as the mental and knowledge growth increases at the individual. Because availability of multi-alternatives grants the respondent more allowance to express himself with more precision reflecting what actually in his mind without falsification or tendency to one style of response.
In the light of results reached by this study and the outcome of the previous studies results. A number of recommendations are suggested which concentrates on the importance of the number of measurement tools and that they should be scientifically specified instead of being randomly selected. I.e. the measurement shall include 5 alternatives for higher knowledge stages and less for lower knowledge stages. Also we ensure on sensitivity of the tool and its distinguishing capability, taking care of its validity when applied on samples of high difference of ages and knowledge level even if it showed high reliability.
PDF created with pdfFactory Pro trial version www.pdffactory.com
5
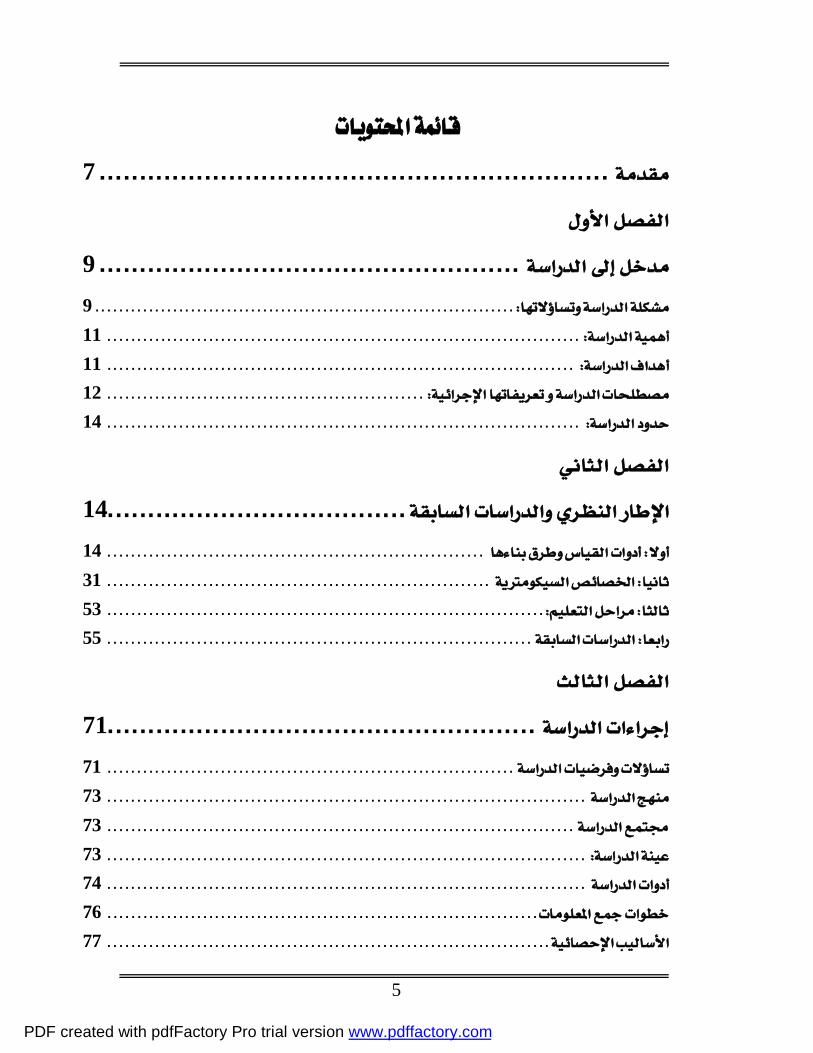
...............................................................7
....................................................9
......................................................................9
...............................................................................11
..............................................................................11 .....................................................12
...............................................................................14
.....................................14
...............................................................14
................................................................31
.........................................................................53 .......................................................................55
.....................................................71
....................................................................71
................................................................................73
..............................................................................73
................................................................................73 ................................................................................74
........................................................................76
..........................................................................77
PDF created with pdfFactory Pro trial version www.pdffactory.com
6
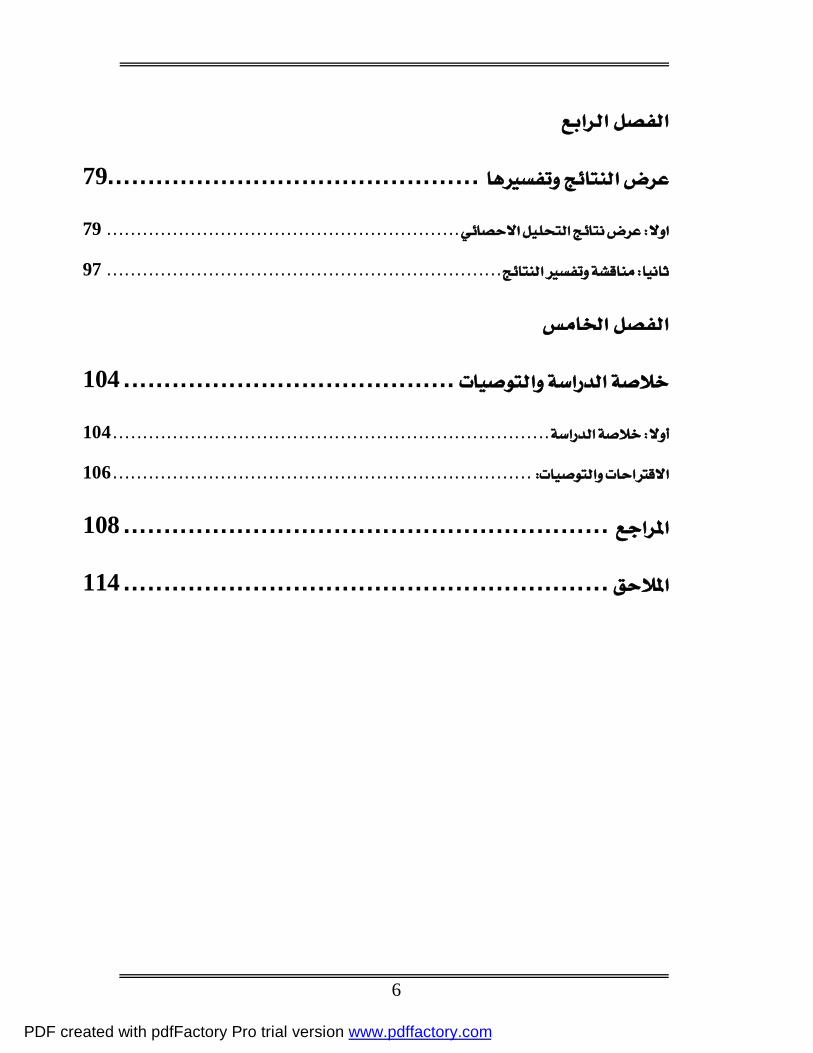
..............................................79
...........................................................79
..................................................................97
.........................................104
.........................................................................104
......................................................................106
............................................................108
............................................................114
PDF created with pdfFactory Pro trial version www.pdffactory.com

7
Scaling
TechniquesScales Thurstone Scales
Likert Scales Guttman
PDF created with pdfFactory Pro trial version www.pdffactory.com

8
Scales Osgood et al. Semantic Differential
PDF created with pdfFactory Pro trial version www.pdffactory.com

10
1
2 3.
1
2
3.
PDF created with pdfFactory Pro trial version www.pdffactory.com

11
1
2
3
1. :
Reliability 2000
1996
Validity Cronbach(1960)
1997 APA , AERA (1985)
PDF created with pdfFactory Pro trial version www.pdffactory.com

12
response style 1993
2 :
⋅ ⋅
⋅
⋅
3 :
⋅ ⋅ ⋅ –
23
45
PDF created with pdfFactory Pro trial version www.pdffactory.com

13
∗
1987
1 2
3
4
1997
Reliability
2000
∗
PDF created with pdfFactory Pro trial version www.pdffactory.com

14
1996
–
2000
222
eTt SSS += St
2
PDF created with pdfFactory Pro trial version www.pdffactory.com
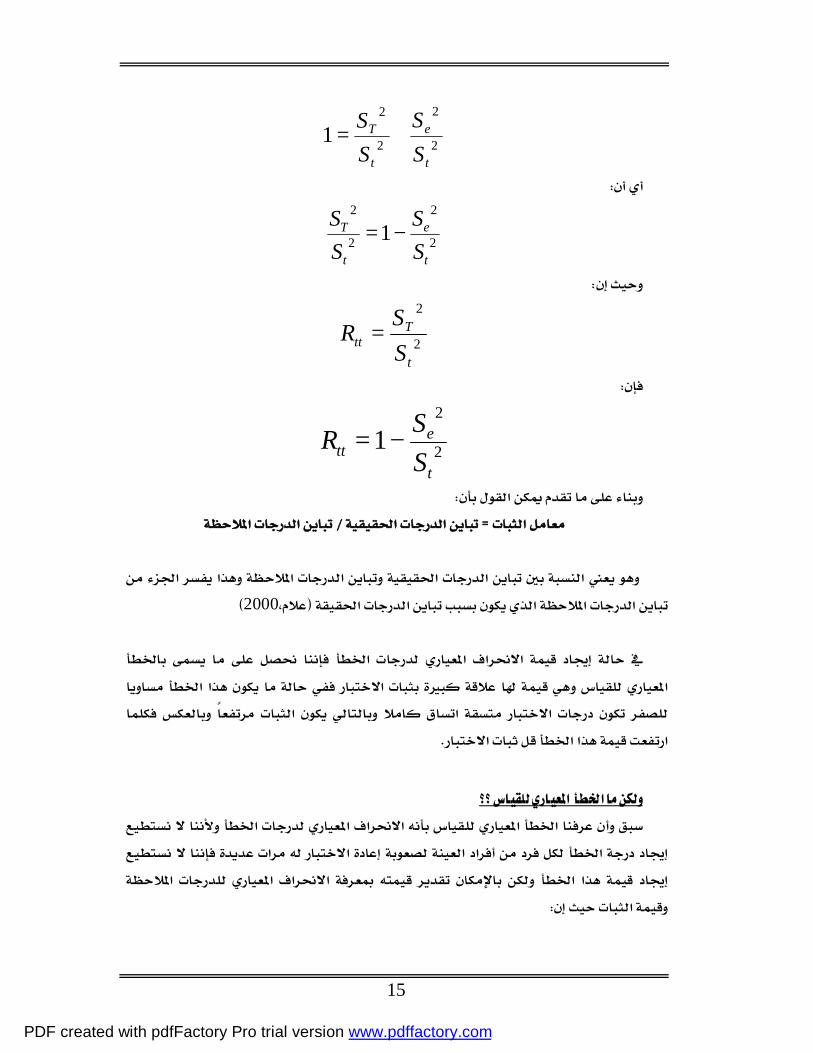
15
2
2
2
2
1t
e
t
T
SS
SS
+=
2
2
2
2
1t
e
t
T
SS
SS
−=
2
2
t
Ttt S
SR =
2
2
1t
ett S
SR −=
2000
PDF created with pdfFactory Pro trial version www.pdffactory.com
16
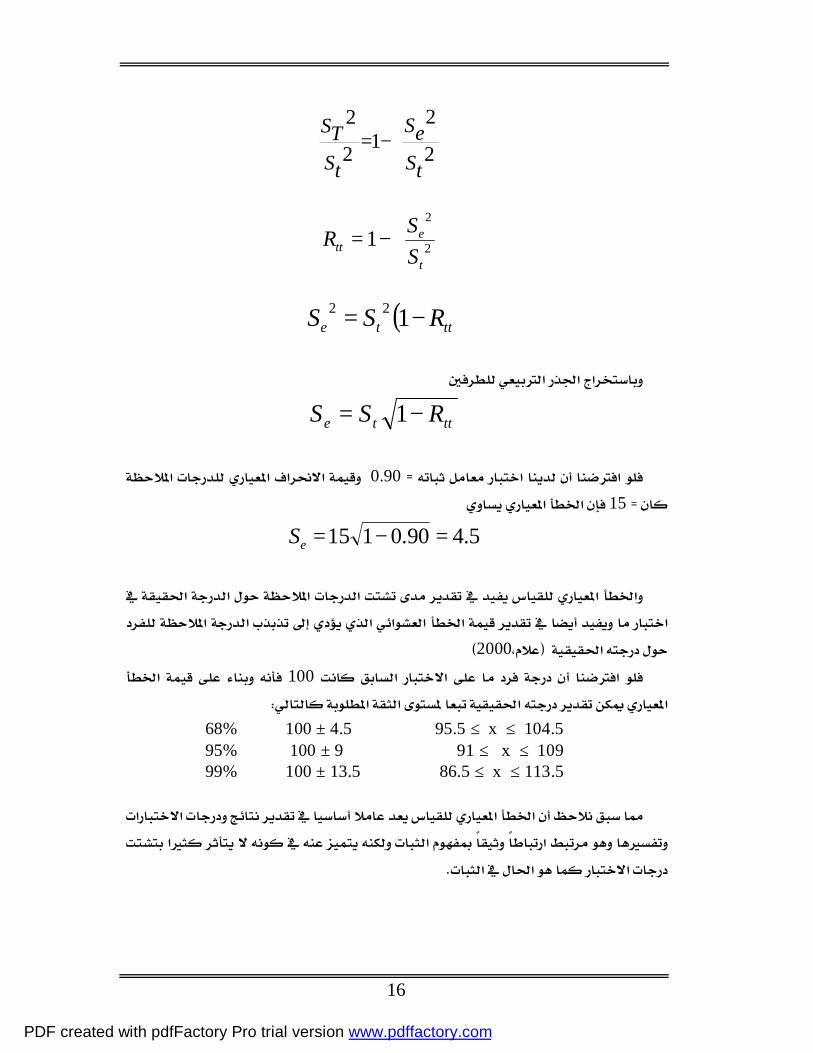
−= 2
212
2
tSeS
tSTS
−= 2
2
1t
ett S
SR
( )ttte RSS −= 122
ttte RSS −= 1 0.90 15
5.490.0115 =−=eS
2000 100
68% 100 ± 4.5 95.5 ≤ x ≤ 104.5 95% 100 ± 9 91 ≤ x ≤ 109 99% 100 ± 13.5 86.5 ≤ x ≤ 113.5
PDF created with pdfFactory Pro trial version www.pdffactory.com

17
1 2 3 4 5 6 7 8
1996
1 2
3.
1997
PDF created with pdfFactory Pro trial version www.pdffactory.com
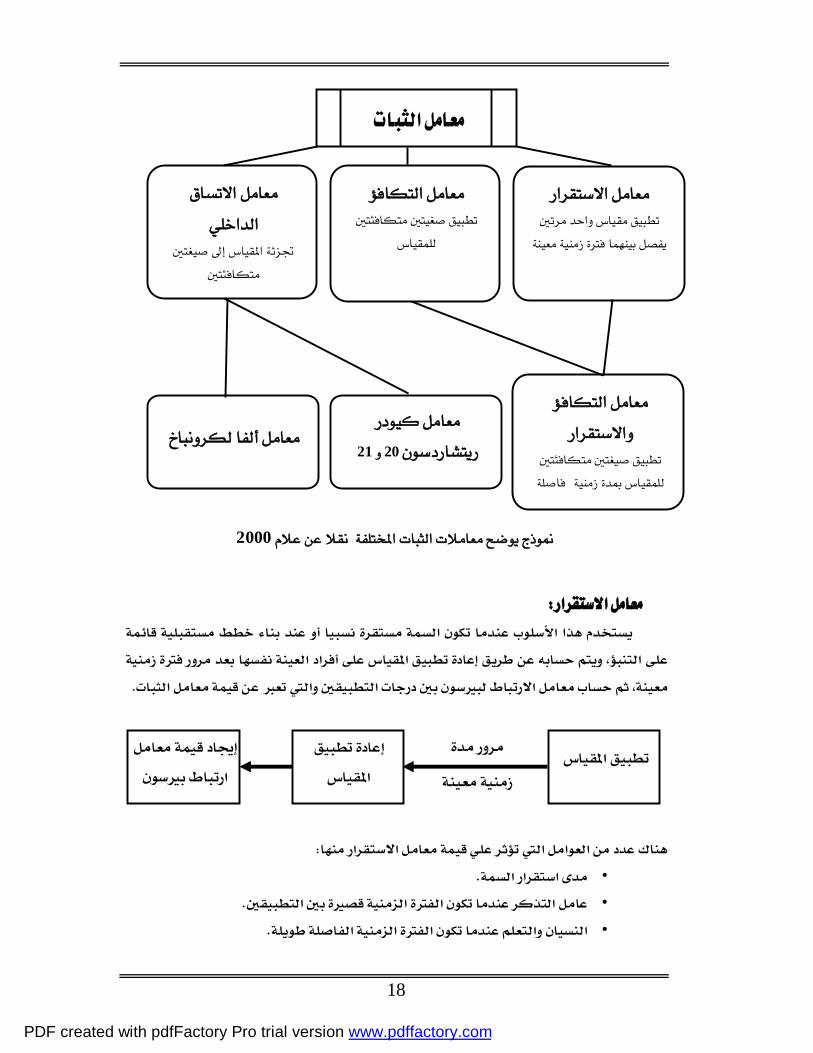
18
2000
• • •
2021
PDF created with pdfFactory Pro trial version www.pdffactory.com

19
)()()()()( 222222LTeeeTe fSsubjSgSAdmSequSS ++++=
•
• ……………………2
eS
• ………)(2 AdmSe
• …………………)(2 gS e
• ………)(2 subjSe
• )(2LT FS
)()()()( 22222lTeeee FSsubjSgSAdmSS +++=
PDF created with pdfFactory Pro trial version www.pdffactory.com

20
)(2 equST
: موضح بالشكل التالي تقدير معامل االتساق الداخلي كما هوإجراءاتوتتم
PDF created with pdfFactory Pro trial version www.pdffactory.com
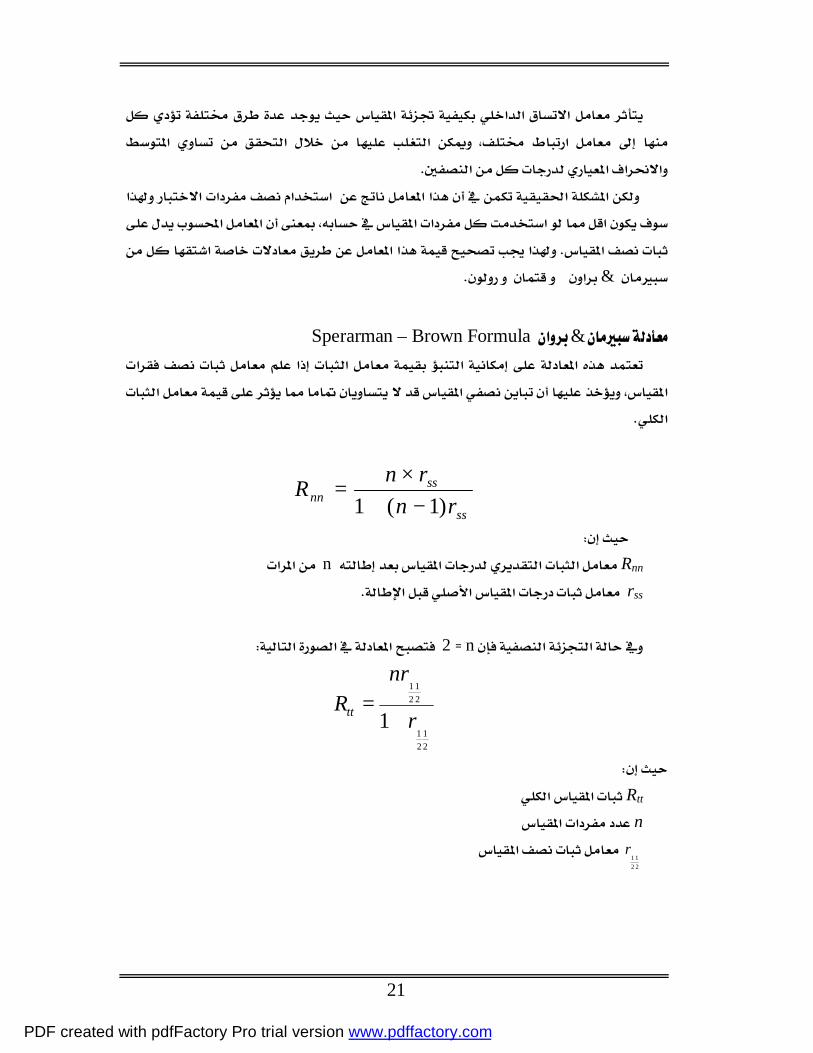
21
&
&Sperarman – Brown Formula
ss
ssnn rn
rnR)1(1 −+
×=
Rnnn rss
n2
21
21
21
21
1 r
nrRtt +
=
Rtt n
21
21
r
PDF created with pdfFactory Pro trial version www.pdffactory.com
22
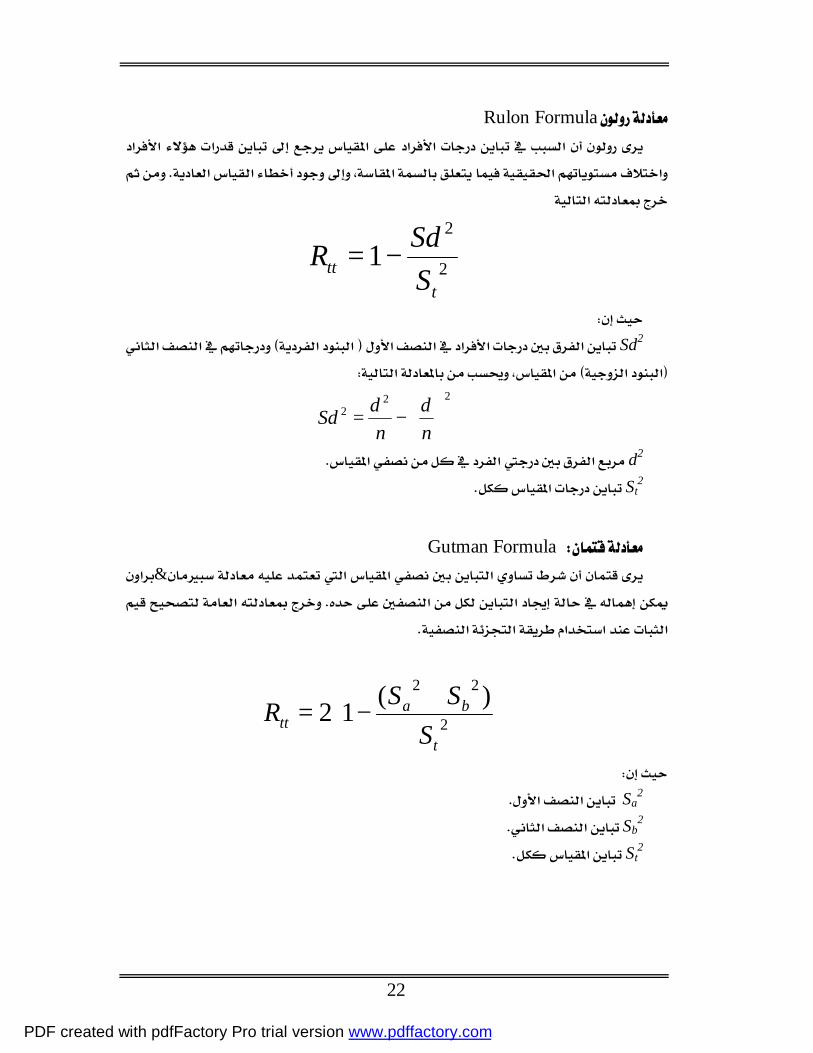
Rulon Formula
2
2
1t
tt SSdR −=
Sd2
22
2
−=
nd
ndSd
d2 St
2 Gutman Formula
&
+−= 2
22 )(12t
batt S
SSR
Sa
2 Sb
2 St
2
PDF created with pdfFactory Pro trial version www.pdffactory.com

23
2020 Richardson Formula –Kuder
−
−= ∑
220 11 tS
pqk
kR
K
∑ pq 2
tS
2000
2121 Richardson Formula –Kuder 20
0.50 pq 20
( )
−−−−
= 221 11 KS
XKXK
KR
X
PDF created with pdfFactory Pro trial version www.pdffactory.com

24
)α(nbach Cro Cronbach
−
−= ∑
2
2
11 t
i
SS
KKα
∑ 2
iS 2
tS α
1997
p.q20Si
2
α α
2000
1
PDF created with pdfFactory Pro trial version www.pdffactory.com
25
2
2
1t
ett S
SR −=
St2Se
2
2
222
TTn SnS = 22een nSS =
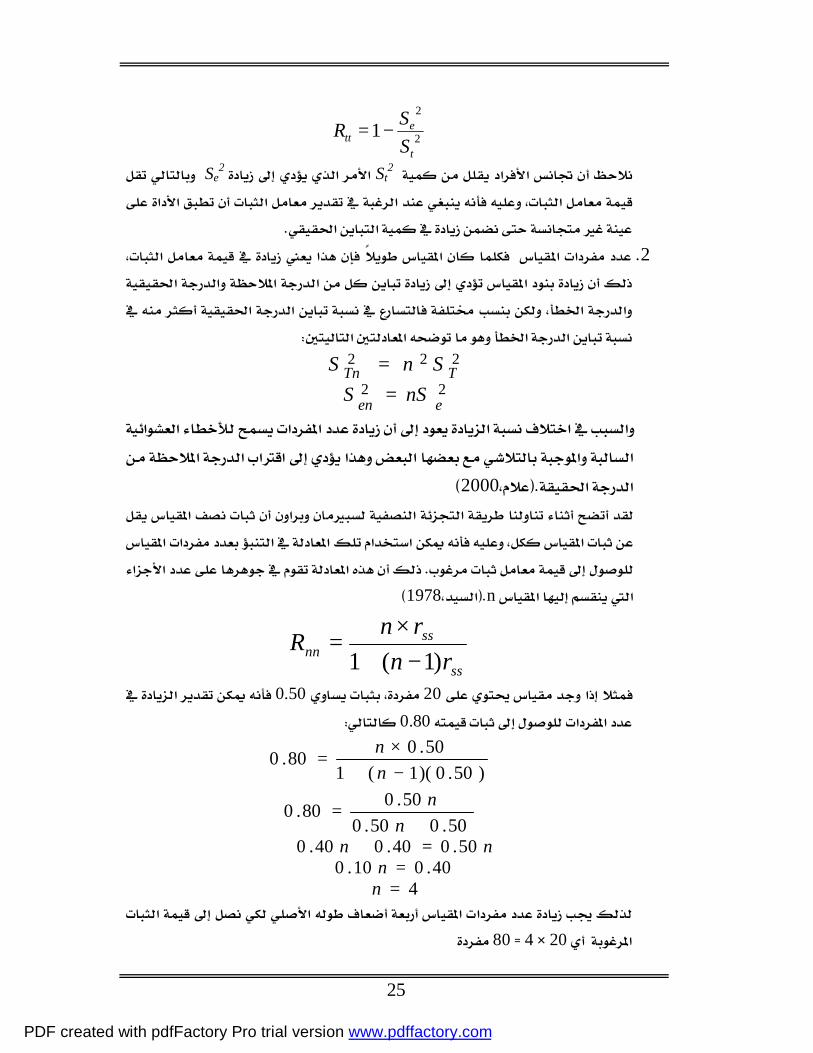
2000
n1978
ss
ssnn rn
rnR)1(1 −+
×=
200.500.80
)50.0)(1(150.080.0
−+×
=nn
50.050.050.080.0+
=n
n
nn 50.040.040.0 =+ 40.010.0 =n
4=n 20480
PDF created with pdfFactory Pro trial version www.pdffactory.com
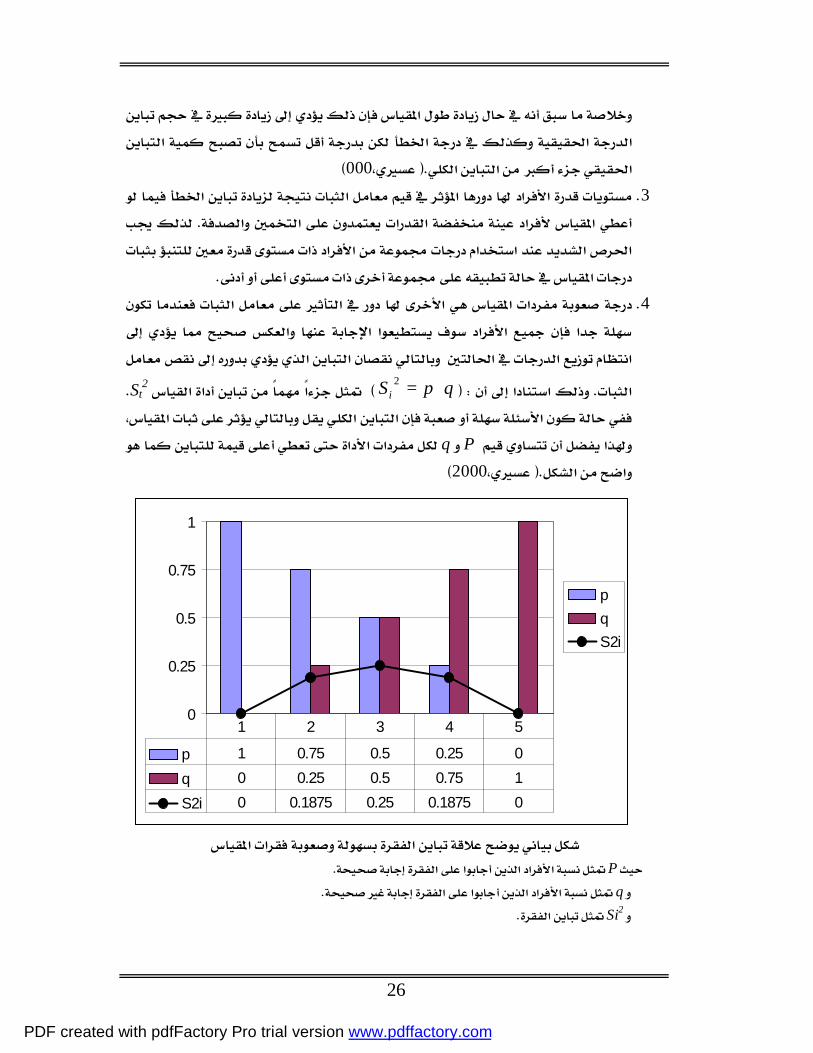
26
0
0.25
0.5
0.75
1
pqS2i
p 1 0.75 0.5 0.25 0
q 0 0.25 0.5 0.75 1
S2i 0 0.1875 0.25 0.1875 0
1 2 3 4 5
000 3
4
qpS i ⋅=2 St2
P q
2000
P q Si2
PDF created with pdfFactory Pro trial version www.pdffactory.com

27
5
6
2000
Validity Cronbach (1960)
1997APA , AERA (1985)
(APA)(AERA)
2000 1
2 3
PDF created with pdfFactory Pro trial version www.pdffactory.com

28
2000
2000
2000
1997
PDF created with pdfFactory Pro trial version www.pdffactory.com
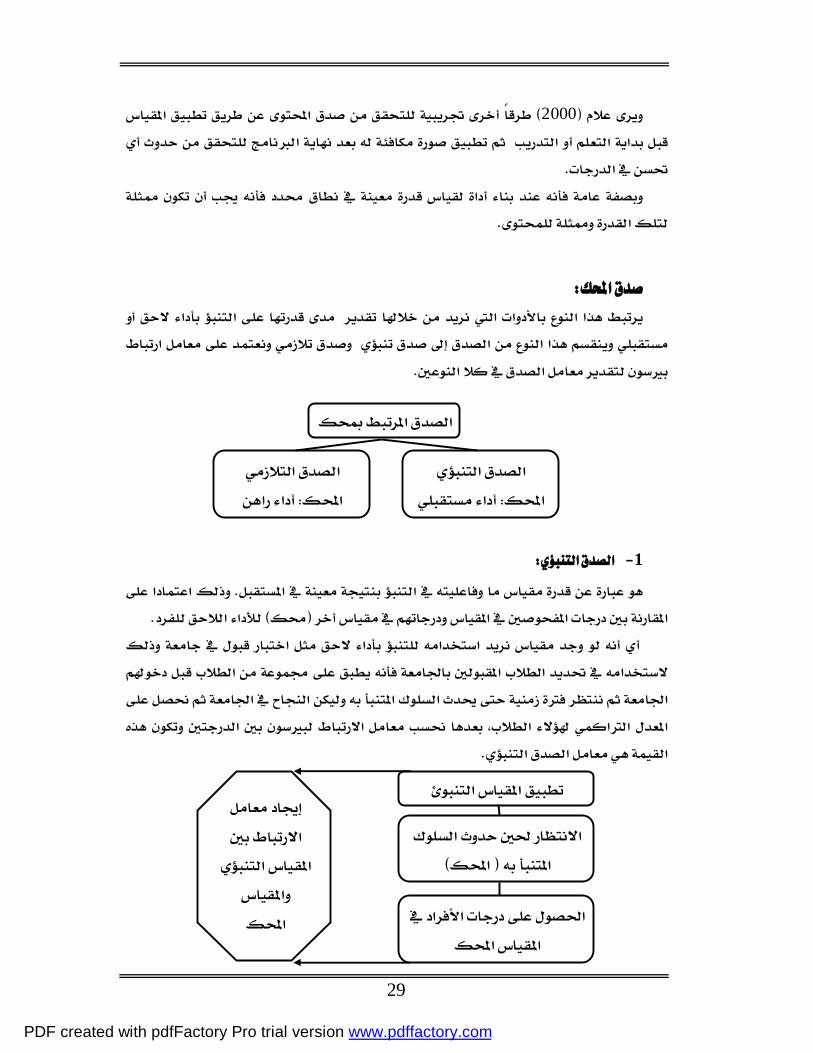
29
2000
1
PDF created with pdfFactory Pro trial version www.pdffactory.com

30
2000
2
1
2
3
PDF created with pdfFactory Pro trial version www.pdffactory.com

31
4
2000 5
6
1997199720001978
19552000 1 2 3
PDF created with pdfFactory Pro trial version www.pdffactory.com

32
2000
2000
1997
PDF created with pdfFactory Pro trial version www.pdffactory.com

33
Educational Testing Service (ETS) American Psychological Association (APA) The
Psychological CorporationConsulting Psychologists Press
FlanaganChase1980
1 2 scale 3 4 5 6
PDF created with pdfFactory Pro trial version www.pdffactory.com

34
12345678910112.5 233.544.555.566.57
Thurstone Technique Thurstone1929–
1931 Medians
Thurstone20001997
1
2 911
3
Item Scale Value
4
5
PDF created with pdfFactory Pro trial version www.pdffactory.com
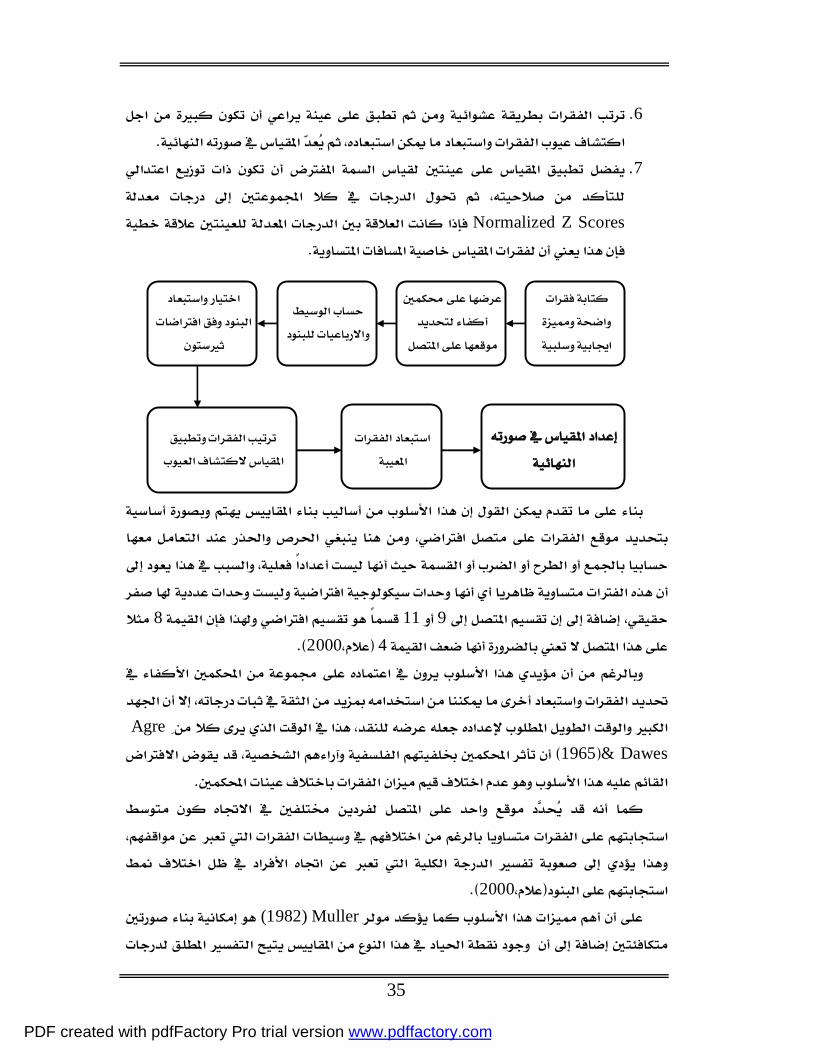
35
6
7.
Normalized Z Scores
911842000
Agre & Dawes1965
2000 Muller(1982)
PDF created with pdfFactory Pro trial version www.pdffactory.com

36
2000
Cumulative TechniqueGutman Scale Gutman
Cumulative Technique21
41997
1
2
3
4 Coefficient of Reproducibility Coefficient of Scability
⋅ 1–
⋅
– 100–
PDF created with pdfFactory Pro trial version www.pdffactory.com
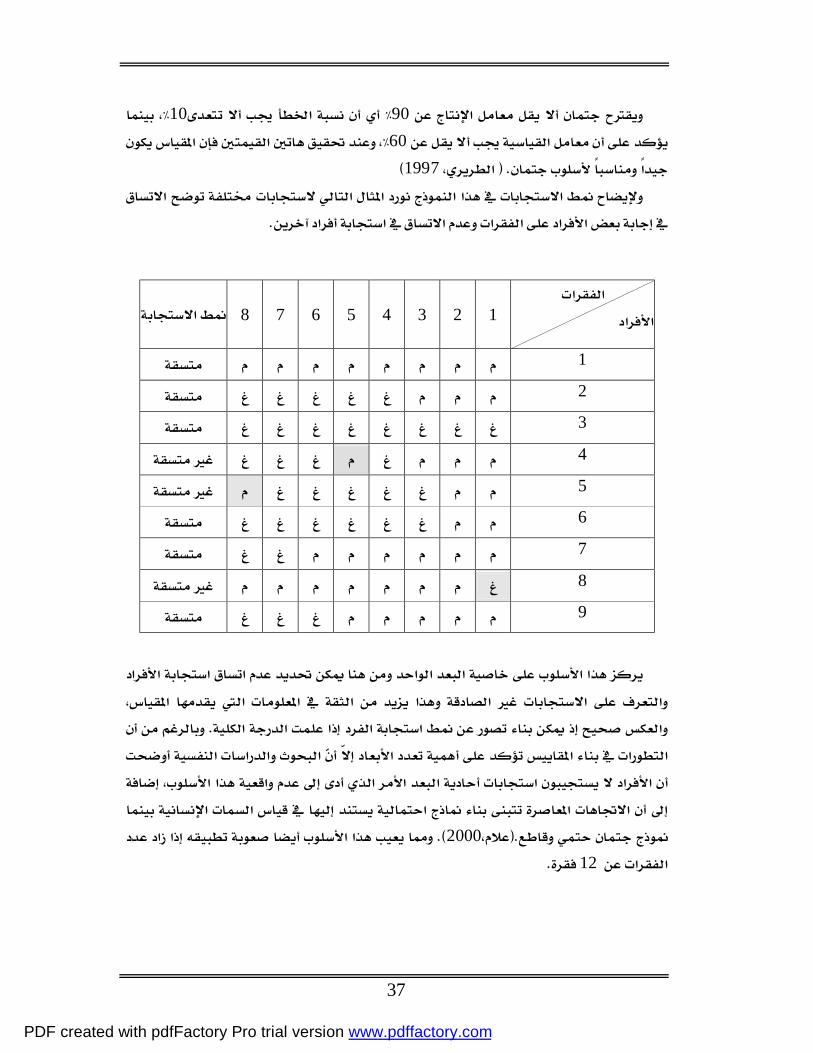
37
90 10 60
1997
200012
1 2 3 4 5 6 7 8
1 2 3 4 5 6 7 8 9
PDF created with pdfFactory Pro trial version www.pdffactory.com
38
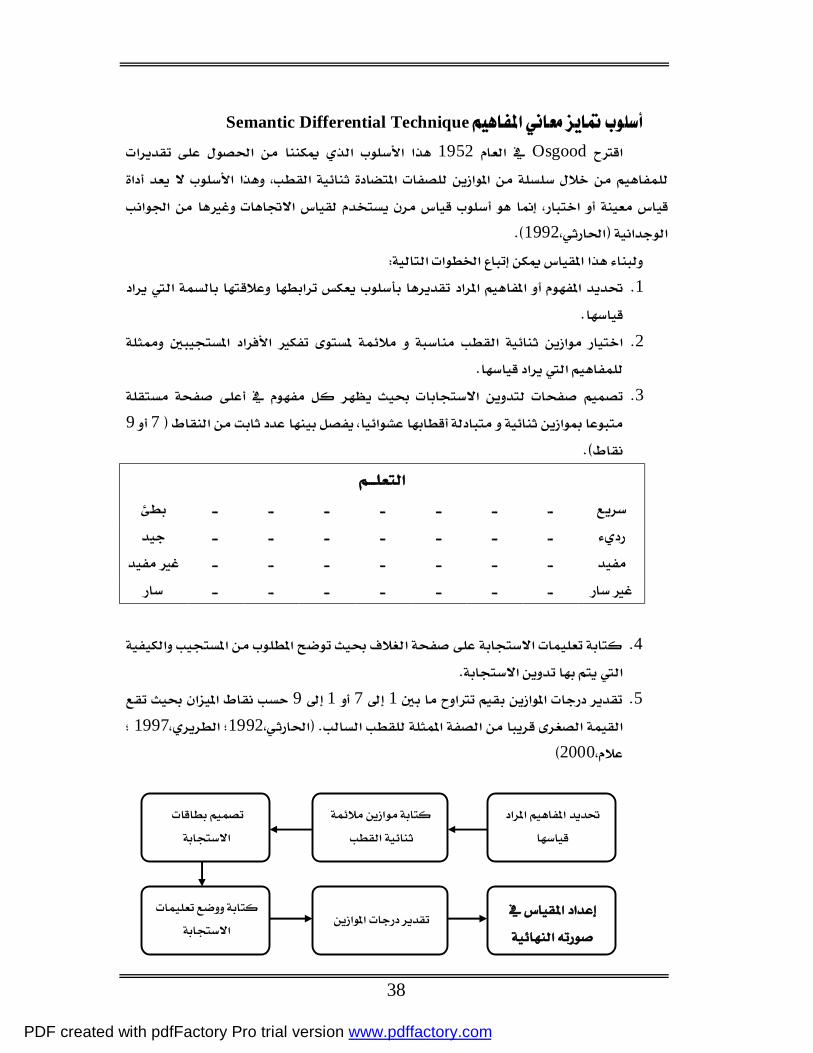
Semantic Differential Technique Osgood 1952
1992
1
2
3 79
4
5 17 19
199219972000
PDF created with pdfFactory Pro trial version www.pdffactory.com

39
2000
0.740.820.830.912000
Sociometric Techniques
Sociometric Questionnaires
Interviews
Moreno et al.
PDF created with pdfFactory Pro trial version www.pdffactory.com

40
Sociometric Matrices
1 0
1 0 1 1 0 0 0 1 1 1 0 0 1 1 0 0 1 1 1 0 0 1 1 0 0 1 1 0 1 1 1 1 1 1 1 1 1 0 1 0 1 1 1 1 1 0 0 1 1 1 0 0 1 0 0 1 0 0 0 1 1 1 1 0 1 1 1 1 1 1 1 1 1 1 1 1 1 1 0 0 1 1 0 1 1 0 0 0 1 0 1 1 0 1 0 1 0 0 1 0 0 0 0 0 0 0 0 1 1 1 0 1 1 1 1 0 1 1 0 1 1 1 0 0 0 0 1 1 0 0 1 1 1 1 1 1 1 1 1 1 1 1 1 1 0 0 1 1 0 0 0 1 1 0 0 0 0 0 0 0 0 1 0 0 0 0 1 0 0 1 0 0 0 1 0 1 1 1 0 0 1 1
Moreno
1997 1 2 3 4 5 6
PDF created with pdfFactory Pro trial version www.pdffactory.com

41
1
2
3
4
1−n
n
n n
)1( −
∑nn
S ∑ S
n
tn
G+
2
G n
t
nh
ldm )( +
m d l
n h
PDF created with pdfFactory Pro trial version www.pdffactory.com
42
1997
2000
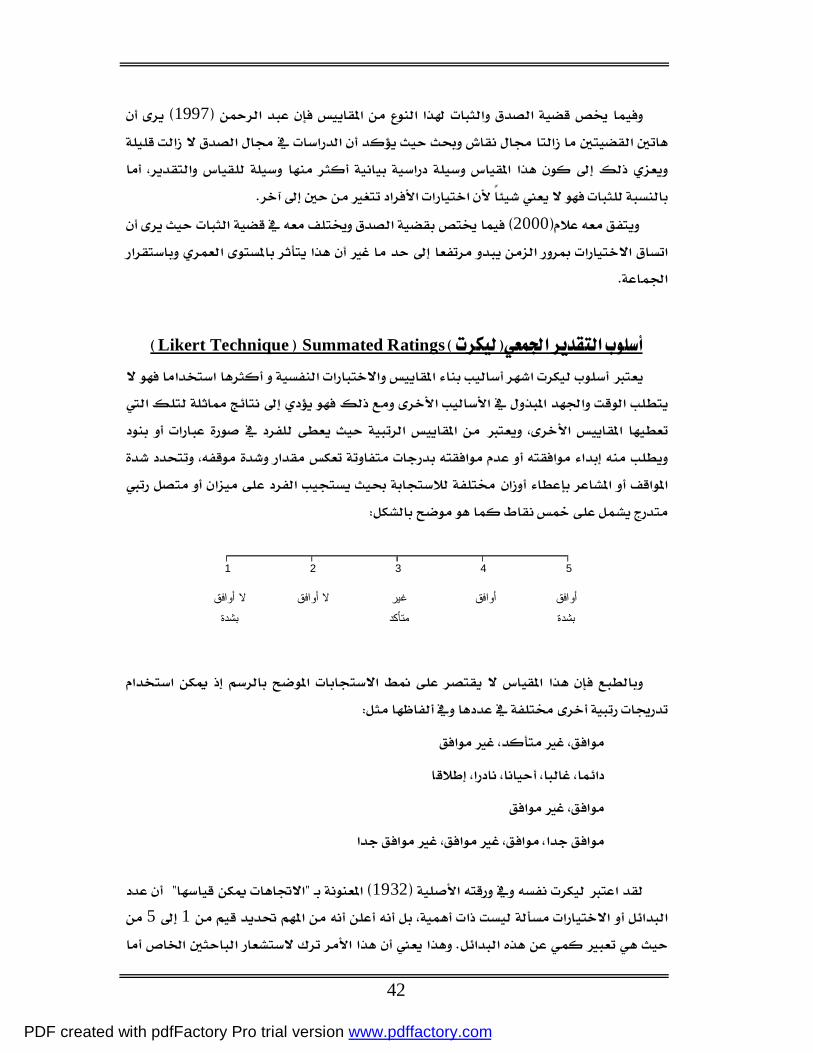
Summated RatingsLikert Technique
⋅ ⋅ ⋅
⋅
1932 15
51 2 3 4
أوافق بشدة
أوافق
غير متأكد
ال أوافق
ال أوافق بشدة
PDF created with pdfFactory Pro trial version www.pdffactory.com

43
1
( Green&Rao,1970 ; Lehmann&Hulbert,1972)
2 11
(Miller,1956 ; Symonds,1924 ; Munshi,1990)
3
4436
3513244×3180365
0.880.94 (Likert & Murphy,1938 ; Bendin,1954 ; Komorita,1963 ; Komorita&Graham,1965)
1 2
3
(Nunnally,1978)
PDF created with pdfFactory Pro trial version www.pdffactory.com
44
Item Analysis
Cronbach (α)
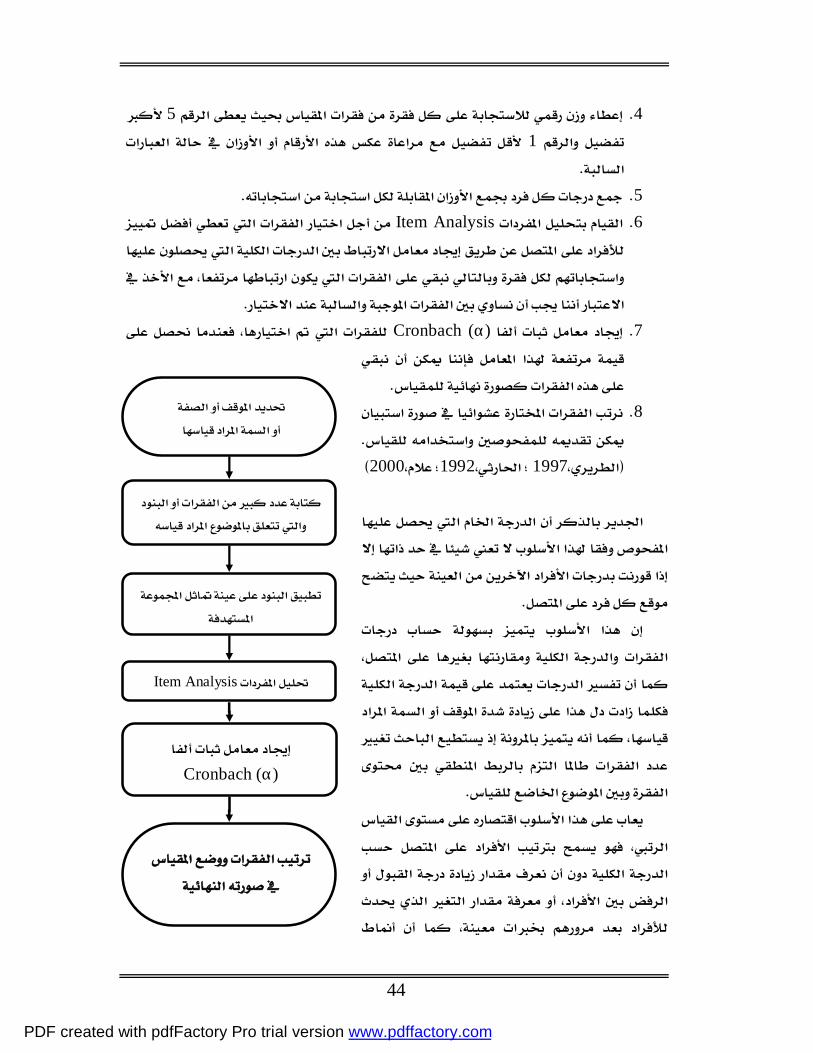
4 5 1
5 6 Item Analysis
7 Cronbach (α)
8
199719922000
PDF created with pdfFactory Pro trial version www.pdffactory.com

45
19972000
2000
U
10
PDF created with pdfFactory Pro trial version www.pdffactory.com

46
0.80200.90
(Anderson,1981)
1993
1 2 3
4 5 6 7 8
1
2 3 4 5 6
1993 2000
PDF created with pdfFactory Pro trial version www.pdffactory.com

47
EdwardsBabbie 19922000
1 2 3 4 20
5
6
7
8.
PDF created with pdfFactory Pro trial version www.pdffactory.com

48
101112
1 2 3 4 5 6 7 8
19901989
1314151990
1 2 3 4 5 6
7
PDF created with pdfFactory Pro trial version www.pdffactory.com

49
8
1617 18 1990
1 2 3 4 5 6 7 8
1989
PDF created with pdfFactory Pro trial version www.pdffactory.com

50
1 •
•
2 • •
1996
1997
PDF created with pdfFactory Pro trial version www.pdffactory.com

51
Wiliams & Ebel1957Ebel 1969Costin19701972Straton & Catts1980Budescu&Nevo1985 Owen
& Froman 1987Trevisan &Michaels & Sax 1991 1994 Crehan & Haladyna & Brewer19931994Hancock & Sax & Michael1993 Eric
Landrum1993 Bruno&Dirkzwager 1995Lord1997 Ebel 1969
0.9270180
150135126 Budescu&Nevo1985
Bruno&Dirkzwager 1995 Lord1997
1 2
3
4
5
6
PDF created with pdfFactory Pro trial version www.pdffactory.com

52
Martin & Mathis 1974
Comery & Montag 1982 King, et.all1983 Velicer&Stevenson1987
1994
FRISBIE &BRANDENBURG 1979Jane1984
Dixon & Bobo& Stevick1984Wyatt & Meyers 1987Newstead& Arnold1989Huck&Jacko1974Mckelvie1978Boot1981 Chang,
Lei1997Jackson Barnette200019921997 1
2
3
4 5
6
PDF created with pdfFactory Pro trial version www.pdffactory.com

53
Benson&Hocovar1985 Weng&Cheng2000 Ochieng20011995
1
2
3
Garland1991
Ochieng & Zumbo2001
4
Symonds1924
Velicer & Stevenson1978
PDF created with pdfFactory Pro trial version www.pdffactory.com

54
7
Cox 1980Goldberg1981
Saal1989
7 9
Munshi19907
2108
76
1615 7Preston&Colman2000
211149
7 7
Champney&Marshall1939
19247
57
PDF created with pdfFactory Pro trial version www.pdffactory.com

55
957
Lissitz&Green 1975
αroo1023
57914 0.8 0.5 0.2 2 3 5 7 9 14 2 3 5 7 9 14 2 3 5 7 9 14
0.77
0.
820.
840.
850.
850.
860.
650.
710.
740.
750.
750.
760.
420.
470.
520.
520.
530.
53
0.77
0.
820.
850.
850.
860.
860.
710.
770.
800.
810.
810.
810.
570.
630.
670.
690.
690.
70
7
5
Jenkins&Taber1977
5
Mckelvie1978571116.5
5 7 11 Z
56
PDF created with pdfFactory Pro trial version www.pdffactory.com

56
Remmers&Ewart1941Guilford
1953
Huck&Jacko1974Haber&Albert
Boote 1981
Neumann&Neumann1981
210
Cicchetti, et.al198523 45 6
100 266100
Russell&Bobko1991 0.92
0.67 Alliger&Williams1992
Chang lei1993
PDF created with pdfFactory Pro trial version www.pdffactory.com

57
Chang Lei1994
165
Kim Kyung Hoon19983579
11113413418957959
Scherpenzeel2001
11
199511
1999
Piers&Harris2
345101214
PDF created with pdfFactory Pro trial version www.pdffactory.com

58
1309
⋅ ⋅ ⋅ 141012 ⋅ 10
1214 ⋅
⋅
Bendig1954236 2023579
2 3 5 7 9 0.61 0.63 0.58 0.70 0.60
Komorita1963
14 286
0.910.93 3
0.710.83 14
PDF created with pdfFactory Pro trial version www.pdffactory.com

59
Komorita&Graham1965
SD24
CPI260
SD CPI
6 6 N 67 70 67 56
0.92 0.916 0.62 0.74 SD
CPI
1971Matell & jacoby
181936020
Z
PDF created with pdfFactory Pro trial version www.pdffactory.com
60
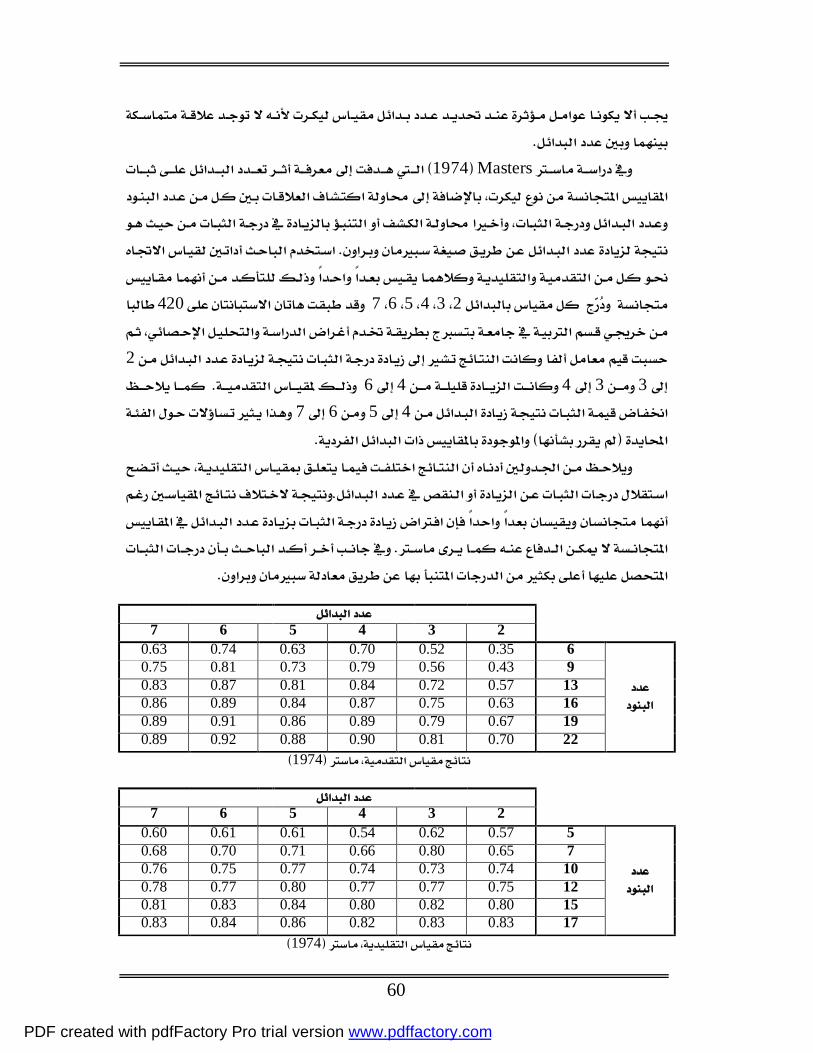
Masters1974
234567420
233446
4567
2 3 4 5 6 7 6 0.35 0.52 0.70 0.63 0.74 0.63 9 0.43 0.56 0.79 0.73 0.81 0.75
13 0.57 0.72 0.84 0.81 0.87 0.83 16 0.63 0.75 0.87 0.84 0.89 0.86
19 0.67 0.79 0.89 0.86 0.91 0.89 22 0.70 0.81 0.90 0.88 0.92 0.89
1974
2 3 4 5 6 7 5 0.57 0.62 0.54 0.61 0.61 0.60 7 0.65 0.80 0.66 0.71 0.70 0.68
10 0.74 0.73 0.74 0.77 0.75 0.76 12 0.75 0.77 0.77 0.80 0.77 0.78
15 0.80 0.82 0.80 0.84 0.83 0.81 17 0.83 0.83 0.82 0.86 0.84 0.83
1974
PDF created with pdfFactory Pro trial version www.pdffactory.com

61
1969
Remington,et.al1979
23455Nunnally1978
Brown & widing & Coulter 1991
1995
345671150
0.87‘0.900.920.900.91
2345
1
2
3
19991995
PDF created with pdfFactory Pro trial version www.pdffactory.com

62
4
•
• ï
ï
ï
• ï
ï
ï
ï
PDF created with pdfFactory Pro trial version www.pdffactory.com

63
•
5
• 7
•
5
•
6
PDF created with pdfFactory Pro trial version www.pdffactory.com

64
1
•
•
2
•
•
PDF created with pdfFactory Pro trial version www.pdffactory.com

65
3
•
•
• • •
PDF created with pdfFactory Pro trial version www.pdffactory.com
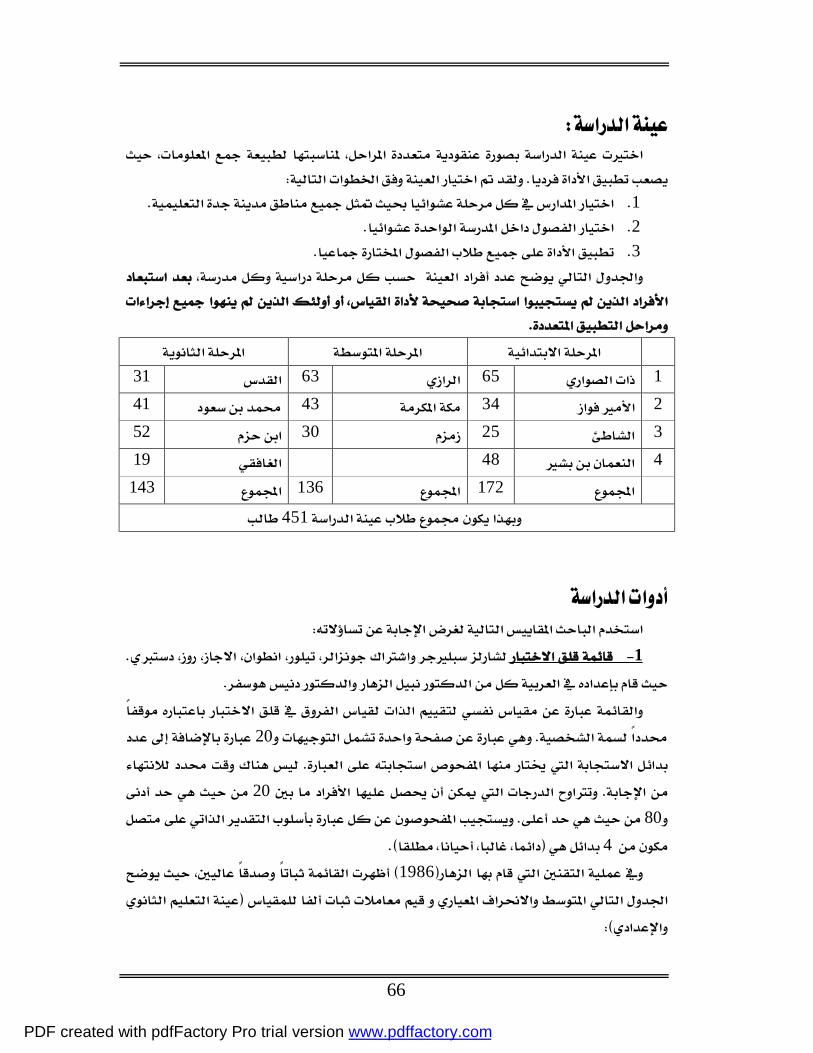
66
1 2 3
1 65 63 31 2 34 43 41 3 25 30 52 4 48 19 172 136 143
451
1
20
2080
4 1986
PDF created with pdfFactory Pro trial version www.pdffactory.com
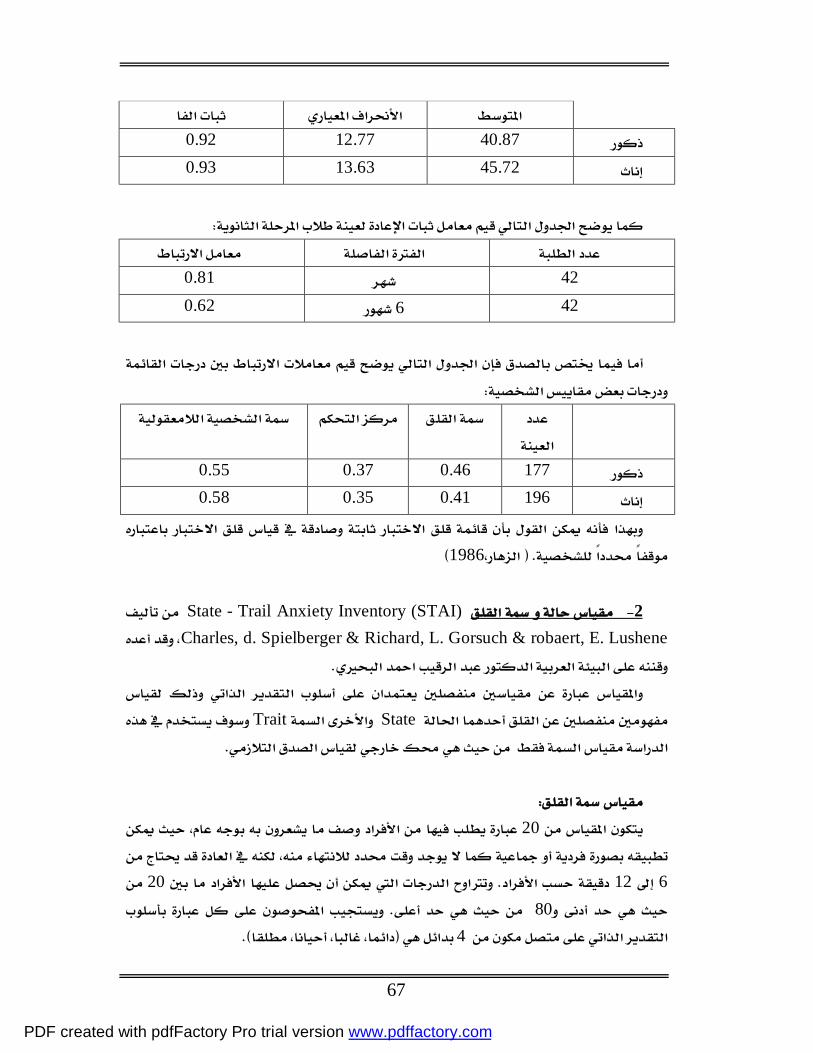
67
40.87 12.77 0.92 45.72 13.63 0.93
42 0.81 42 6 0.62
177 0.46 0.37 0.55 196 0.41 0.35 0.58
1986 2 ) STAI( Trail Anxiety Inventory -State
Charles, d. Spielberger & Richard, L. Gorsuch & robaert, E. Lushene
State Trait
20
612 20
80 4
PDF created with pdfFactory Pro trial version www.pdffactory.com
68
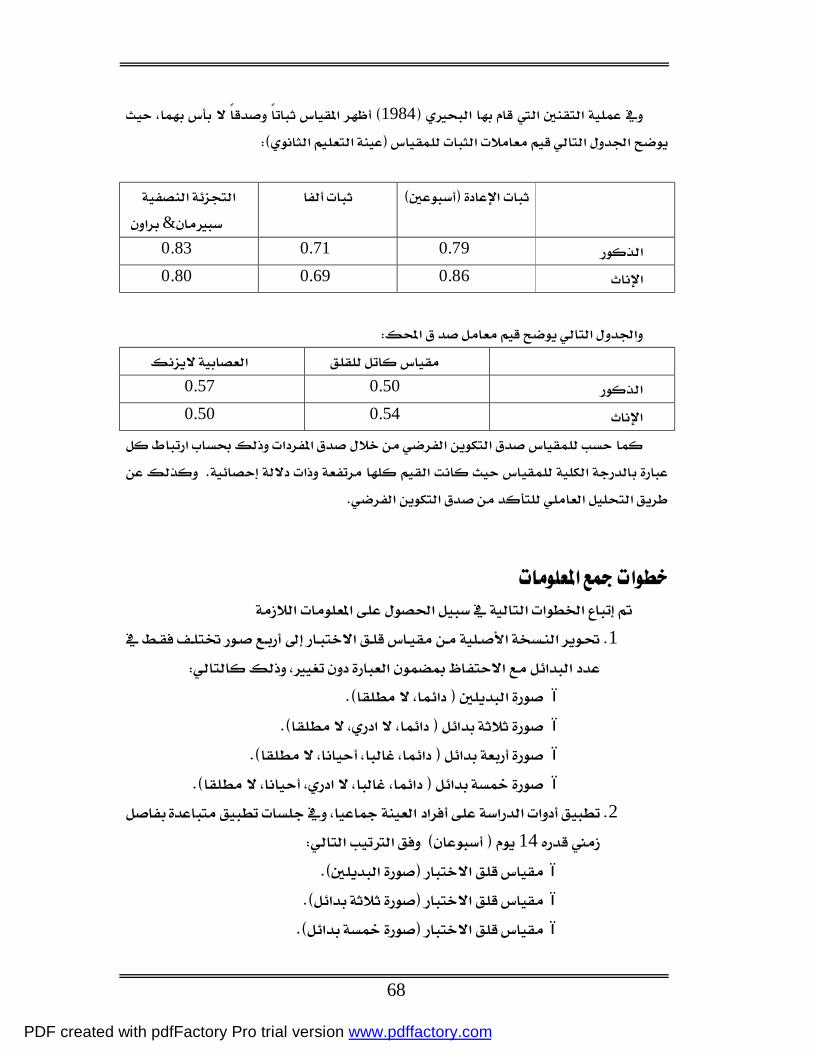
1984
& 0.79 0.71 0.83
0.86 0.69 0.80
0.50 0.57
0.54 0.50
1
ï ï ï ï
2 14 ï ï ï
PDF created with pdfFactory Pro trial version www.pdffactory.com

69
ï ï
3 4 705 5
6
• •
•
SPSS ⋅
⋅
⋅ 2
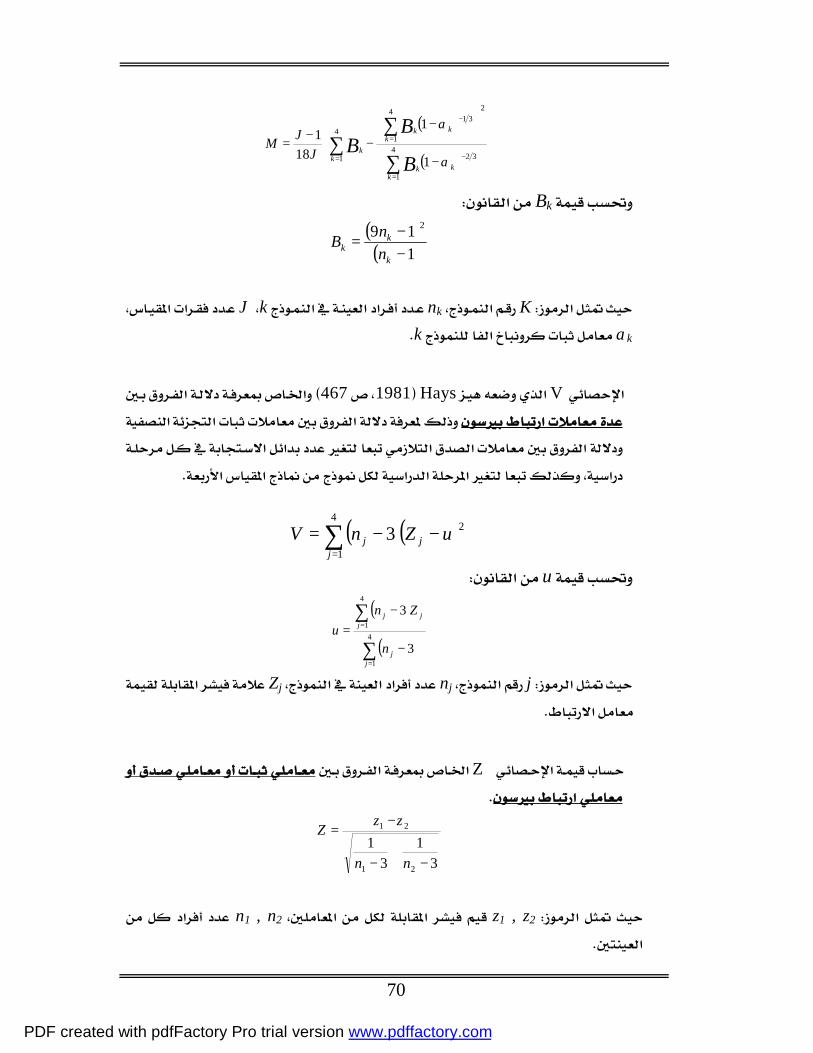
⋅ M Hakstain & Whalen1976
PDF created with pdfFactory Pro trial version www.pdffactory.com
70
( )
( )
−
−
−−
=−
=
−
=
= ∑
∑∑
324
1
231
4
14
1 1
1
181
kk
k
kk
k
kk
B
BBJ
JMα
α
Bk ( )( )1
19 2
−−
=k
kk n
nB
KnkkJ
αkk
⋅ V Hays1981467
( )( )∑=
−−=4
1
23j
jj uZnV
u ( )
( )∑
∑
=
=
−
−= 4
1
4
1
3
3
jj
jjj
n
Znu
jnjZj
⋅ Z
31
31
21
21
−+
−
−=
nn
zzZ
z1 , z2 n1 , n2
PDF created with pdfFactory Pro trial version www.pdffactory.com
71
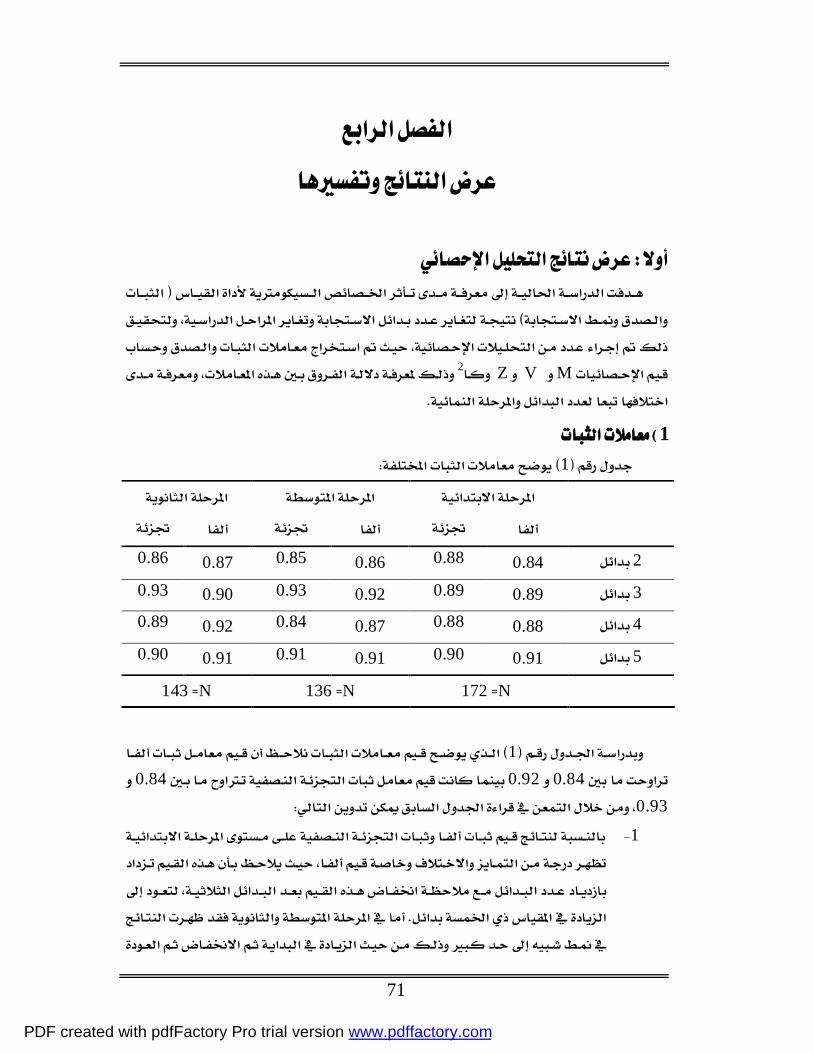
MV Z2
1 1
2 0.84 0.88 0.86 0.85 0.87 0.86
3 0.89 0.89 0.92 0.93 0.90 0.93
4 0.88 0.88 0.87 0.84 0.92 0.89
5 0.91 0.90 0.91 0.91 0.91 0.90
N 172 N136 N143
1
0.840.920.840.93
1
PDF created with pdfFactory Pro trial version www.pdffactory.com
72
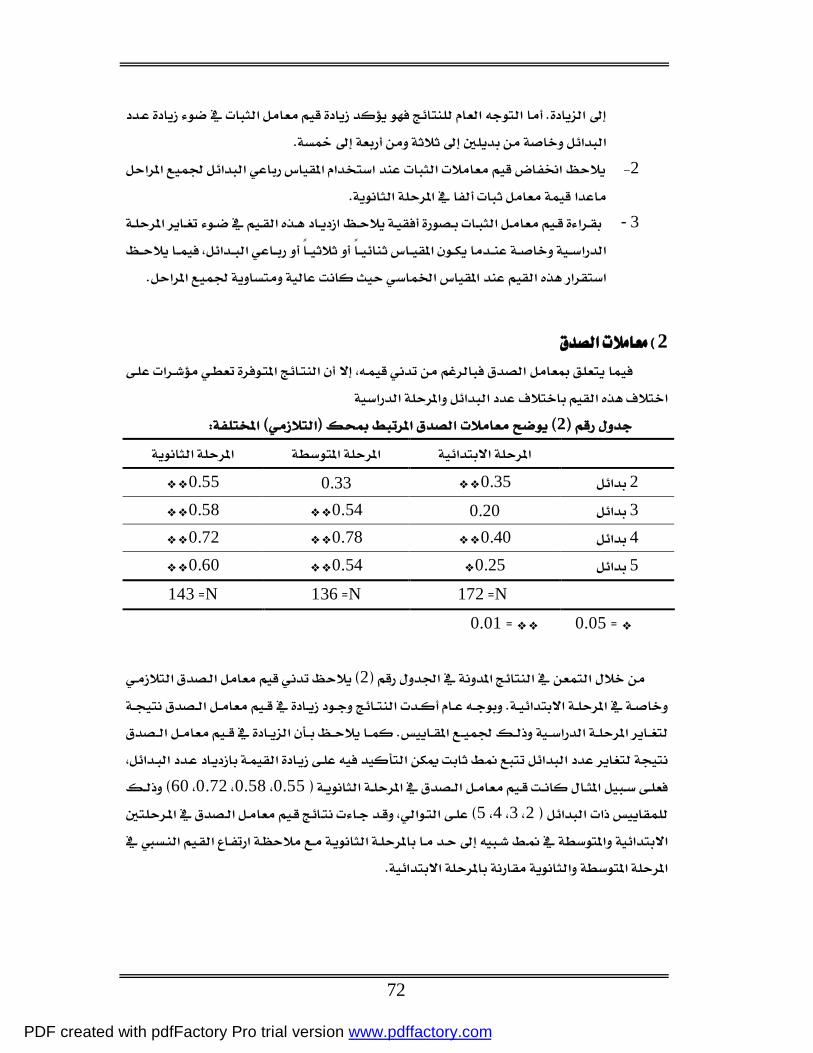
2
3-
2
2
2 0.35 0.33 0.55 3 0.20 0.54 0.58 4 0.40 0.78 0.72 5 0.25 0.54 0.60
N 172 N136 N143 0.050.01
2
0.550.580.7260
2345
PDF created with pdfFactory Pro trial version www.pdffactory.com
73
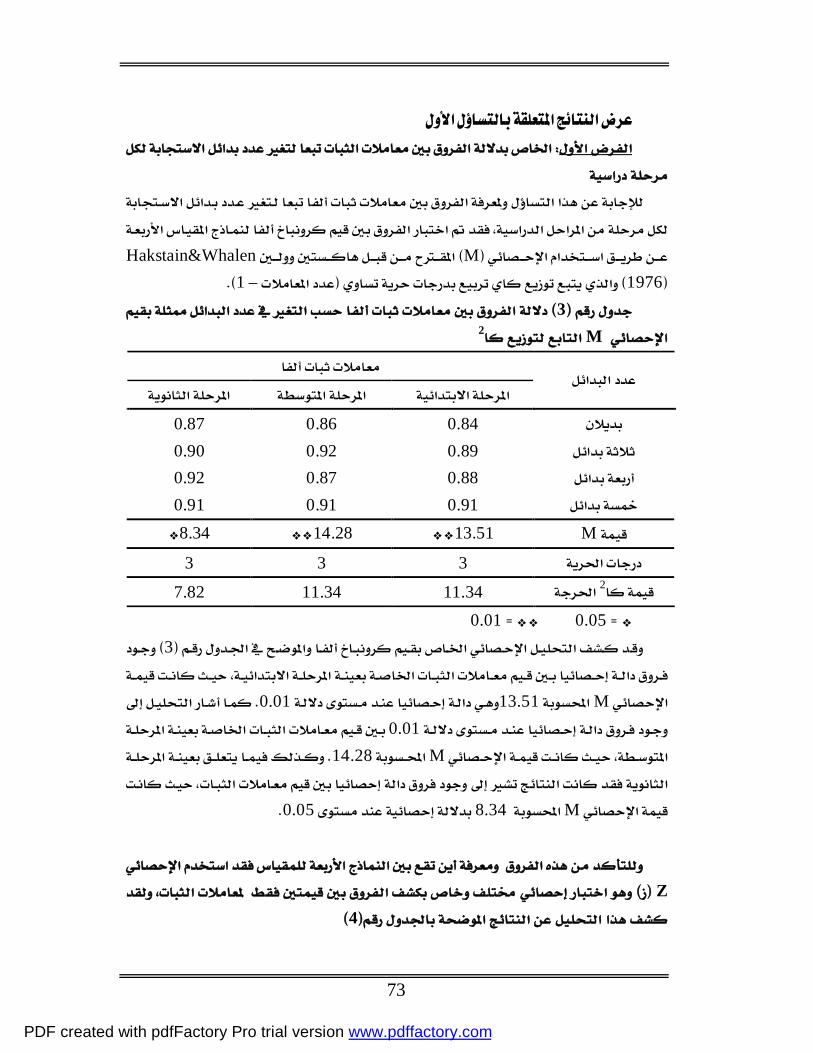
MHakstain&Whalen
1976–1 3
M 2
0.84 0.86 0.87 0.89 0.92 0.90 0.88 0.87 0.92 0.91 0.91 0.91
M 13.51 14.28 8.34 3 3 3
2 11.34 11.34 7.82 0.050.01
3M13.510.01
0.01M14.28
M8.340.05
Z4
PDF created with pdfFactory Pro trial version www.pdffactory.com
74
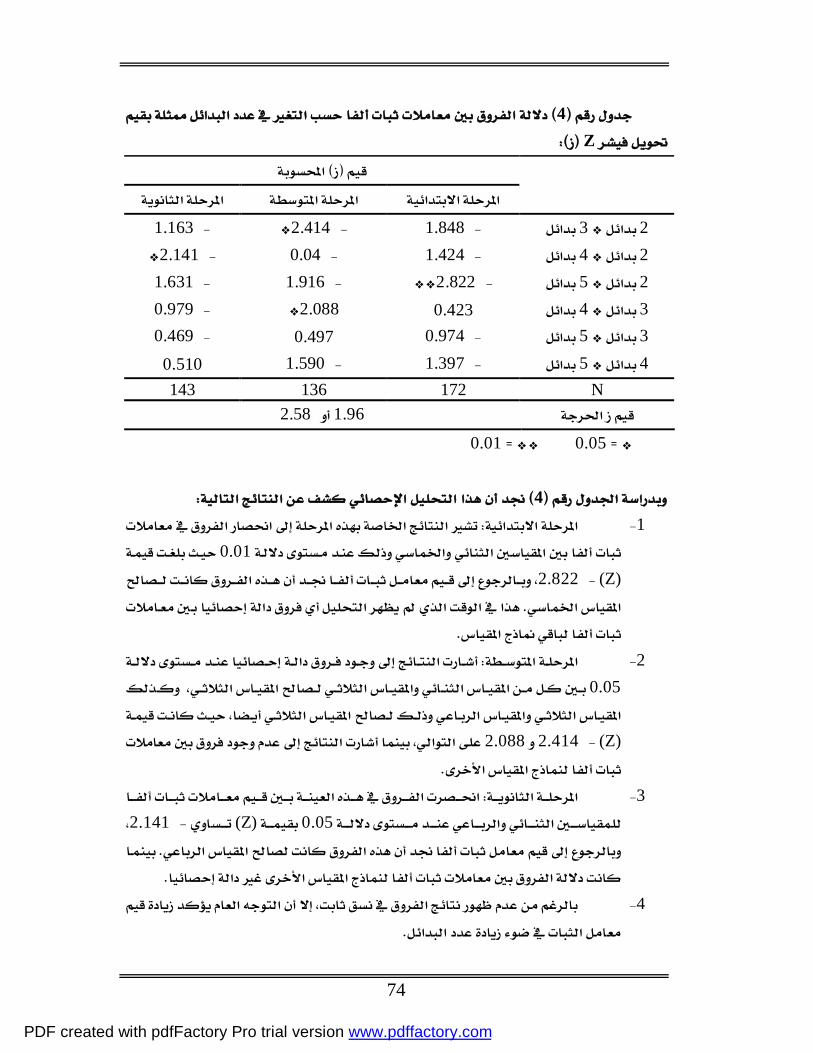
4Z
23 1.848 2.414 1.163 24 1.424 0.04 2.141 25 2.822 1.916 1.631 34 0.423 2.088 0.979 35 0.974 0.497 0.469 45 1.397 1.590 0.510
N 172 136 143 1.962.58
0.050.01
4 1
0.01(Z) 2.822
2 0.05
(Z) 2.4142.088
3 0.05(Z) 2.141
4
PDF created with pdfFactory Pro trial version www.pdffactory.com
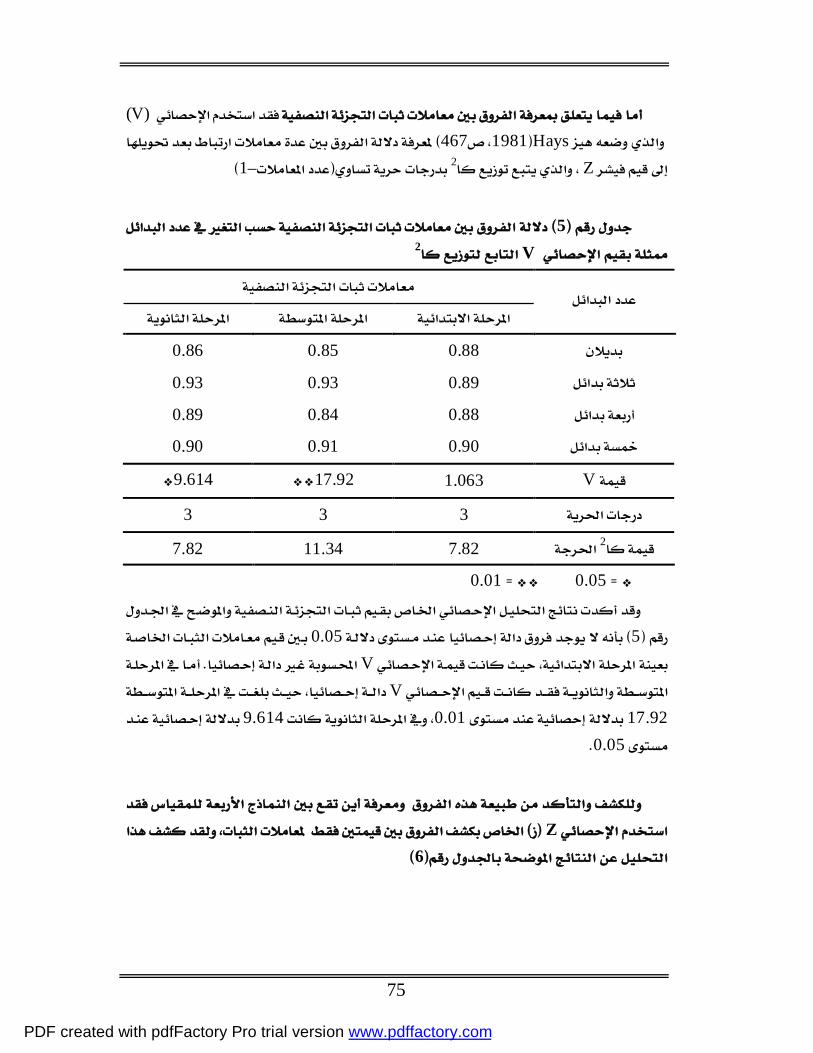
75
(V) Hays1981467
Z2–1
5V 2
0.88 0.85 0.86 0.89 0.93 0.93 0.88 0.84 0.89 0.90 0.91 0.90
V 1.063 17.92 9.614
3 3 3
2 7.82 11.34 7.82 0.050.01
50.05 V
V17.920.019.6140.05
Z
6
PDF created with pdfFactory Pro trial version www.pdffactory.com
76
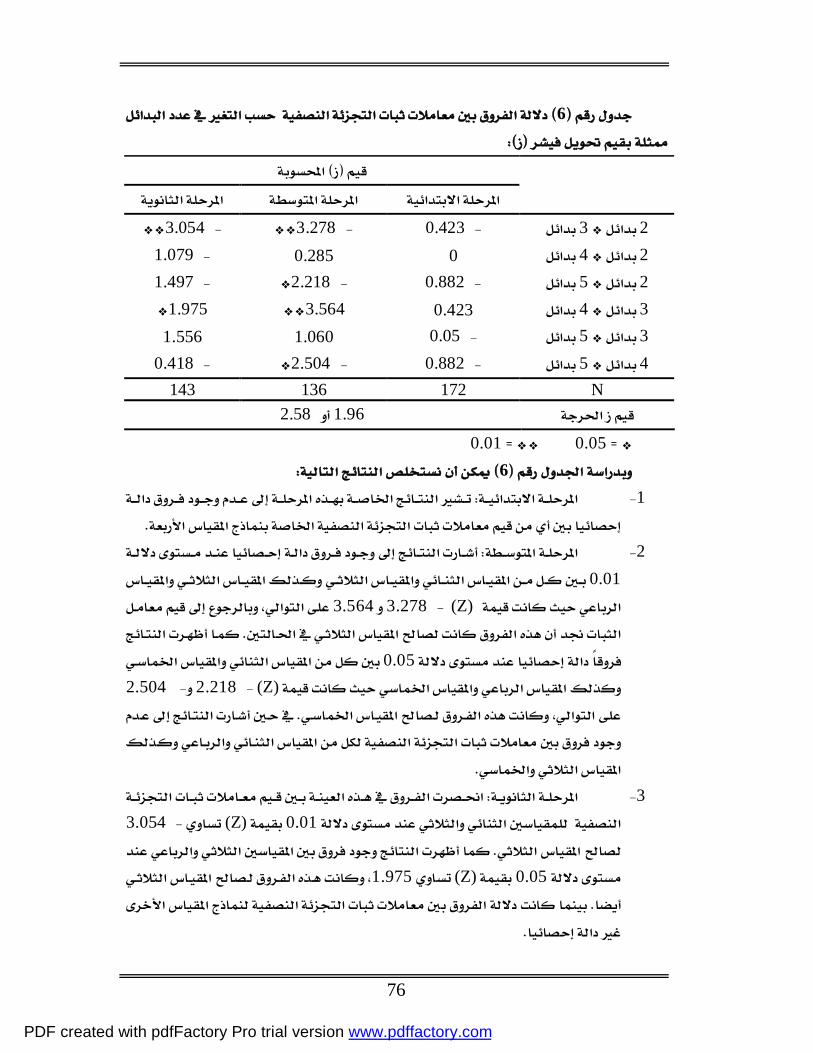
6
23 0.423 3.278 3.054 24 0 0.285 1.079 25 0.882 2.218 1.497 34 0.423 3.564 1.975 35 0.05 1.060 1.556 45 0.882 2.504 0.418
N 172 136 143 1.962.58
0.050.01 6
1
2 0.01
(Z) 3.2783.564
0.05(Z) 2.218 2.504
3
0.01(Z) 3.054
0.05(Z)1.975
PDF created with pdfFactory Pro trial version www.pdffactory.com
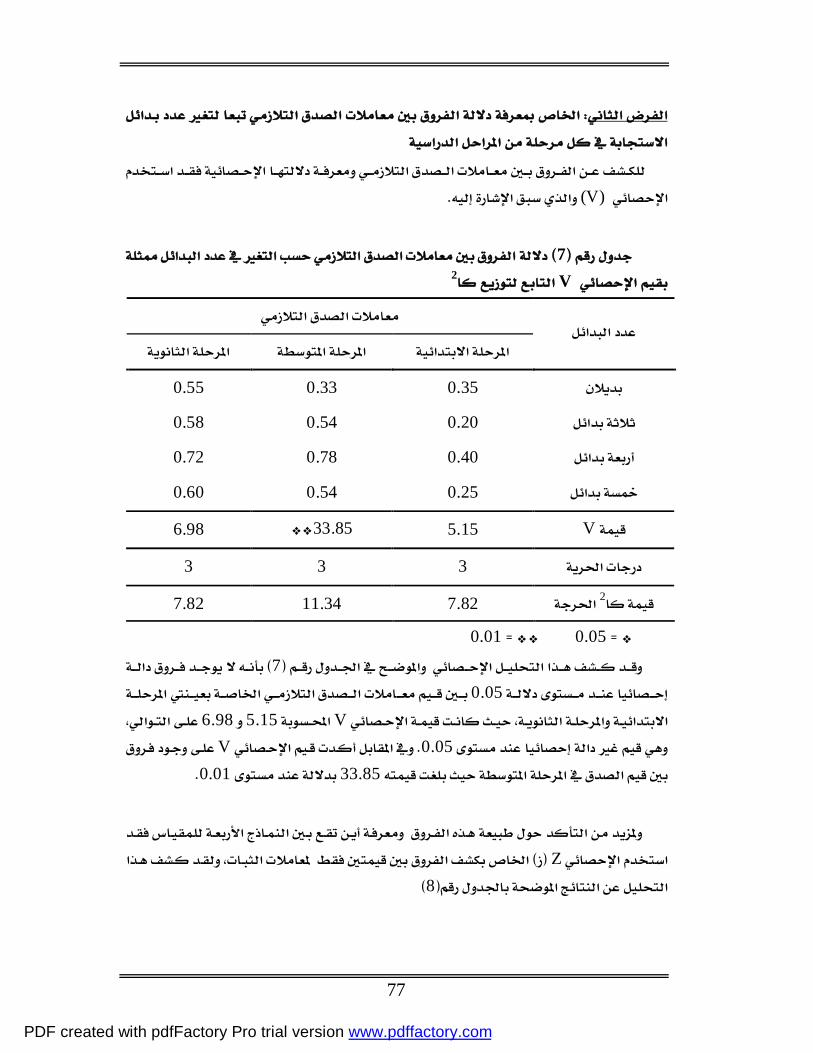
77
(V)
7V 2
0.35 0.33 0.55
0.20 0.54 0.58
0.40 0.78 0.72
0.25 0.54 0.60
V 5.15 33.85 6.98
3 3 3
2 7.82 11.34 7.82 0.050.01
70.05
V5.156.980.05V
33.850.01
Z8
PDF created with pdfFactory Pro trial version www.pdffactory.com
78
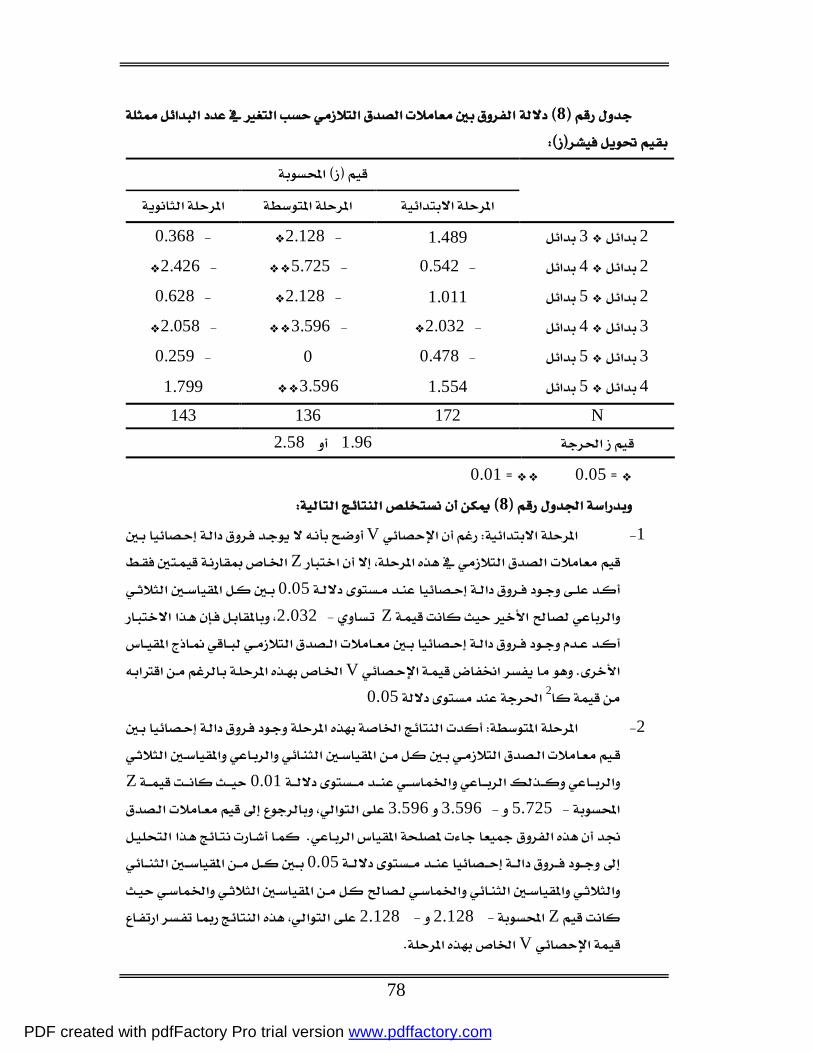
8
23 1.489 2.128 0.368 24 0.542 5.725 2.426 25 1.011 2.128 0.628 34 2.032 3.596 2.058 35 0.478 0 0.259 45 1.554 3.596 1.799
N 172 136 143 1.962.58
0.050.01 8
1 VZ
0.05Z 2.032
V
20.05 2
0.01Z
5.725 3.5963.5960.05
Z 2.128 2.128
V
PDF created with pdfFactory Pro trial version www.pdffactory.com
79
3 ZV
Z–2.426 2.0580.05
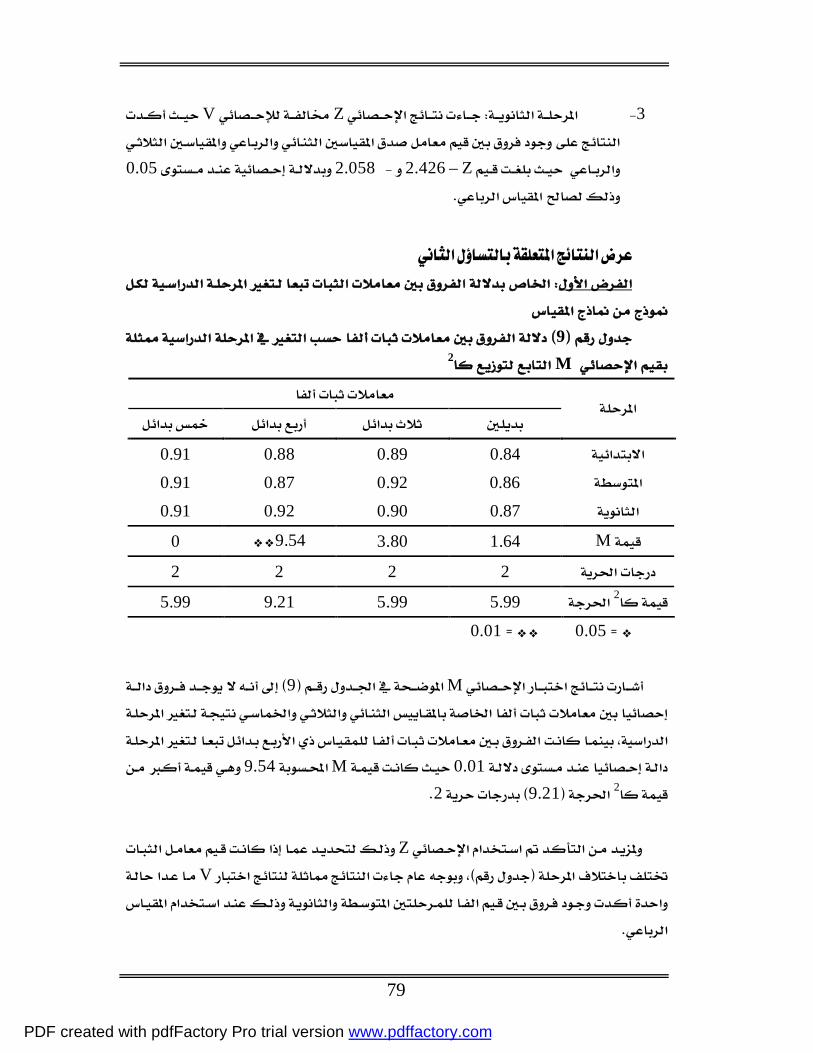
9M 2
0.84 0.89 0.88 0.91 0.86 0.92 0.87 0.91 0.87 0.90 0.92 0.91 M 1.64 3.80 9.54 0
2 2 2 2 2 5.99 5.99 9.21 5.99
0.050.01
M9
0.01M9.54
29.212 Z
V
PDF created with pdfFactory Pro trial version www.pdffactory.com
80
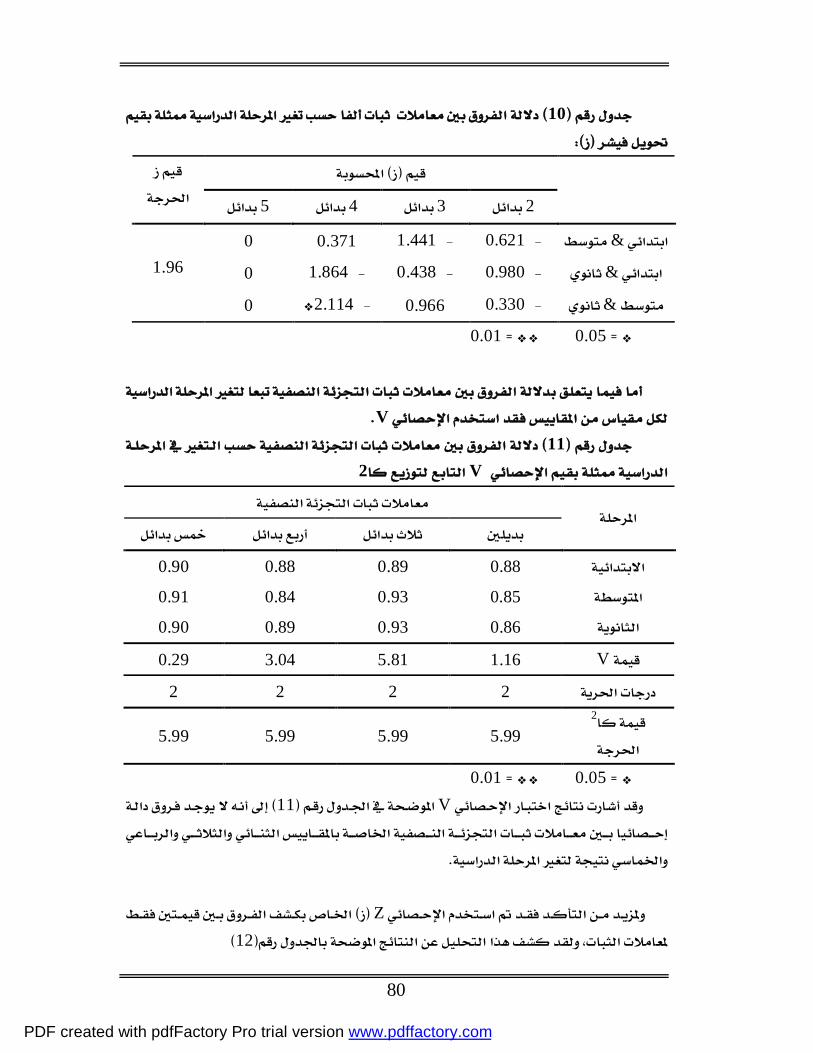
10
2 3 4 5
& 0.621 1.441 0.371 0 & 0.980 0.438 1.864 0 1.96
& 0.330 0.966 2.114 0
0.050.01
V 11
V 2
0.88 0.89 0.88 0.90 0.85 0.93 0.84 0.91 0.86 0.93 0.89 0.90 V 1.16 5.81 3.04 0.29
2 2 2 2 2 5.99 5.99 5.99 5.99
0.050.01 V11
Z
12
PDF created with pdfFactory Pro trial version www.pdffactory.com
81
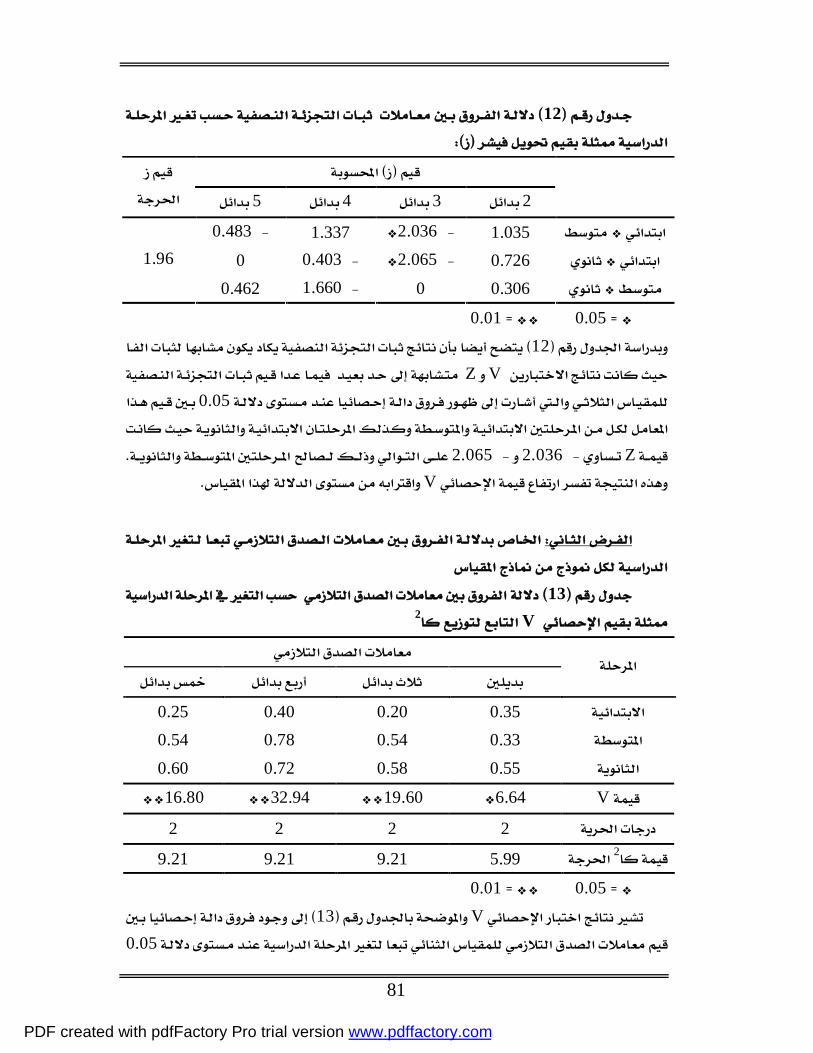
12
2 3 4 5
1.035 2.036 1.337 0.483 0.726 2.065 0.403 0 0.306 0 1.660 0.462
1.96
0.050.01 12
V Z0.05
Z 2.036 2.065
V
13
V 2
0.35 0.20 0.40 0.25 0.33 0.54 0.78 0.54 0.55 0.58 0.72 0.60 V 6.64 19.60 32.94 16.80
2 2 2 2 2 5.99 9.21 9.21 9.21
0.050.01 V13
0.05
PDF created with pdfFactory Pro trial version www.pdffactory.com
82
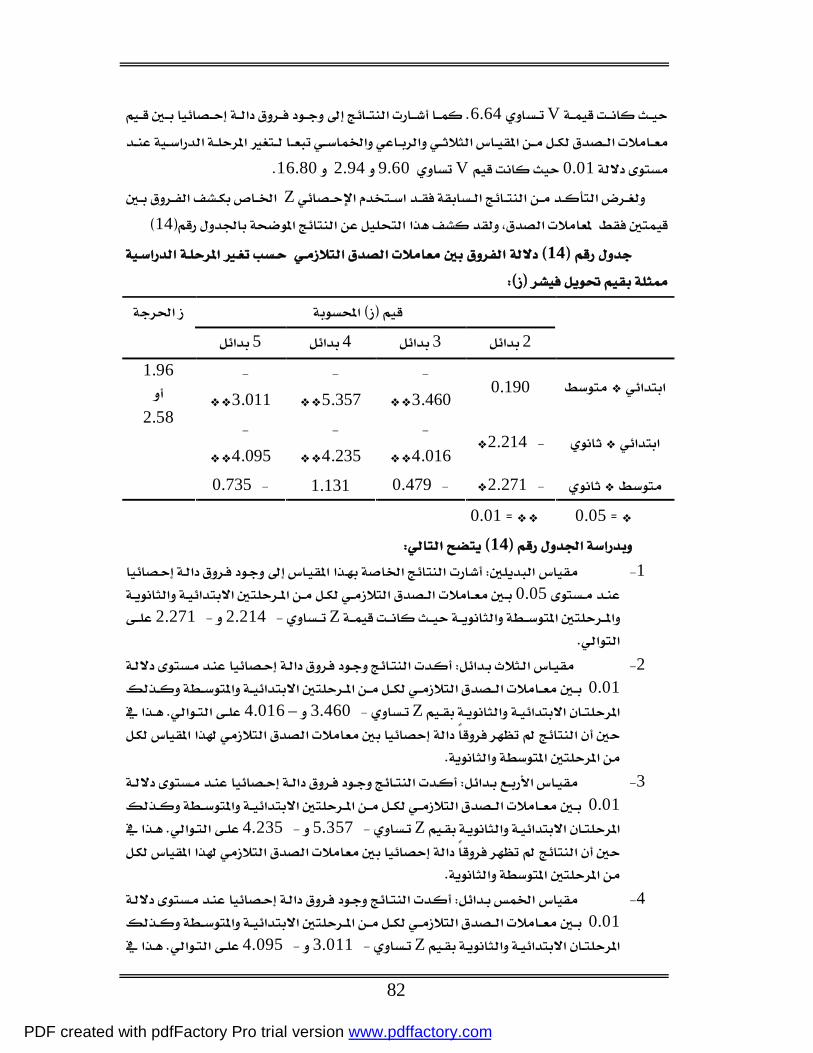
V6.64
0.01V 9.602.9416.80 Z
14 14
2 3 4 5
0.190 3.460
5.357
3.011
2.214 4.016
4.235
4.095
2.271 0.479 1.131 0.735
1.96
2.58
0.050.01 14
1 0.05
Z 2.214 2.271
2 0.01Z 3.460–4.016
3
0.01Z 5.357 4.235
4
0.01Z 3.011 4.095
PDF created with pdfFactory Pro trial version www.pdffactory.com
83
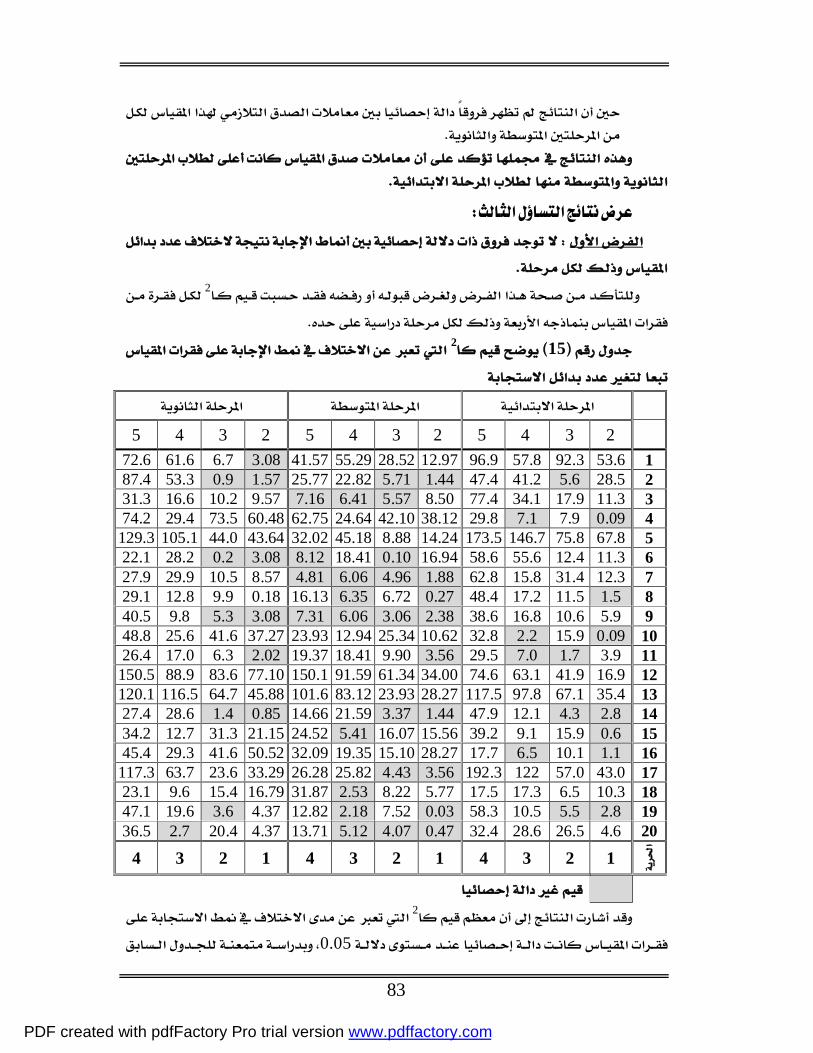
2
152
2 3 4 5 2 3 4 5 2 3 4 5
1 53.6 92.3 57.8 96.9 12.97 28.52 55.29 41.57 3.08 6.7 61.6 72.6 2 28.5 5.6 41.2 47.4 1.44 5.71 22.82 25.77 1.57 0.9 53.3 87.4 3 11.3 17.9 34.1 77.4 8.50 5.57 6.41 7.16 9.57 10.2 16.6 31.3 4 0.09 7.9 7.1 29.8 38.12 42.10 24.64 62.75 60.48 73.5 29.4 74.2 5 67.8 75.8 146.7 173.5 14.24 8.88 45.18 32.02 43.64 44.0 105.1 129.3 6 11.3 12.4 55.6 58.6 16.94 0.10 18.41 8.12 3.08 0.2 28.2 22.1 7 12.3 31.4 15.8 62.8 1.88 4.96 6.06 4.81 8.57 10.5 29.9 27.9 8 1.5 11.5 17.2 48.4 0.27 6.72 6.35 16.13 0.18 9.9 12.8 29.1 9 5.9 10.6 16.8 38.6 2.38 3.06 6.06 7.31 3.08 5.3 9.8 40.5 10 0.09 15.9 2.2 32.8 10.62 25.34 12.94 23.93 37.27 41.6 25.6 48.8 11 3.9 1.7 7.0 29.5 3.56 9.90 18.41 19.37 2.02 6.3 17.0 26.4 12 16.9 41.9 63.1 74.6 34.00 61.34 91.59 150.1 77.10 83.6 88.9 150.5 13 35.4 67.1 97.8 117.5 28.27 23.93 83.12 101.6 45.88 64.7 116.5 120.1 14 2.8 4.3 12.1 47.9 1.44 3.37 21.59 14.66 0.85 1.4 28.6 27.4 15 0.6 15.9 9.1 39.2 15.56 16.07 5.41 24.52 21.15 31.3 12.7 34.2 16 1.1 10.1 6.5 17.7 28.27 15.10 19.35 32.09 50.52 41.6 29.3 45.4 17 43.0 57.0 122 192.3 3.56 4.43 25.82 26.28 33.29 23.6 63.7 117.3 18 10.3 6.5 17.3 17.5 5.77 8.22 32.5 31.87 16.79 15.4 9.6 23.1 19 2.8 5.5 10.5 58.3 0.03 7.52 2.18 12.82 4.37 3.6 19.6 47.1 20 4.6 26.5 28.6 32.4 0.47 4.07 5.12 13.71 4.37 20.4 2.7 36.5
1 2 3 4 1 2 3 4 1 2 3 4
20.05
PDF created with pdfFactory Pro trial version www.pdffactory.com
84
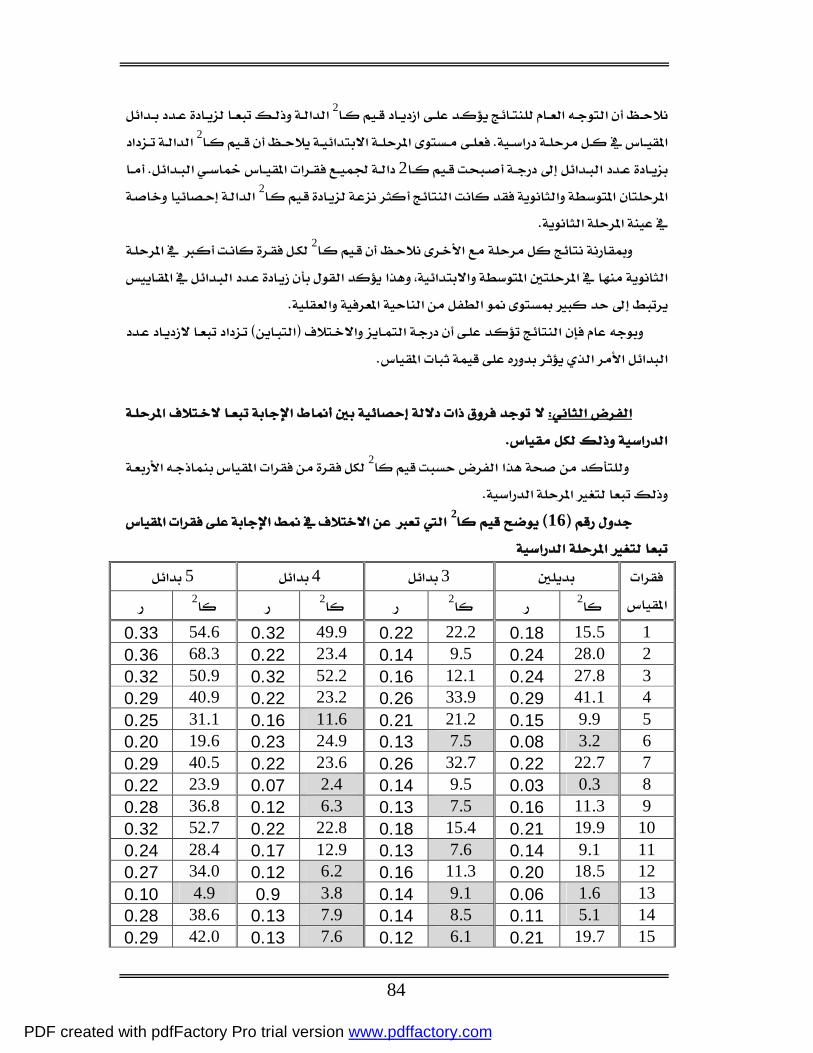
22
22
2
2
162 3 4 5
2 2 2 2 1 15.5 0.18 22.2 0.22 49.9 0.32 54.6 0.33 2 28.0 0.24 9.5 0.14 23.4 0.22 68.3 0.36 3 27.8 0.24 12.1 0.16 52.2 0.32 50.9 0.32 4 41.1 0.29 33.9 0.26 23.2 0.22 40.9 0.29 5 9.9 0.15 21.2 0.21 11.6 0.16 31.1 0.25 6 3.2 0.08 7.5 0.13 24.9 0.23 19.6 0.20 7 22.7 0.22 32.7 0.26 23.6 0.22 40.5 0.29 8 0.3 0.03 9.5 0.14 2.4 0.07 23.9 0.22 9 11.3 0.16 7.5 0.13 6.3 0.12 36.8 0.28
10 19.9 0.21 15.4 0.18 22.8 0.22 52.7 0.32 11 9.1 0.14 7.6 0.13 12.9 0.17 28.4 0.24 12 18.5 0.20 11.3 0.16 6.2 0.12 34.0 0.27 13 1.6 0.06 9.1 0.14 3.8 0.9 4.9 0.10 14 5.1 0.11 8.5 0.14 7.9 0.13 38.6 0.28 15 19.7 0.21 6.1 0.12 7.6 0.13 42.0 0.29
PDF created with pdfFactory Pro trial version www.pdffactory.com
85
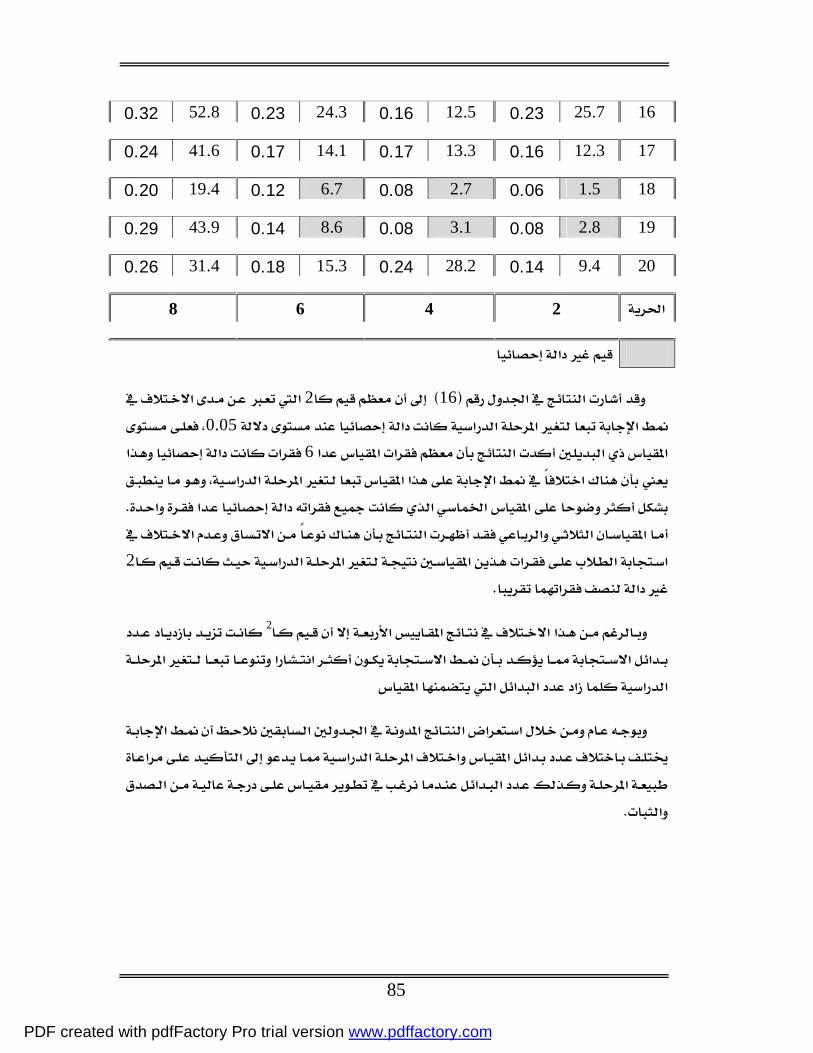
16 25.7 0.23 12.5 0.16 24.3 0.23 52.8 0.32
17 12.3 0.16 13.3 0.17 14.1 0.17 41.6 0.24
18 1.5 0.06 2.7 0.08 6.7 0.12 19.4 0.20
19 2.8 0.08 3.1 0.08 8.6 0.14 43.9 0.29
20 9.4 0.14 28.2 0.24 15.3 0.18 31.4 0.26
2 4 6 8
1620.05
6
2
2
PDF created with pdfFactory Pro trial version www.pdffactory.com

86
1
0.010.05
Symonds1924Velicer & Stevenson1978
Remmers&Ewart1941 Guilford 1954Huck&Jacko1974Boote 1981Goldberg1981Neumann&Neumann1981 Cicchettil1985Saal1989
Russell&Bobko1991Alliger&Williams1992 Chang Lei1994Kim Kyung Hoon19981999 Preston&Colman2000
PDF created with pdfFactory Pro trial version www.pdffactory.com

87
0.91Champney&Marshall1939Lissitz&Green 1975
Jenkins&Taber19775
Mckelvie1978
PDF created with pdfFactory Pro trial version www.pdffactory.com

88
1999
0.01
PDF created with pdfFactory Pro trial version www.pdffactory.com

89
0.05
0.840.88
0.93
0.90
0.05
2
Chang lei1993
PDF created with pdfFactory Pro trial version www.pdffactory.com

90
V
0.05
0.01
0.01
0.05
Mckelvie1978
1428
0.05
0.01
PDF created with pdfFactory Pro trial version www.pdffactory.com

93
20
451172
136143
14
• SPSS • M Hakstain & Whalen1976
PDF created with pdfFactory Pro trial version www.pdffactory.com

94
• V Hays1981467
• Z
• 2 SPSS
6
0.010.05
7
8
9
10
11
PDF created with pdfFactory Pro trial version www.pdffactory.com

95
1
2
3
4
5
6
PDF created with pdfFactory Pro trial version www.pdffactory.com

96
1
2
3 4 5
6
•
•
•
•
•
•
PDF created with pdfFactory Pro trial version www.pdffactory.com

97
1 1987
2 1985
3 1989
4 1984
5 & 1989 &
6 1992
7 1996
8 1997
9 2000
10 1998
11 &1986
12 1990
13 1995
14 1997
15 1993
16 1997
PDF created with pdfFactory Pro trial version www.pdffactory.com

98
17 1995
18 2000
19 1996
20 1993
21 2000
22 1974
23 1988
24 1980
25 1999
26 1997
199 256
27 19928241 53
28 1994
29 1996
91 117
PDF created with pdfFactory Pro trial version www.pdffactory.com
99
30. Alliger, G. M. &Williams, K. J. (1992). Relating the internal consistency of scales to rater response tendencies. Educational and Psychological Measurement, 52: 337-343.
31. Anderson, L. w. (1981). Assessin affective characteristics in the schools. Boston: Allyn and Bacon, Inc.
32. Bendig, A. W. (1954). Reliability and the number of rating scale
categories. Journal of Applied Psychology, 38 , 1:38-40. 33. Benson, J. & Hocovar, D. (1985). The impact of item phrasing on the
Validity of attitude scales for elementary school children. Journal of Educational Measurement, 22 , 3: 231-240.
34. Boote, A. S. (1981). Reliability testing of psychographics scales: Five-
point or seven-point? Anchored or Labeled? Journal of Advertising Research, 21: 53-60.
35. Brown, G. & Widing, R. E. & Coulter, R. L. (1991). Customer
valuation of retail salespeople utilizing the SOCO scale. Journal of the Academe of Marketing Science, 9: 347-351.
36. Bruno, J. E. & Dirkzwager, A. (1995). Determinig the optimal number
of alternatves to a multiple-choice test item: An information theoretic perspective. Educational and Psychological Measurement, 55, 959-966.
37. Budescu, D. V. & Nevo, B. (1985). Optimal number of options: An
investigation of the assumption of proportionality. Journal of Educational Measurement, 22 , 3: 183-196.
38. Champney, H. & Marshall, H. (1939). Optimal refinement of the rating
scale. Journal of Applied Psychology, 23: 323-331. 39. Chan, J. C. (1991). Response-Order Effects in Likert-Type Scales.
Educational and Psychological Measurement, 51: 531-540. 40. Chang, L. (1993). Using confirmatory factor analysis of multitrait-
multimethod data to assess the psychometrical equivalence of 4-point and 6-point likert – type scales. Paper presented at the annual meeting of the national council on measurement in education, Atlanta, GA, April 13-15.
PDF created with pdfFactory Pro trial version www.pdffactory.com
100
41. Chang, L. (1994). A psychometric evaluation of 4-point and 6-point likert-type scales in relation to reliability and validity. Applied Psychological Measurement, 18, 3: 205-215.
42. Chang, L. (1997). Dependability of anchoring labels of Likert-type
scales. Educational and Psychological Measurement, 57, 800-807. 43. Chow, P. & Winzer, M. M. (1992). Reliability and validity of scale
measuring attitudes toward mainstreaming. Educational and Psychological Measurement, 52: 223-228.
44. Cicchetti, D.V & Showalter, D. & Tyer, P.J. (1985). The effect of
number rating scale categories on levels of binterrater reliability: Amonte carlo investigation. Applied Psychological Measurement, 9, 1:31-36.
45. Costin, F. (1970). The optimal number of alternatives in multiple choice
achievement tests. Some empirical evidence for a mathematical proof. Educational and Psychological Measurement, 30, 353-358.
46. Costin, F. (1972). Three choice versus four choice items: Implications
for validity and reliability of objective achievement tests. Educational and Psychological Measurement, 32, 1035-1038.
47. Comrey, A. L. & Montag, I. (1982). Comparison of factor analytic
results with tow-choice and seven-choice personality item formats. Applied Psychological Measurement, 6, 3:285-289.
48. Cox, E. (1980). The optimal number of response alternatives for a scale.
A review Journal of marketing Research, 17: 407-422. 49. Crehan, K. & Haladyna, T. & Brewer, B. (1991). The validity of two
item-writing rules. Journal of Experimental Education, 59, 183-192. 50. Crehan, K. & Haladyna, T. & Brewer, B. (1993). Use of an inclusive
option and the optimal number of options for multiple – choice items. Educational and Psychological Measurement, 53, 241-247.
51. Cronbach, L. J. (1960). Essentials of psychological testing. New York:
Harper & Row, publishers, Incorporated.
PDF created with pdfFactory Pro trial version www.pdffactory.com
101
52. Dixon, P. N. & Bobo, M. & Stevick< R. A. (1984). Response differences and preferences for all-category- defined and end- defined likert formats. Educational and Psychological Measurement, 44, 61-66.
53. Ebel, R. L. (1969). Expected reliabilities as a function of choices per
item. Educational and Psychological Measurement, 29 , 5: 565-570. 54. Eric Landrum, R. (1993). More evidence in favor of three-option
multiple-choice tests. Educational and Psychological Measurement, 53, 771-778.
55. Frisbie, D. A. & Brandenburg, D. C. (1979). Equivalence of
Questionnaire Items With Varying Response Formats. Journal of Educational Measurement, 16: 43-48
56. Garland, Ron. (1991). The Mid-Point on aRating Scale: Is it Desirable?.
Marketing Bulletin, 2, 66-70. 57. Goldberg, L. R. (1981). Unconfounding situational attributions from
uncertain, neutral, and ambiguous ones: A psychometric analysis of descriptions of oneself and various types of others. Journal of Personality and Social Psychology, 41:517-552.
58. Green, P. E., V. R. Rao, 1970. Rating scales and information recovery—How many scales and response categories to use. J.Marketing 34 (3) 33–39
59. Guilford, J. P. (1953). The correlation of an item with a composite of
the remaining items in a test. Educational and Psychological Measurement, 13: 87-93.
60. Hakstian, A. R. & Whalen, T. E. (1976). A K-sample significance test
for independent alpha coefficients. Psychometrika, 41, 219-231. 61. Hancock, G. R. & Sax, G. & Thiede, K. W. & Michael, W. (1993).
Reliability of comparably written two-option multiple-choice and true-false test items. Educational and Psychological Measurement,53, 651-655.
62. Hays, W. (1981). Statistics. 3rd.ed New York: Holt, Rinehart &
Winston.
PDF created with pdfFactory Pro trial version www.pdffactory.com
102
63. Huck, S. W. & Jaccko, E. J. (1974). Effect of varying response format of the Alpert-Haber achievement anxiety test. Journal of Counseling Psychology, 21: 159-163.
64. Jackson Barnette, J. (2000). Effects of stem and Likert Response Option
reversals on survey internal consistency: If you feel the need, There is better alternative to using those negatively worded stems. Educational and Psychological Measurement, 60 (3), 361-370.
65. Jane, S. S. (1984). Effects of certain scale parameters associated with
rating instrument used to evaluate college teaching. Dissertation Abstract International, 45 , 2: 501-A.
66. Jenkins, G. D. & Taber, T. D. (1977). Amonte carlo study of factors
affecting three indices of composite scale reliability. Journal of Applied Psychology, 62: 392-398.
67. Kim, Kyung Hoon. (1998). An Analysis of Optimum Number of
Response. Journal of KAMS, 01: www.kams.org/journal/m1 -05.htm. 68. King, L. A. & King, D. W. & Klockars, A. J. (1983). Dichotomous and
multipoint scales using bipolar adjectives. Applied Psychological Measurement, 7 , 2: 173-180.
69. Komorita, S. S. & Graham, W. K. (1965). Number of scale points and
the reliability of scales. Educational and Psychological Measurement, 4: 987-995.
70. Komorita, S. S. (1963). Attitude content, intensity, and the neutral point
on a likert scale. Journal of Social Psychology, 61: 327-334. 71. Lehmann, D.R. and J.M. Hulbert, (1972), "Are Three-Point Scales
Always Good Enough?" Journal of Marketing Research, 9, 4 (November), 444-446
72. Lesourd, S. J. et al. (1990). Validation of a visionary leadership attitude
instrument using factor analysis. Paper presented at the Annual Meeting of the Mid-Western Educational Research Association (Chicago, IL, October 16-20, 1990). Eric_ no: ED334701.
73. Likert, R. (1932) A technique for the measurement of attitudes.
Archives of Psychology, 140 (June).
PDF created with pdfFactory Pro trial version www.pdffactory.com
103
74. Likert, R. & Roslow, S. & Murphy, G. (1934). A simplified and reliable
method of scoring the Thurstone attitude scale. Journal of Social Psychology, 5, 228-238.
75. Lissitz, R. W. & Green, S. B. (1975). Effect of the number of scale
points on reliability. Amonte carlo approach. Journal of Applied Psychology, 60: 10-13.
76. Lord, F. M. (1977). Optimal number of choices per item a comparision
of four approaches. Journal of Educational Measurement, 14, 33-38. 77. Martin, W. S. & Mathis, W. J. (1974).An investigation of the effect of
the number of scale intervals on principal components factor analysis. Educational and Psychological Measurement, 34: 537-545.
78. Masters, J. R. (1969). The optimal number of categories of a summated
rating scale as a function of content and average discrimination index of the questionnaire. Master’s thesis. University of Pittsburgh.
79. Masters, J. R. (1974). The relationship between number of response
categories and reliability of likert-type questionnaires. Journal of Educational Measurement, 11 , 1: 49-53.
80. Matell, M. S. & Jacoby, J. (1971). Is there an optimal number of
alternatives for likert scales items? Study I: reliability and validity. Educational and Psychological Measurement, 31:657-674.
81. Matell, M. S. & Jacoby, J. (1972). Is there an optimal number of
alternatives for likert scales items? Effects of testing time and scale properties. Journal of Applied Psychology, 56 (6), 506-509.
82. Mccaslin, N. L. & Torres, R. M. (1992). Latent Factors Underlying
Vocational Teachers' Attitudes toward Using Microcomputers for Supplementing In-Service Education. Paper presented at the Meeting of the American Vocational Association (St. Louis, MO, December 6, 1992), ERIC_NO: ED352482.
83. Mckelvie, S. J. (1978). Graphic rating scales- How many categories.
British Journal of Psychology, 69: 185-202.
PDF created with pdfFactory Pro trial version www.pdffactory.com
104
84. Miller, G. A. (1956). The magical number seven. Plus or minus tow: Some limits on our capacity for processing information. Psychological Review, 63, 81-97.
85. Munshi, Jamal. (1990). A Method for Constructing Likert Scales.
http://www.jamalx.com/papers/likert.html 86. Muller, D. (1982). Measurement of attitudes Interests and personality
traits Bloomington. Indiana: Indiana University Press. 87. Newstead,S. E. & Arnold, J. (1989). The effect of response format on
ratings of teaching. Educational and Psychological Measurement, 49, 33-43.
88. Nunnally, J. C. (1967). Psychometric Theory. New York: MCgraw-
Hillbook. 89. Ochieng, C. O. (2001). Effects of item order on consistency and
precision under different ordering schemes in attitudinal scales: A Case of physical self-concept scales. (paper No. ESQESS-2001-3). Vancouver, B.C.: University of British Columbia. Edgeworth Laboratory for Quantitative Educational and Social Science.
90. Ochieng, C. O. & Zumbo, B. D. (2001). Implications of ordinal scale
categorization on regression models under different distributions and conditions: an assessment of the accuracy and information of Likert scales on regression analysis. University of British Columbia. Presented at the NCME Conference, Seattle, WA, April 12,2001. www.educ.ubc.ca/faculty/zumbo/ins2001/index.html.
91. Owen, S. V. & Froman, R. D. (1987). What’s wrong with three- option
multiple choice items?. Educational and Psychological Measurement, 47: 513-522.
92. Preston, C. C. & Colman, A. M. (2000). Optimal number of response
categories in rating scales: Reliability, validity, discriminating power, and respondent preferences. Acta Psychologica, 104, 1-15.
93. Remington, M. & Tyrer, P. J. & Newson-smith, J & Cicchetti, D. V.
(1979).Comparative reliability of categorical and analogue rating scales in the assessment of psychiatric symptomatology. Psychological medicine, 9: 765-770.
PDF created with pdfFactory Pro trial version www.pdffactory.com
105
94. Remmers, H. H. & Ewart, E. (1941). Reliability of multiple-choice measuring instruments as a function of the spearman brown prophecy formula. Journal of Educational Psychology,32: 61-66.
95. Russell, C. J. & Pinto, J. K. & Bobko, P. (1991). Appropriate moderated
regression and inappropriate research strategy: A demonstration of information loss due to scale coarseness. Applied Psychological Measurement, 15 , 3: 257-266.
96. Scherpenzeel, A. (2001). Why use 11-point scales? www.plg.at
/eureporting/ sourcebook.pdf 97. Straton, R. G. & Catts, R. M. (1980). A comparison of tow – three and
four choice item test given affixed total number of choices. Educational and Psychological Measurement, 40: 357-365.
98. Symonds, P. M. (1924). On the loss of reliability in ratings due to
coarseness of the scale. Journal of Experimental, 7, 456-461.
99. Trevisan, M. s. & Sax, G. & Michael, W. B. (1991). The effects of the number of options per item and student ability on test validity and reliability. Educational and Psychological Measurement, 51, 829-837.
100. Trevisan, M. s. & Sax, G. & Michael, W. B. (1994). Estimating the optimim number of options oer item using an incremental option paradigm. Educational and Psychological Measurement, 54, 86-91.
101. Velicer, W. F. & Stevenson, J. F. (1987). The relation between item format and the structure of the eysenck personality inventory. Applied Psychological Measurement, 2 , 2: 293-304.
102. Weng, L. J. & Cheng, C. P. (2000). Effect of response order on Likert-type scales. Educational and Psychological Measurement, 60(6), 908-924.
103. Williams, B. J. & Ebel, R. L. (1957). The effect of varying the number of alternatives per item and multiple-choice vocabulary test items. In Owen, S. V. and Froman, R. D. (1987). What's wrong with three –option multiple-choice items?. Educational and Psychological Measurement, 47, 513-522.
104. Wyatt, R. C. & Meyers, L. S. (1987). Psychometric properties of four-
5 point likert-type response scales. Educational and Psychological Measurement, 47: 27-35.
PDF created with pdfFactory Pro trial version www.pdffactory.com
107
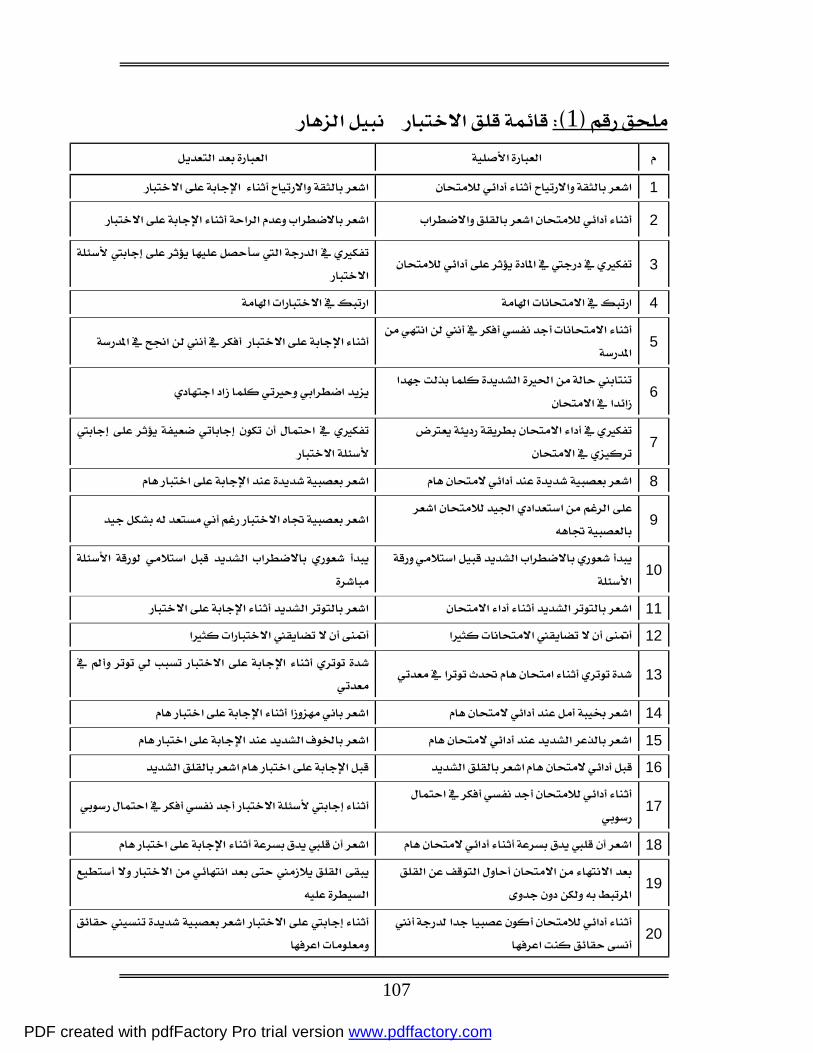
1
1
2
3
4
5
6
7
8
9
10
11
12
13
14
15
16
17
18
19
20
PDF created with pdfFactory Pro trial version www.pdffactory.com
108
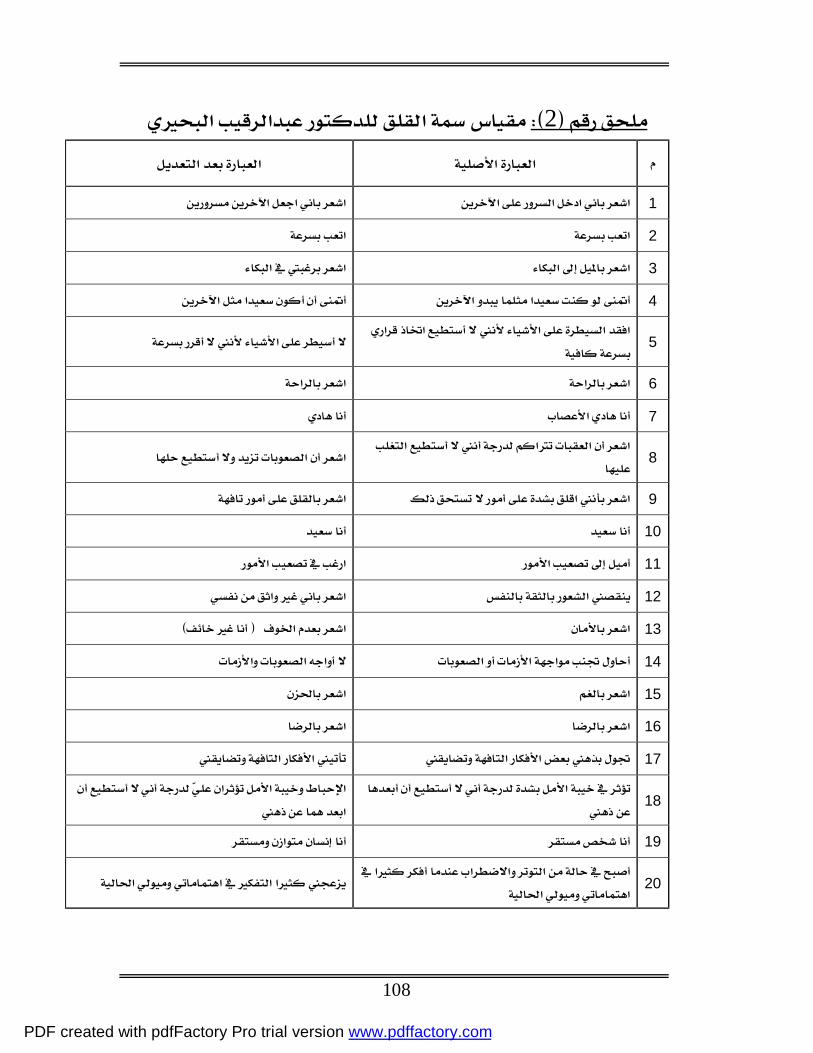
2
1
2
3
4
5
6
7
8
9
10
11
12
13
14
15
16
17
18
19
20
PDF created with pdfFactory Pro trial version www.pdffactory.com
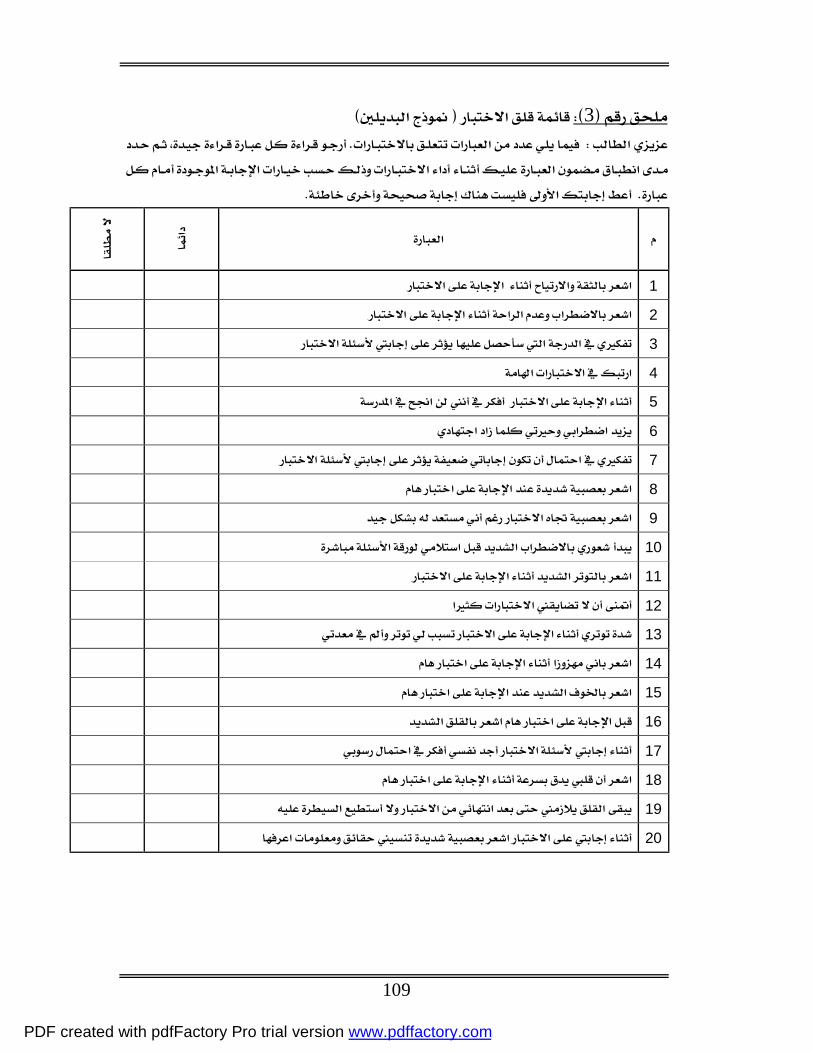
109
3
1
2
3
4
5
6
7
8
9
10
11
12
13
14
15
16
17
18
19
20
PDF created with pdfFactory Pro trial version www.pdffactory.com

110
4
1
2
3
4
5
6
7
8
9
10
11
12
13
14
15
16
17
18
19
20
PDF created with pdfFactory Pro trial version www.pdffactory.com

111
5
1
2
3
4
5
6
7
8
9
10
11
12
13
14
15
16
17
18
19
20
PDF created with pdfFactory Pro trial version www.pdffactory.com

112
6
1
2
3
4
5
6
7
8
9
10
11
12
13
14
15
16
17
18
19
20
PDF created with pdfFactory Pro trial version www.pdffactory.com
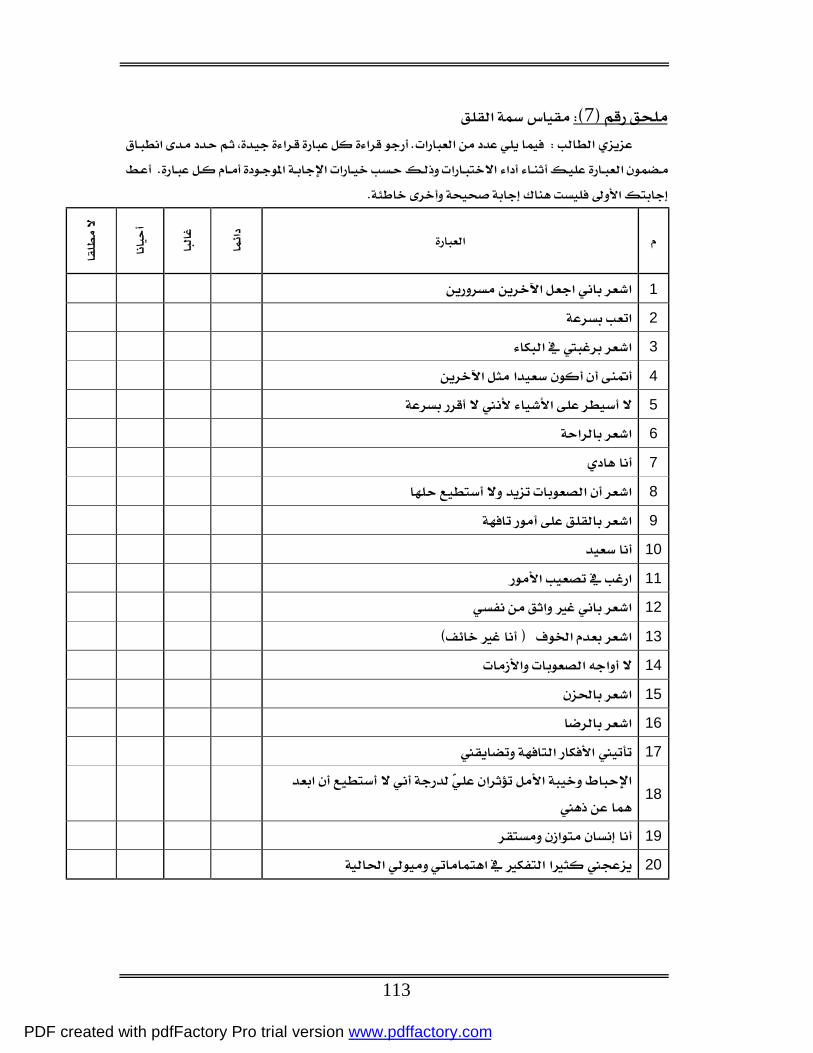
113
7
1
2
3
4
5
6
7
8
9
10
11
12
13
14
15
16
17
18
19
20
PDF created with pdfFactory Pro trial version www.pdffactory.com
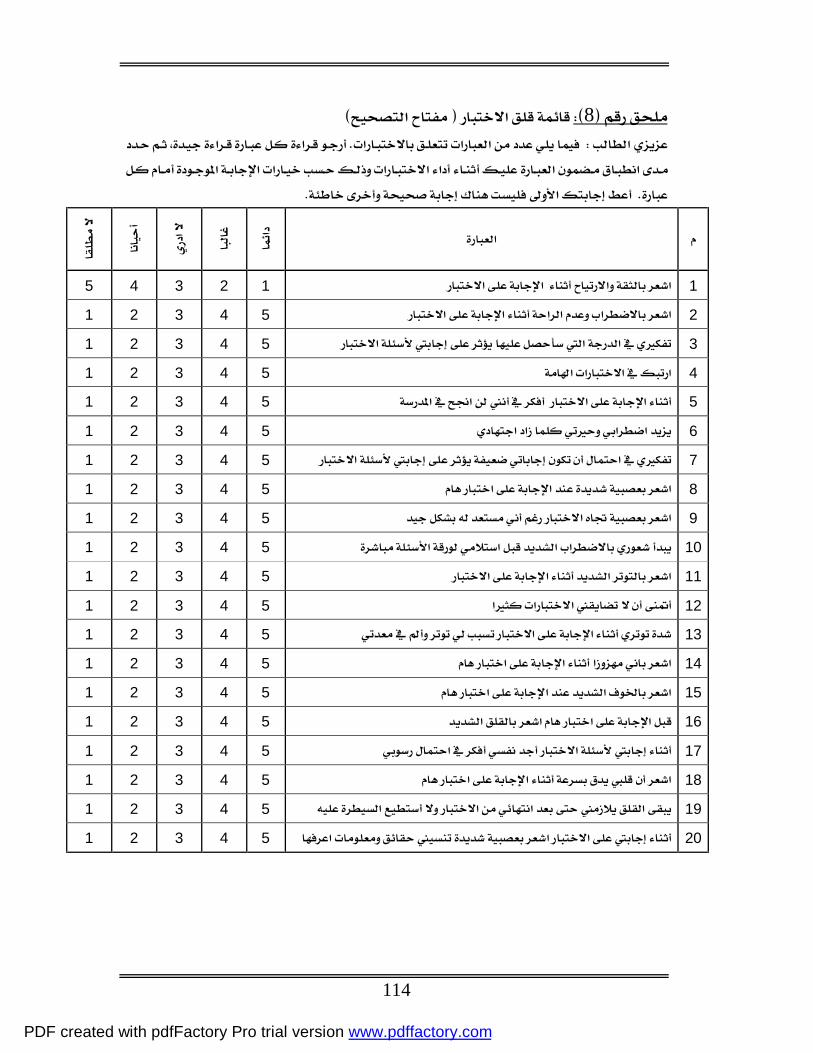
114
8
1 1 2 3 4 5
2 5 4 3 2 1
3 5 4 3 2 1
4 5 4 3 2 1
5 5 4 3 2 1
6 5 4 3 2 1
7 5 4 3 2 1
8 5 4 3 2 1
9 5 4 3 2 1
10 5 4 3 2 1
11 5 4 3 2 1
12 5 4 3 2 1
13 5 4 3 2 1
14 5 4 3 2 1
15 5 4 3 2 1
16 5 4 3 2 1
17 5 4 3 2 1
18 5 4 3 2 1
19 5 4 3 2 1
20 5 4 3 2 1
PDF created with pdfFactory Pro trial version www.pdffactory.com
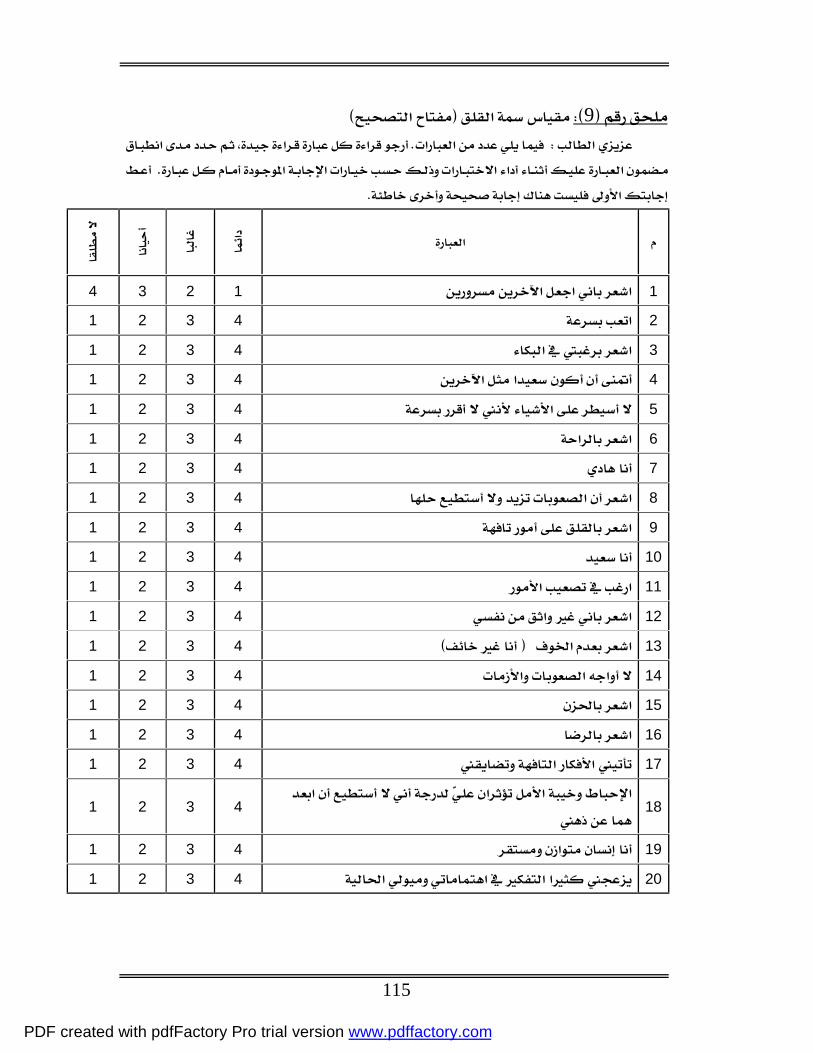
115
9
1 1 2 3 4
2 4 3 2 1
3 4 3 2 1
4 4 3 2 1
5 4 3 2 1
6 4 3 2 1
7 4 3 2 1
8 4 3 2 1
9 4 3 2 1
10 4 3 2 1
11 4 3 2 1
12 4 3 2 1
13 4 3 2 1
14 4 3 2 1
15 4 3 2 1
16 4 3 2 1
17 4 3 2 1
18
4 3 2 1
19 4 3 2 1
20 4 3 2 1
PDF created with pdfFactory Pro trial version www.pdffactory.com