Embed Size (px)
Citation preview
1
1
2
3
REMOVAL OF WATERBORNE MICROORGANISMS BY FILTRATION 4
USING CLAY-POLYMER COMPLEXES 5
6
TOMAS UNDABEYTIA*†
, ROSA POSADA†, SHLOMO NIR
‡, IRENE GALINDO
†, 7
LEONILA LAIZ†, CESAREO SAIZ-JIMENEZ
†, ESMERALDA MORILLO
† 8
9
(†). Institute of Natural Resources and Agrobiology, IRNAS-CSIC, P. O. Box 1052, 10
41080 Seville, Spain. 11
(‡).The Robert H. Smith Faculty of Agriculture, Food and Environment, Hebrew 12
University of Jerusalem, Rehovot 76100, Israel. 13
14
15
*Corresponding author; phone: +34-954624711; fax: +34-954624002, e-mail: 16
18
Postprint of: Journal of Hazardous Materials 279: 190–196 (2014)
2
Abstract 19
Clay-polymer composites were designed for use in filtration processes for disinfection 20
during the course of water purification. The composites were formed by sorption of 21
polymers based on starch modified with quaternary ammonium ethers onto the 22
negatively charged clay mineral bentonite. The performance of the clay-polymer 23
complexes in removal of bacteria was strongly dependent on the conformation adopted 24
by the polycation on the clay surface, the charge density of the polycation itself and the 25
ratio between the concentrations of clay and polymer used during the sorption process. 26
The antimicrobial effect exerted by the clay-polymer system was due to the cationic 27
monomers adsorbed on the clay surface, which resulted in a positive surface potential of 28
the complexes and charge reversal. Clay-polymer complexes were more toxic to 29
bacteria than the polymers alone. Filtration employing our optimal clay-polymer 30
composite yielded 100 % removal of bacteria after the passage of 3 L, whereas an 31
equivalent filter with granular activated carbon (GAC) hardly yielded removal of 32
bacteria after 0.5 L. Regeneration of clay-polymer complexes saturated with bacteria 33
was demonstrated. Modeling of the filtration processes permitted to optimize the design 34
of filters and estimation of experimental conditions for purifying large water volumes in 35
short periods. 36
37
Key words: water purification, filtration, clay-polymer complexes, bacteria, modeling 38
39
40
3
41
1. Introduction 42
Disinfection processes are crucial in water treatment utilities. Disinfection is 43
traditionally performed in drinking water treatment plants (WTPs) by chlorination, 44
which reduces significantly pathogens in water but may pose a serious risk to human 45
health due to formation of disinfection by-products (DBPs) [1]. The presence of a 46
minute amount of natural organic matter in chlorinated waters can induce the formation 47
of trihalomethanes (THMS) and haloacetic acids (HAAS), which are carcinogenic. The 48
use of chloramination instead reduces the formation of these chemicals but leads to the 49
formation of nitrosamines [2]. 50
Ozone is also a very powerful disinfectant able to remove a wide range of 51
microorganisms including those resistant to other oxidative means, such as chlorination. 52
However, it is a very unstable molecule, which decomposes very quickly. Studies have 53
shown undesired effects after ozonation, such as formation of nitrosamines [3] and 54
cyanogen halides [4]. Advanced oxidation processes based on the attack of the target 55
molecules by hydroxyl radicals generated by UV irradiation in the presence of oxidants, 56
such as ozone, H2O2 or TiO2, are capable of degrading very efficiently numerous prions 57
[5]. 58
Disinfection processes are greatly improved in combination with other water treatment 59
processes such as filtration technologies [6-8]. Depth filtration is incorporated in the 60
vast majority of WTPs, and helps to reduce the loading of waterborne pathogens by 61
physical sorption or entrapment in addition to removal of particles to which they are 62
associated. Moreover, it may be effective for removal of DBP precursors. Membrane 63
4
filtration processes are mostly advantageous for very stringent water quality standards 64
because of their high operational costs [9]. 65
One of the most widely-used materials in column filtration is GAC; however, this 66
material has very poor performance for removal of pathogens. Therefore, present 67
research is focusing on GAC modification and the synthesis of new composite materials 68
to be used as media for microorganism [10-14]. An alternative is the use of polymer-69
based composites due to the antimicrobial properties exerted by cationic polymers [15]. 70
These composites are of particular interest when dealing with water soluble polymers, 71
where surface anchorage is needed for their preparation. Tashiro et al. [16] prepared 72
polymers based on polystyrene supported in alumina granules, which presented high 73
adsorption rate constants in Escherichia coli’s removal. Madkour et al. [17] eliminated 74
E. coli and Staphylococcus aureus from water by using glass surfaces grafted with 75
poly(butylmethacrylate)-co-poly(boc-aminoethyl methacrylate). However, only few 76
studies showing the potential use of polymer based composites in water filtration 77
processes for removal of microorganisms are scarce [18]. 78
Clay-polymer composites can be designed by adsorption of cationic polymers onto 79
negatively charged clay mineral platelets. The driving forces for polymer sorption are 80
the translational entropic gain due to removal of water molecules and counter ions from 81
the clay surface, and the electrostatic attraction between the polymer and the clay 82
surface [19]. Adsorption of certain polycations on clay minerals was considered 83
irreversible [20]. The use of clay-polymer composites in the removal of microorganisms 84
from water by filtration has not been thoroughly studied yet. In the current study, we 85
aimed at (i) designing clay-polymer composites with antibacterial properties based on 86
the sorption of cationic starches onto a commercial bentonite; (ii) elucidating the 87
mechanisms and factors involved in the development of toxicity of the new composites; 88
5
(iii) testing their efficiency in the removal of the pathogenic enteroindicator E. coli by 89
filtration; and (iv) analysis of the kinetics of filtration for generating estimates for a 90
variety of situations, e.g., upscaling. The polymers used were cationic starches which 91
are widely used as additives in paper-making, textile and cosmetic industry. 92
93
2. Materials and Methods. 94
2.1. Materials. 95
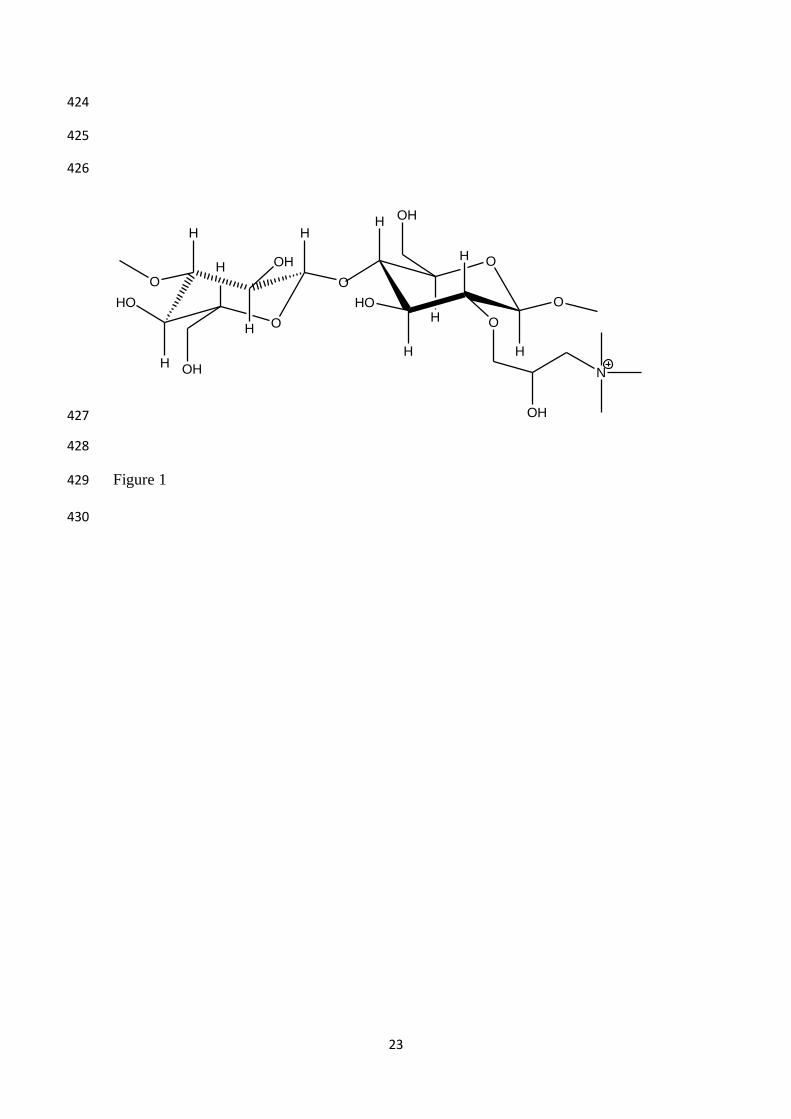
The cationic starches employed were a gift from Penford Co. (Centennial, CO) and are 96
based on the reaction of hydroxyl groups of pristine starch with 3-chloro-2-97
hydroxypropyltrimethylammonium (chemical structure in Fig. 1). Three types of 98
polymers were studied differing in their degree of substitution (DS). All of them are 99
commercial: Topcat L-98 (DS=0.22) (denoted hereafter as P1); Topcat L-95 (DS=0.15) 100
(denoted as P2) and Penbond 1000 (DS=0.05) (P3). Their charge densities (CD) were 101
determined to be respectively, 1.19 meq/g for P1, 0.846 meq/g for P2, and 0.29 meq/g 102
for P3. A commercial Na-bentonite (Bentonil A, CEC 0.8 mmolc/g) was kindly supplied 103
from Süd-Chemie Spain. Granular activated carbon (GAC) (NUSORB GC60, 12x30 104
mesh) was purchased from NUCON International, Inc. (Columbus, OH). 105
The bacterial strain E. coli was purchased from the Spanish Type Culture Collection 106
(CECT): The Luria-Bertani growth medium and the Agar for the microbial assays were 107
supplied by Merck (Darmstadt, Germany). The LIVE/DEAD BacLight Bacterial 108
Viability kits were obtained from Life Technologies (Carlsbad, CA, USA). 109
110
2.2 Sorption of polymers onto the clay. 111
Sorption isotherms of the polymers onto the commercial bentonite were carried out by 112
mixing 15 mL of polymer solutions (0-40 g/L) with 24 mg of clay. The clay 113
6
concentration was 1.6 g/L. After shaking for 24 h at 20ºC, the suspensions were 114
centrifuged at 12000 g for 10 min, the supernatants were discarded and the pellets were 115
dry-frozen. The sorbed amount of polymer was determined by elemental C analysis. 116
The zeta potential (ξ) of the polymer-clay complexes obtained after sorption was 117
measured by redispersing with distilled water at a concentration of 1.6 g/L. The samples 118
were allowed to equilibrate for 1h and few milliliters of dispersion were measured using 119
a Zetasizer Nanosystem (Malvern Instruments, Southborough, MA). 120
X-ray diffraction of oriented samples on glass slides was also measured using a Philips 121
X’Pert diffractometer (model Anton Paar HTK) at low and higher angles on a Siemens 122
diffractometer (model D5000). The samples were prepared from the paste obtained after 123
centrifugation of the polymer-clay suspensions of the adsorption experiments. 124
Several clay polymer complexes were prepared for their study in the next sections. In 125
general, clay powder was added to a polymer solution; the suspension was shaken for 126
24 h and centrifuged; the pellet was dry-frozen yielding the clay-polymer composite. A 127
nomenclature for the different clay-polymer composites was introduced where the first 128
two characters indicate the type of polymer, the following number denotes the polymer 129
concentration added in g/L and the last number the clay concentration used in g/L. 130
131
2.3 Determination of bactericidal effects of clay-polymer composites. 132
Escherichia coli were incubated for 24h at 37ºC in Luria-Bertani nutrient broth, and a 133
bacteria suspension with a 105 CFU/mL concentration was prepared. Clay-polymer 134
complexes were added to this suspension in centrifuge tubes at a 1.5:100 solid: water 135
ratio. This ratio was chosen after preliminary trials to see differences in the bactericidal 136
activity of the prepared clay-polymer complexes. After 1 h incubation at 25ºC, the 137
suspensions were centrifuged at 1000 rpm for 10 min at 4ºC, and 0.1 mL of the 138
7
suspensions were removed and mixed with 0.9 mL of sterile distilled water, and then 139
successive decimal serial dilutions were prepared. From the suspensions and successive 140
dilutions, the surviving bacteria were counted on nutrient media by the spread-plate 141
method and expressed as colony forming units (CFU) per milliliter of sample. The 142
plates were incubated at 37ºC and the colonies were counted after 24 h. The counting 143
was done in four replicates every time. The limit of quantification (LOQ) for bacteria 144
analysis with the spread-plate method is 10 CFU/mL. If no colonies are recovered, the 145
limit of detection (LOD) is reported to be <10 CFU/ml for a 1:10 dilution according to 146
the ASTM International. 147
In a parallel experiment, the deactivation of the cells after interaction with the clay 148
complexes was examined by using a LIVE/DEAD stain methodology. Briefly, 1 mL of 149
the suspension was incubated in darkness for 15 min with 4 L of a mixture of 150
propidium iodide and the SYTO 9 dye. After centrifugation, the pellets were mounted 151
on slides and examined with a Zeiss Axioskop epifluorescence microscope at 40x 152
magnification counting the dead and live cells on the clay-polymer surfaces by emission 153
of red and green light, respectively. Three sections were examined for each slide and the 154
results were expressed as percent of dead cells over the total counted. Preliminary 155
experiments showed no difference in the counting after replacing the supernatant with 156
distilled water, vortexed for 1 min and centrifuged again. 157
158
2.4. Removal of microorganisms by filtration. 159
In Experiment 1, column filter experiments were performed with 50/1 (w/w) mixture of 160
quartz sand and clay-polymer complexes or GAC. Glass columns of 21 cm in length 161
and 2 cm in diameter and with a porous plate at the bottom were filled with 73.5 g of 162
thin quartz sand mixed with 1.5 g of clay-polymer complexes or GAC. The active 163
8
sorbent layer was 13 cm length. Glass wool (0.35 g) was placed on both ends of the 164
column to prevent exit of the sand from the column. The pore volume of the column 165
was 12.9 mL. The column was connected to a peristaltic pump and saturated at a 166
constant flow rate of 7 mL/min with distilled water (equivalent to a flow velocity of 1.3 167
m/h). Then, an E. coli suspension of 105 CFU/mL prepared freshly from a stock 168
solution, under continuous stirring started to pass-by. Preliminary experiments showed 169
that the suspension was stable when staying 3 d at room temperature. Experiment 2 was 170
analogously performed but only with the active material P1/10/4.25 at a flow rate of 4 171
mL/min (or 0.76 m/h). In another set of experiments (Experiment 3), two columns were 172
connected in series and aliquots were taken at the exit of each column. The flow rate 173
was constant at 7 mL/min (or 1.3 m/h). 174
175
2.4.1 Regeneration 176
In Experiment 1, after the columns were saturated by passing a suspension containing 177
105
CFU/mL of E.coli, two procedures were assayed for regeneration: (i) 1L of a 0.1 M 178
HCl solution was passed through the column at a flow rate of 0.6 mL/min, and washed 179
after that with 1 L of distilled water; (ii) idem but a commercial solution of sodium 180
hypochlorite (2% w:v) was used instead of the acid. A new similar suspension including 181
105 CFU/mL E. coli was passed through the filters. The choice of these reagents was to 182
examine the competitive effect of protons to detach the negatively-charged bacteria 183
interacting with the positively charged clay-polymer composites; and the use of a 184
common reagent used in WWT for regeneration of membranes through oxidation of 185
pollutants. 186
187
2.5. Analysis of the kinetics of filtration. 188
9
In this analysis, the adsorption and convection phenomena occurring in the filter are 189
modeled as in Nir et al. [21] (details in Supporting Information). The parameters 190
employed in the calculation are: molar concentration of adsorbing sites is Ro, C1 (M-1
191
min-1
), rate constant of forward adsorption), and D1 (min-1
), rate constant of desorption) 192
193
2.6. Statistical analysis 194
Statistical analyses were carried out using the JMP IN software package (SAS Institute 195
Inc., NC, USA). One way analysis of variance (F-test ANOVA, p = 0.05) was used to 196
check the influence of each factor. All experiments were done at least three times, each 197
treatment with four replicates. 198
The statistical criteria employed for simulation and prediction of certain experimental 199
results of filtration by the calculations according to Eq(1) were the values of R2 and 200
RMSE, the Root Mean Square Error, defined by 201
RMSE= (∑(YCi - Yexpi ) 2/(n-2))
0.5 (2) 202
in which n is the number of data points (we used averages of triplicates), and YCi and 203
Yexpi are the calculated and experimental values of percent removal. The term (n- 2) in 204
Eq(2) is due to using 2 adjustable parameters. 205
206
3. Results and Discussion. 207
3.1. Clay-polymer composites. 208
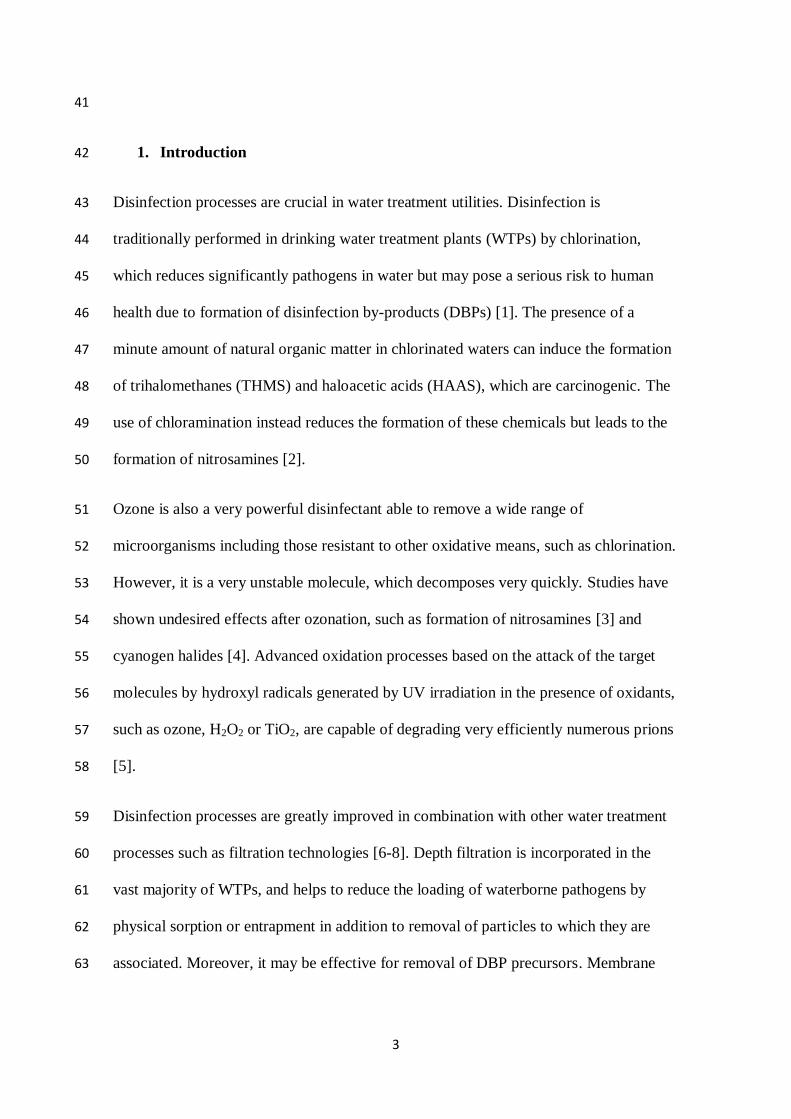
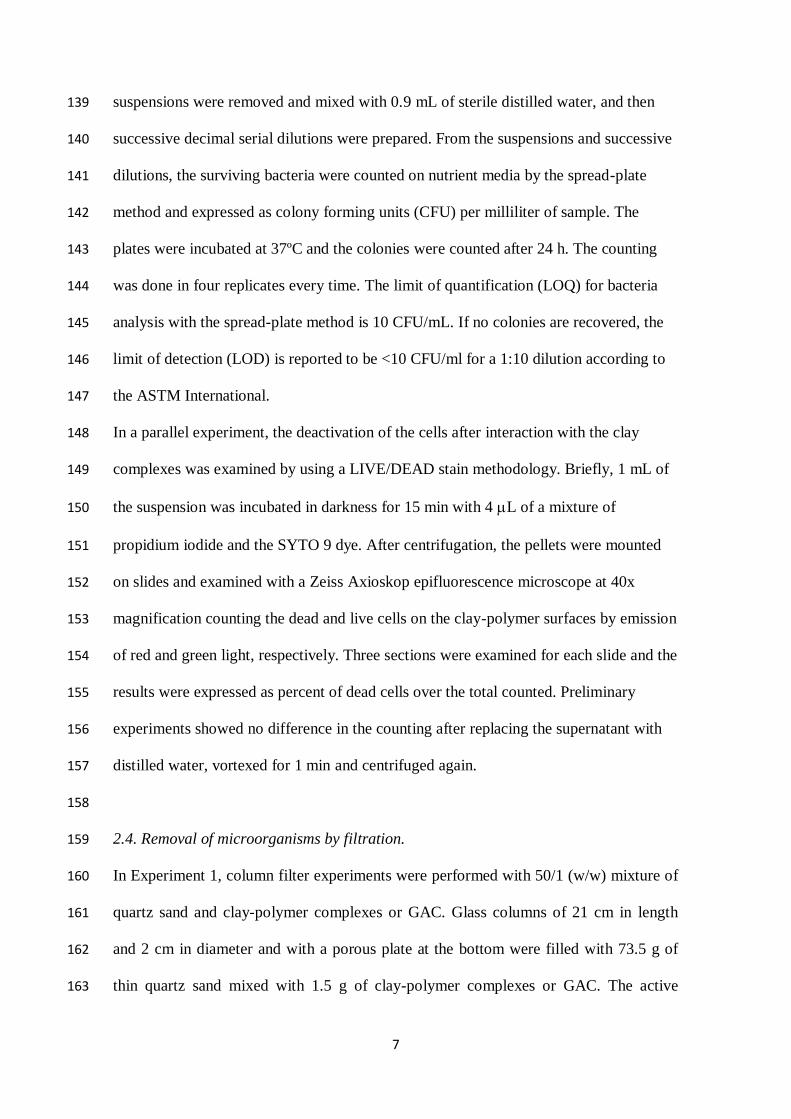
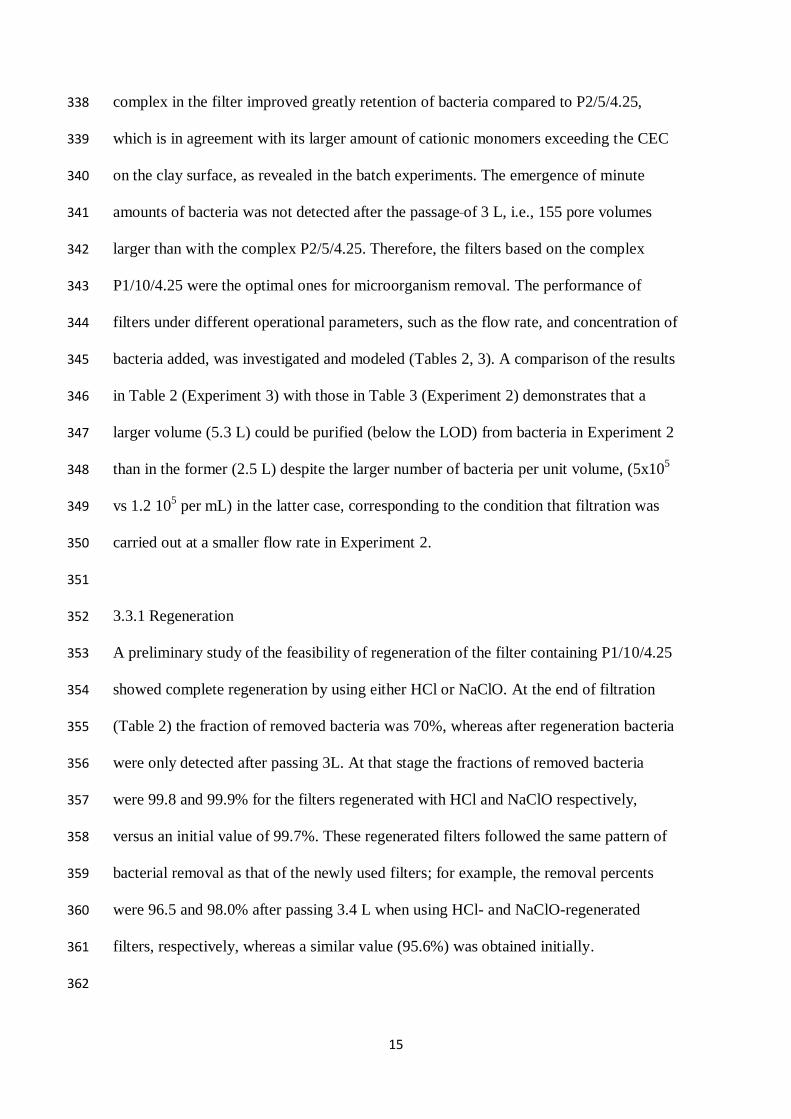
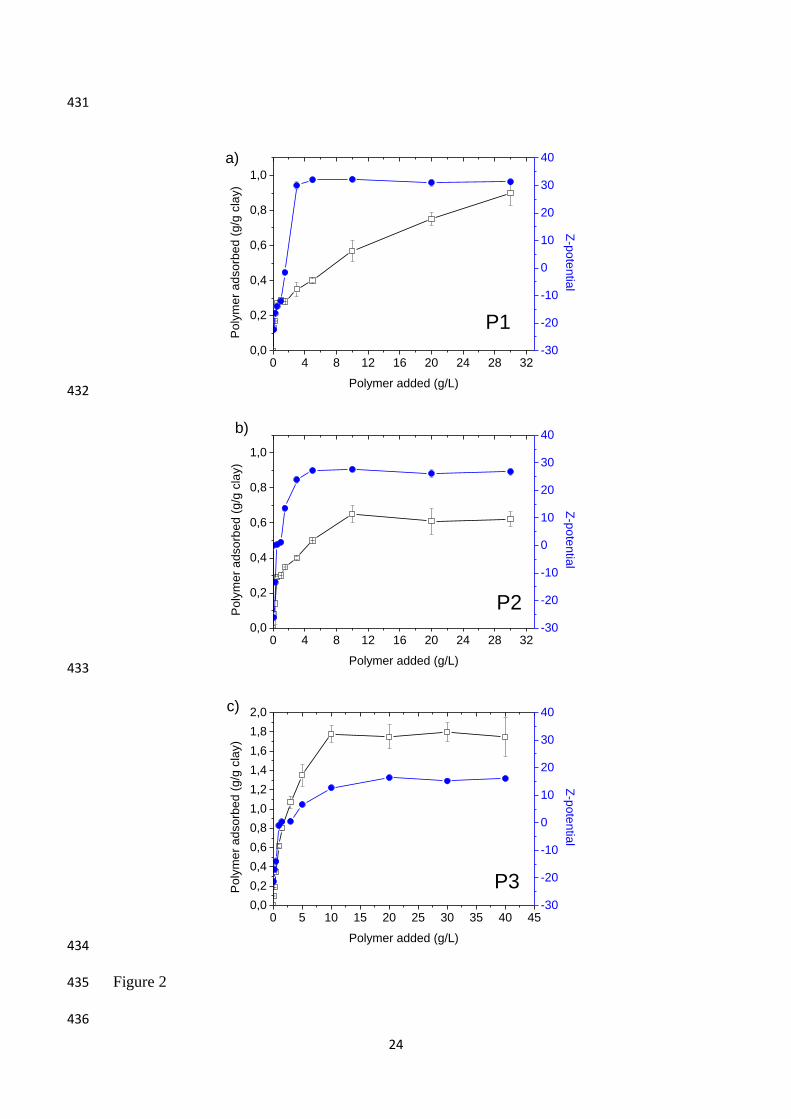
Fig. 2 shows the sorption isotherms of the polymers and zeta potential of the composites 209
formed. The sorption behavior of the polymers showed an initial steep increase as 210
expected from strong Coulombic interactions with the negatively charged clay surface. 211
Further sorption yielded positive values of the zeta potential, reaching higher values for 212
P1 (about +30 mV), followed by P2 (~+25 mV) and P3 (~+15 mV). 213
10
Based on the degree of substitution, the calculated charge density (CD) was 1.19 meq/g 214
of polymer for P1; 0.846 meq/g of polymer for P2 and 0.29 meq/g of polymer for P3. 215
Charge neutralization at the external surface was observed at a loading of 0.3 g of 216
polymer/g clay for P1 and P2, and 0.8 g of polymer/g clay for P3; thus accounting for 217
0.36, 0.25 and 0.23 meq/g clay for P1, P2 and P3, respectively. These lower values for 218
the point of zero charge (p.z.c.) than the CEC of the clay can be explained by the 219
extending positive segments, or by the high screening of the clay surface by non-220
charged segments of the polycation after sorption [22]. 221
The loading of polymer on the clay was highest for P3 reaching a sorption plateau at 222
1.73 g polymer/g clay, whereas lower amounts were observed for P2 and P1. The 223
polymer loading on the clay can be rationalized on the basis of CD, which determines 224
the strength of the polyelectrolyte-surface interactions. For low CD polyelectrolytes 225
such as P3, the lower amount of strong electrostatic interaction with the clay surface 226
increases the importance of the steric repulsion of the uncharged portion of the polymer 227
backbone between adjoining charged segments neutralized by the clay surface [23]. 228
Therefore, these uncharged portions are extending into solution in the form of loops and 229
tails, resulting in both thicker adsorbed layer and higher loadings. In contrast, the 230
stronger interactions with the clay surface for polycations with high CD as would be for 231
P1 and P2, result in a flat conformation of the polymer molecule on the clay surface, 232
i.e., the area occupied by one single molecule is higher, yielding lower adsorbed 233
amounts. 234
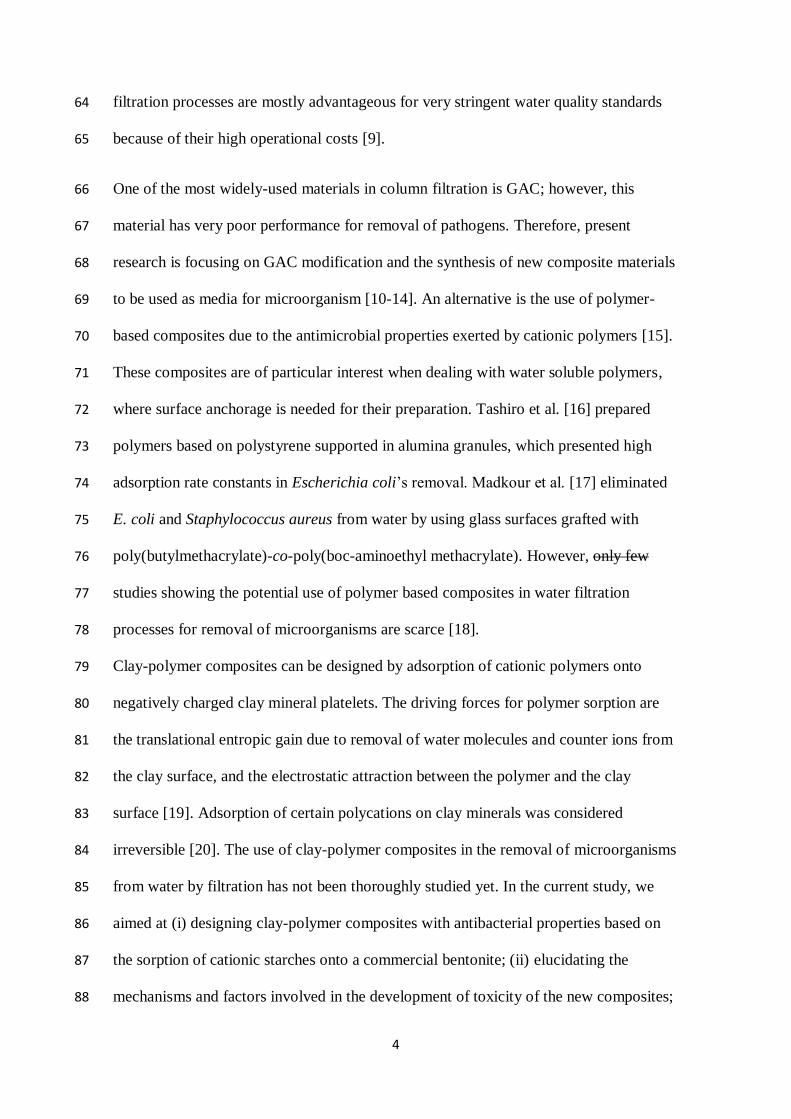
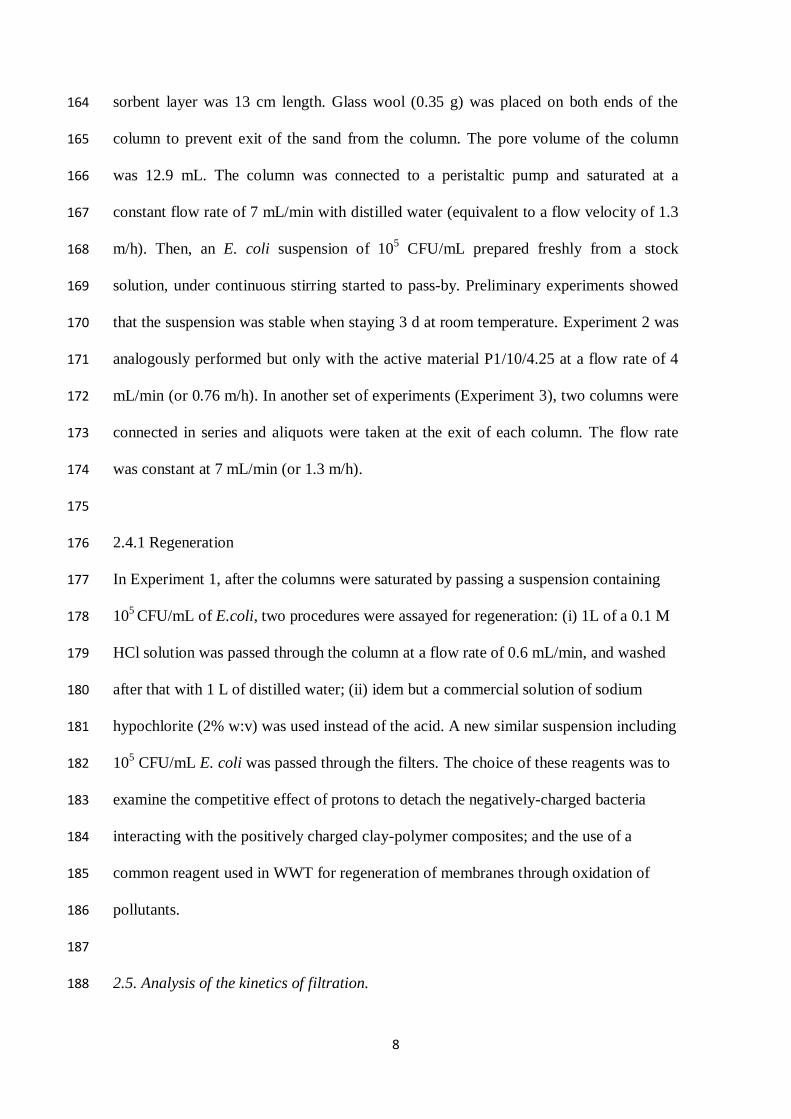
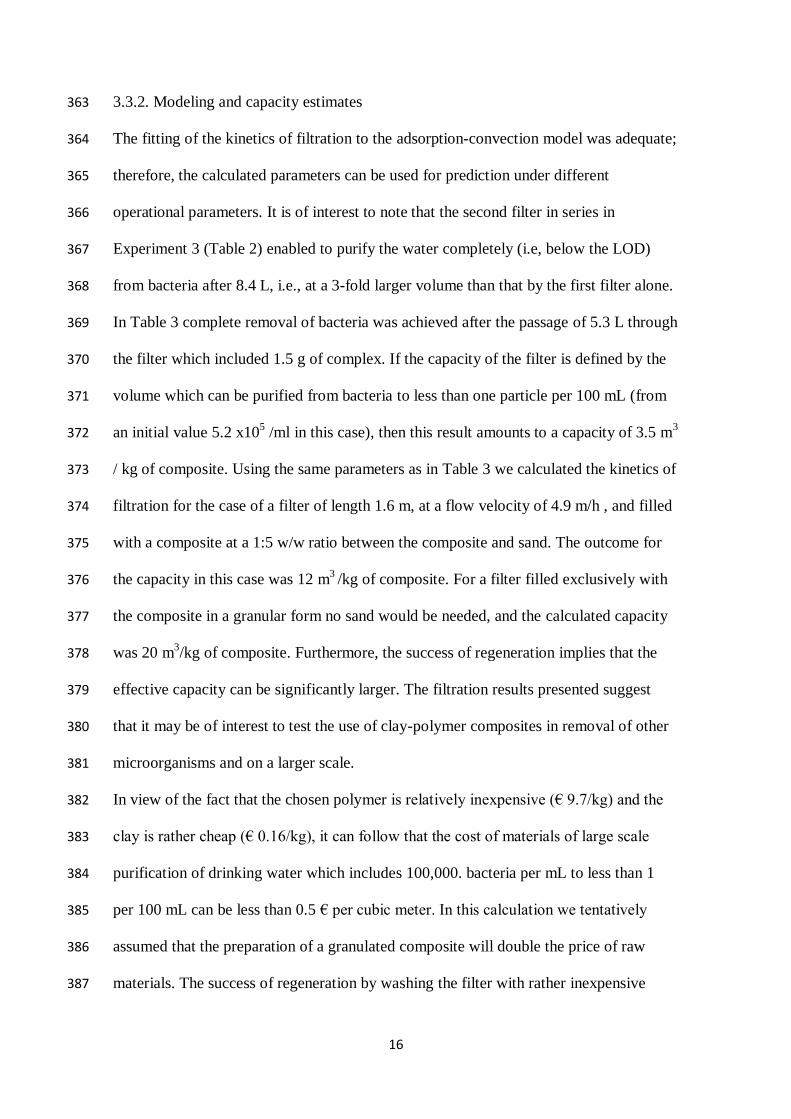
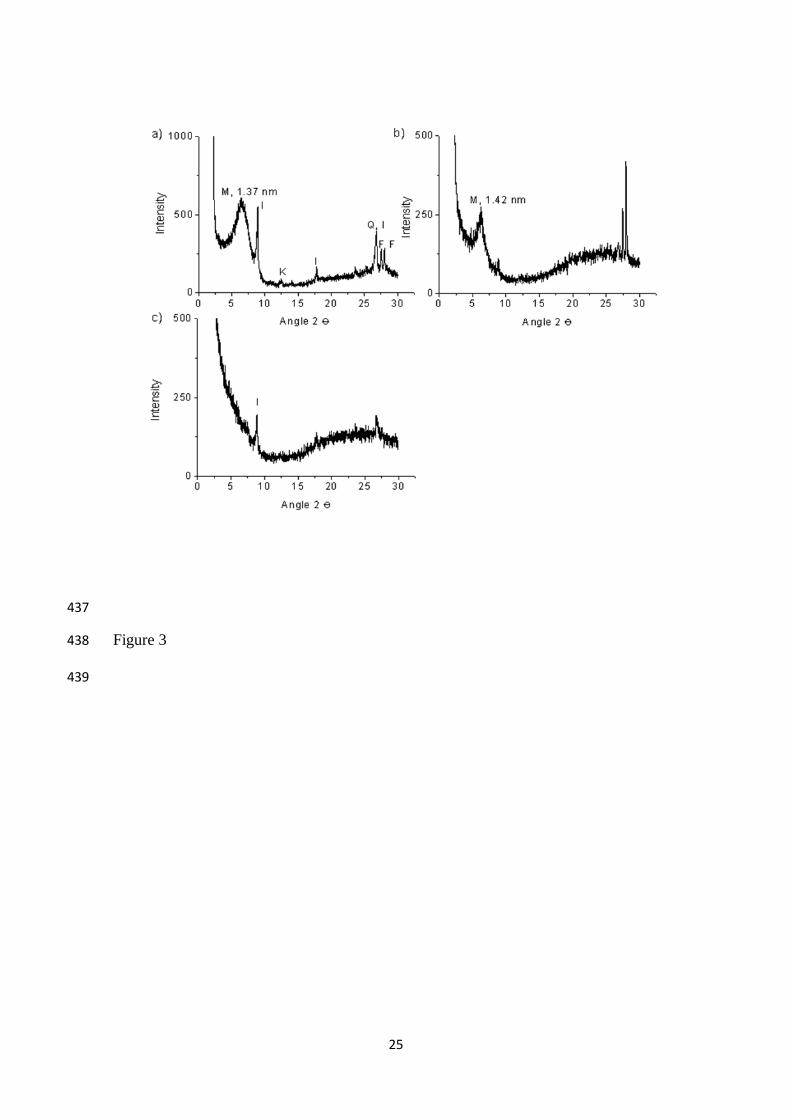
Evidence for these conformations of the polycation molecules on the clay surface was 235
supported by XRD (Fig. 3). The clay itself showed the typical diffraction of 236
montmorillonite (M), but some impurities were detected due to illite (I), kaolinite (K), 237
quartz (Q), and feldspars (F). The peak at 1.37 nm is typical of montmorillonite in its 238
11
sodium form with two layers of water of hydration. Sorption of polymers P1 and P2 at 239
high loading showed in both cases an increase in the basal spacing up to 1.42 nm (Fig. 240
3b). This value is in agreement with polymer sorption by forming a flat layer, because 241
the thickness of dextran polymers which are analogous to starch polymers (mainly 242
constituted by glucopyranose molecules) is about 0.5 nm [19], which by addition of the 243
thickness of a clay platelet (0.96 nm) gives a basal spacing around 1.46 nm. Similarly, 244
basal spacings of about 1.5 nm have been reported for other polymers adsorbing on clay 245
minerals as flat layers [24]. 246
With P3, the XRD analysis of the clay-polymer complexes showed the absence of the 247
diffraction peak associated to montmorillonite (Fig. 3c) even at low diffraction angles 248
(not shown), indicating a loop-and-train conformation on the clay surface that yielded 249
basal spacing out of the range of XRD detection. This is also taken as evidence of 250
exfoliation of the clay platelets after interaction with the polycation molecules [25]. 251
Clay-composites were prepared at lower polymer/clay ratios aiming at increasing the 252
amount of polymer adsorbed. A clay concentration of 4.25 g/L was used; the amounts 253
of polymer added were 10 g/L for P1 and P3, and 5 g/L for P2. The estimated sorbed 254
amounts for these ratios were quite close for P2 and P1 (0.40 and 0.45 g polymer/g clay, 255
respectively), and 1.12 g polymer/ g clay for P3. These values are in accord with the 256
predictions by theoretical sorption models where the total adsorbed amount of the solute 257
should increase when raising the clay concentration but the amount adsorbed per clay 258
platelet decreases [26]. However, polymer sorption increased instead of decreasing as 259
expected, from 0.57 to 0.80 g polymer/g clay for P1 and from 0.35 to 0.68 g polymer/g 260
clay for P2. The total adsorbed amount for P3 slightly decreased (from 1.78 to 1.72 g 261
polymer/g clay).Our tentative explanation for the above pattern is that increasing the 262
12
clay concentration decreases the polymer fraction available for self-aggregation and 263
enhances the polymer sorption onto the clay. 264
265
3.2. Determination of bactericidal effects of clay-polymer composites. 266
The bactericidal effects of the clay-polymer complexes on bacteria in suspension was 267
examined as a function of the amount of polymer sorbed by the clay, the conformation 268
of the polymer on the clay platelets, and the surface charge characteristics of the 269
complex. (Table 1). 270
Initially, 105 CFU/mL of E. coli were present in solution in the bactericidal tests. As a 271
control, raw clay was used and no bactericidal effect was noticed (data not shown); 272
whereas no free bacteria were observed when using the complexes P1/10/4.25 and 273
P2/5/4.25. This was not only a function of the positive external surface potential which 274
is needed for adhesion of the bacteria, because the sorption of bacteria by the complex 275
P1/5/1.6 was less efficient despite its identical zeta potential. 276
The concentration of cationic monomers of the polymer over that needed for inducing 277
charge reversal was a critical parameter. The P1/5/1.6 complex reduced only two orders 278
of magnitude the initial amount of added bacteria, whereas an increase by +0.33 279
mmolc/g polymer in the case of P2/5/4.25 (lines 3,4 in Table 1), enabled to reach the 280
critical concentration needed for complete removal. 281
The influence of the conformation adopted by the polycation on the removal of bacteria 282
was also examined. The activity of the complex P2/1.5/1.6 with a layer flat 283
conformation of the polycation on the clay surface, was one order of magnitude larger 284
than that of the complex P3/10/4.25, where the polymer molecules had a loop-and-train 285
conformation. Both complexes exhibited the same z-potential, but the amount of 286
adsorbed polymer and the corresponding monomer concentration exceeding that needed 287
13
for reaching the zero zeta potential of the clay was about 5-fold larger for the complex 288
P3/10/4.25. In accord, its capacity for removal of bacteria from water was lower, which 289
was due to the fact that in a loop-and-train conformation the positive charges of polymer 290
segments extending into the solution are also partly screened by hydrophobic segments 291
impeding a closer interaction of the cationic groups with the bacterial cell surface. 292
The target site of quaternary ammonium polymers was reported to be the cytoplasmic 293
membrane [27]. The positive charge of the polycation apparently impairs the stability of 294
the cell wall of negatively charged bacteria, and also the outer membrane in the Gram 295
negative type. After penetration through the cell wall, the polycation is attracted to the 296
cytoplasmic membrane, increasing its permeability, and yielding bactericidal effect by 297
cell lysis [28]. Similarly to the bactericidal effect exhibited by the free polymers, it 298
might be also interpreted that the polymer -clay composites have bactericidal effect on 299
bacteria. The results in Table 1, which demonstrate a reduction in the number of 300
bacteria in suspension by the presence of a polymer –clay composite can also be simply 301
interpreted by adsorption of the bacteria (which are characterized by a negative external 302
surface) on the positively charged composites. However, Table 1 demonstrates different 303
removal efficiency of bacteria by composites with the same zeta potential. In addition to 304
removal of bacteria from water, the results in Table 1 also indicate that cell death rates 305
on the clay-polymer complexes were high (approximately 90%) with the exception of 306
the P3/10/4.25 complex. These data demonstrate the high sorption efficiency and 307
bactericidal effect of the clay-polymer complexes based on polymers P1 and P2; as 308
opposed to the P3-clay complexes, in which case both extent of bacteria adsorption and 309
killing are about 10%. 310
In the other cases the percent of adsorbed bacteria exceeded 93% and the percent of 311
dead cells exceeded 85% of the total. 312
14
The clay-polymer complexes were more bioactive than the polymers alone (Table S1, 313
Supporting Information). The bactericidal effect was much lower from polymer 314
solutions which included equivalent amounts to those of polymers sorbed in the clay-315
polymer complexes (Table 1). The larger concentration of cationic monomers onto the 316
clay surface was high enough to reach lethal levels for the bacteria. 317
The explanation of the bactericidal mechanism caused by polymer-clay composites is 318
still under discussion [29, 30]. Our results may point to a combined bactericidal effect 319
of the surface potential and the corresponding amount of cationic monomers of the 320
polymer exceeding that for inducing charge reversal of the clay. A positive surface 321
potential on the clay complex promotes adherence of the bacteria followed by direct 322
strong electrostatic interactions that would cause a segregation of negatively charged 323
phospholipids from the cell membranes. A high cationic monomer concentration in the 324
vicinity of phospholipid bilayers will introduce large number of disrupting contact 325
points in the bilayer continuity by intercalation of the hydrated bactericide groups 326
between the negatively charged phospholipid headgroups, impeding their isolating 327
function and further restoration, and yielding cell lysis. 328
329
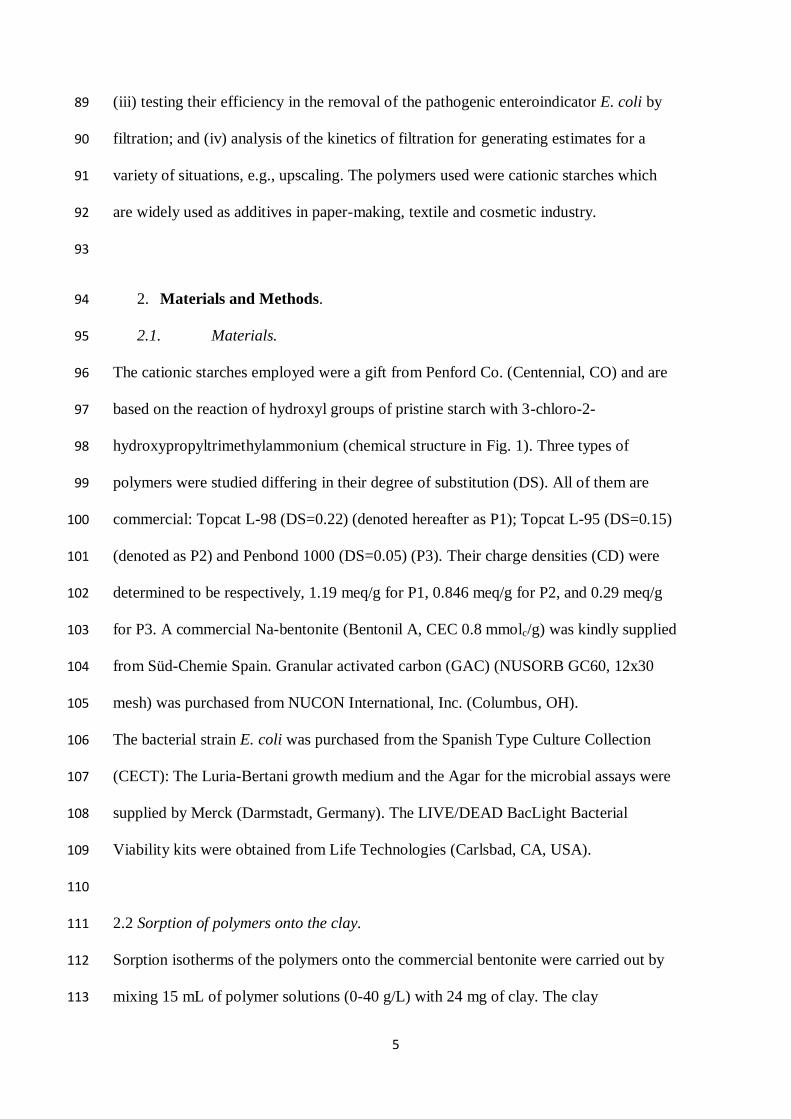
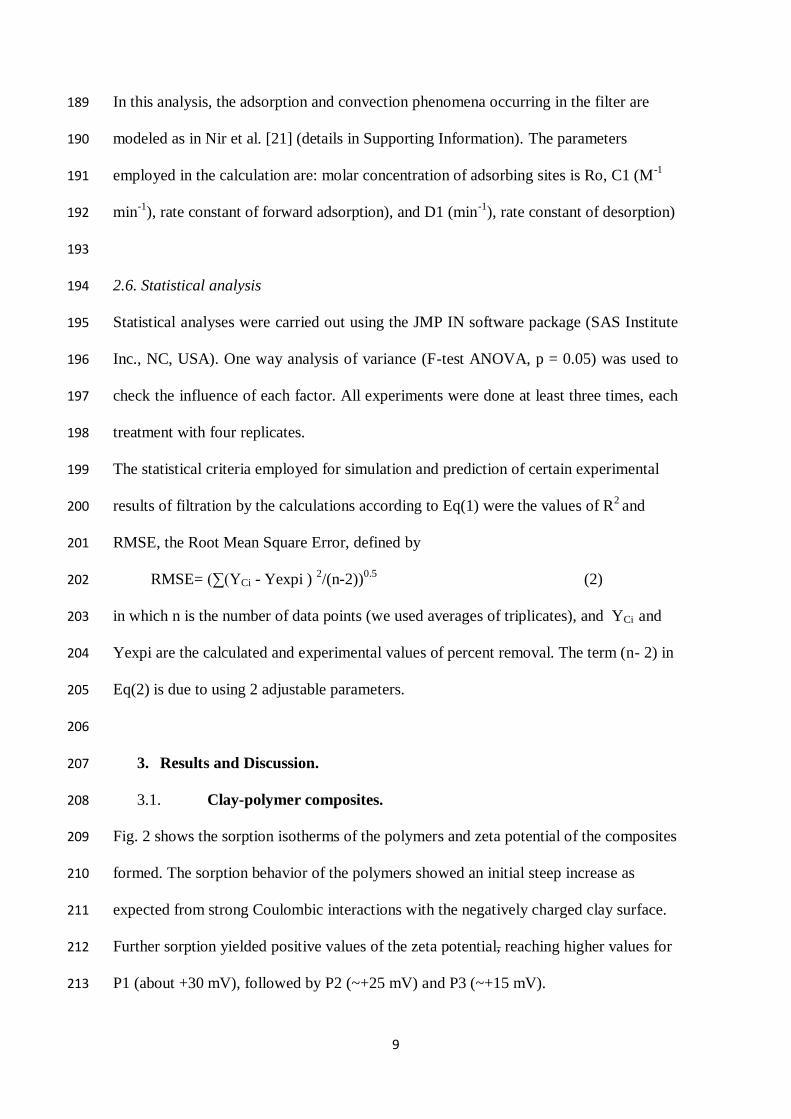
3.3. Filtration of E. coli. 330
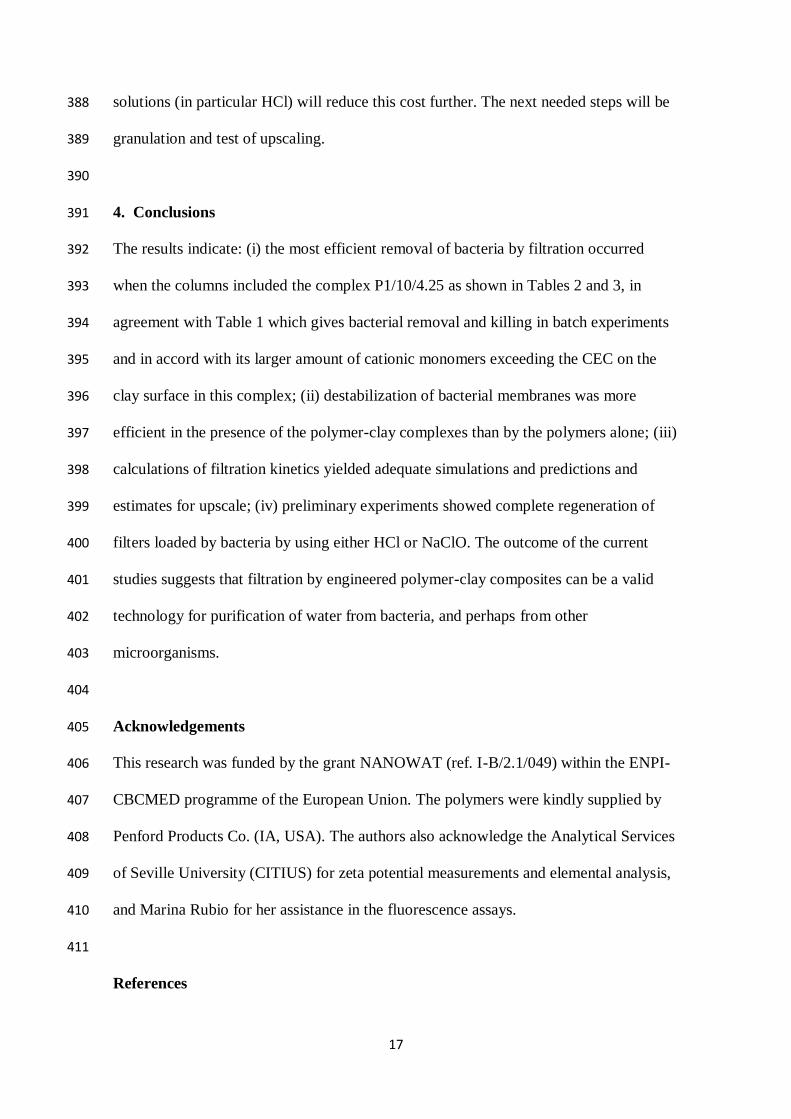
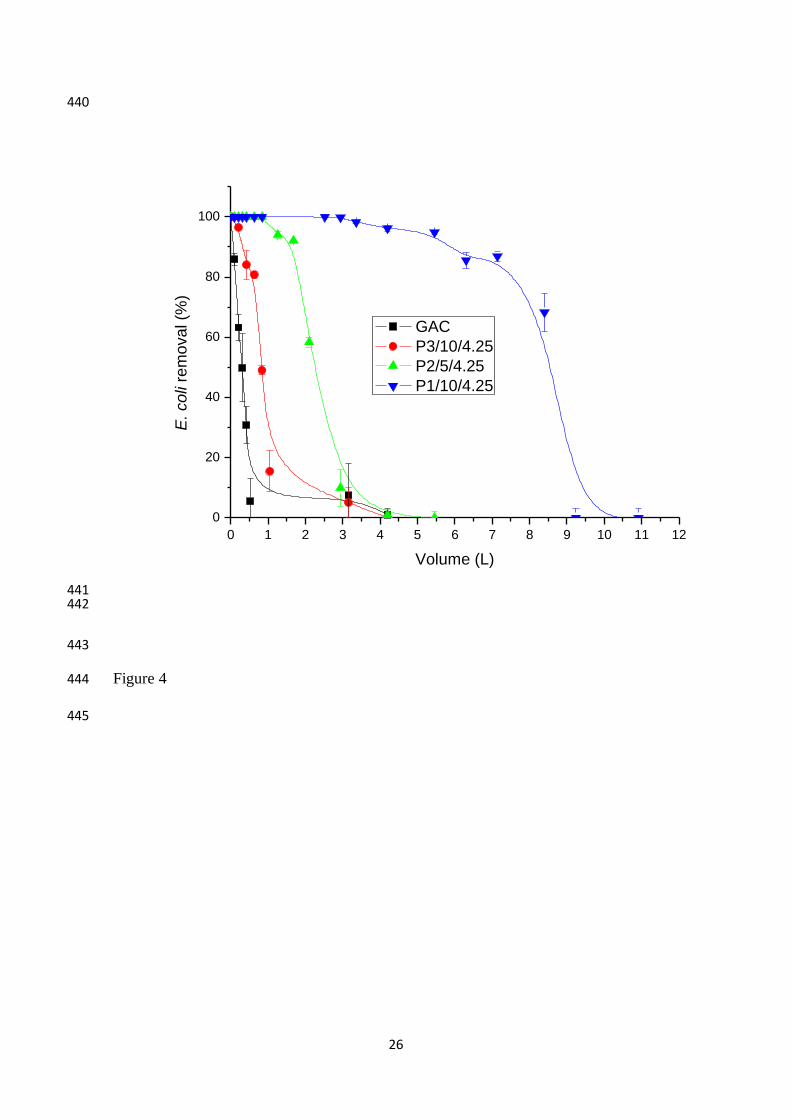
Fig. 4 shows a poor removal of bacteria by filters containing GAC relative to the clay-331
polymer based-filters, especially those containing the polymers P1 and P2. After 0.5 L, 332
the GAC based-filter did not retain E. coli, whereas approximately 80% was retained 333
with the filters containing P3-clay complex and no elution was detected with the other 334
clay-polymer complexes. The bacteria retention in the filters containing the complex 335
P3/10/4.25 was lower than in those based on P1- and P2-clay complexes, in agreement 336
with its poor removal of bacteria in suspension (Table 1). The use of the P1/10/4.25 337
15
complex in the filter improved greatly retention of bacteria compared to P2/5/4.25, 338
which is in agreement with its larger amount of cationic monomers exceeding the CEC 339
on the clay surface, as revealed in the batch experiments. The emergence of minute 340
amounts of bacteria was not detected after the passage of 3 L, i.e., 155 pore volumes 341
larger than with the complex P2/5/4.25. Therefore, the filters based on the complex 342
P1/10/4.25 were the optimal ones for microorganism removal. The performance of 343
filters under different operational parameters, such as the flow rate, and concentration of 344
bacteria added, was investigated and modeled (Tables 2, 3). A comparison of the results 345
in Table 2 (Experiment 3) with those in Table 3 (Experiment 2) demonstrates that a 346
larger volume (5.3 L) could be purified (below the LOD) from bacteria in Experiment 2 347
than in the former (2.5 L) despite the larger number of bacteria per unit volume, (5x10⁵ 348
vs 1.2 105 per mL) in the latter case, corresponding to the condition that filtration was 349
carried out at a smaller flow rate in Experiment 2. 350
351
3.3.1 Regeneration 352
A preliminary study of the feasibility of regeneration of the filter containing P1/10/4.25 353
showed complete regeneration by using either HCl or NaClO. At the end of filtration 354
(Table 2) the fraction of removed bacteria was 70%, whereas after regeneration bacteria 355
were only detected after passing 3L. At that stage the fractions of removed bacteria 356
were 99.8 and 99.9% for the filters regenerated with HCl and NaClO respectively, 357
versus an initial value of 99.7%. These regenerated filters followed the same pattern of 358
bacterial removal as that of the newly used filters; for example, the removal percents 359
were 96.5 and 98.0% after passing 3.4 L when using HCl- and NaClO-regenerated 360
filters, respectively, whereas a similar value (95.6%) was obtained initially. 361
362
16
3.3.2. Modeling and capacity estimates 363
The fitting of the kinetics of filtration to the adsorption-convection model was adequate; 364
therefore, the calculated parameters can be used for prediction under different 365
operational parameters. It is of interest to note that the second filter in series in 366
Experiment 3 (Table 2) enabled to purify the water completely (i.e, below the LOD) 367
from bacteria after 8.4 L, i.e., at a 3-fold larger volume than that by the first filter alone. 368
In Table 3 complete removal of bacteria was achieved after the passage of 5.3 L through 369
the filter which included 1.5 g of complex. If the capacity of the filter is defined by the 370
volume which can be purified from bacteria to less than one particle per 100 mL (from 371
an initial value 5.2 x10⁵ /ml in this case), then this result amounts to a capacity of 3.5 m
3 372
/ kg of composite. Using the same parameters as in Table 3 we calculated the kinetics of 373
filtration for the case of a filter of length 1.6 m, at a flow velocity of 4.9 m/h , and filled 374
with a composite at a 1:5 w/w ratio between the composite and sand. The outcome for 375
the capacity in this case was 12 m3 /kg of composite. For a filter filled exclusively with 376
the composite in a granular form no sand would be needed, and the calculated capacity 377
was 20 m3/kg of composite. Furthermore, the success of regeneration implies that the 378
effective capacity can be significantly larger. The filtration results presented suggest 379
that it may be of interest to test the use of clay-polymer composites in removal of other 380
microorganisms and on a larger scale. 381
In view of the fact that the chosen polymer is relatively inexpensive (€ 9.7/kg) and the 382
clay is rather cheap (€ 0.16/kg), it can follow that the cost of materials of large scale 383
purification of drinking water which includes 100,000. bacteria per mL to less than 1 384
per 100 mL can be less than 0.5 € per cubic meter. In this calculation we tentatively 385
assumed that the preparation of a granulated composite will double the price of raw 386
materials. The success of regeneration by washing the filter with rather inexpensive 387
17
solutions (in particular HCl) will reduce this cost further. The next needed steps will be 388
granulation and test of upscaling. 389
390
4. Conclusions 391
The results indicate: (i) the most efficient removal of bacteria by filtration occurred 392
when the columns included the complex P1/10/4.25 as shown in Tables 2 and 3, in 393
agreement with Table 1 which gives bacterial removal and killing in batch experiments 394
and in accord with its larger amount of cationic monomers exceeding the CEC on the 395
clay surface in this complex; (ii) destabilization of bacterial membranes was more 396
efficient in the presence of the polymer-clay complexes than by the polymers alone; (iii) 397
calculations of filtration kinetics yielded adequate simulations and predictions and 398
estimates for upscale; (iv) preliminary experiments showed complete regeneration of 399
filters loaded by bacteria by using either HCl or NaClO. The outcome of the current 400
studies suggests that filtration by engineered polymer-clay composites can be a valid 401
technology for purification of water from bacteria, and perhaps from other 402
microorganisms. 403
404
Acknowledgements 405
This research was funded by the grant NANOWAT (ref. I-B/2.1/049) within the ENPI-406
CBCMED programme of the European Union. The polymers were kindly supplied by 407
Penford Products Co. (IA, USA). The authors also acknowledge the Analytical Services 408
of Seville University (CITIUS) for zeta potential measurements and elemental analysis, 409
and Marina Rubio for her assistance in the fluorescence assays. 410
411
References
18
[1] M.J. Nieuwenhuijsen, M.B. Toledano, N.E. Eaton, J. Fawell, P. Elliot, Chlorination
disinfection byproducts in water and their association with adverse reproductive
outcomes: a review. Occup. Environ. Med. 57 (2000) 73-85.
[2] J.W.A. Charrois, J.M. Boy, K.L. Froese, S.E. Hrudey, Occurrence of N-
nintrosamines in Alberta public drinking-water distribution systems. J. Environ. Eng.
Sci. 6 (2007) 103-114.
[3] M. Asami, M. Oya, K. Kosaka, A nationwide survey of NDMA in raw and drinking
water in Japan. Sci. Total Environ. 407 (2009) 3540-3545.
[4] T. Bond, J. Huang, M.R. Templeton, N. Graham, Occurrence and control of
nitrogenous disinfection by-products in drinking water-A review. Water Res. 45 (2011)
4341-4354.
[5] N.B. Oncu, I.A. Balcioglu, Antimicrobial contamination removal from
environmentally relevant matrices: A literature review and a comparison of three
processes for drinking water treatments. Ozone-Sci. Eng. 35 (2013) 73-85.
[6] L. Ho, K. Braun, R. Fabris, D. Hoefel, J. Morran, P. Monis, M. Drikas, Comparison
of drinking water treatment process streams for optimal bacteriological water quality.
Water Res. 46 (2012) 3934-3942.
[7] N. Voutchkov, Considerations for selection of seawater filtration pretreatment
system. Desalination 261 (2010) 354-364.
[8] B. Casini, A. Buzzigoli, M.L. Cristina, A.M. Spagnolo, P. del Giudice, S.
Brusaferro, A. Poscia, U. Moscato, P. Valentini, A. Baggiani, G. Privitera, Long-term
effects of hospital water network disinfection on Legionella and other waterborne
bacteria in an Italian University hospital. Infect. Control Hosp. Epidemiol. 35 (2014)
293-299.
[9] T. Guo, J. Englehardt, T. Wu, Review of cost versus scale: water and wastewater
19
treatment and reuse processes. Water Sci. Technol. 69 (2014) 223-234.
[10] J. Lukasik, Y-F. Cheng, F. Lu, M. Tamplin, S.R. Farrah, Removal of
microorganisms from water by columns containing sand coated with ferric and
aluminum hydroxides. Water Res. 33 (1999) 769-777.
[11] D. Schulze-Makuch, R.S. Bowman, S.D. Pillai, H. Guan, Field evaluation of the
effectiveness of surfactant modified zeolite and iron-oxide-coated sand for removing
viruses and bacteria from groundwater. Ground Water Monit. Remediat. 23 (2003) 68-
75.
[12] P. Herrera, R. Burghardt, H.J. Huebner, T.D. Phillips, The efficacy of sand-
immobilized organoclays as filtration bed materials for bacteria. Food Microbiol. 21
(2004) 1-10.
[13] T. Garoma, J. Kocher, Investigation of surfactant-modified activated carbon for
recycled water disinfection. Water Sci. Technol. 62 (2010) 1755-1766.
[14] A. Shtarker-Sasi, S. Castro-Sowinski, O. Matan, S. Nir, Y. Okon, A. Nasser,
Removal of bacteria and Cryptosporidium from water by micelle-clay complexes.
Desalin. Water Treat. 51 (2013) 7672-7680.
[15] E-R. Kenawy, S.D. Worley, R. Broughton, The chemistry and applications of
antimicrobial polymers: a state-of-the-art review. Biomacromolecules 8 (2007) 1359-
1384.
[16] T. Tashiro, Removal of Escherichia coli from water by systems based on
polystyrene-G-amines and poly(glycidyl methacrylate)-G-amines. Macromol. Chem.
Phys. 207 (1993) 31-41.
[17] A.E. Madkour, J.M. Dabkowski, K. Nusslein, G.N. Tew, Fast disinfecting
antimicrobial surfaces. Langmuir 25 (2009) 1060-1067.
[18] S.Z. Tan, G. Li, J. Shen, Y. Liu, M. Zong, Study of modified polypropylene
20
nonwoven cloth. II. Antibacterial activity of modified polypropylene nonwoven cloths.
J. Appl. Polym. Sci. 77 (2000) 1869-1876.
[19] B.K.G. Theng, Formation and Properties of Clay-Polymer Complexes, 2nd
edition, Elsevier, Amsterdam, The Netherlands. 2012.
[20] B. Bolto, J. Gregory, Organic polyelectrolytes in water treatment. Water Res. 41
(2007) 2301-2324.
[21] S. Nir, D. Zadaka-Amir, A. Kartaginer, Y. Gonen, Simulation of adsorption and
flow of pollutants in a column filter: Application to micelle-montmorillonite mixtures
with sand. Appl. Clay Sci. 67-68 (2012) 134-140.
[22] P.M. Claesson, E. Poptoshev, E. Blomberg, A. Dedinaite, Polyelectrolyte-
mediated surface interactions. Adv. Colloid Interface Sci. 114-115 (2005) 173-187.
[23] O. Rojas, M. Ernstsson, R.D. Neumann, P.M. Claesson, Effect of polyelectrolyte
charge density on the adsorption and desorption behavior on mica. Langmuir 18 (2002)
1604-1612.
[24] G.J. Churchman, Formation of complexes between bentonite and different cationic
polyelectrolytes and their use as sorbents for non-ionic and anionic pollutants. Appl.
Clay Sci. 21 (2002) 177-189.
[25] P.C. LeBaron, Z. Wang, T.J. Pinnavaia, Polymer-layered silicate nanocomposite;
an overview. Appl. Clay Sci. 15 (1999) 11-29.
[26] S. Nir, D. Hirsch, J. Navrot, A. Banin, Specific adsorption of lithium, sodium,
potassium, and strontium to montmorillonite: observations and predictions. Soil Sci.
Soc. Am. J. 50 (1986) 40-45.
[27] T. Tashiro, Antibacterial and bacterium adsorbing macromolecules. Macromol.
Mater. Eng. 286 (2001) 63-87.
[28] L. Timofeeva, N. Kleshcheva, Antimicrobial polymers: mechanism of action,
21
factors of activity, and applications. Appl. Microbiol. Biotechnol. 89 (2011) 475-492.
[29] R. Kugler, O. Bouloussa, F. Rondelez, Evidence of a charge-density threshold for
optimum efficiency of biocial cationic surfaces. Microbiology, 151 (2005) 1341-1348,
2005.
[30] F. Siedenbiedel, J.C. Tiller, Antimicrobial polymers in solution and on surfaces:
Overview and functional principles. Polymers 4 (2012) 46-71.
412
22
Figure captions 413
Fig.1. Chemical basic structure of the cationic starches. 414
Fig. 2. Polymer adsorption (open symbols) and z-potential (full symbols) of the 415
complexes formed after sorption on bentonite of P1 (a), P2 (b) and P3 (c), as a function 416
of the added amount of the polymer. 417
Fig. 3. Fig. 3. X-ray diffraction of the bentonite (a) and polymer-clay complexes at the 418
maximal loading from the sorption isotherms: 0.9 and 0.6 g/ g clay for P1 and P2 419
respectively (b) and 1.73 g/g clay for P3 (c). 420
Fig. 4. Removal of E. coli by filtration with columns including GAC, or polymer-clay 421
complexes mixed with sand (1:100 w/w) (Experiment 1). 422
423
23
424
425
426
O
H
H
HO
H
H
OHO
OH
O
H
HO
H
O
H
H
OHHO
OH
OH
N
427
428
Figure 1 429
430
24
431
0 4 8 12 16 20 24 28 320,0
0,2
0,4
0,6
0,8
1,0
Polymer added (g/L)
Po
lym
er
ad
so
rbe
d (
g/g
cla
y)
a)
P1
-30
-20
-10
0
10
20
30
40
Z-p
ote
ntia
l
432
0 4 8 12 16 20 24 28 320,0
0,2
0,4
0,6
0,8
1,0
Polymer added (g/L)
Po
lym
er
ad
so
rbe
d (
g/g
cla
y)
b)
P2-30
-20
-10
0
10
20
30
40
Z-p
ote
ntia
l
433
0 5 10 15 20 25 30 35 40 450,0
0,2
0,4
0,6
0,8
1,0
1,2
1,4
1,6
1,8
2,0
Polymer added (g/L)
Po
lym
er
ad
so
rbe
d (
g/g
cla
y)
c)
P3-30
-20
-10
0
10
20
30
40
Z-p
ote
ntia
l
434
Figure 2 435
436
25
437
Figure 3 438
439
26
440
0 1 2 3 4 5 6 7 8 9 10 11 12
0
20
40
60
80
100
E. co
li re
mo
va
l (%
)
Volume (L)
GAC
P3/10/4.25
P2/5/4.25
P1/10/4.25
441 442
443
Figure 4 444
445
27
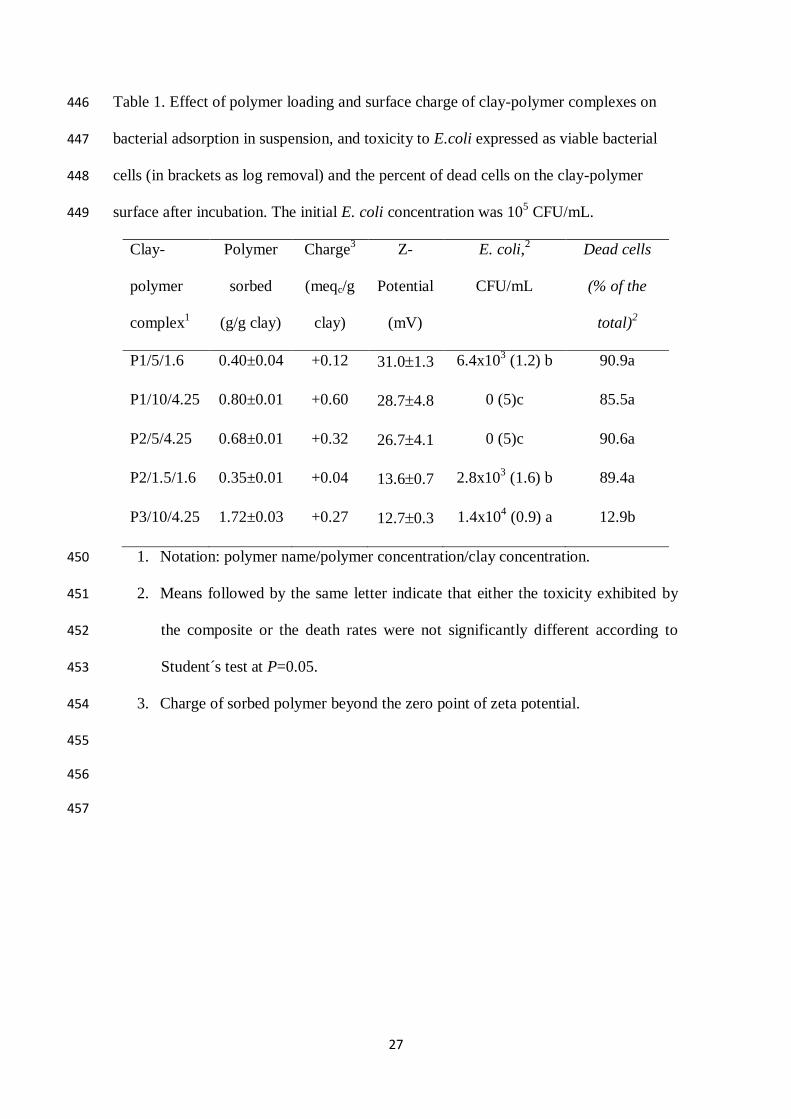
Table 1. Effect of polymer loading and surface charge of clay-polymer complexes on 446
bacterial adsorption in suspension, and toxicity to E.coli expressed as viable bacterial 447
cells (in brackets as log removal) and the percent of dead cells on the clay-polymer 448
surface after incubation. The initial E. coli concentration was 105 CFU/mL. 449
Clay-
polymer
complex1
Polymer
sorbed
(g/g clay)
Charge3
(meqc/g
clay)
Z-
Potential
(mV)
E. coli,2
CFU/mL
Dead cells
(% of the
total)2
P1/5/1.6 0.40±0.04 +0.12 31.01.3 6.4x10³ (1.2) b 90.9a
P1/10/4.25 0.80±0.01 +0.60 28.74.8 0 (5)c 85.5a
P2/5/4.25 0.68±0.01 +0.32 26.74.1 0 (5)c 90.6a
P2/1.5/1.6 0.35±0.01 +0.04 13.60.7 2.8x10³ (1.6) b 89.4a
P3/10/4.25 1.72±0.03 +0.27 12.70.3 1.4x10⁴ (0.9) a 12.9b
1. Notation: polymer name/polymer concentration/clay concentration. 450
2. Means followed by the same letter indicate that either the toxicity exhibited by 451
the composite or the death rates were not significantly different according to 452
Student´s test at P=0.05. 453
3. Charge of sorbed polymer beyond the zero point of zeta potential. 454
455
456
457
28
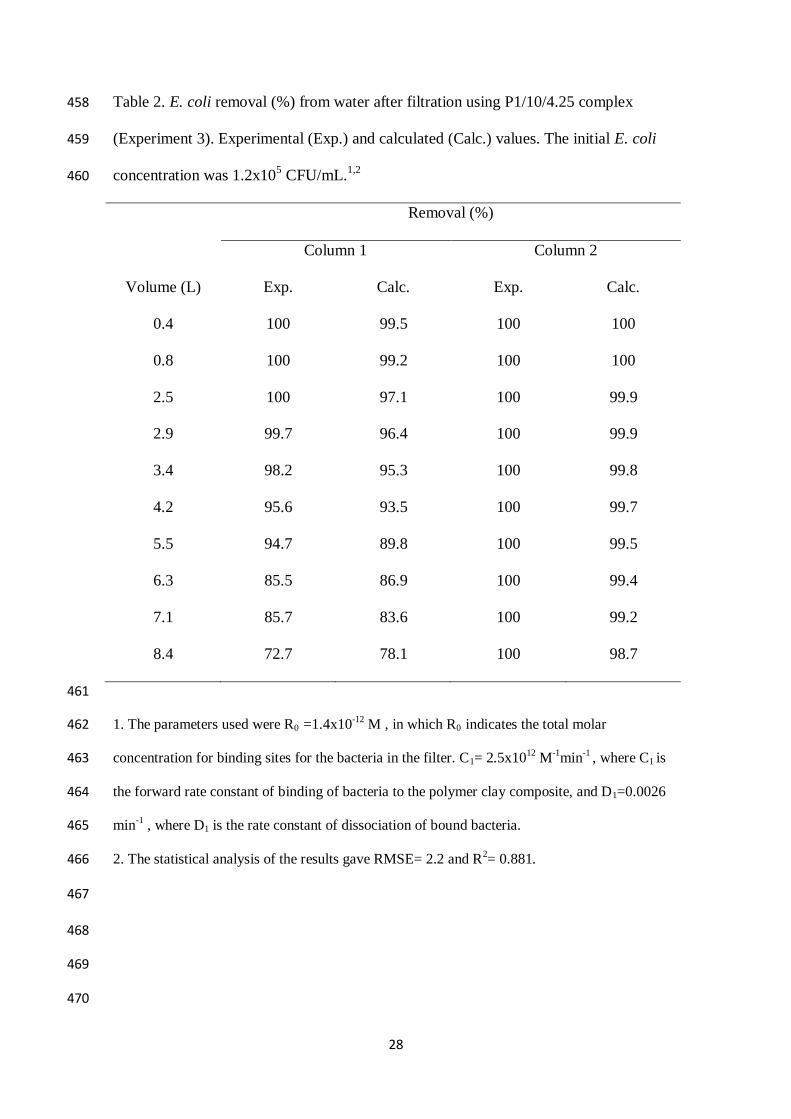
Table 2. E. coli removal (%) from water after filtration using P1/10/4.25 complex 458
(Experiment 3). Experimental (Exp.) and calculated (Calc.) values. The initial E. coli 459
concentration was 1.2x10⁵ CFU/mL.
1,2 460
Removal (%)
Column 1 Column 2
Volume (L) Exp. Calc. Exp. Calc.
0.4 100 99.5 100 100
0.8 100 99.2 100 100
2.5 100 97.1 100 99.9
2.9 99.7 96.4 100 99.9
3.4 98.2 95.3 100 99.8
4.2 95.6 93.5 100 99.7
5.5 94.7 89.8 100 99.5
6.3 85.5 86.9 100 99.4
7.1 85.7 83.6 100 99.2
8.4 72.7 78.1 100 98.7
461
1. The parameters used were R0 =1.4x10⁻¹²
M , in which R0 indicates the total molar 462
concentration for binding sites for the bacteria in the filter. C1= 2.5x10¹²
M-1
min-1
, where C1 is 463
the forward rate constant of binding of bacteria to the polymer clay composite, and D1=0.0026 464
min-1
, where D1 is the rate constant of dissociation of bound bacteria. 465
2. The statistical analysis of the results gave RMSE= 2.2 and R2= 0.881. 466
467
468
469
470
29
471
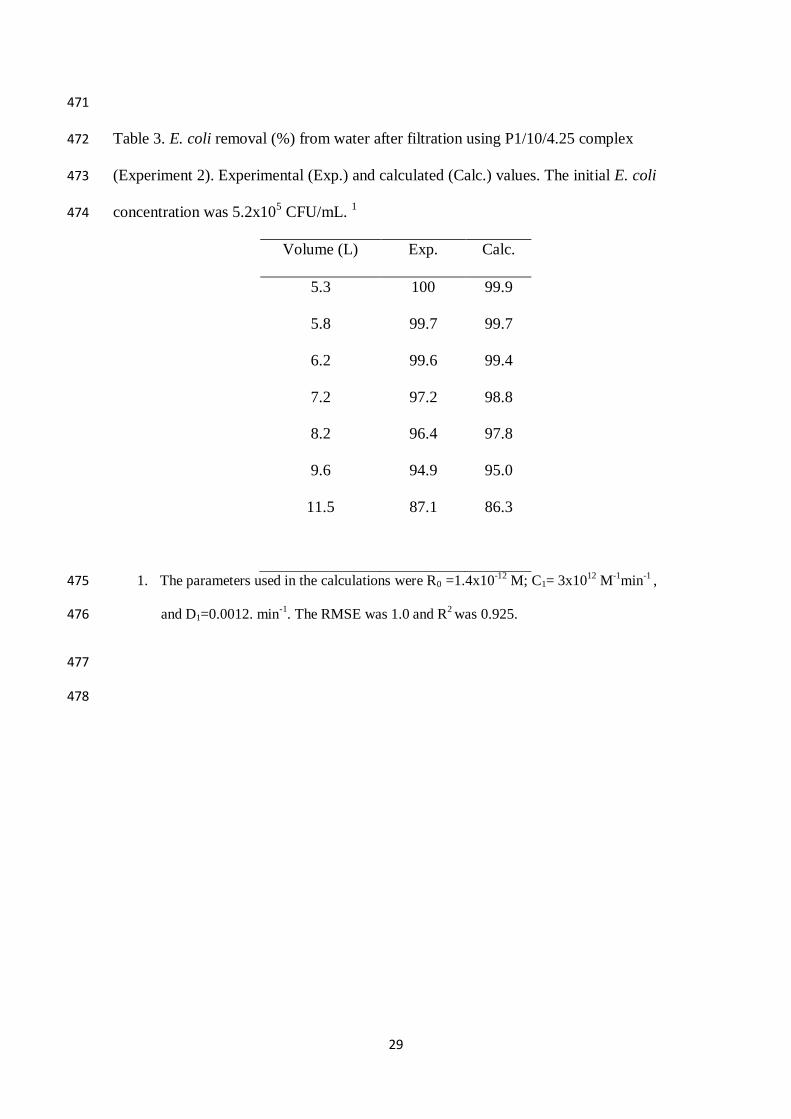
Table 3. E. coli removal (%) from water after filtration using P1/10/4.25 complex 472
(Experiment 2). Experimental (Exp.) and calculated (Calc.) values. The initial E. coli 473
concentration was 5.2x10⁵ CFU/mL.
1 474
Volume (L) Exp. Calc.
5.3 100 99.9
5.8 99.7 99.7
6.2 99.6 99.4
7.2 97.2 98.8
8.2 96.4 97.8
9.6 94.9 95.0
11.5 87.1 86.3
1. The parameters used in the calculations were R0 =1.4x10⁻¹²
M; C1= 3x10¹²
M-1
min-1
, 475
and D1=0.0012. min-1
. The RMSE was 1.0 and R2 was 0.925. 476
477
478
30
Supporting information 479
480
481
482
REMOVAL OF WATERBORNE MICROORGANISMS BY FILTRATION 483
USING CLAY-POLYMER COMPLEXES 484
485
TOMAS UNDABEYTIA*†
, ROSA POSADA†, SHLOMO NIR
‡, IRENE GALINDO
†, 486
LEONILA LAIZ†, CESAREO SAIZ-JIMENEZ
†, ESMERALDA MORILLO
† 487
488
(†). Institute of Natural Resources and Agrobiology, IRNAS-CSIC, P. O. Box 1052, 489
41080 Seville, Spain. 490
(‡).The Robert H. Smith Faculty of Agriculture, Food and Environment, Hebrew 491
University of Jerusalem, Rehovot 76100, Israel. 492
493
494
*Corresponding author; phone: +34-954624711; fax: +34-954624002, e-mail: 495
497
31
498
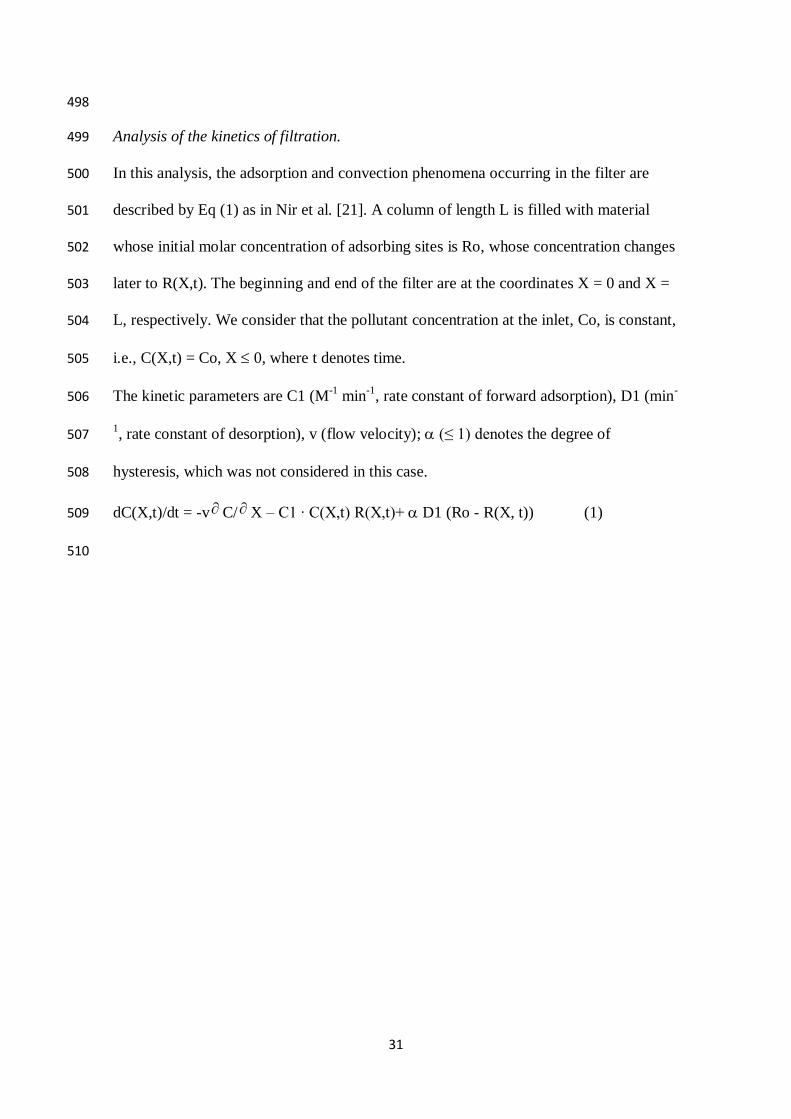
Analysis of the kinetics of filtration. 499
In this analysis, the adsorption and convection phenomena occurring in the filter are 500
described by Eq (1) as in Nir et al. [21]. A column of length L is filled with material 501
whose initial molar concentration of adsorbing sites is Ro, whose concentration changes 502
later to R(X,t). The beginning and end of the filter are at the coordinates X = 0 and X = 503
L, respectively. We consider that the pollutant concentration at the inlet, Co, is constant, 504
i.e., C(X,t) = Co, X 0, where t denotes time. 505
The kinetic parameters are C1 (M-1
min-1
, rate constant of forward adsorption), D1 (min-
506
1, rate constant of desorption), v (flow velocity); (≤ 1) denotes the degree of 507
hysteresis, which was not considered in this case. 508
dC(X,t)/dt = -v C/ X – C1 ∙ C(X,t) R(X,t)+ D1 (Ro - R(X, t)) (1) 509
510
32
511
512
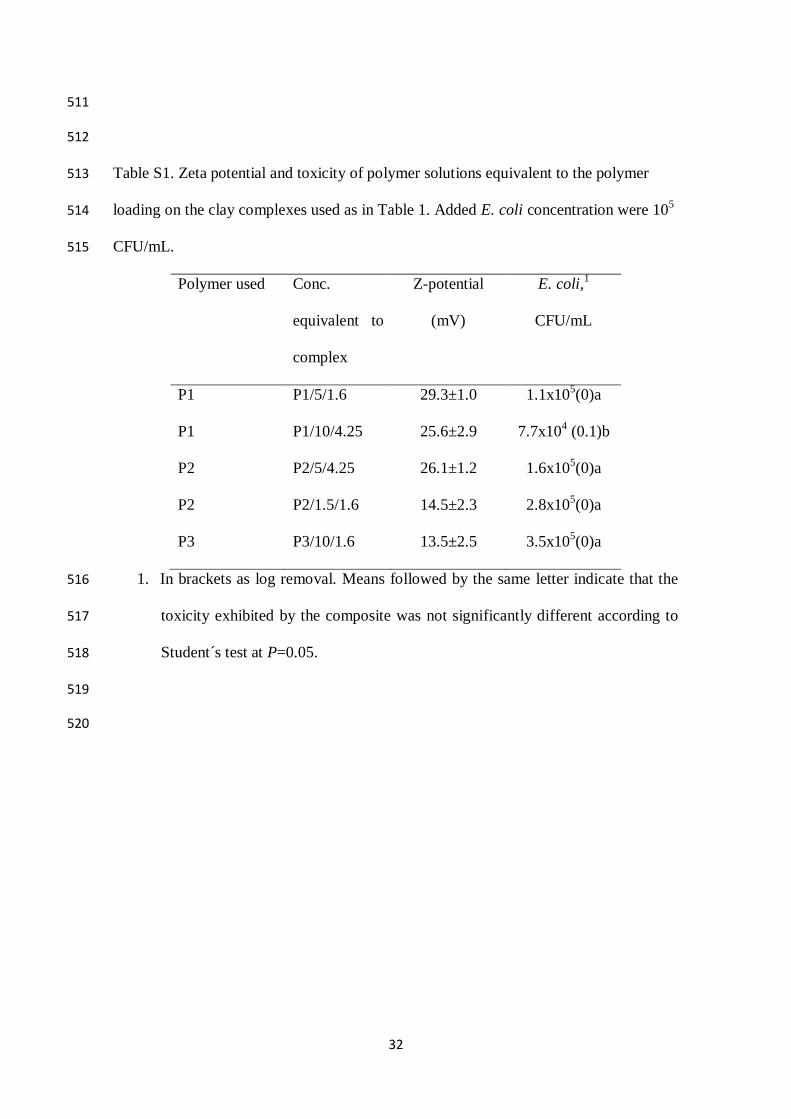
Table S1. Zeta potential and toxicity of polymer solutions equivalent to the polymer 513
loading on the clay complexes used as in Table 1. Added E. coli concentration were 105 514
CFU/mL. 515
Polymer used Conc.
equivalent to
complex
Z-potential
(mV)
E. coli,1
CFU/mL
P1 P1/5/1.6 29.3±1.0 1.1x10⁵(0)a
P1 P1/10/4.25 25.6±2.9 7.7x10⁴ (0.1)b
P2 P2/5/4.25 26.1±1.2 1.6x10⁵(0)a
P2 P2/1.5/1.6 14.5±2.3 2.8x10⁵(0)a
P3 P3/10/1.6 13.5±2.5 3.5x10⁵(0)a
1. In brackets as log removal. Means followed by the same letter indicate that the 516
toxicity exhibited by the composite was not significantly different according to 517
Student´s test at P=0.05. 518
519
520


![Ch 9 Microorganisms Tc[1]](https://img.pdfslide.tips/doc/110x75/577d1e0f1a28ab4e1e8da701/ch-9-microorganisms-tc1.jpg)