Embed Size (px)
DESCRIPTION
asfvcvvb
Citation preview
Scripta Materialia 113 (2016) 27–30
Contents lists available at ScienceDirect
Scripta Materialia
j ourna l homepage: www.e lsev ie r .com/ locate /smm
Features of cubic and tetragonal structures of U–Mo alloys:Atomistic simulation
S.V. Starikov ⁎, L.N. KolotovaJoint Institute for High Temperatures, Russian Academy of Sciences, Moscow 125412, RussiaMoscow Institute of Physics and Technology (State University), Dolgoprudny 141700, Russia
⁎ Corresponding author at: Joint Institute for High TemSciences, Moscow 125412, Russia.
E-mail address: [email protected] (S.V. Starikov).
http://dx.doi.org/10.1016/j.scriptamat.2015.10.0121359-6462/© 2015 Elsevier Ltd. All rights reserved.
a b s t r a c t
a r t i c l e i n f oArticle history:Received 15 August 2015Received in revised form 2 October 2015Accepted 6 October 2015Available online 21 October 2015
Keywords:UraniumAlloyAtomistic simulationPhase transition
Using molecular dynamics simulations, we study the structural properties of body-centered cubic (BCC) andbody-centered tetragonal (BCT) phases of U–Mo alloys. The local positions of uranium atoms in the BCC phasecorrespond to the BCT structure. Thus, the BCC lattice exhibits cubic symmetry only on the scale of severalinteratomic spacings, and it is therefore more correct to denote the high-temperature state of U–Mo alloys asquasi-BCC. This structural feature occurs for pure uranium aswell. This fact is the possible origin of the difficultiesencountered in the description of the BCC phase of pure uranium by ab initiomethods.
© 2015 Elsevier Ltd. All rights reserved.
Uranium is the main component in nuclear fuel. Pure uraniumis found in three crystal phases: a low-temperature orthorhombicα-phase, a high-temperature tetragonal β-phase and a body-centeredcubic (BCC) γ-phase, which exists at higher temperatures [1,2]. TheBCC γ-phase exhibits themost useful properties for nuclear engineering.Unfortunately, this phase is unstable at room temperature. It has beenshown that alloying U with Mo stabilizes BCC-like structures at lowtemperatures [3–6], but the details of such procedures are still underinvestigation [7,8].
A description of BCC γ-U by ab initio methods is another openquestion in studies of U materials [9–11]. Ab initio calculations haveshown that this phase is highly mechanically unstable. This structuralinstability can be found by calculation of the elastic constants [10,12]and simulation of point defect behavior [13,14]. The reason for theinstability is currently unclear. It is important to note that while self-consistent ab initio lattice dynamics enable investigations of the elasticproperties of the BCC-phase at high temperatures [11], lattice defectstability still remains an open question.
Another important finding of ab initio calculations of uranium is theenergetic hierarchy of the structures. The calculations predict theexistence of a body-centered tetragonal (BCT) structure that is morestable than the BCC lattice [15,2,16]. However, experiments on pureuranium have not observed the predicted BCT phase. Conversely, theBCT phase is observed in the experiments on the U–Mo alloy [7].
peratures, Russian Academy of
Molecular dynamics simulation is a powerful tool for the study ofphysical properties of matter at the atomistic level [17–21]. In thiswork, we study the structure of U–Mo alloys usingmolecular dynamicssimulations with a novel interatomic potential [22,23]. This potentialcontains an angular-dependent term and was parameterized on thebasis of ab initio calculations (in the framework of density functionaltheory) using the force-matching method [24,25]. It should be notedthat the potential reproduces the properties of the γ-phase ratherwell and helps to explain the anomalously fast self-diffusionobserved in pure uranium at high temperatures [22]. This findingdemonstrates that pure uranium is accurately described by ab initiocalculations. Clearly, the problem of the instability of the uraniumγ-phase in ab initio simulations is not related to the insufficientprecision of the theoretical model.
All calculations in thisworkwere carried out using the LAMMPS code[26]. The AtomEye code is used for visualization of atomic dynamics[27]. The simulation cell has the following size: 50α0 × 50α0 × 50α0,where α0 is the lattice parameter of BCC (or BCT) structure. We usethe Langevin thermostat and Nose–Hoover barostat to control thetemperature T andpressure P, respectively. Nevertheless, a large fractionof the calculations were performed in the NVE-ensemble in order toobtain the statistics in the equilibrium state.
We first obtained the atomistic model for the BCC structure of U–Moalloy. Here, two different approaches were used: (1) cooling from theliquid state with crystallization and (2) random distribution of theatoms (U and Mo) in the BCC lattice. Both methods were accompaniedby a variation of the simulation cell size in order to achieve zeropressure in all directions (Pxx = Pyy = Pzz = 0). Nevertheless, wefound that a martensitic phase transformation occurs at low T and a
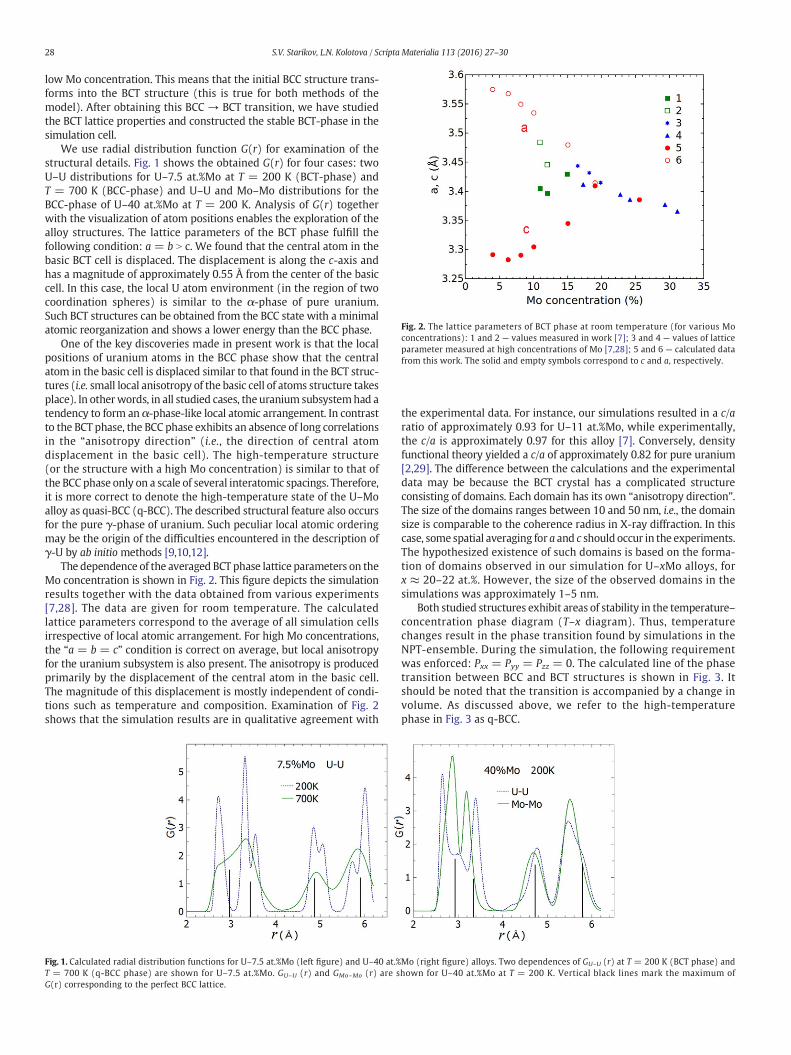
Fig. 2. The lattice parameters of BCT phase at room temperature (for various Moconcentrations): 1 and 2 — values measured in work [7]; 3 and 4 — values of latticeparameter measured at high concentrations of Mo [7,28]; 5 and 6 — calculated datafrom this work. The solid and empty symbols correspond to c and a, respectively.
28 S.V. Starikov, L.N. Kolotova / Scripta Materialia 113 (2016) 27–30
low Mo concentration. This means that the initial BCC structure trans-forms into the BCT structure (this is true for both methods of themodel). After obtaining this BCC → BCT transition, we have studiedthe BCT lattice properties and constructed the stable BCT-phase in thesimulation cell.
We use radial distribution function G(r) for examination of thestructural details. Fig. 1 shows the obtained G(r) for four cases: twoU–U distributions for U–7.5 at.%Mo at T = 200 K (BCT-phase) andT = 700 K (BCC-phase) and U–U and Mo–Mo distributions for theBCC-phase of U–40 at.%Mo at T = 200 K. Analysis of G(r) togetherwith the visualization of atom positions enables the exploration of thealloy structures. The lattice parameters of the BCT phase fulfill thefollowing condition: a = b N c. We found that the central atom in thebasic BCT cell is displaced. The displacement is along the c-axis andhas a magnitude of approximately 0.55 Å from the center of the basiccell. In this case, the local U atom environment (in the region of twocoordination spheres) is similar to the α-phase of pure uranium.Such BCT structures can be obtained from the BCC state with a minimalatomic reorganization and shows a lower energy than the BCC phase.
One of the key discoveries made in present work is that the localpositions of uranium atoms in the BCC phase show that the centralatom in the basic cell is displaced similar to that found in the BCT struc-tures (i.e. small local anisotropy of the basic cell of atoms structure takesplace). In otherwords, in all studied cases, the uranium subsystemhad atendency to form an α-phase-like local atomic arrangement. In contrastto the BCT phase, the BCC phase exhibits an absence of long correlationsin the “anisotropy direction” (i.e., the direction of central atomdisplacement in the basic cell). The high-temperature structure(or the structure with a high Mo concentration) is similar to that ofthe BCC phase only on a scale of several interatomic spacings. Therefore,it is more correct to denote the high-temperature state of the U–Moalloy as quasi-BCC (q-BCC). The described structural feature also occursfor the pure γ-phase of uranium. Such peculiar local atomic orderingmay be the origin of the difficulties encountered in the description ofγ-U by ab initiomethods [9,10,12].
The dependence of the averaged BCT phase lattice parameters on theMo concentration is shown in Fig. 2. This figure depicts the simulationresults together with the data obtained from various experiments[7,28]. The data are given for room temperature. The calculatedlattice parameters correspond to the average of all simulation cellsirrespective of local atomic arrangement. For high Mo concentrations,the “a = b = c” condition is correct on average, but local anisotropyfor the uranium subsystem is also present. The anisotropy is producedprimarily by the displacement of the central atom in the basic cell.The magnitude of this displacement is mostly independent of condi-tions such as temperature and composition. Examination of Fig. 2shows that the simulation results are in qualitative agreement with
Fig. 1. Calculated radial distribution functions for U–7.5 at.%Mo (left figure) and U–40 at.%T = 700 K (q-BCC phase) are shown for U–7.5 at.%Mo. GU–U (r) and GMo–Mo (r) are sG(r) corresponding to the perfect BCC lattice.
the experimental data. For instance, our simulations resulted in a c/aratio of approximately 0.93 for U–11 at.%Mo, while experimentally,the c/a is approximately 0.97 for this alloy [7]. Conversely, densityfunctional theory yielded a c/a of approximately 0.82 for pure uranium[2,29]. The difference between the calculations and the experimentaldata may be because the BCT crystal has a complicated structureconsisting of domains. Each domain has its own “anisotropy direction”.The size of the domains ranges between 10 and 50 nm, i.e., the domainsize is comparable to the coherence radius in X-ray diffraction. In thiscase, some spatial averaging for a and c should occur in the experiments.The hypothesized existence of such domains is based on the forma-tion of domains observed in our simulation for U–xMo alloys, forx ≈ 20–22 at.%. However, the size of the observed domains in thesimulations was approximately 1–5 nm.
Both studied structures exhibit areas of stability in the temperature–concentration phase diagram (T–x diagram). Thus, temperaturechanges result in the phase transition found by simulations in theNPT-ensemble. During the simulation, the following requirementwas enforced: Pxx = Pyy = Pzz = 0. The calculated line of the phasetransition between BCC and BCT structures is shown in Fig. 3. Itshould be noted that the transition is accompanied by a change involume. As discussed above, we refer to the high-temperaturephase in Fig. 3 as q-BCC.
Mo (right figure) alloys. Two dependences of GU–U (r) at T = 200 K (BCT phase) andhown for U–40 at.%Mo at T = 200 K. Vertical black lines mark the maximum of

Fig. 3. Calculated line on T–x diagram for BCT→ q-BCC transition.
29S.V. Starikov, L.N. Kolotova / Scripta Materialia 113 (2016) 27–30
Mechanical hysteresis of the BCT phase is another peculiarity ofU–Mo alloy observed in the simulations. A summary of the relevantdata is presented in Fig. 4. Such hysteresis is most pronounced forU–xMo alloys with x ≈ 20–22 at.%. For these alloys, the c/a ratio isapproximately 0.98. This difference between the lattice parametersleads to the formation of small domains with various “anisotropy di-rections”. It is possible that such domains can be formed inalloys with lower concentrations of molybdenum, but their size islarger than the size of the simulation cell. We then applied a uniaxialdeformation to the alloy model. The deformation leads to atomicreorganization until the domains disappear and the crystal assumes
Fig. 4. Calculation results for uniaxial deformation of U–22 at.%Mo alloy at the room tem-perature. Compression takes place along y-direction. (a) Fragment of the calculation cell inthe initial state (two atomic planes are shown): black atoms—U,white atoms—Mo; bluesquares indicate atoms in one atomic plane; arrows indicate local “anisotropy direction”.(b) State after deformation εy = 0.04. (c) The dependencies of pressure components ondeformation: solid lines — initial compression; dashed lines — inverse deformationto initial sizes of calculation cell. Atomic basic cell of BCT lattice is shown in sub-figure(c), it corresponds to the solid blue square indicated in sub-figure (a).
a uniform BCT lattice with orientations along the deformation direction(in several cases, domains with antiparallel orientation remain).However, the reverse deformation does not result in a return to the ini-tial state. The pressure corresponding to the final structure is differentfrom the initial value. Domains are not formed for U–xMo alloyswhere x is approximately 18–19 at.%, but mechanical hysteresis occurs.The change in the “anisotropy direction” for the entire crystal caused bythe applied uniaxial deformation is the origin of such behavior.
An analogy exists between the phenomena studied in this workand the ferromagnetic-paramagnetic transition. In our case, the local“anisotropy direction” is similar to the magnetic moment of an atom(or to electron spin in highly accurate theories). At a low level of disor-der (corresponding to low values of temperature or Mo concentration),the system exhibits long-range correlations in the “anisotropy direc-tion”. Increased disorder leads to the formation of domains. At a highlevel of disorder, long-range correlation in the “anisotropy direction”is disturbed. Additionally, external action aimed at changing the“anisotropy direction” (such as a uniaxial deformation) leads tohysteresis. As the first approximation, the temperature Ttr offerromagnetic–paramagnetic transition may be calculated as ω/kB,where ω is the energy needed for reorientation of single magneticmoment and kB is the Boltzmann constant. In our case, reorientationenergy of single basic cell corresponds to a compression along a-axisand an extension along c-axis. This formalism allows to obtain theformula for the temperature of BCT → q-BCC transition:
Ttr ¼ 14kB
C11 þ C22−2C12ð Þ c−að Þ2 cþ að Þ; ð1Þ
where C11, C22 and C12 are the elastic constants for the crystalorientation like the one shown in Fig. 4c (i.e. c-axis is directedalong the x-direction). The calculation performed for a small systemwithout domains gives C11 = 205 GPa, C22 = 170 GPa and C12 =115 GPa. For the given elastic constants formula (1) describes thecalculated data (Figs. 2 and 3) with well precision: the deviationfrom directly calculated Ttr is about 30%.
There is a considerable variation in the published data for the elasticproperties of U–Moalloys [30,31]. In the presentworkwehave simulatedelastic properties of U–22 at.%Mo alloy. The effective elastic modulusrelated to small deformation (εyb 0.01) is 100±10GPa, andmacroscopicisotropy takes place. This calculated data agree well with the recentexperiments [31]. However, the structure has isotropy only on scalesmore than several nanometers, and the value of elasticmodulus is causedby domains reorientation. This question requires further investigationand will be considered in future works.
The authors acknowledge A.Yu. Kuksin and D.E. Smirnova for theirsuggestions and discussions, and Prof. G. Norman for the inspirationand support. The calculationswere carried out on the computer clustersMVS-100K of the Joint Supercomputer Center of RAS and K-100of Keldysh Institute of Applied Mathematics of RAS. The work wassupported by the Program for Basic Research of the Presidium ofthe RAS No 2 (coordinator is G. I. Kanel) and the President RF GrantMK-7688.2015.8.
References
[1] C.-S. Yoo, H. Cynn, P. Söderlind, Phys. Rev. B 57 (1998) 10359–10362.[2] R.Q. Hood, L.H. Yang, J.A. Moriarty, Phys. Rev. B 78 (2008) 024116.[3] A. Landa, P. Söderlind, P.E.A. Turchi, J. Nucl. Mater. 414 (2011) 132–137.[4] Y.S. Kim, G.L. Hofman, J. Nucl. Mater. 419 (2011) 291–301.[5] A. Landa, P. Söderlind, P.E.A. Turchi, J. Nucl. Mater. 434 (2013) 31–37.[6] Y.S. Kim, G.L. Hofman, A.M. Yacout, T.K. Kim, J. Nucl. Mater. 441 (2013) 520–524.[7] I. Tkach, N.-T. Kim-Ngan, S. Mašková, M. Dzevenko, L. Havela, A. Warren, C. Stitt,
T. Scott, J. Alloys Compd. 534 (2012) 101–109.[8] T.A. Pedrosa, A.M.M. dos Santos, F.S. Lameiras, P.R. Cetlin, W.B. Ferraz, J. Nucl. Mater.
457 (2015) 100–117.[9] P. Söderlind, Phys. Rev. B 66 (2002) 085113.
[10] C.D. Taylor, Phys. Rev. B 77 (2008) 094119.[11] P. Söderlind, B. Grabowski, L. Yang, A. Landa, T. Björkman, P. Souvatzis, O. Eriksson,
Phys. Rev. B 85 (2012) 060301.

30 S.V. Starikov, L.N. Kolotova / Scripta Materialia 113 (2016) 27–30
[12] B. Beeler, C. Deo, M. Baskes, M. Okuniewski, J. Nucl. Mater. 433 (2013) 143–151.[13] B. Beeler, B. Good, S. Rashkeev, C. Deo, M. Baskes, M. Okuniewski, J. Phys. Condens.
Matter 22 (2010) 505703.[14] G.-Y. Huang, B.D. Wirth, J. Phys. Condens. Matter 24 (2012) 415404.[15] M. Freyss, T. Petit, J.-P. Crocombette, J. Nucl. Mater. 347 (2005) 44–51.[16] D.E. Smirnova, S.V. Starikov, V.V. Stegailov, J. Phys. Condens. Matter 24
(2012) 015702.[17] S. Starikov, Z. Insepov, J. Rest, A. Kuksin, G. Norman, V. Stegailov, A. Yanilkin, Phys.
Rev. B 84 (2011) 104109.[18] D.E. Smirnova, A.Y. Kuksin, S.V. Starikov, V.V. Stegailov, Z. Insepov, J. Rest, A.M.
Yacout, Model. Simul. Mater. Sci. Eng. 21 (2013) 035011.[19] X.-F. Tian, H.-X. Xiao, R. Tang, C.-H. Lu, Nucl. Inst. Methods Phys. Res. B 321
(2014) 24–29.[20] H.-X. Xiao, R. Tang, X.-F. Tian, C.-S. Long, Chin. Phys. Lett. 31 (2014) 047101.[21] H. Xiao, C. Long, X. Tian, S. Li, Mater. Des. 74 (2015) 55–60.
[22] D. Smirnova, A. Kuksin, S. Starikov, J. Nucl. Mater. 458 (2015) 304–311.[23] D.E. Smirnova, A.Y. Kuksin, S.V. Starikov, V.V. Stegailov, Phys. Met. Metallogr. 116
(2015) 445–455.[24] F. Ercolessi, J.B. Adams, Europhys. Lett. 26 (1994) 583.[25] P. Brommer, F. Gahler, Model. Simul. Mater. Sci. Eng. 15 (2007) 295.[26] S.J. Plimpton, J. Comp. Physiol. 117 (1995) 1–19.[27] J. Li, Model. Simul. Mater. Sci. Eng. 11 (2003) 173–177.[28] V. Sinha, P. Hegde, G. Prasad, G. Dey, H. Kamath, J. Alloys Compd. 506 (2010)
253–262.[29] P. Söderlind, Adv. Phys. 47 (1998) 959–998.[30] D.E. Burkes, R. Prabhakaran, T. Hartmann, J.-F. Jue, F.J. Rice, Nucl. Eng. Des. 240
(2010) 1332–1339.[31] D. Brown, D. Alexander, K. Clarke, B. Clausen, M. Okuniewski, T. Sisneros, Scr. Mater.
69 (2013) 666–669.


![Istrazivanje 1-s2.0-S0048969711005754-main[1]](https://img.pdfslide.tips/doc/110x75/577cd8d41a28ab9e78a21a84/istrazivanje-1-s20-s0048969711005754-main1.jpg)