Embed Size (px)
Citation preview
Energy Consumption Simulation and Construction Cost Analysis for Wood and Steel Framing System in Florida Residential Housing – Case Study
Aiyin Jiang, University of North Florida
Agenda• Background• Introduction to the base case • Methodology• Energy consumption and construction costanalysis
• Conclusion2
Background• steel stud framing offers some advantages for its fundamental characteristics
• the ecosystem disruption by steel production for residential steel studs is one percent less than the equivalent wood stud production (Crawford, 2002).
3
Background• barriers that impede its adoption in the residential market
Thermal conductivity of steel stud frame affects energy use in homes The building industry is generally reluctant to adopt alternative building
methods and materials
• The purpose is to compare the construction cost and energy performance of steel stud wall houses to wood stud wall houses in Florida.
4
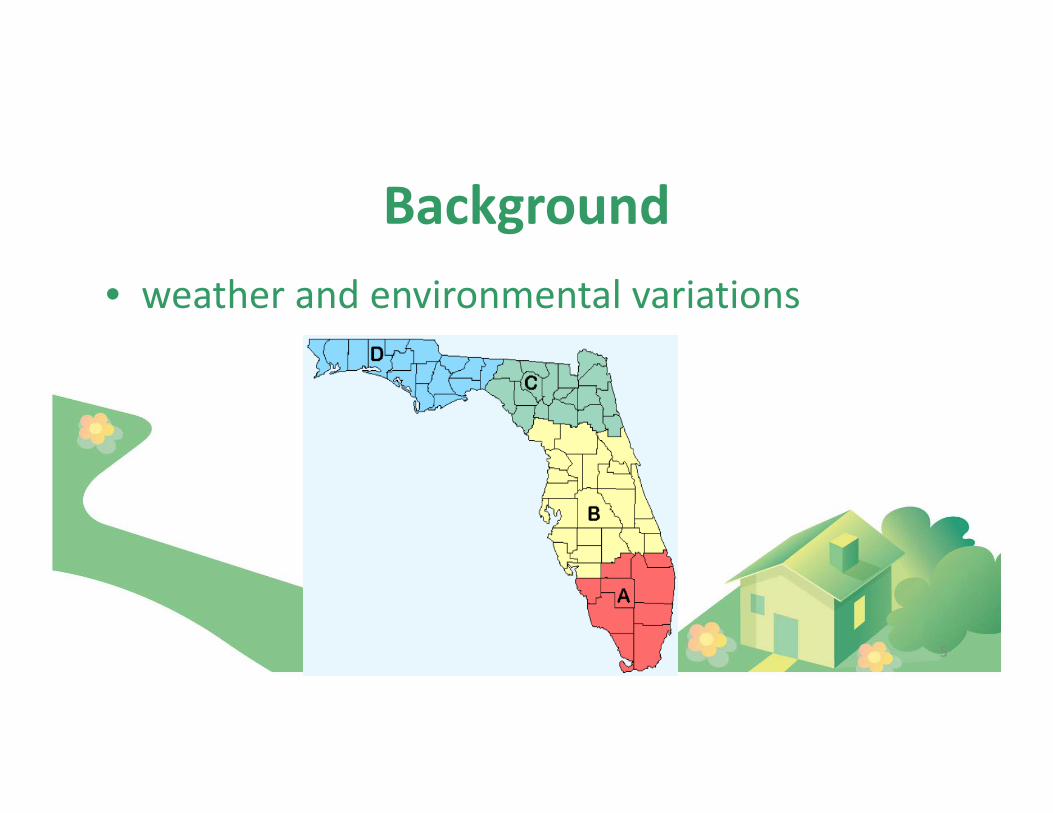
Background• weather and environmental variations
5
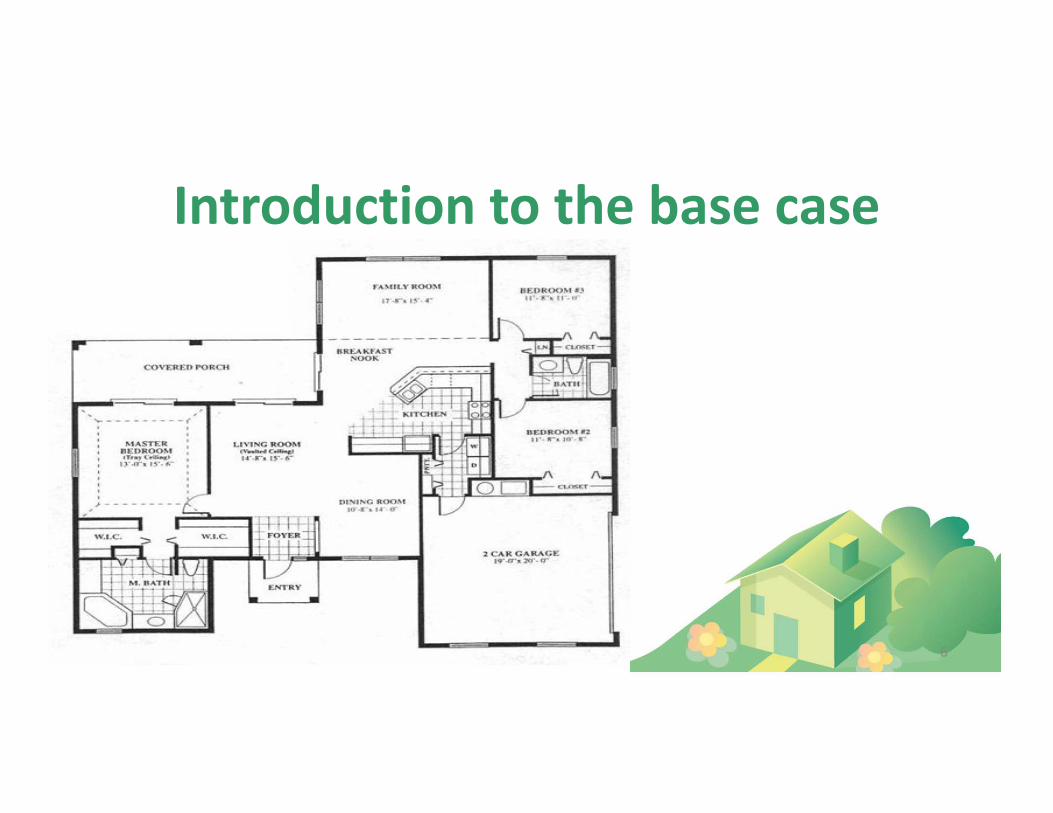
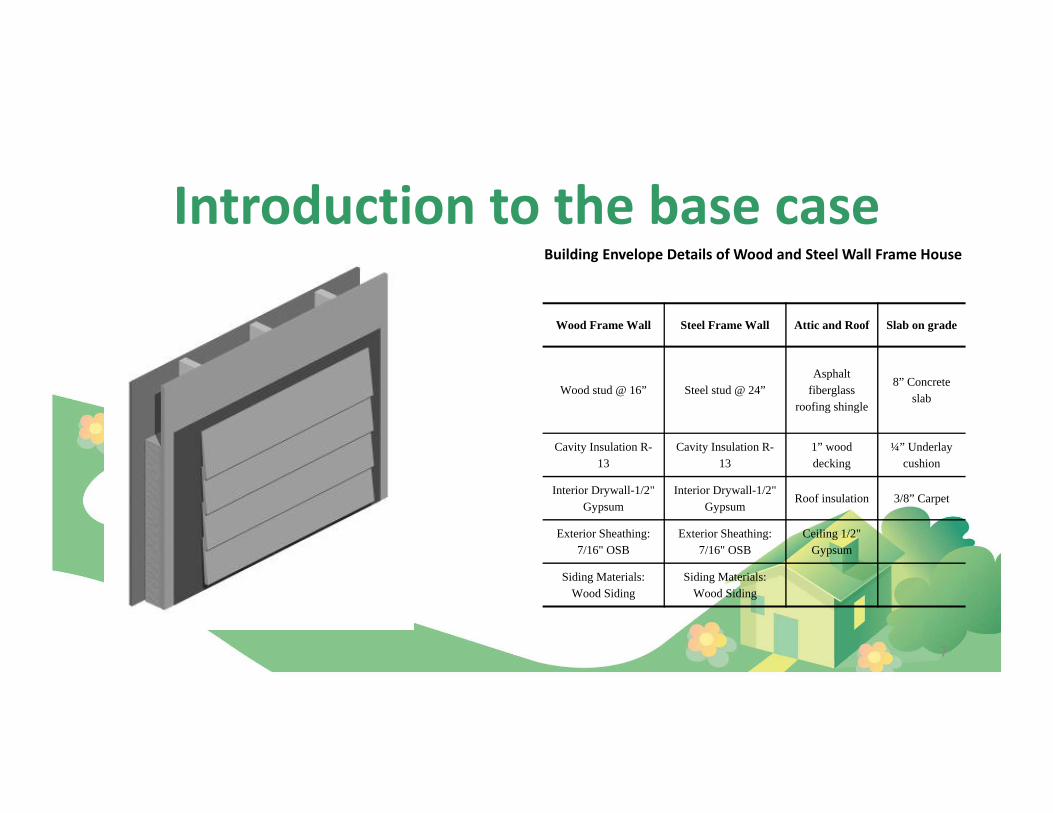
Introduction to the base case
6
Introduction to the base case
7
Wood Frame Wall Steel Frame Wall Attic and Roof Slab on grade
Wood stud @ 16” Steel stud @ 24”Asphalt
fiberglass roofing shingle
8” Concrete slab
Cavity Insulation R-13
Cavity Insulation R-13
1” wood decking
¼” Underlay cushion
Interior Drywall-1/2" Gypsum
Interior Drywall-1/2" Gypsum
Roof insulation 3/8” Carpet
Exterior Sheathing: 7/16" OSB
Exterior Sheathing: 7/16" OSB
Ceiling 1/2" Gypsum
Siding Materials: Wood Siding
Siding Materials: Wood Siding
Building Envelope Details of Wood and Steel Wall Frame House
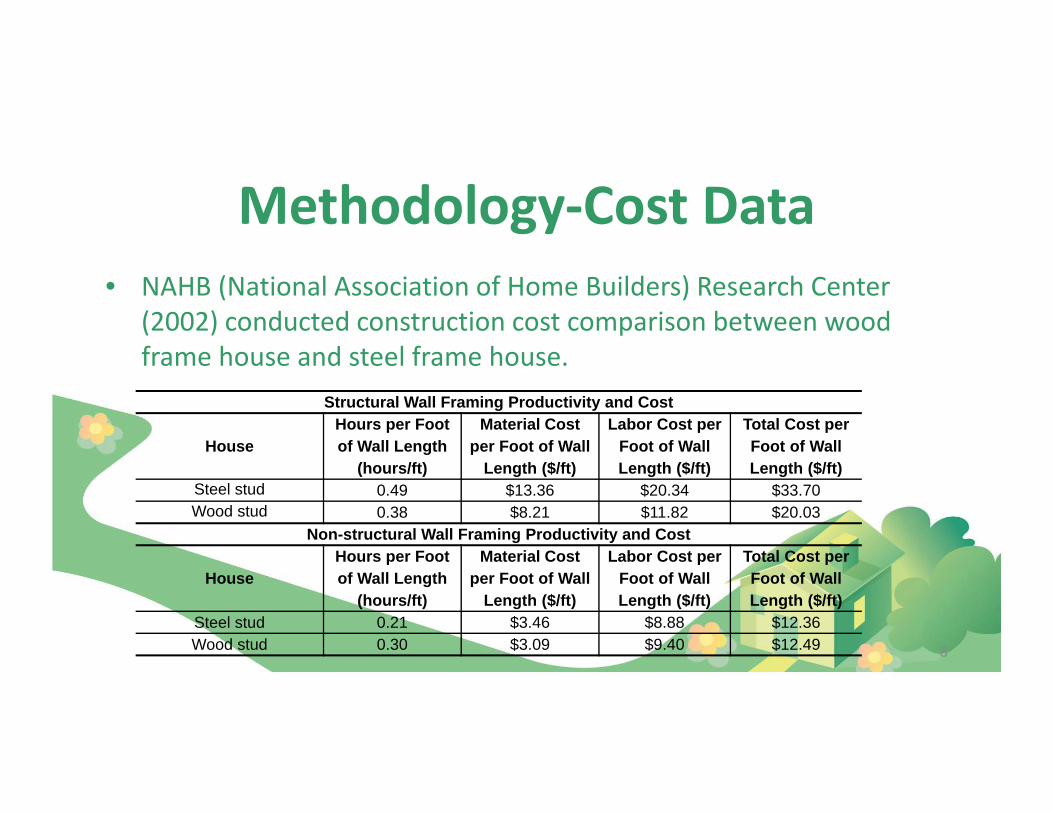
Methodology‐Cost Data• NAHB (National Association of Home Builders) Research Center
(2002) conducted construction cost comparison between wood frame house and steel frame house.
8
Structural Wall Framing Productivity and Cost
HouseHours per Foot of Wall Length
(hours/ft)
Material Cost per Foot of Wall
Length ($/ft)
Labor Cost per Foot of Wall Length ($/ft)
Total Cost per Foot of Wall Length ($/ft)
Steel stud 0.49 $13.36 $20.34 $33.70Wood stud 0.38 $8.21 $11.82 $20.03
Non-structural Wall Framing Productivity and Cost
HouseHours per Foot of Wall Length
(hours/ft)
Material Cost per Foot of Wall
Length ($/ft)
Labor Cost per Foot of Wall Length ($/ft)
Total Cost per Foot of Wall Length ($/ft)
Steel stud 0.21 $3.46 $8.88 $12.36Wood stud 0.30 $3.09 $9.40 $12.49
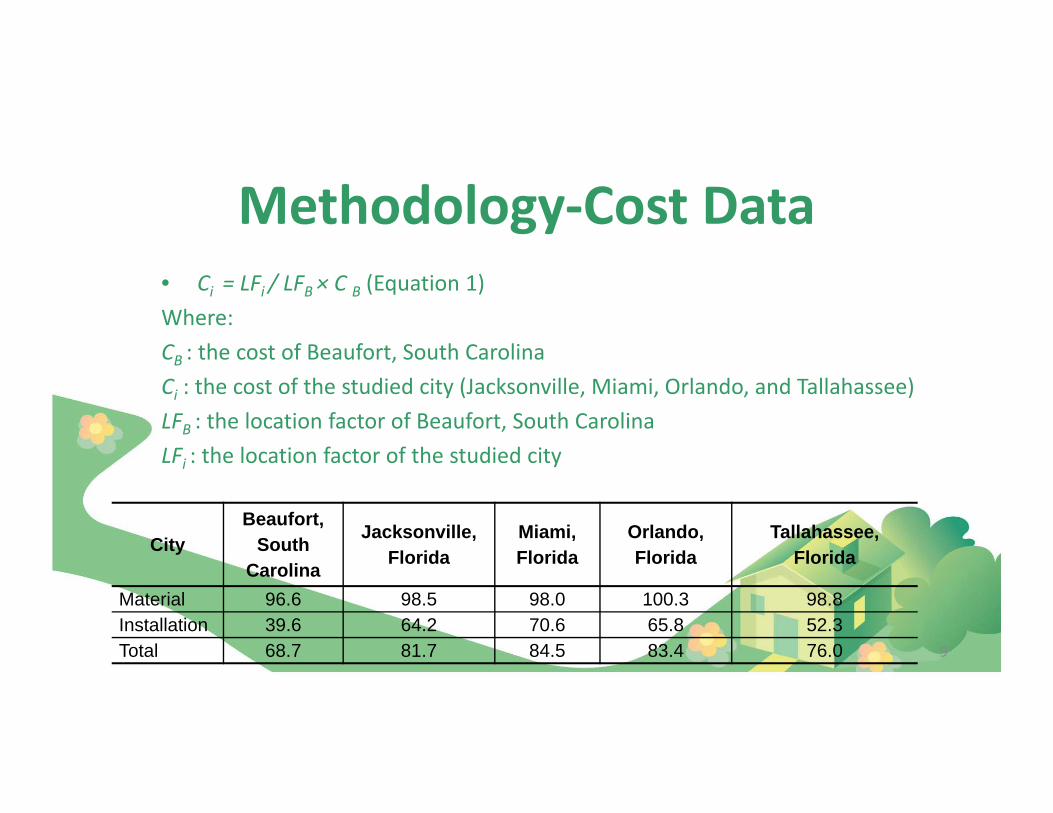
Methodology‐Cost Data• Ci = LFi / LFB × C B (Equation 1)Where:CB : the cost of Beaufort, South CarolinaCi : the cost of the studied city (Jacksonville, Miami, Orlando, and Tallahassee)LFB : the location factor of Beaufort, South CarolinaLFi : the location factor of the studied city
9
CityBeaufort,
South Carolina
Jacksonville, Florida
Miami, Florida
Orlando, Florida
Tallahassee, Florida
Material 96.6 98.5 98.0 100.3 98.8Installation 39.6 64.2 70.6 65.8 52.3Total 68.7 81.7 84.5 83.4 76.0
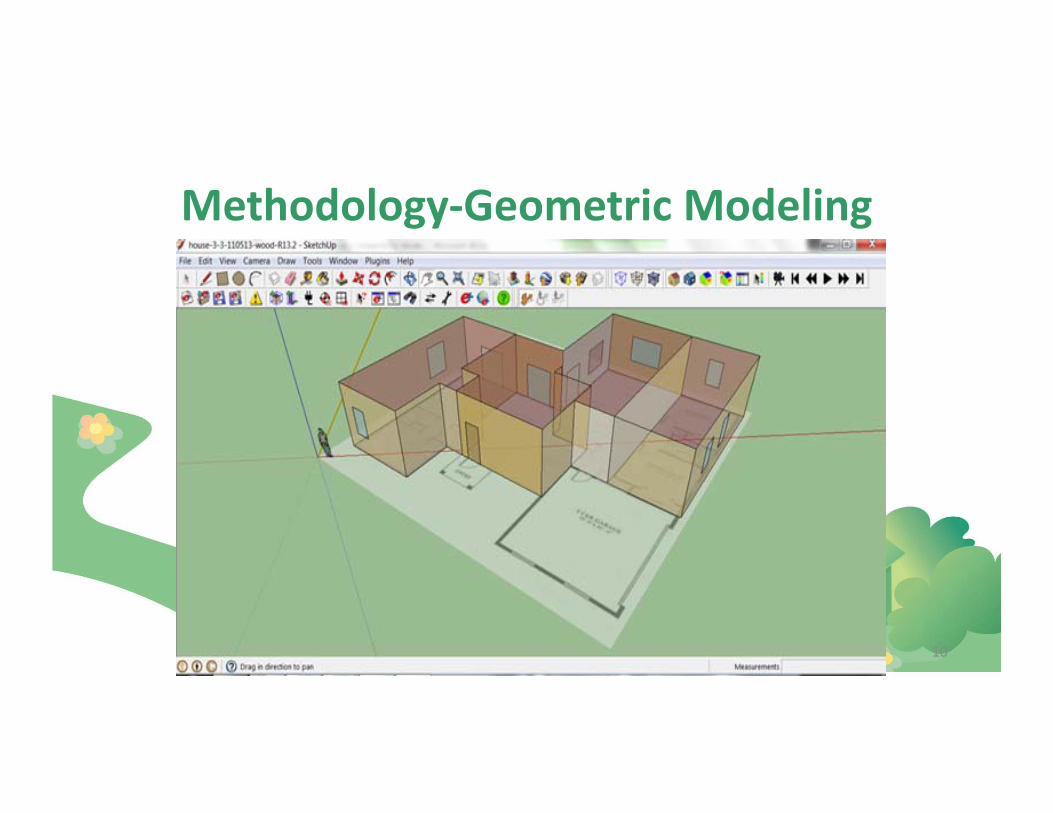
Methodology‐Geometric Modeling
10
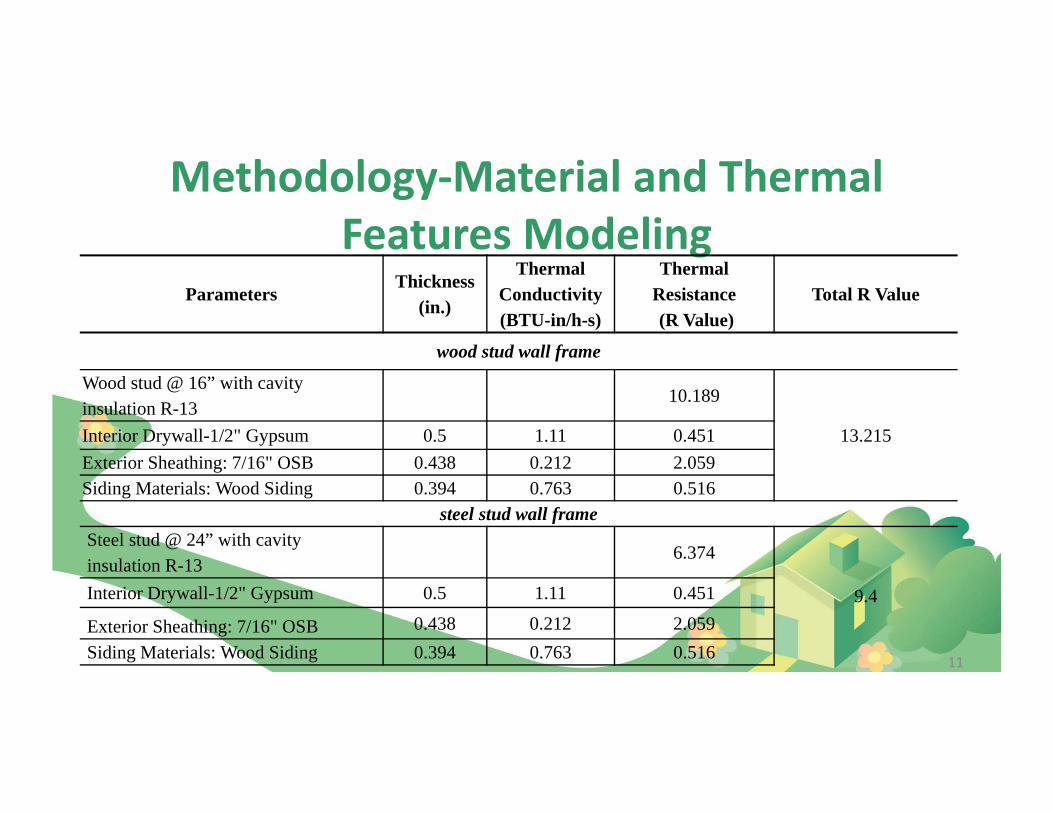
Methodology‐Material and Thermal Features Modeling
ParametersThickness
(in.)
Thermal Conductivity (BTU-in/h-s)
Thermal Resistance(R Value)
Total R Value
wood stud wall frame
Wood stud @ 16” with cavity insulation R-13
10.189
13.215Interior Drywall-1/2" Gypsum 0.5 1.11 0.451Exterior Sheathing: 7/16" OSB 0.438 0.212 2.059Siding Materials: Wood Siding 0.394 0.763 0.516
steel stud wall frameSteel stud @ 24” with cavity insulation R-13
6.374
9.4Interior Drywall-1/2" Gypsum 0.5 1.11 0.451
Exterior Sheathing: 7/16" OSB 0.438 0.212 2.059Siding Materials: Wood Siding 0.394 0.763 0.516 11
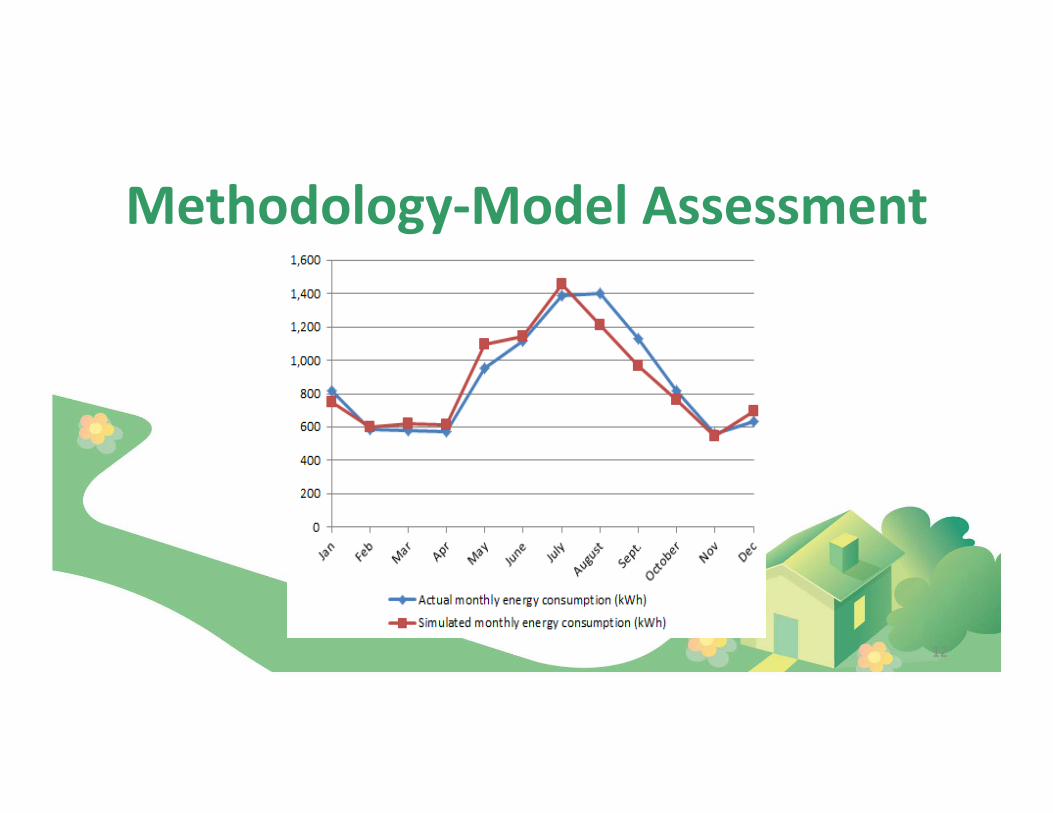
Methodology‐Model Assessment
12
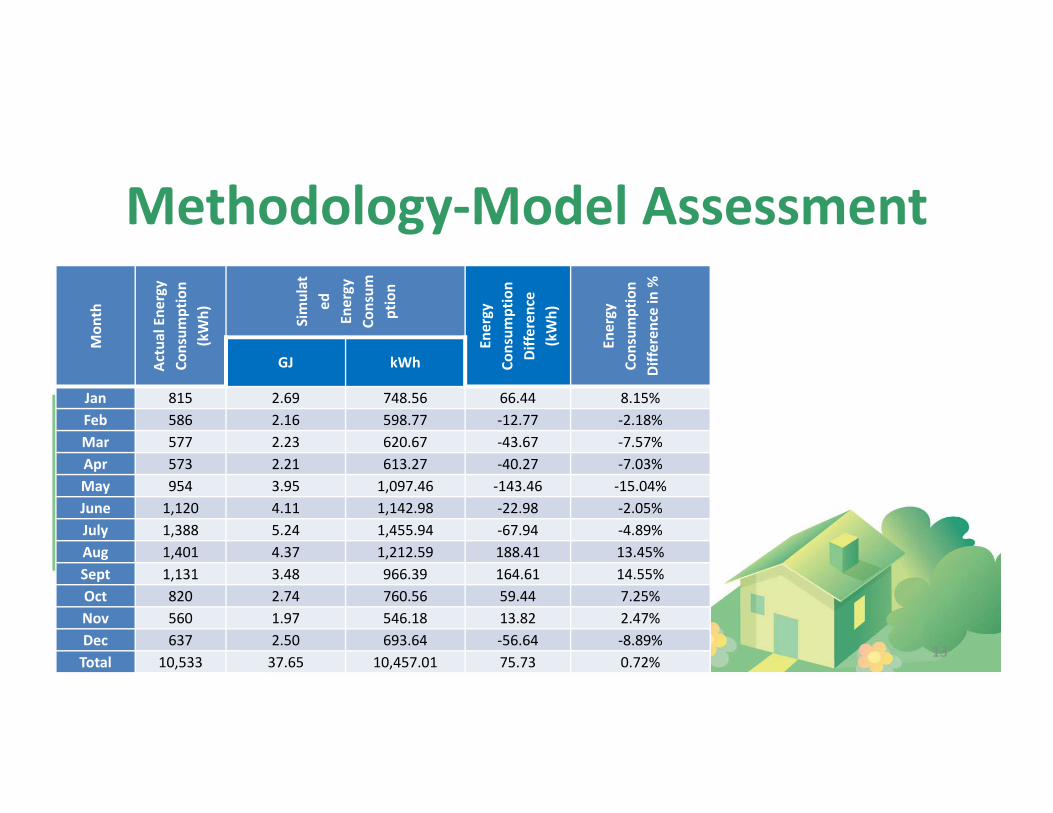
Methodology‐Model Assessment
Mon
th
Actual Ene
rgy
Consum
ption
(kWh) Simulat
ed
Energy
Consum
ption
Energy
Consum
ption
Differen
ce
(kWh)
Energy
Consum
ption
Differen
ce in
%
GJ kWh
Jan 815 2.69 748.56 66.44 8.15%Feb 586 2.16 598.77 ‐12.77 ‐2.18%Mar 577 2.23 620.67 ‐43.67 ‐7.57%Apr 573 2.21 613.27 ‐40.27 ‐7.03%May 954 3.95 1,097.46 ‐143.46 ‐15.04%June 1,120 4.11 1,142.98 ‐22.98 ‐2.05%July 1,388 5.24 1,455.94 ‐67.94 ‐4.89%Aug 1,401 4.37 1,212.59 188.41 13.45%Sept 1,131 3.48 966.39 164.61 14.55%Oct 820 2.74 760.56 59.44 7.25%Nov 560 1.97 546.18 13.82 2.47%Dec 637 2.50 693.64 ‐56.64 ‐8.89%Total 10,533 37.65 10,457.01 75.73 0.72%
13
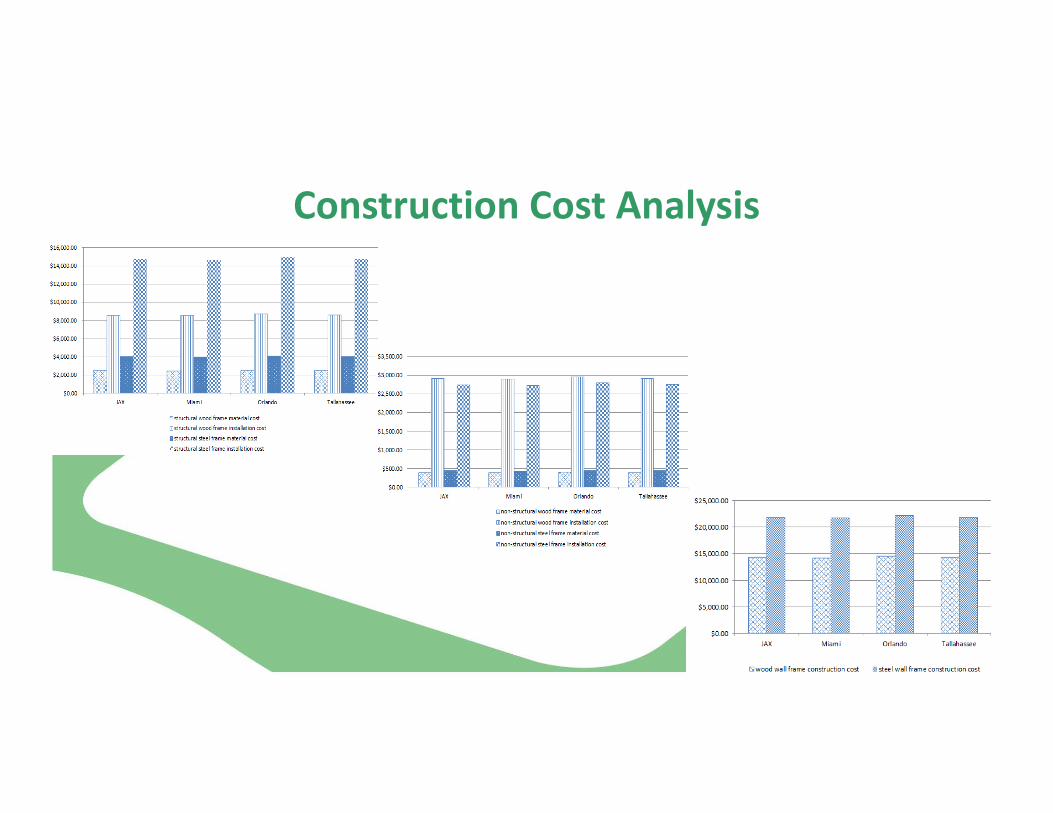
Construction Cost Analysis
14
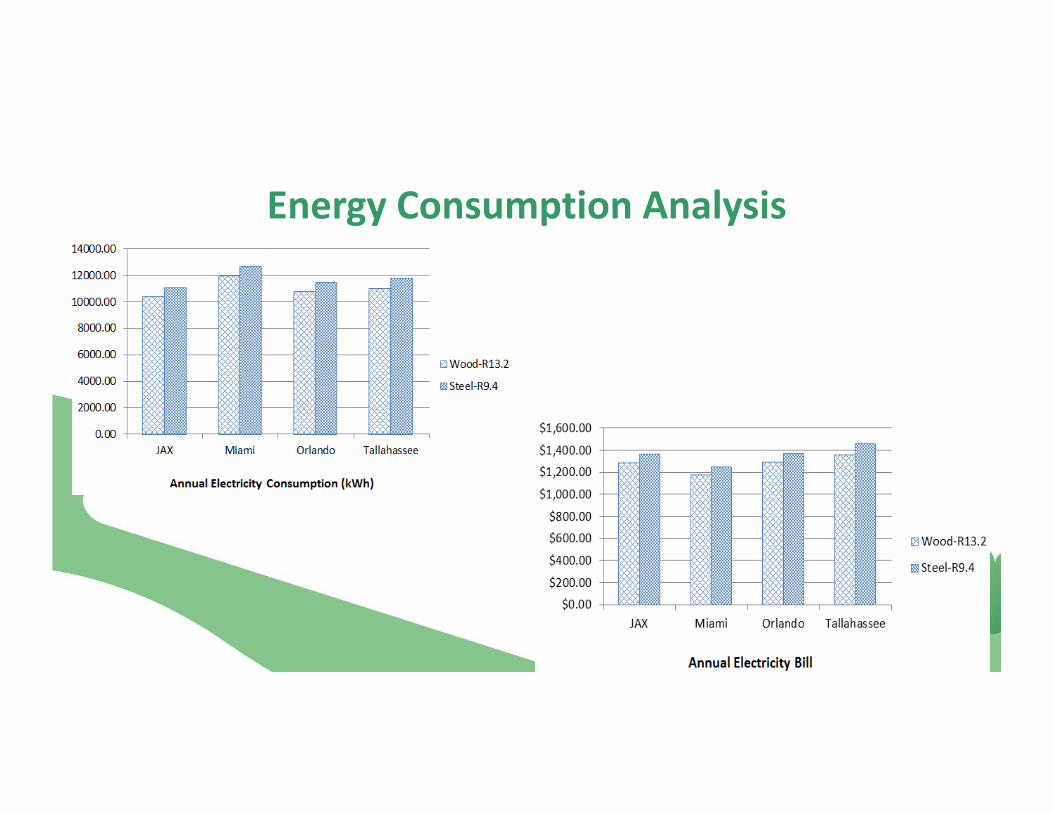
Energy Consumption Analysis
15
Conclusion• a house built with steel wall frame has greater construction
cost (53% more) and annual energy consumption (6%‐7% more) than wood wall frame.
• Improve thermal efficiency of steel frame construction • Make steel frame structure economically viable• Further research: modifying steel stud spacing, novel
insulation materials, and new construction techniques.
16
References• Elhajj, N. R. (2003), Development of Cost‐Effective, Energy‐Efficient Steel Framing,
American Iron and Steel Institute Technology Roadmap Program Office• Energy Information Administration (EIA)(2007), U.S. Average Monthly Bill by Sector, Census
Division, and State 2007,http://tonto.eia.doe.gov/ask/electricity_faqs.asp#electricity_use_home, Dept. of Energy, Washington, D.C.
• IECC Compliance Guide for Homes in Florida, http://reca‐codes.org/pages/codes2009/• NAHB Research Center, Inc. (2002), Steel vs. Wood Cost Comparison‐Beaufort
Demonstration Homes, January 2002. U.S. Department of Housing and Urban Development Office of Policy Development and Research
• RSMeans Building Construction Cost Data (2010), Kingston, Mass., Robert Snow Means Co. ISSN 0068‐3531
• Zhu, Y., (2006), “Applying computer‐based simulation to energy auditing: A case study.” Energy and Building, 38, 421‐428
17