Embed Size (px)
Citation preview


中国环境状况公报 2010
The “2010 Report on the State of the Environment of China” is hereby released in accordance with the Environmental Protection Law of the People's Republic of China.
May 29, 2011
Ministry of Environmental Protection ofthe People's Republic of China

中国环境状况公报2010
Reduction of Total Discharge of Major Pollutants ........................... 1
Water Environment ............................................................................. 3
Marine Environment ......................................................................... 17
Atmospheric Environment ................................................................ 23
Acoustic Environment ....................................................................... 27
Solid Waste ......................................................................................... 29
Radiation Environment ..................................................................... 31
Nature and Ecology ........................................................................... 34
Land and Rural Environment .......................................................... 38
Forest .................................................................................................. 42
Grassland ............................................................................................ 44
Climate and Natural Disasters .......................................................... 45
Municipal Utilities Construction.........................................................14
Environmental Supervision and Inspection.......................................15
International Year of Biodiversity......................................................16
Environmental quality conditions in fishery waters.........................16
Major environmental pollution incidents nationwide.......................21
International cooperation on environmental protection..................21
Survey on the public satisfaction with environmental conditions... 22
Progress in Environmental Satellite Work........................................22
National campaign on improving the urban and rural
environmental sanitation (2010-2012)...............................................26
The first national contest of environmental monitoring
technicians............................................................................................ 28
Cleaner production audit in key companies......................................32
Implementation of international environmental conventions..........33
Chemicals management.......................................................................36
Major progress in environmental economic policies........................37
Ecological Improvement and Conservation Culture........................ 40
General situation of and progress in environmental standards and
technical documents.............................................................................40
Environmental publicity and education.............................................41

中国环境状况公报 2010
At the Fifth Plenary Session of the 17th National Conference of Communist Party of China held on October 15, 2010, CPC General Secretary Hu Jintao required that China would accelerate the development of resource-saving and environment-friendly society, uplift ecological civilization level, actively address global climate change, vigorously develop circular economy, strengthen conservation and management of resources, make more efforts in environmental protection, enhance the development of ecological protection and development of disaster prevention and mitigation system and enhance capacity in sustainable development.
Photo from Xinhua News Agency
In his Report of the Government at the Third Meeting of the 11th National People’s Congress held on March 5, 2010, Premier Wen Jiabao said that China will strengthen environmental protection, actively facilitate activities such as promotion of environmental control of major river basins, treatment of urban sewage and garbage, control of agricultural non-point pollution and comprehensive control of heavy metal pollution.
Photo from Xinhua News Agency

中国环境状况公报2010
is the year with most complicated economic situation in China. The CPC Central Committee and State Council have united and guided all ethnic groups in our country, adhered the guidance by Deng Xiaoping theory and the important thought of the “three representations”, further carried out the outlook on scientific development, had the initiative in economic work, focused their attention to the adjustment of economic structure and shift of development mode, properly handled well the relations among maintaining steady and fast economic development, adjustment of economic structure and management of expected infl ation, effectively consolidated and expanded the achievements in addressing the impacts of international fi nancial crisis, achieved relatively fast growth of economy and adjustment of economic structure. Facing complex and changeable domestic and international economic situation, CCCPC and the State Council have put environmental protection at a more important position and put forward a series of new thinking and ideas such as “energy saving and emission reduction is an important tool for shift of economic development mode and adjustment of economic structure” and “environmental protection is an important public welfare”. Environmental protection has made important change from understanding to practice. It has entered the main line, platform and arena of economic and social development. Emission reduction task has been completed ahead of schedule with steady improvement of environmental quality and enhancement of public environmental awareness.
In 2010, under the correct leadership of CCCPC and State Council, environmental protection organizations across the country implement the outlook on scientifi c development; vigorously facilitate the development of ecological civilization; actively explore new path to environmental protection; combine environmental protection with shift of development mode, emission reduction with the strategic adjustment of economic structure, environmental governance with ensuring and improving public welfare. Focusing on addressing preeminent environmental problems affecting scientific development and threantening public health, environmental protection organizations across the country facilitated fi rm development of each work of environmental protection and successfully fi nished all tasks in 2010.
First, the task of reducing total discharge of major pollutants has finished ahead of schedule. Total COD discharge and SO2 emission went down by 12.45% and 14.29% respectively compared with that of 2005, both meeting the reduction targets of the “11th Five-Year Plan” ahead of schedule. The construction of environment infrastructure has enjoyed rapid development, the efforts in phasing out outdated productivity was unprecedented with continuous improvement of environmental quality. Second, environmental protection has increasingly shown its comprehensive role in optimizing economic development. The environmental impact assessments on development strategy of key industries in five big regions such as the Bohai Sea Rim, west bank areas of the Taiwan Straigt, Beibu Bay, Chengdu-Chongqing and energy & chemical industrial zones of mid and upper streams of the Yellow River have been finished. MEP has continuously deepened environmental impact assessment of construction projects. It has rejected, turned down, suspended the approval or returned the environmental impact statements of 59 construction projects failing to meet the requirements, involving total investment of 90.4 billion yuan. It has established the impassable “fi rewall” for projects with high consumption of energy and pollution or resource oriented”, low-level redundant construction projects or projects with excessive productivity. Third, more efforts have been made in prevention and control of pollution of major river basins and regions. MEP has facilitated ecological rehabilitation of
2010
中国环境状况公报 2010
rivers and lakes and in cooperation with relevant departments conducted examination and assessment on the implementation of the plan for major river basins in 2009. MEP has established and improved the new mechanism for joint prevention and control of pollution at regional level. The General Offi ce of the State Council has transferred the Guidance on Facilitating Joint Prevention and Control of Atmospheric Pollution and Improving Regional Air Quality. Relevant departments have successfully finished the tasks of ensuring good air quality for Shanghai World Expo and Guangzhou Asian Games. Fourth, MEP has concentrated its efforts in addressing preeminent environmental problems threatening public health. The work on ensuring drinking water safety has sound progress. MEP has conduct prevention and control of heavy metal pollution in an all round way. The central budget set aside special fund for prevention and control of heavy metals pollution and allocated for the fi rst time 1.5 billion Yuan special fund for prevention and control of heavy metal pollution in 2010 to support comprehensive prevention and control of pollution, demonstration and extension of new technology in major prevention and control areas. The efforts in supervision on environmental law enforcement have been increased and sudden environmental accidents have been under proper treatment. Fifth, rural environmental protection and ecological conservation have been continuously strengthened. Carrying out the spirit of important instruction of Vice Premier Li Keqiang on promoting “environmental control of rural contiguous areas”, MEP conducted demonstration work on environmental control of rural contiguous areas. It had organized the activity for International Year on Biodiversity. The General Offi ce of the State Council issued the Circular on Doing Well the Management of Nature Reserves. The system for activities of demonstration zones for ecological development has been improved. Sixth, basic and strategic projects on environmental protection have made fruitful achievements. The Study on Macro Strategy for the Environment of China has been successfully completed with a series of important achievements of such as the general report on strategic study and special reports. The key research project on prevention and control of water pollution has entered the stage of tacking thorny problems. Seventh, relevant policies, legal system, environmental protection plan, environment monitoring and international cooperation have enjoyed steady progress. Environmental protection laws and regulations have enjoyed continuous improvement with increasing role of environment economic policies. The mid-term assessment of the implementation of the “11th Five-Year Plan for Environmental Protection” had been successfully completed, science & technology support have been further intensifi ed. Environment monitoring work has been under accelerated promotion, international environmental cooperation had evident achievements. Eighth, supervision on nuclear and radiation safety has been improved. The safety of nuclear energy and application of nuclear technology are good. The activities on prevention and control of radioactive pollution have steady development and national radiation environment has kept good quality. Ninth, capacity building in environmental protection enjoyed further enhancement with active progress. The development of environmental protection institutions and workforce has made a breakthrough.
2010, surface water pollution was still relatively serious, the seven big waters were under slight pollution in general, lakes (reservoirs) had preeminent eutrophication problem, and the coastal marine waters were under slight pollution. In general, urban air quality was good with stable distribution of acid rain. The urban acoustic environment was generally good.
In


2010
In 2010, total COD discharge in China reached 12.381 million t, down by 3.09% against that of 2009; total SO2 emission was 21.851 million t, down by 1.32%. Total COD discharge and SO2 emission went down by 12.45% and 14.29% respectively compared with that of 2005, both meeting the 10% reduction target ahead of schedule.
Reduction of Total Discharge of Major Pollutants
Basic Objectives
The Outline of the 11th Five-Year Plan for National Economic and Social Development identifies the binding target of 20% reduction of energy consumption per unit GDP and 10% reduction of total discharge of major pollutants during the “11th Five-Year Plan” period. By 2010, COD discharge and SO2 emission have dropped by 10% respectively on the level of 2005, that is, COD discharge was reduced to 12.728 million t from 14.142 million t in 2005 and SO2 emissions reduced to 22.944 million t from 25.494 million t in 2005.
The emission reduction targets of 2010 are mainly the followings: 400,000 t SO2 will be reduced compared with that of last year; over 200,000 t COD will be reduced based on meeting the “11th Five-Year Plan” target; 10 million m3 daily capacity in urban sewage treatment will be added; 50 million kW installed capacity of coal-fueled power generation will be constructed with desulphurization facilities with another 30 new sets of fl ue desulphurization facilities for iron & steel sintering machines. Another 800,000 t reduction of COD and over 1 million t reduction of SO2 will be reduced by pollution control project. Our country will phased out lag-behind productivity of 20 million t in iron smelting, 10 million kW in power, 50 million t in cement, 20 million t in coking and 520,000 t in paper making.
Reduction of Major Pollutants
In 2010, Premier Wen Jiabao chaired the executive meeting of the State Council and teleconference on energy saving and emission reduction to study and arrange energy saving and emission reduction activities. The State Council issued the Circular on More Efforts in Ensuring the Achievement of the Energy Saving and Emission Reduction Target during the “11th Five-Year Plan” Period. The General Office of the State Council has printed out and distributed the 2010 Arrangements for Energy Saving and Emission Reduction , which puts forward clear requirements for energy saving and emission reduction. The State Council has organized 6 supervision groups to carry out special supervision on energy saving and emission reduction of 18 major regions, which has greatly facilitated energy saving and emission reduction work.
In 2010, Ministry of Environmental Protection has printed out and distributed documents such as the Circular of Ministry of Environmental Protection on Carrying Out the Spirit of Teleconference on Arrangements of Emission Reduction, Circular on Printing Out and Distribution of the Table of Ministry of Environmental Protection on Dividing Energy Saving and Emission Reduction Work to Fulfill the Task of Energy Saving and Emission Reduction Specifi ed by the State Council in 2010 and Circular on Employing Lead Seal of By-pass Flue Damper in Desulphurization Facilities of Thermal Power Plants in order to actively promote emission reduction work. It released the 2009 examination results of each province (autonomous region, municipality), State Grid Corporation and the five big power corporations on reduction of major pollutants as well as the indicators of discharge of major pollutants of each province (autonomous region, municipality) in the fi rst 6 month of 2010. MEP has taken a series of measures such as rejection of approval of environmental impact statement any new construction projects at regional level due to excessive pollution load, supervision of grave cases of environmental infringements
Major Measures

2010
on black list and economic punishment in over 30 regions and enterprises. Based on data on national economy, Ministry of Environmental Protection analyzed emission reduction situation and controlled emission reduction work each quarter, gave early warning to 7 provinces (autonomous regions) with rebound of emissions in the fi rst 6 months of 2010, had discussions with local government leaders, and conducted supervision and guidance.
Hebei Province has vigorously carried out “30% reduction of both SO2 and COD” projects in energy saving and emission reduction. Shanxi Province has released the Regulations of Shanxi Province on Reduction of Pollutants and brought emission reduction activities into the track of judicial control. Tianjin has included emission reduction in annual work plan in Tianjin Commission of Communist Party of China. Shanghai has developed the policy that gives subsidy to the enterprises with excessive reduction of COD and policy award enterprises with excessive reduction of SO2 in order to actively tap emission reduction potentials. Provinces or municipality such as Shandong, Guangdong, Gansu and Chongqing has carried out more stringent local emission standard and effectively facilitated upgrading and structure adjustment of industries. Provinces and municipality such as Henan, Jiangsu and Chongqing have built a sewage treatment plant in each county. Jingxia is the fi rst province (autonomous region) of West China to launch the program of constructing a sewage treatment plant in each county. Provinces (autonomous regions) like Guizhou and Guangxi extruded funds to support construction of major emission reduction projects when they had some difficulty in finance, and strived for finishing the emission reduction task during the “11th Five-Year Plan” period.
In 2010, the three strong measures such as emission reduction by projects, emission reduction by structural adjustment and emission reduction by management will be under steady progress and play their role in an all round way. The first is emission reduction by projects. In 2010, 107 million kW installed capacity of coal-fueled generating units with desulphurization facilities was added across the country; the installed capacity of thermal generating units with desulphurization facilities reached 578 million kW, its proportion to total thermal generating units went up from
12% in 2005 to 82.6%. There increased 19 million cubic meters daily capacity in urban sewage treatment, as a result, urban daily treatment capacity reached at 125 million m3. The urban sewage treatment rate went up from 52% in 2005 to over 75%. The accumulated amount of 170 iron & steel sintering machines with flue desulphurization facilities had been put into operation, its proportion to total amount of sintering machines raised from 0% in 2005 to 15.6% in 2010. Second, emission reduction by industrial restructuring. The authority has shut down a total of 72.10 million kW capacity of small power generating units, meeting the reduction of 50 million t target 1.5 year ahead of schedule. Industries with high consumption of energy and emission such as iron and steel, cement, coking, paper making, alcohol and monosodium glutamate have finished their task of phasing out productivity. In 2010, the proportion of thermal power generating plants with capacity over 300,000 kW across the country to total thermal power plants went up from 47% in 2005 to over 70%. The coal consumption for thermal power plants went down by 9.5%. The COD pollution load per unit product of paper making industry went down by 45%. Third, emission reduction by management. The central government has invested more than 10 billion Yuan during the “11th Five-Year Plan” period to support the development of the “three big systems” on emission reduction and capacity building in environmental protection supervision. 343 monitoring centers on pollution sources have been built up. Automatic monitoring on 15,000 enterprises has been carried out and over 100,000 sets of monitoring & law enforcement equipment have been equipped, the capacity in environmental supervision has been significantly strengthened. China Southern Power Grid and many provinces have conducted dispatchment of electricity on energy saving and emission reduction. It examined the putting-into-operation rate of generating units with desulphurization facilities and deducted the price of electricity generated from generating units with desulphurization facilities. As a result, the putting-into-operation rate has gone up from less 60% in 2005 to over 95% in 2010. The meeting-the-standard rate of SO2 and COD of major pollution sources under national pollution control program was 92% and 94%, up by 22 and 34 percentage points respectively compared with that of 2005.
2

2010
Water Environment
General Situation
Pollution of surface water in China still remained serious. In general, the seven major water systems were under slight pollution. The rivers in Zhejiang Province and Fujian Province and those in southwest part of China had good water quality. The rivers in northwestern part of China enjoyed excellent water quality. The lake (reservoir) eutrophication problem was prominent.
RiversThe seven big rivers (the Yangtze River, Yellow River,
Pearl River, Songhua River, Huaihe River, Haihe River and Liaohe River) were under slight pollution in general. Among 409 surface water monitoring sections of 204 rivers under national pollution control program, 59.9% met Grade I~III quality standard, 23.7% met Grade IV~V standard and 16.4% failed to meet Grade V standard. The main pollutants were permanganate value, BOD5 and ammonia nitrogen. Among them, the water quality of the Yangtze River and Pearl River
was good. The Songhua River and Huaihe River were under intermediate pollution. The Yellow River and Liaohe River were under intermediate pollution and Haihe under heavy pollution.
The Yangtze River Waters The overall water quality of the Yangtze River was good. Among 105 surface water monitoring sections under national monitoring program,
Percent of different quality of the seven big waters in 2010
Water quality of the Yangtze River waters in 2010
3
0%
20%
40%
60%
80%
100%
Percent
YangtzeRiver
YellowRiver
PearlRiver
SonghuaRiver
HuaiheRiver
HaiheRiver
LiaoheRiver
General
I III IV V V

2010
88.6% met Grade I~III national water quality standard, 6.6% met Grade IV standard, 1.0% met Grade V standard and 3.8% failed to meet Grade V standard.
The overall quality of the mainstream of the Yangtze River was excellent. There is no evident change of water quality compared with that of last year.
The overall quality of the tributaries of the Yangtze River was good. The water quality had no signifi cant change compared with that of last year. Among the 10 big tributaries, Yalong River, Minjiang River, Jialing River, Wujiang River, Yuanjiang River and Hanjiang River enjoyed excellent
quality. Dadu River, Tuojiang River, Xiangjiang River and Ganjiang River had good quality. However, Meishan section of Minjiang River, Hengyang Section of Xiangjiang River and Nanchang section of Ganjiang River was under slight pollution. The main pollutant was ammonia nitrogen.
The water quality of trans-province-boundary river sections was excellent. Among 20 sections, 95.0% met Grade I~III water quality standard and 5.0% met Grade IV standard, there were no river sections at or inferior to Grade V standard. There was no significant change of water quality compared with that of last year.
Water quality of the Yellow River waters in 2010
The Yellow River Waters In general, the Yellow River waters were under intermediate pollution. Among 44 sections under national monitoring program, 68.2% met Grade I~III quality standard, 4.5% met Grade IV standard, 6.8% met Grade V standard and 20.5% failed to meet Grade V standard. Major pollutants included petroleum, ammonia nitrogen and BOD5.The main pollution indicators included BOD5, petroleum and ammonia nitrogen.
The overall water quality of the mainstream of the Yellow River was excellent with no obvious change compared with that of 2009.
The overall waters of the tributaries of Yellow River were under heavy pollution. There was no obvious change of water quality compared with that of last year. The main pollution indicators were BOD5, petroleum and ammonia nitrogen. The water quality of the Yihe River, Luohe River and Qinhe River was excellent. The Yiluo River was under slight pollution.
Huangshui River, Dahei River and Beiluo River were under intermediate pollution. Other tributaries were under heavy pollution. Xi’an section and Weinan section of Weihe River, Xining downstream section of the Huangshui River, Taiyuan section, Linfen section and Yuncheng section of Fenhe River were under serious pollution.
The trans-province boundary river sections were under intermediate pollution. Among 11 river sections, 63.6% river sections met Grade I~III standard, 9.1% met Grade V standard and 27.3% failed to meet Grade V standard. The main pollution indicators were ammonia nitrogen, BOD5 and permanganate value. Tongguan Diaoqiao section (Shaanxi-Henan, in Shanxi) of the Weihe River in Weinan, Hejin Bridge section of Fenhe River in Yuncheng (Shanxi-Shaanxi, in Shanxi) and Zhangliuzhuang section of Sushui River in Yuncheng (Shanxi-Shaanxi, in Shanxi) were under heavy pollution.
4

2010
The Pearl River Waters The overall water quality of the Pearl River waters was good. In 33 sections under national monitoring program, 84.9% met Grade I~III standard, 12.1% met Grade IV standard and 3.0% failed to meet Grade V standard.
In general, the water quality of the mainstream of the Pearl River was good. There was no evident change of water quality compared with that of last year. The Guangzhou section of the Pearl River was under intermediate pollution and the main pollutants were ammonia nitrogen, petroleum and dissolved oxygen.
The overall water quality of tributaries of the Pearl
Water quality of the Pearl River waters in 2010
River was excellent. There was no significant change of water quality compared with that of last year. The Shenzhen River was under heavy pollution with main pollutants being ammonia nitrogen, permanganate value and BOD5.
In all rivers of Hainan Province, Wanquan River had excellent water quality. Haidian Stream was under slight pollution. The main pollutant was petroleum.
The water quality of trans-province boundary river sections was excellent. Among 7 sections, 2 met Grade I national surface water quality standard, 3 met Grade II standard, 2 met Grade III standard. There was no signifi cant change of water quality compared with that of last year.
Water quality of the Songhua River waters in 2010
5

2010
The Songhua River Waters The waters of the Songhua River were under slight pollution. Among 42 monitor sections under national control program, 47.6%, 35.7% and 4.8% met Grade I~III, IV or V standard, 11.9% failed to meet Grade V standard. The main pollution indicators were permanganate value, ammonia nitrogen and BOD5.
In general, the mainstream of the Songhua River was under slight pollution. The main pollutants were permanganate value, ammonia nitrogen and petroleum.
There was no evident change of water quality compared with that of last year.
In general, the tributaries of the Songhua River were under slight pollution. The main pollutants were permanganate value, BOD5 and ammonia nitrogen. The water quality had some improvement compared with that of last year.
Among 5 trans-province boundary sections, 2 sections met Grade II water quality standard, 2 sections met Grade III standard and 1 met Grade IV standard.
Water quality of the Huaihe River waters in 2010
The Huaihe River Waters The waters of the Huaihe River were under slight pollution. Among 86 sections under national monitor program, 41.9%, 32.5% and 9.3% met Grade I~III, IV and V standard respectively; 16.3% failed to meet Grade V standard. The main pollutants were BOD5, permanganate value and petroleum.
In general, the mainstream of the Huaihe River was under slight pollution. The water quality had some improvement compared with that of last year.
The tributaries of the Huaihe River were under intermediate pollution. The main pollutants were BOD5, permanganate value and ammonia nitrogen. There was no signifi cant change of water quality compared with that of last year. In the major primary tributaries, the Shiguan River has excellent water quality. The Shihe River and Huanghe River had good water quality. The Honghe River, flood diversion channel of Honghe River, Xifei River, Tuohe River and Kuaihe River were under slight pollution. The Yinghe River was under intermediate pollution and Wohe River was under heavy pollution.
The trans-province boundary river sections were under intermediate pollution. Among 33 river sections, 24.2%, 39.4% and 15.2% met Grade I~III, IV or V quality standard respectively;
21.2% failed to meet Grade V standard. The main pollutants were permanganate value, BOD5 and petroleum. The water quality had some improvement compared with that of last year.
Water quality of Haihe River waters in 2010
6

2010
The Haihe River Waters The Haihe River waters were under heavy pollution. Among 62 sections under national monitor program, 37.1%, 11.3% and 11.3% met Grade I~III, IV or V quality standard respectively; 40.3% failed to meet Grade V standard. The main pollutants were permanganate value, BOD5 and ammonia nitrogen.
In general, the mainstream of the Haihe River was under heavy pollution. The water quality of Dazha section of Haihe River failed to meet Grade V standard and that of Sanchakou section of Haihe River met Grade IV standard. The main pollutants were permanganate value, BOD5 and ammonia nitrogen. There was no significant change of water quality compared with that of last year.
Other major rivers of the Haihe River basin were
under heavy pollution in general. The main pollutants were permanganate value, BOD5 and ammonia nitrogen. There was no signifi cant change of water quality compared with that of last year. In major rivers, the Yongding River had excellent water quality. The Luanhe and Nanyun River had good water quality. The Dasha River, Zhangweixin River, Ziya River, Tuhai River, Beiyun River and Majia River were under heavy pollution.
Trans-province boundary river sections were under heavy pollution. Among 19 such sections, 42.1%, 5.3% and 21.0% met Grade I~III, IV or V quality standard; 31.6% failed to meet Grade V standard. The main pollutants were permanganate value, BOD5 and ammonia nitrogen. There was no signifi cant change of water quality compared with that of last year.
Water quality of the Liaohe River waters in 2010
The Liaohe River Waters In general, the Liaohe River waters were under intermediate pollution. Among 37 sections under national monitoring program, 40.5%, 16.3% and 18.9% met Grade I~III, IV or V quality standard; 24.3% failed to meet Grade V standard. The main pollutants were ammonia nitrogen, permanganate value and petroleum.
In general, the mainstream of the Liaohe River was under slight pollution. The main pollutants were BOD5, petroleum and ammonia nitrogen. The Laoha River had excellent water quality. Dongliao River had good water quality, Xiliao River and Liaohe River were under intermediate pollution. The water quality of the Laoha River had no signifi cant change compared with that of last year. The water quality had some degradation in the Xiliao River but some improvement in the Dongliao River and Liaohe River compared with that of last year.
In general, the tributaries of Liaohe River were under heavy pollution. There was no significant change of water
quality compared with that of last year. Xilamulun River was under slight pollution. The Tiaozi River and Zhaosutai River were under heavy pollution. The main pollutants were permanganate value, BOD5 and ammonia nitrogen.
The Daliao River and its tributaries were under heavy pollution. Shenyang section of the Hunhe River, Anshan section of Taizi River and Yingkou section of Daliaohe River had heavy pollution. The main pollutants were ammonia nitrogen, petroleum and permanganate value. There was some important of water quality compared with that of last year.
The overall water quality of Daling River was good. There was signifi cant improvement of water quality compared with that of last year.
Among the three trans-province boundary sections, 1 section met Grade II standard, 1 met Grade IV standard and 1 failed to meet Grade V standard. There was some improvement of water quality compared with that of last year.
7

2010
Water quality of rivers in Northwest China in 2010
Water quality of rivers in Southwest China in 2010
Water quality of rivers in Zhejiang Province and Fujian Province in 2010
Rivers in Zhejiang Province and Fujian Province The overall water quality was good. Among 31 sections under national monitoring program, 80.6% met Grade I~III quality standard and 19.4% met Grade IV standard. There was some improvement of water quality compared with that of last year.
Rivers in Southwest China The overall water quality was good. Among 17 sections under national monitoring program, 88.2% met Grade I~III standard and 11.8% failed to meet Grade V quality standard. There was some improvement of water quality compared with that of last year.
Rivers in Northwest China The overall water quality was good. Among 28 sections under national monitoring program, 92.8% met Grade I~III quality standard, 3.6% met Grade V quality standard and 3.6% failed to meet Grade V quality standard. There was signifi cant improvement of water quality compared with that of last year.
8

2010
In 26 major lakes (reservoirs) under national control program, 1 met Grade II quality standard, taking up 3.8%; 5 met Grade III standard, taking up 19.2%; 4 met Grade IV standard, taking up 15.4%; 6 met Grade V standard, accounting for 23.1%; 10 failed to meet Grade V standard, taking up 38.5%. The main pollutants were TN and TP. The water quality of big
reservoirs was better than that of big freshwater lakes and lakes in cities.
Among 26 major lakes (reservoirs) under national monitoring program, 1 was under heavy eutrophication, accounting for 3.8%; 2 were under intermediate eutrophication, accounting for 7.7%; 11 were under slight eutrophication, taking up 42.3%. Other lakes (reservoirs) were under mesotrophic state, taking up 46.2%.
Water quality of major lakes in 2010
Nutrition index of major lakes and reservoirs in 2010
Lakes (Reservoirs)
9
TN, TP
The three lakes*
Big freshwater lakes
Urban lakes
Big reservoir
Total
3
9
5
9
26
0
3
0
2
5
19.2
0
0
2
2
4
15.4
1
3
1
1
6
23.1
2
3
2
3
10
38.5
0
0
0
1
1
3.8
0
0
0
0
0
0Percent ( ) * The three lakes refer to Taihu Lake, Dianchi Lake and Chaohu Lake.
0
20
40
60
80
100Nutrition index
Heavy eutrophication
Intermediate eutrophicationSlight eutrophication
Qiandao Lake
Danjiangkou R
eservoir
Miyun R
eservoir
Menlou R
eservoir
Dahuofang R
eservoir
Dongpu R
eservoir
Yuqiao Reservoir
Songhua Lake
Laoshan Reservoir
Kunm
ing Lake
Xihu Lake
Dam
ing Lake
Xuanw
u Lake
Donghu Lake
Bositeng Lake
Erhai Lake
Jingpo Lake
Dongting Lake
Nansi Lake
Poyang Lake
Hongze Lake
Baiyangdian Lake
Dalai Lake
Taihu Lake
Chaohu Lake
Dianchi Lake
2010
Taihe Lake In general, the water quality of the Taihu Lake failed to meet Grade V standard. The major pollutants were TN and TP. The lake was under slight eutrophication. There was no significant change of water quality compared with that of last year.
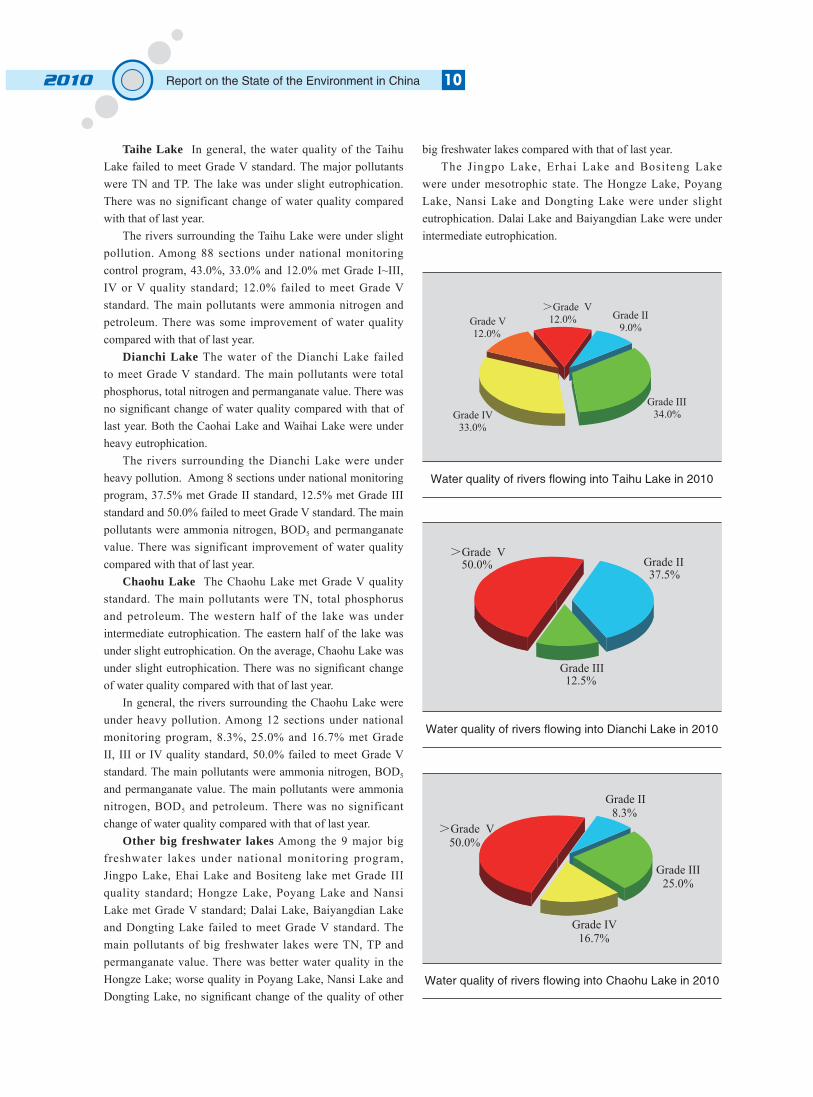
The rivers surrounding the Taihu Lake were under slight pollution. Among 88 sections under national monitoring control program, 43.0%, 33.0% and 12.0% met Grade I~III, IV or V quality standard; 12.0% failed to meet Grade V standard. The main pollutants were ammonia nitrogen and petroleum. There was some improvement of water quality compared with that of last year.
Dianchi Lake The water of the Dianchi Lake failed to meet Grade V standard. The main pollutants were total phosphorus, total nitrogen and permanganate value. There was no signifi cant change of water quality compared with that of last year. Both the Caohai Lake and Waihai Lake were under heavy eutrophication.
The rivers surrounding the Dianchi Lake were under heavy pollution. Among 8 sections under national monitoring program, 37.5% met Grade II standard, 12.5% met Grade III standard and 50.0% failed to meet Grade V standard. The main pollutants were ammonia nitrogen, BOD5 and permanganate value. There was significant improvement of water quality compared with that of last year.
Chaohu Lake The Chaohu Lake met Grade V quality standard. The main pollutants were TN, total phosphorus and petroleum. The western half of the lake was under intermediate eutrophication. The eastern half of the lake was under slight eutrophication. On the average, Chaohu Lake was under slight eutrophication. There was no signifi cant change of water quality compared with that of last year.
In general, the rivers surrounding the Chaohu Lake were under heavy pollution. Among 12 sections under national monitoring program, 8.3%, 25.0% and 16.7% met Grade II, III or IV quality standard, 50.0% failed to meet Grade V standard. The main pollutants were ammonia nitrogen, BOD5
and permanganate value. The main pollutants were ammonia nitrogen, BOD5 and petroleum. There was no significant change of water quality compared with that of last year.
Other big freshwater lakes Among the 9 major big freshwater lakes under national monitoring program, Jingpo Lake, Ehai Lake and Bositeng lake met Grade III quality standard; Hongze Lake, Poyang Lake and Nansi Lake met Grade V standard; Dalai Lake, Baiyangdian Lake and Dongting Lake failed to meet Grade V standard. The main pollutants of big freshwater lakes were TN, TP and permanganate value. There was better water quality in the Hongze Lake; worse quality in Poyang Lake, Nansi Lake and Dongting Lake, no signifi cant change of the quality of other
big freshwater lakes compared with that of last year. The Jingpo Lake, Erhai Lake and Bositeng Lake
were under mesotrophic state. The Hongze Lake, Poyang Lake, Nansi Lake and Dongting Lake were under slight eutrophication. Dalai Lake and Baiyangdian Lake were under intermediate eutrophication.
Water quality of rivers flowing into Taihu Lake in 2010
Water quality of rivers flowing into Dianchi Lake in 2010
Water quality of rivers flowing into Chaohu Lake in 2010
10
Grade V12.0%
Grade II9.0%
Grade III34.0%
33.0%Grade IV
Grade V12.0%
Grade III12.5%
Grade II37.5%
Grade V50.0%
Grade II8.3%
Grade III25.0%
Grade IV16.7%
Grade V50.0%

2010
Water quality of major big freshwater lakes in 2010
Urban Lakes Among the 5 urban lakes under monitoring, the water of Kunming Lake (Beijing) and Donghu Lake (Wuhan) met Grade IV quality standard. Xuanwu Lake (Nanjing) met Grade V standard. Xihu Lake (Hangzhou) and Daming Lake (Jinan) failed to meet Grade V quality standard. The main pollutants of each lake were TN and TP. There
was no significant change of water quality of the five lakes compared with that of last year.
The Kunming Lake was under mesotrophic state, while the Donghu Lake, Xuanwu Lake, Daming Lake and Xihu Lake were under slight eutrophication.
Water quality of urban lakes in 2010
Big Reservoirs Among 9 big reservoirs under monitoring, Miyun Reservoir (Beijing) met Grade II water quality standard, Qiandao Lake (Zhejiang) and Dongpu Reservoir (Anhui) met Grade III standard; Danjiangkou Reservoir (Hubei and Henan) and Yuqiao Reservoir (Tianjin) met Grade IV standard; Songhua Lake (Jilin) met Grade V standard; Menlou Reservoir (Shandong), Dahuofang Reservoir (Liaoning) and Laoshan Reservoir (Shandong) failed to meet Grade V
standard. The main pollutant of the above reservoirs was TN. The water quality of Yuqiao Reservoir turned better, the water quality of Songhua Lake and Dahuofang Reservoir became worse with no signifi cant change of water quality of other big reservoirs compared with that of last year.
Laoshan Reservoir was under slight eutrophication, other reservoirs were under mesotrophic state.
11
Dalai Lake
Baiyangdian Lake
Hongze Lake
Poyang Lake
Nansi Lake
Dongting Lake
Jingpo Lake
Erhai Lake
Bositeng Lake
Permanganate value, TP, TN
Ammonia nitrogen, TP, TN
TP, TN
TP, TN
TP
TP, TN
-
-
-
>V
>V
V
V
V
>V
III
III
III
Intermediate eutrophication
Intermediate eutrophication
Slight eutrophication
Slight eutrophication
Slight eutrophication
Slight eutrophication
Mesotrophic
Mesotrophic
Mesotrophic
65.2
60.3
58.2
51.5
50.7
50.4
43.3
40.6
38.1
Donghu Lake
Xuanwu Lake
Daming Lake
Xihu Lake
Kunming Lake
TP, TN
TN, TP
TN
TN
TN
IV
V
>V
>V
IV
Slight eutrophication
Slight eutrophication
Slight eutrophication
Slight eutrophication
Mesotrophic
57.4
56.2
51.7
51.0
46.4

2010
Water quality of big reservoirs in 2010
Key Water Projects
The Three Gorge Reservoir The water quality of the Three Gorges Reservoir was excellent. In the 6 sections under national monitoring program, 2 met Grade I standard and the rest 4 met Grade II standard.
Waters along the eastern line of South-North Water Diversion Project In general, the waters along the eastern line of the South-North Water Diversion Project were under slight pollution. Among the 10 monitoring sections, 60.0% and 30.0% met Grade I~III or Grade IV standard respectively, while 10.0% failed to meet Grade V standard. Main pollutants were permanganate value, BOD5 and petroleum. The water quality had some improvement compared with that of the last year.
Environment Quality of Groundwater
In 2010, 182 cities across China monitored groundwater quality with a total of 4110 monitoring sites. The analysis results show that 418 sites had excellent water quality, accounting for 10.2% of all monitoring sites; 1135 had good water quality, taking up 27.6%; 206 sites had relatively good quality, taking up 5.0%; 1662 sites had relatively poor water quality, accounting for 40.4%; 689 sites had very poor quality, accounting for 16.8%.
Groundwater quality of our country is not optimistic. The total amount of monitoring sites with excellent – good - relatively good water quality was 1759, accounting for 42.8% of the total; 2351 monitoring sites had relatively poor or very poor water quality, accounting for 57.2%.
The groundwater quality of major cities across the
country was basically stable compared with that of last year. In all major cities, cities with better water quality mainly concentrated on East China, the groundwater quality of only a few cities in North China, Northeast China and Northwest China turned better. The cities with worse groundwater quality mainly concentrated on North China, Northeast China and Northwest China. The groundwater quality of only few cities in East China, central-south part of China and South China became worse.
Water quality of major centralized drinking water sources in key cities
In 2010, 395 centralized drinking water sources were
monitored in 113 key cities on environmental protection across the country, including 245 surface water sources and 150 groundwater sources. Monitoring results indicated 16.85 billion t of water was up to standard among the total annual withdrawal of 22.03 billion t of water in key cities, accounting for 76.5%; whereas 5.18 billion t failed to meet water quality standard, taking up 23.5%.
Dischare of waste water and major pollutants
In 2010, total discharge of waste water was 61.73 billion
t, up by 4.7% compared with that of last year. COD discharge was 12.381 million t, down by 3.1% compared with that of last year. Ammonia nitrogen discharge was 1.203 million t, down by 1.9% compared with that of last year.
12
Laoshan Reservoir
Songhua Lake
Yuqiao Reservoir
Dongpu Reservoir
Dahuofang Reservoir
Menlou Reservoir
Miyun Reservoir
Danjiangkou Reservoir
Qiandao Lake
TN
TN, TP
TN
—
TN
TN
—
TN
—
>V
V
IV
III
> V
> V
II
IV
III
Slight eutrophication
Mesotrophic
Mesotrophic
Mesotrophic
Mesotrophic
Mesotrophic
Mesotrophic
Mesotrophic
Mesotrophic
52.1
49.8
46.1
45.6
45.5
37.8
35.5
35.0
33.1

2010
Total discharge of waste water and major pollutants during 2006-2010
Measures and Actions
【Inter-ministry Meeting on Prevention and control of Water Pollution of Major River Basins】Ministry of Environmental Protection organized and held the Inter-Ministry Meeting on Prevention and Control of Water Pollution of the Three Gorges Reservoir and Its Upper Reaches in Chongqing in June, National Inter-Ministry Meeting on Environmental Protection & Meeting on Prevention and Control of Water Pollution of the Songhua River Basin in Inner Mongolia in July and Meeting on Prevention and Control of Water Pollution of the Haihe River Basin in Beijing in September in order to carry out the “ecological rehabilitation of rivers and lakes” instruction of CPC General Secretary Hu Jintao, facilitate the fulfillment of each task on prevention and control of water pollution during the “11th Five-Year Plan” period and arrange the work on prevention and control of water pollution during the “12th Five-Year Plan” period. These meetings have facilitated all departments and provinces and autonomous regions to form a composition of forces in work; make more efforts in preventing and controlling water quality of key river basins and ensure the achievement of the objectives and tasks of the “11th Five-Year Plan”.
【Assessment on implementation of the plan for prevention and control of water pollution of major river basins in 2010】 According to the requirements of the Circular of the General Office of the State Council on Transmitting the Provisional Measures of Ministry of Environmental Protection and Other Relevant Ministries on Examination of the Implementation of Special Plan for Prevention and Control of Heavy Metal Pollution of Major River Basins, MEP in cooperation with NDRC, Ministry of Supervision, Ministry of Finance, Ministry of
Housing and Urban-Rural Development and Ministry of Water Resources examined the implementation of plan for prevention and control of water pollution in 2010 by the people’s government of 22 provinces (autonomous regions or municipalities) of major river basins such as the Huaihe River, Haihe River, Liaohe River, Songhua River, mid and upper stream of the Yellow River, the Three Gorges Reservoir and its upper reaches, Taihu Lake, Chaohu Lake and Dianchi Lake. In general, the people’s government of each province (autonomous region or municipality) of major river basins has made more efforts in facilitating the implementation of plan for prevention and control of water pollution in major river basins in 2010 with significant progress. The completion rate of planned projects was evidently higher than that of 2009 with further improvement of water quality. The implementation of the plan for prevention and control of water pollution in major river basins during the “11th Five-Year Plan” period is clearly better than that during the “9th Five-Year Plan” and “10th Five-Year Plan” period. The Haihe River basin and Huaihe River basin in Shandong Province, Songhua River basin in Jilin Province, the Three Gorge Reservoir and its upper reaches in Guizhou Province, Songhua River basin in Heilongjiang Province, Haihe River basin and mid and upper reaches of the Yellow River in Henan Province and Liaohe River Basin in Liaoning Province had best implementation of the plan across the country.
【Progress of implementation of the Special Research Project on Prevention and Control of Water Pollution】Based on the Program on Implementation of Key Special Research Project on the Control and Treatment of Water Pollution approved by executive meeting of the State Council, the Special Research Project on Prevention and Control of Water Pollution identifies 238 research projects in 33 programs of six themes focusing on major river basins such as the “three rivers, three lakes, one big river and one reservoir”, 230 research projects in 32 programs have been
13
2006
2007
2008
2009
2010
536.8
556.8
572.0
589.2
617.3
240.2
246.6
241.9
234.4
237.5
296.6
310.2
330.1
354.8
379.8
1428.2
1381.8
1320.7
1277.5
1238.1
541.5
511.1
457.6
439.7
434.8
886.7
870.8
863.1
837.8
803.3
141.3
132.3
127.0
122.6
120.3
42.5
34.1
29.7
27.3
27.3
98.8
98.3
97.3
95.3
93.0

2010
launched during the “11th Five-Year Plan” period. The central government invested 3.21 billion Yuan.
During the “11th Five-Year Plan” period, centering on the milestone objectives of “controlling the source to reduce discharge”, the Special Research Project on Prevention and Control of Water Pollution has made breakthrough in 214 key technologies in areas such as clean production in typical chemical industrial enterprises, up-to-the-standard waste water discharge of light industry, water conservation of heavy-polluting smelting industry, source control and removal of toxic substances in textile printing & dyeing industry, and reduction of high-concentration organic matters of pharmaceutical industry, which have demonstrated in 70 large projects. Demonstration work has been conducted in major river basins such as the Liaohe River, Haihe River and Songhua River. Primary breakthrough has been made in major technologies such as ecological recycling and utilization of waste from livestock and fowl breeding farms as well as control of pollution from non-point farmland sources, which have been demonstrated in river basins such as the Taihu Lake and Erhai Lake with evident achievements. Research and development and demonstration projects on key technologies such as tertiary removal of nitrogen and phosphorus in urban sewage, treatment and disposal of sludge, clean production and pollution control in industrial parks (zones) have been conducted in some typical cities. The technology has been extended in 500 cities for upgrading and reform of urban sewage treatment plant, the total capacity was nearly 15 million t/day with annual reduction of 160,000 t COD, 54000 t ammonia nitrogen and 14000 t TP. Relevant institutes have made breakthrough in over 40 key technologies ensuring the safety of drinking water such as purifi cation of contaminated raw water, safe distribution by pipes and network, which have provided support to technical reform of water plants
for meeting the standard and response to sudden water pollution accidents. In view of low import substitution rate of the equipment such as water environment monitoring, sludge treatment and water treatment, relevant institutes have developed 50 commercial key technologies and equipment that are in urgent need in our country. The output of environmental protection industry has reached about 4 billion Yuan. We have primarily developed two technical systems for key river basins, one is treatment of water pollution and the other management of water resources. We have developed and systematically integrated key technologies for emission reduction by industrial restructuring, pollution control projects and management, which have provided technical support to reduction of major pollutants and control of water pollution of key river basins.
【Prevention and control of heavy metal pollution】 According to the Circular of the General Office of the State Council on Transmitting the Guidance of Ministry of Environmental Protection and Other Relevant Ministries on Strengthening Prevention and Control of Heavy Metal Pollution, MEP has actively facilitated each activity on prevention and control of heavy metal pollution. It has developed the Plan for Comprehensive Prevention and Control of Heavy Metal Pollution, identifi ed the objectives, tasks and measures during the “12th Five-Year Plan” period; made more efforts in environmental law enforcement; carried out special environmental protection campaigns and firmly cracked down environmental infringements of enterprises with heavy metal pollution. It has set up the coordination mechanism for prevention and control of heavy metal pollution; carried out measures of relevant departments; strictly implemented environmental impact assessment system; prevented environmental pollution at the sources; and properly handled heavy metal pollution accidents. It has ensured public rights,
14
Municipal Utilities Construction
City landscaping At the end of the year 2010, the green area in the built areas of cities reached 1.615 million hectares, and the green coverage of built areas went up from 38.2% in the previous year to 38.7%. The landscaping green area in built areas was up to 1.446 million hectares, and the green coverage rose from 34.2% in the previous year to 34.6%. The green area of city parks nationwide covered 442,000 hectares, and the per capita green area in the parks was up to 11.17 m2, up by 0.51 m2 compared with that of last year.
City appearance and environmental sanitation In 2010, the urban roads being swept and cleaned reached 4.86 billion m2, the cleaned and transported municipal wastes were up to 160 million tons, and the feces was 20 million tons. There were 627 plants for environmentally sound treatment of municipal wastes, with treatment capacity being up to 394,000 t/d. There were 119,379 public toilets and 90,557 vehicles and equipment for maintaining city appearance and environmental sanitation.

2010
Environmental Supervision and Inspection
In 2010, nine departments under the State Council launched nationwide thematic campaigns on treating illegal dischargers and safeguarding the public health, with the emphasis on prominent environmental problems that had adverse impact on the public health and sustainable development. Over 2.66 million person•times of environmental supervisors were mobilized during the campaigns, inspecting 1.06 million unit•times of companies, investigated 10,278 environmental violation cases, and supervised the settlement of 1,980 typical cases on the blacklist. In November 2010, eleven joint supervision groups consisting members from nine departments under the State Council inspected the thematic campaigns organized by 11 provinces (autonomous regions), gave feedback to local governments on 68 environmental pollution problems and came up with 46 recommendations.
On the basis of the intensive inspection on heavy metal dischargers in 2009, local areas seriously implemented the Circular of the General Offi ce of the State Council on Forwarding the Guiding Opinions of Ministry of Environmental Protection and Other Departments on Strengthening the Prevention and Control of Heavy Metal Pollution, and organized the drafting of the plan for prevention and control of heavy metals. In 2010, there were 11,515 heavy metal dischargers, up by about 20% from the previous year. Efforts were made to investigate 1,731 companies violating environmental laws and regulations concerning construction projects and 373 companies violating regulations on hazardous waste management, and phase out 337 companies with ineffi cient processes and equipment. Site supervision was conducted on 503 heavy metal dischargers in 41 prefectural-level cities in 14 key provinces (autonomous regions), and put on the blacklist and supervised the settlement of two regional environmental violation cases and eight cases concerning environmental violations by companies.
Local areas further consolidated the achievements made in the pollution reduction during the 11th Five-Year Plan period. At the start of 2010, supervision was under way on 461 pulp and paper mills in 14 provinces (autonomous regions), and fi ve regions and nine paper mills were put on the blacklist because of environmental violations. Local areas inspected 4,838 iron and steel and cement producers which had overcapacities and redundant construction, and ordered 359 companies which violated the environmental standards or exceeded total pollutant load to correct within a specifi c period of time.
Local areas also conducted post-supervision on 2,441 environmental violation cases that were identifi ed in the thematic campaigns on environmental protection since the year 2009, which effectively prevented the pollution from coming back. Post-supervision was also conducted on the correction of key pollution sources under national monitoring program, of municipal wastewater treatment plants, of and companies discharging excessive major pollutants in 2009, and efforts were made to investigate and punish 57 companies discharging excessive sulfur dioxide, 74 companies discharging excessive chemical oxygen demand, 19 municipal wastewater treatment plants discharging excessive chemical oxygen demand, and 136 companies that discharged excessive pollutants of other kinds. The Measures on the Post-supervision on Environmental Administrative Enforcement was promulgated, setting standards for the post-supervision work.
improved laws, regulations and standards as well as relevant environment economic policies.
【Monitoring of water quality of rural collective water supply projects】 The monitoring scope has been under continuous increase since 2008 when water quality of rural collective water supply project was monitored, the amount of counties (districts, cities) monitoring the water quality increased from 1520 to 1726 in 2010, and amount of monitoring water samples going up from 106087 to 116007. The monitoring items have been increased and the accuracy, timeliness and relevance of monitoring have clear
improvement. Health department at all levels have taken initiative to strengthen the communications with water resource, development & reform and fi nance departments and continuously improved monitoring report and publication system. With efforts, local governments at all levels have clearly paid more attention to the safety of rural collective water supply projects. The have taken strong measures in construction and operational management of such projects and facilitated water supplying institutions to improve protection of water sources and water treatment technology and carried out disinfection activities.
15

2010
Environmental quality conditions in fishery waters
In 2010, the national fi shery eco-environment monitoring network monitored 18 items including water quality, sediments, and biological species in 116 key fi shery waters and 34 national conservation areas of aquatic germplasm resources in Bohai Sea, Yellow Sea, East China Sea, South China Sea, Heilongjiang Basins, Yellow River Basins, Yangtze River Basins, Pearl River Basins, and other key regions. The monitored area reached 19.25 million hectares. The results indicated that the general eco-environmental conditions in China remained stable, but some of the fi shery waters were still badly polluted, with the major pollution indicators being nitrogen, phosphor, oils and copper.
The spawning sites, feeding sites, migration routes, and nature reserves of major marine fi shes, shrimps, shellfi sh, and algae were polluted by inorganic nitrogen, active phosphate, and oils. The pollution by inorganic nitrogen and active phosphate was relatively serious in some fi shery waters in East China Sea and Pearl River estuaries, while oil pollution was relatively serious in Bohai Bay and Yangtze River estuaries. The major seawater aquaculture region was polluted by inorganic nitrogen and active phosphate. Some aquaculture waters in South China Sea suffered from relatively serious pollution by inorganic nitrogen, while some aquaculture waters in Yellow Sea saw fairly bad pollution by active phosphate. The sediments in key marine fi shery waters were mainly polluted by oils and copper. Oil pollution was relatively serious in some of the fi shery waters in South China Sea, and copper pollution was relatively serious in some of the fi shery waters in East China Sea and Pearl River estuaries. Some regions of national (marine) conservation areas of aquatic germplasm resources suffered from pollution by inorganic nitrogen, active phosphate, and oils, while some regions of national (freshwater) conservation areas of aquatic germplasm resources suffered from pollution by total nitrogen and permanganate index.
Key fi shery waters in rivers were mainly polluted by total phosphor, non-ionic ammonia, permanganate index and copper. Some of the fi shery waters in Yellow River basins, Yangtze River Basins, and Heilongjiang River Basins saw relatively bad pollution by total phosphor, some of the fi shery waters in Yellow River Basins and Yangtze River Basins were polluted by non-ionic ammonia, permanganate index pollution was relatively serious in some of the fi shery waters in Heilongjiang River Basins, and some of the fi shery waters in Yellow River Basins and Yangtze River Basins suffered from bad copper pollution. Compared with the previous year, there was excessive permanganate index in larger areas, but fewer areas saw excessive total phosphor, non-ionic ammonia, oils, copper and cadmium.
Key fi shery waters including lakes and reservoirs were mainly polluted by total nitrogen, total phosphor, permanganate index, and oils, and the pollution from total phosphor and total nitrogen was relatively serious. Compared with the previous year, larger areas had excessive total nitrogen, total phosphor, permanganate index, oils, volatile phenol and copper.
16
International Year of Biodiversity
The year 2010 was identifi ed by the United Nations as the International Year of Biodiversity, with the theme of “Biodiversity is life, Biodiversity is our life”.
The Chinese Government highly valued the International Year of Biodiversity, and established in March 2010 the China National Committee for 2010 International Year of Biodiversity, with Vice Premier Li Keqiang as the chairman and leading officials from 25 ministerial departments as members. Plan of Action in China in International Year of Biodiversity was announced after being considered and adopted by the National Committee, and more than 20,000 activities were organized to disseminate the significance and achievements in biodiversity conservation in China and raise the awareness of local governments and the public. More than 5 million pieces of publicity materials were distributed to 920 million person•times.
Thanks to the publicity campaigns, local areas were more aware of the importance of biodiversity conservation and the public awareness was also raised, and the international community gave full recognition to China’s conservation efforts. So, China’s actions in the International Year of Biodiversity were quite fruitful.

2010
Marine Environment
General Situation
In general, coastal sea waters across China were under slight pollution.
In 2010, a total of 279225 km2 of coastal marine waters were monitored, 177825 km2 of them met Grade I~II marine water quality standard, 44614 km2 met Grade III standard, and 56786 km2 met or failed to meet Grade IV standard
Monitoring results showed that 62.7% met Grade I~II marine water quality standard, down by 10.2 percentage points compared with that of 2009; 14.1% met Grade III standard, up by 8.1 percentage points; 23.2% met or failed to meet Grade IV standard, up by 2.1 percentage points compared with that last year.
In the coastal marine waters of the four seas, the water quality of South China Sea and Yellow Sea was good; the Bohai Sea had poor water quality, while the East China Sea had very poor quality. The water of the Beibu Bay and the Yellow River estuary was excellent; the water quality of Jiaozhou Bay was okay; the water quality of Liaodong Bay
was poor; Bohai Bay, Yangtze River estuary, Hangzhou Bay, Minjiang estuary and Pearl River estuary had very poor water quality. The percent of marine waters of Jiaozhou Bay meeting Grade I~II standard went up by 25.0 percentage points compared with that of last year. The percent of marine waters of Bohai Bay, Yangtze River estuary and Pearl River estuary meeting Grade I~II standard went down by over 20.0 percentage points. The water quality of other bays was basically same as that of last year.
The Bohai Sea The quality of coastal waters of Bohai Sea was poor and under intermediate pollution. 55.1% met Grade I~II marine water quality standard, down by 16.3 percentage points compared with that of last year; 20.4% met Grade III standard, up by 12.2 percentage points; 24.5% met or failed to meet Grade IV standard, up by 4.1 percentage points. The main pollutants were inorganic nitrogen, petroleum, lead and cadmium.
The Yellow Sea The quality of coastal waters of Yellow Sea was good. 87.0% met Grade I~II marine water quality standard, down by 3.7 percentage points compared with that of last year; 7.4% met Grade III standard, same as in last year. 5.6% met or failed to meet Grade IV standard, up by 3.7 percentage points. The main pollutants were inorganic nitrogen and active phosphate.
The East China Sea The quality of coastal marine waters of East China Sea was very poor, which are under heavy pollution. 30.6% met Grade I~II marine water quality standard, down by 14.6 percentage points compared with that of last year; 18.9% met Grade III standard, up by 11.5 percentage points; 50.5% met or failed to meet Grade IV standard, up by 3.1 percentage points. The main pollutants were inorganic nitrogen and active phosphate.
The South China Sea The quality of coastal waters of South China Sea was good. 84.0% met Grade I~II marine water quality standard, down by 6.1 percentage points compared with that of last year; 10.0% met Grade III standard, up by 7.0 percentage points; 0% met Grade IV standard; 6.0% failed to meet Grade IV standard, down by 0.9 percentage point. The main pollutants were inorganic nitrogen and active phosphate.
Marine water quality
Water quality of coastal sea areas
17
Grade I31.5%
Grade III14.1%
Grade IV4.7%
Grade II31.2%
Grade IV18.5%

2010
Water quality distribution of China’s coastal sea in 2010
18

2010
Sediment status of 289 monitoring sites of coastal waters of China was monitored in 2010 with monitoring indicators including petroleum, mercury, cadmium, lead, arsenic, polychlorinated biphenyl, sulfides and organic carbon and so on. The monitoring results show that the overall sediment status in coastal marine waters was good, over 91% monitoring sites with indicators meeting Grade I marine sediment quality standard. The petroleum concentration of the sediments of only individual monitoring sites such as Qingduizi Bay and
Percent of GradeⅠ&Ⅱ water of the 4 big seas Percent of GradeⅣ or worse water of the 4 big seas
Sediment of coastal sea areas
Land-based pollutants
Water quality of the monitoring sections of sea-oriented rivers in 2010
Total amount of each kind of pollutants from sea-oriented rivers in 2010
19
Sea-oriented rivers The overall quality of 192 sections of the sea-oriented rivers was relatively poor. The amount of pollutants from rivers to sea was more than the amount of pollutants directly discharged into sea waters. The total in-fl ow amount of river pollutants to the East China Sea far exceeded that of other sea areas.
Changjiang’ao in Liaoning Province, north bank of Hangzhou Bay of Zhejiang Province and Funing Bay of Fujian Province failed to meet Grade III marine sediment quality standard.
0
25
50
75
100
Perc
ent %
BohaiSea
YellowSea
East ChinaSea
South ChinaSea
2009 2010
0
25
50
75
1002009 2010
Perc
ent %
BohaiSea
YellowSea
East ChinaSea
South ChinaSea
The Bohai Sea
The Yellow Sea
The East China Sea
The South China Sea
Total
0
1
0
0
1
0
3
0
10
13
9
15
5
21
50
4
16
7
20
47
7
5
6
8
26
28
13
7
7
55
48
53
25
66
192
The Bohai Sea
The Yellow Sea
The East China Sea
The South China Sea
Total
156
290
2427
1091
3964
35
45
394
183
657
2.3
4.0
28.8
17.0
52.1
3.6
8.4
189.0
35.6
236.7
2010
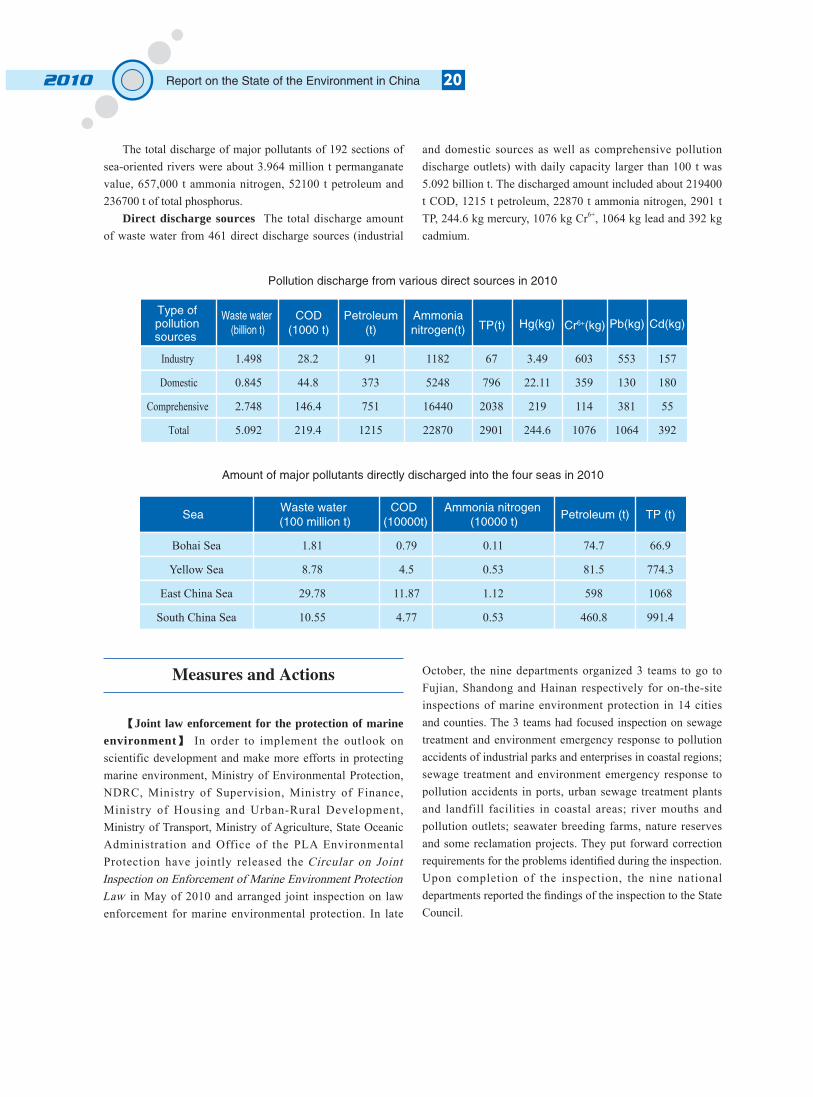
The total discharge of major pollutants of 192 sections of sea-oriented rivers were about 3.964 million t permanganate value, 657,000 t ammonia nitrogen, 52100 t petroleum and 236700 t of total phosphorus.
Direct discharge sources The total discharge amount of waste water from 461 direct discharge sources (industrial
and domestic sources as well as comprehensive pollution discharge outlets) with daily capacity larger than 100 t was 5.092 billion t. The discharged amount included about 219400 t COD, 1215 t petroleum, 22870 t ammonia nitrogen, 2901 t TP, 244.6 kg mercury, 1076 kg Cr6+, 1064 kg lead and 392 kg cadmium.
Pollution discharge from various direct sources in 2010
Amount of major pollutants directly discharged into the four seas in 2010
Measures and Actions
【Joint law enforcement for the protection of marine environment】 In order to implement the outlook on scientific development and make more efforts in protecting marine environment, Ministry of Environmental Protection, NDRC, Ministry of Supervision, Ministry of Finance, Ministry of Housing and Urban-Rural Development, Ministry of Transport, Ministry of Agriculture, State Oceanic Administration and Office of the PLA Environmental Protection have jointly released the Circular on Joint Inspection on Enforcement of Marine Environment Protection Law in May of 2010 and arranged joint inspection on law enforcement for marine environmental protection. In late
October, the nine departments organized 3 teams to go to Fujian, Shandong and Hainan respectively for on-the-site inspections of marine environment protection in 14 cities and counties. The 3 teams had focused inspection on sewage treatment and environment emergency response to pollution accidents of industrial parks and enterprises in coastal regions; sewage treatment and environment emergency response to pollution accidents in ports, urban sewage treatment plants and landfill facilities in coastal areas; river mouths and pollution outlets; seawater breeding farms, nature reserves and some reclamation projects. They put forward correction requirements for the problems identifi ed during the inspection. Upon completion of the inspection, the nine national departments reported the fi ndings of the inspection to the State Council.
20
Industry
Domestic
Comprehensive
Total
1.498
0.845
2.748
5.092
28.2
44.8
146.4
219.4
91
373
751
1215
1182
5248
16440
22870
67
796
2038
2901
3.49
22.11
219
244.6
603
359
114
1076
553
130
381
1064
157
180
55
392
Bohai Sea
Yellow Sea
East China Sea
South China Sea
1.81
8.78
29.78
10.55
0.79
4.5
11.87
4.77
0.11
0.53
1.12
0.53
74.7
81.5
598
460.8
66.9
774.3
1068
991.4

2010
Major environmental pollution incidents nationwide
There were 156 environmental emergencies reported and properly handled in 2010, down by 8.78% from the previous year. There were fi ve major environmental incidents, 41 big incidents, 109 common incidents, and one incident to be rated.
From the perspective of the causes of the incidents, there were 69 environmental incidents caused by work safety, accounting for 44.2% and six more than the previous year; 28 incidents caused by traffi c accidents, accounting for 18.0% and 24 less than last year; 17 incidents caused by pollution discharge by companies, accounting for 10.9% and six less than last year; 42 incidents caused by natural disasters and other factors, accounting for 26.9% and nine more than the previous year.
From the perspective of pollution types, there were 65 water pollution incidents, 66 air pollution incidents, four soil pollution incidents, 10 marine pollution incidents, one noise pollution incidents, and ten incidents without causing pollution.
21
International cooperation on environmental protection
In 2010, China made great achievements in international cooperation on environmental protection, which played an active role in facilitating the healthy development of the foreign relations and advancing the development of the international cooperation on environmental protection in China.
The international cooperation on environmental protection was very active in the year 2010. The Party and State Leaders attended for several times the foreign activities concerning environmental protection, and environmental cooperation became an integral part of high-profi le government affairs. President Hu Jintao was present when China and South Africa signed the intergovernmental agreement on environmental cooperation and attended the Nuclear Security Summit. The 2010 Annual General Meeting of China Council for International Cooperation on Environment and Development was concluded with success, and Premier Wen Jiabao and Vice Premier Li Keqiang made important instructions at the meeting. Environment ministers of many countries visited China during the 2010 Shanghai World Expo, and MEP leaders met with their counterparts on 19 occasions on the sidelines of the Expo.
The international cooperation on environmental protection was very fruitful. New areas of cooperation including environment law were opened for China and the U.S., and the Chinese and U.S. environment ministers visited each other this year. The third session of China-U.S. environmental cooperation joint committee was held successfully and joint declaration was released, and the second China-U.S. forum on environmental industries was organized. The environmental cooperation between China and Russia evolved from crisis response to all-dimensional, in-depth, and multi-area cooperation, and the bilateral environmental cooperation was regarded by the State leaders of both countries as “an example for China-Russia cooperation”. In the incident caused by chemical material barrels fl ushed into Songhua River, China shared the emergency information with Russian side as soon as possible and the move was spoken highly by the Russian side. MEP Minister Zhou Shengxian won the “Presidential Award of the Russian Federation”. The proposal put forward by China at the Tripartite Environment Ministers’ Meeting among China, Japan and South Korea on establishing e-waste cooperation mechanism was adopted in the declaration of the tripartite summit. The first and largest-scale overall evaluation by International Atomic Energy Agency on China’s nuclear and radiation safety supervision work was completed successfully. China was represented at the COP 5 of Cartagena Protocol on Biosafety and the COP 10 of the Convention on Biological Diversity. Breakthroughs were made in environmental cooperation between China and Kazakhstan, and the texts of Water Quality Agreement and Environmental Protection Agreement were nailed down, opening a new chapter for the bilateral cooperation. China-ASEAN Environmental Cooperation Center was established, and the environmental cooperation between China and ASEAN countries ushered in a new stage.

2010
Progress in Environmental Satellite Work
The environmental satellites A and B have been in normal operation since they were launched smoothly in September 2008. By the end of 2010, the received data had reached 415,000 pictures and data volume had been up to 57.5 T. In 2010, the work related to environmental satellites had administration as its guidance, the application as its core, the scientifi c research as its basis, and the development as its instruments, and provided free-of-charge satellite data for 50-odd entities; the provided data reached 18,000 pictures and the data volume was 6.5T. The applicable areas of remote sensing technology were being expanded, and dynamic monitoring was conducted on a regular basis on the blue algae blooms in Taihu Lake, Chaohu Lake, and Dianchi Lake, in order to reflect in a timely fashion the occurrence and changes in blue algae blooms. Monitoring by remote sensing technology was conducted on a daily basis on the incineration of stalks across the country, and the monitoring results were shared with the public via the government portal of MEP. Priority was given to monitoring the stalk incineration in the Yangtze River Delta and Pearl River Delta during the Shanghai World Expo and Guangzhou Asian Games. The human activities were verifi ed by remote sensing technology in over 80 national nature reserves, and remote sensing monitoring was available in mineral resource development areas including Muli Mine in Qinghai Province and Yushenfu Mine in Shaanxi Province. Remote sensing technology was also applied in many proposed nuclear power projects and their proposed sitings, as well as the discharge of warm water from Dayawan and Tianwan nuclear stations. In the occasions of the environmental emergencies including the oil spill in Dalian New Port, the chemical barrels fl ushed into Songhua River, the mud and rock fl ow in Zhouqu County, the earthquake in Yushu Prefecture, the sandstorm in the northern China, yellow-green algae in Lake Wuliangsuhai, Entermorpha prolifera in Yellow Sea, and abnormal water colors in Guanting Reservoir, remote sensing data were got access to from multiple sources including the environmental satellites and unmanned aircrafts, and the emergency monitoring and evaluation was conducted as soon as possible with remote sensing technology. Moreover, remote sensing monitoring and evaluation was also conducted on the tailings dam in Guizhou Province, remote sensing inspection was carried out on the construction of hydropower stations in Songhua River Basins, and remote sensing technology was used to evaluate the ecological health of typical regions such as the sources of three major rivers, and Liaohe river basins.
Survey on the public satisfaction with environmental conditions
The survey on the public satisfaction with environmental conditions was conducted nationwide in 2010 after the one in the previous year, in order to keep track of the public feelings and evaluation of China’s environmental conditions and change in trends. Questionnaire was distributed to nearly 6,000 urban and rural recipients in 31 provinces (autonomous regions and municipalities directly under the Central Government).
The survey indicated that air pollution, water pollution and solid waste pollution remained the most public concerned environmental problems. The survey found that 69.1% of the urban recipients and 58.3% of the rural recipients of the questionnaire rated “satisfactory” or “relatively satisfactory” with the ambient environmental conditions, up by 9.8 and 10.3 percentage points than those in the previous year. Of all the environmental factors, drinking water quality was considered most satisfi ed by urban recipients, while air quality was deemed most satisfi ed by rural recipients. Garbage clean-up ranked the lowest in the satisfaction scale by both urban and rural recipients. The urban and rural recipients in Northeast China topped the country in terms of satisfaction with the overall environmental conditions.
In terms of the satisfaction with the improvement in environmental conditions, 75.3% of the urban recipients were “satisfi ed” or “relatively satisfi ed” with the improvement in the ambient environment, up by 9.8 percentage points than the previous year; while 60.1% of rural residents said so, up by 2.2 percentage points from the last year. From the perspective of regions, the urban recipients in Southwest China were most satisfi ed with the improvement in environmental qualities; rural recipients in Northeast China said so; and urban and rural recipients in North China were least satisfied with the improvements in environmental conditions.
22
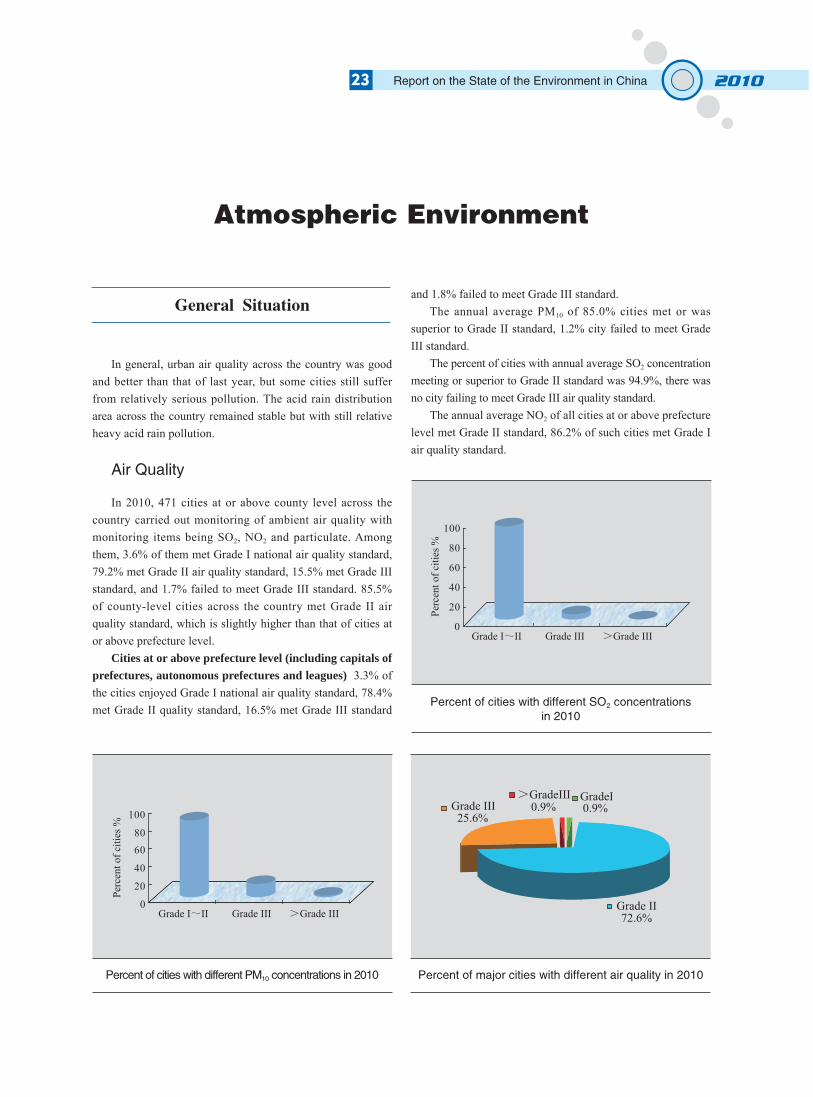
2010
In general, urban air quality across the country was good and better than that of last year, but some cities still suffer from relatively serious pollution. The acid rain distribution area across the country remained stable but with still relative heavy acid rain pollution.
In 2010, 471 cities at or above county level across the country carried out monitoring of ambient air quality with monitoring items being SO2, NO2 and particulate. Among them, 3.6% of them met Grade I national air quality standard, 79.2% met Grade II air quality standard, 15.5% met Grade III standard, and 1.7% failed to meet Grade III standard. 85.5% of county-level cities across the country met Grade II air quality standard, which is slightly higher than that of cities at or above prefecture level.
Cities at or above prefecture level (including capitals of prefectures, autonomous prefectures and leagues) 3.3% of the cities enjoyed Grade I national air quality standard, 78.4% met Grade II quality standard, 16.5% met Grade III standard
Atmospheric Environment
General Situation
Air Quality
Percent of cities with different PM10 concentrations in 2010
Percent of cities with different SO2 concentrationsin 2010
and 1.8% failed to meet Grade III standard. The annual average PM10 of 85.0% cities met or was
superior to Grade II standard, 1.2% city failed to meet Grade III standard.
The percent of cities with annual average SO2 concentration meeting or superior to Grade II standard was 94.9%, there was no city failing to meet Grade III air quality standard.
The annual average NO2 of all cities at or above prefecture level met Grade II standard, 86.2% of such cities met Grade I air quality standard.
Percent of major cities with different air quality in 2010
23
0
20
40
6080
100
Perc
ent o
f citi
es %
Grade I II Grade III Grade III
0
20
40
60
80
100
Perc
ent o
f citi
es %
Grade I II Grade III Grade III
Grade II72.6%
Grade III25.6%
GradeI0.9%
GradeIII0.9%

2010
Key cities The urban air quality of 113 major cities on environmental protection had some improvement. 0.9% of them met Grade I national air quality standard, 72.6% met Grade II standard, 25.6% met Grade III standard and 0.9% failed to meet Grade III standard. The percent of cities meeting Grade II standard went up by 6.2 percentage points compared with that of last year.
In 2010, the average NO2 and PM10 concentrations of key cities on environmental protection had slight increase compared with that of last year, while the average SO2 level had some reduction.
Acid rain frequency In 494 cities (counties) under monitoring, 249 cities (counties) had acid rain, taking up 50.4%. 160 cities had acid rain frequency over 25%, taking up 32.4%;
Year-on-year comparison of pollutant concentration of major cities
Acid Rain
Statistics of acid rain frequencies in China in 2010
Percent of cities with different acid rain frequencies Percent of cities with different annual average pH value of precipitation
Precipitation acidity The proportion of cities with acid rain (the annual average pH of precipitation < 5.6) went down by 3.1 percentage points compared with that of last year, the proportion of cities with relatively serious acid rain (the
annual average pH of precipitation < 5.0) and serious acid rain (the annual average pH of precipitation <4.5) basically remained the same as that of last year.
Statistics of annual average pH values of precipitation in 2010
24
54 had acid rain frequency over 75%, accounting for 11.0%.
0.00
0.02
0.04
0.06
0.08
0.10
SO2 NO2 PM10
Con
cent
ratio
n(m
g/m
3 ) 2009 2010
0%
10%
20%
30%
40%
Perc
ent o
f citi
es
Frequency≥25% Frequency≥50% Frequency≥75%
2009 2010
0%
10%
20%
30%
40%
pH<5.6 pH<5.0 pH<4.5
2009 2010
Perc
ent o
f citi
es
Amount of cities
Percent (%)
54
11.0
49
9.9
57
11.5
89
18.0
245
49.6
Amount of cities
Percent (%)
80
16.2
238
48.2
69
14.0
65
13.1
42
8.5

2010
Acid rain distribution Acid rain was mainly distributed to the south of Yangtze River and to the east of Qinghai-Tibet Plateau, including most areas in Zhejiang, Jiangxi, Hunan and Fujian, Yangtze River delta, southern part of Anhui, western
part of Hubei, southern part of Chongqing, southeastern part of Sichuan, northeastern part of Guizhou, northeastern part of Guangxi and central part of Guangdong.
Isograms of annual pH value of precipitation in 2010
In 2010, total emission was 21.851 million t for SO2, 8.291 million t for soot, 4.487 million t for industrial dust, down by
1.3%, 2.2% and 14.3% respectively compared with that of last year.
Year-on-year comparison of emissions of major air pollutants in waste gas in China
Emissions of major pollutants in waste gas
25
2006
2007
2008
2009
2010
2588.8
2468.1
2321.2
2214.4
2185.1
2234.8
2140.0
1991.3
1866.1
1864.4
354.0
328.1
329.9
348.3
320.7
1088.8
986.6
901.6
847.2
829.1
864.5
771.1
670.7
603.9
603.2
224.3
215.5
230.9
243.3
225.9
808.4
698.7
584.9
523.6
448.7

2010
【Annual Report on Prevention and Control of Vehicle Pollution in China (2010)】 Ministry of Environmental Protection released the Annual Report on Prevention and control of Vehicle Pollution in China (2010) on November of 2010, which for the fi rst time made public vehicle emissions in China and systematically introduced the progress of prevention and control of pollution by vehicle emissions. The Annual Report says that vehicle emission pollution in China becomes increasingly serious. Vehicle emissions become one of the main sources of air pollution in big and medium sized cities of China. Automobiles are the main contributor to total vehicle emissions, CO and hydrocarbon emissions from vehicles exceed 70%, NOX and PM10 emissions from vehicles exceeded 90% of the total. The environmental management of vehicles in China has made big progress after the development of nearly 30 years. In 2009, individual vehicle emissions of newly manufactured light-duty vehicles went down by over 90% compared with that of 2000. The total vehicle emissions do not grow at the same pace along with rapid growth of the amount of in-service automobiles thanks to rapid implementation of more stringent emission standard. The
Measures and Actionsamount of in-service vehicles grows by 25 times compared with that of 1980, however, the total emissions grows by only 12 times, indicating effective mitigation of the big pressure of increasing automobiles on the environment.
【Joint prevention and control of atmospheric pollution】 The General Office of the State Council distributed the Guidance on Promoting Joint Prevention and Control of Atmospheric Pollution and Improving Regional Air Quality issued by nine national departments including Ministry of Environmental Protection on May 11, 2010, which makes clear the guidance, objectives and main measures for prevention and control of atmospheric pollution in China in the next few years. It is the fi rst comprehensive policy of China on prevention and control of atmospheric pollution. Ministry of Environmental Protection issued the Circular on Development of the “12th Five-Year Plan” for Joint Prevention and Control of Atmospheric Pollution of Major Regions on October 9, 2010. It has decided to launch the development of the “12th Five-Year Plan” for Joint Prevention and Control of Atmospheric Pollution of Major Regions in Yangtze River delta, Pearl River delta, Beijing-Tianjin-Hebei; six city clusters such as Chengdu-Chongqing, central part of Liaoning Province, Shandong Peninsula, Wuhan, Changsha-Zhuzhou-Xiangtan, and western bank of the Taiwan Straight (hereinafter referred to as “three regions and six city clusters”).
National campaign on improving the urban and rural environmental sanitation (2010-2012)
The 2010-2012 Program for National Campaign on Improving the Urban and Rural Environmental Sanitation (hereinafter referred to as the Program) was printed and distributed in May 2010, inaugurating the national campaign on improvement of environmental sanitation conditions in the urban and rural areas. The Program proposed that after a three-year campaign, the environmental sanitation conditions would have been improved, the idea of healthy environment would have been disseminated, the dirty, disorderly, and poor environmental sanitation in the urban and rural areas would have been addressed, the environmental sanitation infrastructure construction would have been strengthened in urban and rural areas especially the rural areas, the sound mechanism for administration on environmental sanitation would have been improved, the integration of urban and rural areas for improving environmental sanitation would have been advanced, and the sanitation awareness, health level and life quality of urban and rural residents would have been enhanced. The specifi c goals as follows would have been met by the end of 2012: the environmentally sound treatment rate of municipal wastes to reach 76%; the municipal wastewater treatment rate to reach 80%; the farmers’ markets that fail to meet with regulatory standards to drop by a half in urban areas; both the municipal waste and wastewater treatment rates to be up by 10%, and the integrated environmental treatment to be completed in 20,000 villages; the up-to-standard rate of drinking water in rural areas to be up by 15%; and the popularization rate of sanitary toilets to be up by 10% in the countryside.
26
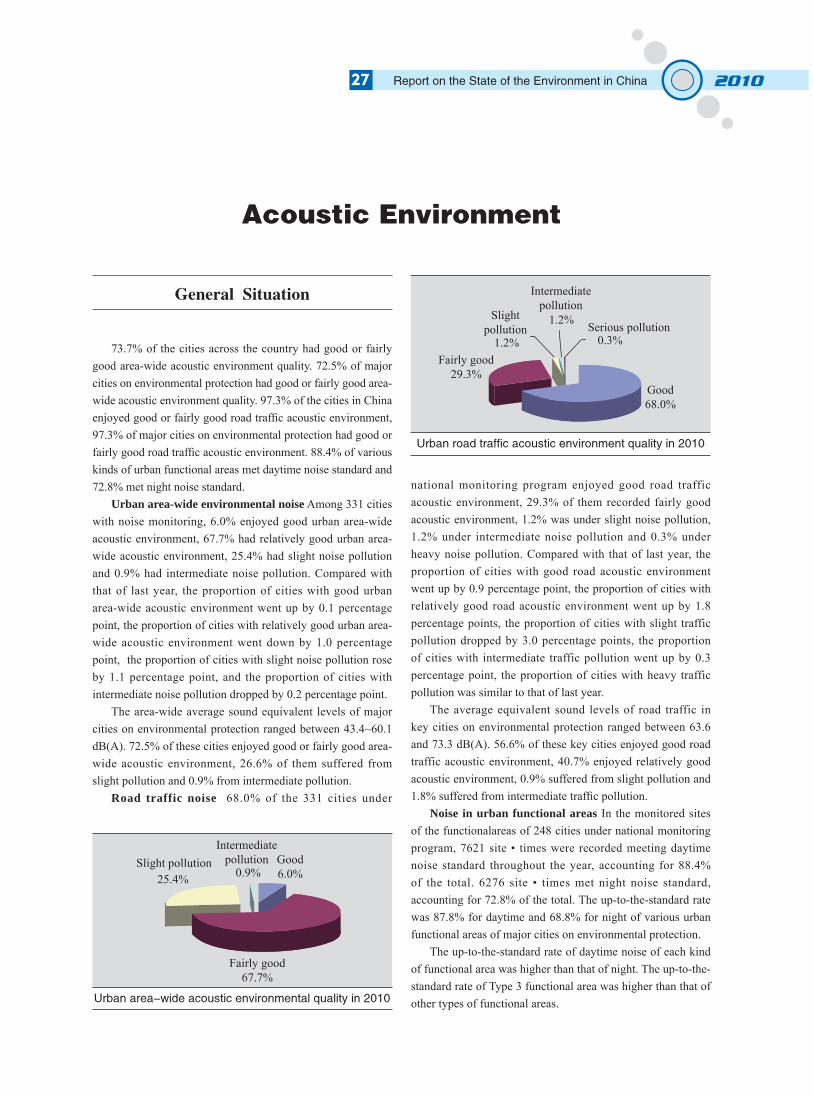
2010
73.7% of the cities across the country had good or fairly good area-wide acoustic environment quality. 72.5% of major cities on environmental protection had good or fairly good area-wide acoustic environment quality. 97.3% of the cities in China enjoyed good or fairly good road traffi c acoustic environment, 97.3% of major cities on environmental protection had good or fairly good road traffi c acoustic environment. 88.4% of various kinds of urban functional areas met daytime noise standard and 72.8% met night noise standard.
Urban area-wide environmental noise Among 331 cities with noise monitoring, 6.0% enjoyed good urban area-wide acoustic environment, 67.7% had relatively good urban area-wide acoustic environment, 25.4% had slight noise pollution and 0.9% had intermediate noise pollution. Compared with that of last year, the proportion of cities with good urban area-wide acoustic environment went up by 0.1 percentage point, the proportion of cities with relatively good urban area-wide acoustic environment went down by 1.0 percentage point, the proportion of cities with slight noise pollution rose by 1.1 percentage point, and the proportion of cities with intermediate noise pollution dropped by 0.2 percentage point.
The area-wide average sound equivalent levels of major cities on environmental protection ranged between 43.4~60.1 dB(A). 72.5% of these cities enjoyed good or fairly good area-wide acoustic environment, 26.6% of them suffered from slight pollution and 0.9% from intermediate pollution.
Road traffic noise 68.0% of the 331 cities under
Acoustic Environment
General Situation
Urban area-wide acoustic environmental quality in 2010
Urban road traffic acoustic environment quality in 2010
national monitoring program enjoyed good road traffic acoustic environment, 29.3% of them recorded fairly good acoustic environment, 1.2% was under slight noise pollution, 1.2% under intermediate noise pollution and 0.3% under heavy noise pollution. Compared with that of last year, the proportion of cities with good road acoustic environment went up by 0.9 percentage point, the proportion of cities with relatively good road acoustic environment went up by 1.8 percentage points, the proportion of cities with slight traffic pollution dropped by 3.0 percentage points, the proportion of cities with intermediate traffic pollution went up by 0.3 percentage point, the proportion of cities with heavy traffic pollution was similar to that of last year.
The average equivalent sound levels of road traffic in key cities on environmental protection ranged between 63.6 and 73.3 dB(A). 56.6% of these key cities enjoyed good road traffic acoustic environment, 40.7% enjoyed relatively good acoustic environment, 0.9% suffered from slight pollution and 1.8% suffered from intermediate traffi c pollution.
Noise in urban functional areas In the monitored sites of the functionalareas of 248 cities under national monitoring program, 7621 site • times were recorded meeting daytime noise standard throughout the year, accounting for 88.4% of the total. 6276 site • times met night noise standard, accounting for 72.8% of the total. The up-to-the-standard rate was 87.8% for daytime and 68.8% for night of various urban functional areas of major cities on environmental protection.
The up-to-the-standard rate of daytime noise of each kind of functional area was higher than that of night. The up-to-the-standard rate of Type 3 functional area was higher than that of other types of functional areas.
27
Fairly good67.7%
Good6.0%
Slight pollution25.4%
Intermediatepollution
0.9%
Fairly good29.3%
Good68.0%
Slightpollution
1.2%
Intermediatepollution
1.2% Serious pollution0.3%

2010
Up-to-the-standard situation of monitoring sites of urban functional areas in 2010
【Prevention and control of noise pollution】 11 national departments including Ministry of Environmental Protection jointly released the Guidance for Strengthening Prevention and Control of Environmental Noise and Improving Urban-Rural Acoustic Environment Quality on
Measures and ActionsDecember 15, 2010, which identifi es current and future tasks and measures for prevention and control of noise pollution in six areas such as “more efforts in prevention and control of noise pollution of major fi elds; enhancement of supervision and management on noise sources; enhancement of management of urban-rural acoustic environment; strengthening capacity building in supervision and management; making good basic conditions; doing well assessment, check, publicity and education activities” .
The first national contest of environmental monitoring technicians
In 2010, MEP, Ministry of Human Resources and Social Security, and All-China Federation of Trade Unions co-organized the fi rst national contest among environmental monitoring technicians (hereinafter referred to as the Contest). The fi nal contest was held in Beijing from September 24 to 26, and 132 contestants from 33 teams representing 31 provinces (autonomous regions and municipalities directly under the Central Government), Xinjiang Production and Construction Corp and the PLA competed in the theoretical examinations and five assignments for practical operations. Ten teams won the group prizes, among others, teams from Henan Province, the PLA, and Jiangsu Province won the fi rst-class group prize, teams representing Shandong Province, Zhejiang Province and Chongqing Municipality won the second-class group prize, and teams from Hunan Province, Shanghai Municipality, Fujian Province and Tianjin Municipality won the third-class prize. Twenty six contestants won individual prizes, including four with the fi rst-class prize, seven with the second-class prize, and 15 with the third-class prize. Winners of individual prizes who already possessed secondary or primary titles were promoted to the higher level by the human resources departments of their regions or departments. The winner topping the fi rst-class winners was awarded by All-China Federation of Trade Unions the “National May Day Medal”. And all the four winners of the fi rst-class prize were granted by MEP and Ministry of Human Resources and Social Security the honorary titles of advanced workers in the national environmental protection system. Meanwhile, fi ve provincial EPBs from Inner Mongolia, Jilin Province, Jiangxi Province, Sichuan Province and Shaanxi Province won the Outstanding Organization Award. The three ministries threw an award party on November 25 for the fi rst national contest among environmental monitoring technicians and for the Green China Person of Year.
This contest was the fi rst of its kind since the environmental monitoring system was established over three decades ago. It was also the fi rst contest participated by technicians nationwide. It was of great signifi cance to improving the overall technical level and quality of environmental monitoring technicians in our country.
28
Up-to-standard site•times
Monitored site•times
Up-to-standard rate (%)
116
193
60.1
105
193
54.4
1687
1969
85.7
1521
1969
77.2
2150
2456
87.5
2024
2456
82.4
1579
1673
94.4
1503
1673
89.8
2089
2334
89.5
1123
2334
48.1

2010
In 2010, the generated industrial solid wastes amounted to 2409.435 million t, up by 18.1% compared with that of last year; 4.982 million t of them were discharged, down by 29.9% compared with that of last year. The comprehensive utilization amount (including some wastes stored in previous
Solid Waste
General Situationyears), storage amount and disposal amount was 1617.72 million t, 239.183 million t and 572.638 million t respectively, accounting for 67.1%, 9.9%, 23.8% of the total generated amount. The generated amount of hazardous waste was 15.868 million t, comprehensive utilization amount (including the use of some wastes stored in previous years), storage amount and disposal amount of such waste was 9.768 million t, 1.663 million t and 5.127 million t respectively.
The generation and disposal of industrial solid waste in China in 2010
Measures and Actions
【 I m p l e m e n t a t i o n o f t h e N a t i o n a l P l a n f o r Construction of Treatment Facilities of Hazardous and Medical Waste】The State Council approved the implementation of National Plan for Construction of Treatment Facilities of Hazardous and Medical Waste (hereinafter referred to as the Plan) in December of 2003 in order to strengthen safe disposal of hazardous and medical waste and ensure public health and environment security. The project under the Plan has been included in the 10 national key environmental protection projects during the “11th Five-Year Plan” period, focusing on construction of collective hazardous and medical waste treatment facilities. It took the establishment of whole-process management mechanism as a guarantee and basic achievement of safe storage and disposal of hazardous waste, medical waste and radioactive waste as the objective.
The implementation of the Plan has made active progress thanks to common efforts of each region and strong support of relevant national departments. Up to the end of 2010, 237 hazardous or medical waste disposal facilities had been
basically constructed or put into operation, 31 construction projects on radioactive waste warehouse have been completed, 4 dioxin monitoring centers had fi nished construction and been put into operation. Over 50% of national and 31 provincial solid waste management centers of 31 provinces (autonomous regions and municipalities) have fi nished construction. With implementation of the Plan, China has developed about 964100 t/y capacity in collective disposal of hazardous waste and 1365 t/day capacity in disposal of medical waste, the disposal capacity for hazardous waste and medical waste has increased by 3.2 times and 9.9 times respectively compared with that of 2003 when the Plan was not implemented.
【Release of information about prevention and control of solid waste pollution of big and medium sized cities】 In 2010, 247 cities made public the information about prevention and control of solid waste pollution of last year. The amount of the cities releasing such information went up by 17 compared with that of last year. Beijing, Tianjin, Shanghai and Chongqing and provinces like Hebei, Shanxi, Inner Mongolia, Jiangsu, Zhejiang, Shandong, Henan, Hunan, Guangdong, Guangxi, Guizhou, Shaanxi and Gansu had good organization with more cities releasing such information.
【Issuance of hazardous waste operation license】 In 2010, China kept on the implementation of the Measures on
29
240943.5 1586.8 161772.0 976.8 23918.3 166.3 57263.8 512.7

2010
the Administration of Hazardous Waste Operation License. Up to the end of 2010, Ministry of Environmental Protection and environmental protection department of 31 provinces (autonomous regions and municipalities) had issued over 1500 operation license for hazardous waste. In 2010, the enterprises with operation license for hazardous waste actually utilized and disposed more than 8 million t hazardous waste. In 2010, Ministry of Environmental Protection supervised the prevention and control of hazardous waste of 30 provinces (autonomous regions and municipalities) and Xinjiang Production and Construction Corps except Tibet with random check on 1394 major organizations with hazardous waste, which has greatly facilitated standardized management of hazardous waste of each region.
【Examination and approval of imported waste】 In 2010, China released the Announcement on release of “Regulations on Environmental Protection of Imported Waste Ships (Trial)” , “Regulations on Environmental Protection of Imported Crushed Plastic Light Disc(Trial)” and “Regulations on Environmental Protection of Imported Waste PET Beverage Bottles (Brick) (Trial)”, which further standardized the review and approval procedures and environmental protection requirements for import of waste ship, crushed plastic light disc and waste PET beverage bottles (brick). The government authority has issued 14413 business licenses for import of solid waste to 2942 enterprises in 2010 which import, process and utilize imported waste. The actual amount of import waste in 2010 was over 48 million t with import of 242 waste ships. The four types of waste with biggest import amount were waste paper, waste plastics, waste metals (including metal and electrical appliance scraps, waste wire & cable and waste motors) and waste iron & steel. China has strengthened the exchange of the information about the control of transboundary movement of waste and cooperation on joint investigation with relevant countries. Information and import and export of waste was exchanged 154 times with other countries during 2010 illegal movement of 47 batches of solid waste to China were prevented.
【E x p o r t o f h a z a r d o u s w a s t e】M i n i s t r y o f Environmental Protection handled 13 applications for export of hazardous waste in 2010. The exported hazardous waste involved electroplating sludge, waste batteries, waste materials of circuit board and waste stripping liquid and so on with total amount of 6980 t. The importing countries included Germany, Canada, Singapore, Japan, Korea and France.
【Management of electronic waste】 In order to ensure smooth implementation of the Regulations on the
Administration on Recycling and Treatment of Waste Electrical and Electronic Products, Ministry of Environmental Protection developed and released a series of supporting policy documents such as Guide for Compilation of Development Plan for Treatment of Waste Electric and Electronic Products, Guide for Examination and Verification on Subsidy for the Enterprises Disposing Waste Electric and Electronic Products, Guide for Waste Electric and Electronic Product Disposing Enterprises to Establish Information Management System and Report Information, Measures on Management of Qualification and Permit for Disposal of Waste Electric and Electronic Products and Guide for Qualifi cation Examination and Permit for Waste Electric and Electronic Product Disposing Enterprises in 2010. Ministry of Environmental Protection in cooperation with relevant departments including NDRC released the Catalogue of Waste Electrical and Electronic Product for Disposal (The First Group) and Some Regulations on Development and Adjustment of the Catalogue of Waste Electrical and Electronic Product for Disposal. MEP and NDRC, Ministry of Industry and Information Technology and Ministry of Commerce have issued the Circular on Organizing the Development of the Plan for Treatment of Waste Electric and Electronic Products (2011-2015).
To carry out “Old for new (trade-in)” policy on household appliances of the State Council, Ministry of Environmental Protection cooperated with relevant departments including Ministry of Commerce and Ministry of Finance to release the Program on the Extension of Old for New Policy of Household Appliances, Measures for the Implementation of Old for New Policy of Household Appliances (Amendment) and Measures on Subsidy for Dismantling of Old Household Appliances Collected from ‘Old for New Policy’. Ministry of Environmental Protection has actively promoted environment-friendly dismantling and treatment of waste household appliances collected from the implementation of “Old for new” policy to prevent their pollution.
【Comprehensive treatment of chromium residues】 Up to the end of 2010, more than 3 million t chromium residues had been disposed across the country. In the chromium residues of the 19 provinces (autonomous regions and municipalities) listed in the Program for Comprehensive Control of Chromium Residue Pollution, 7 provinces (municipalities) such as Hebei, Jiangsu, Zhejiang, Shandong, Hubei, Chongqing and Shaanxi have finished all their chromium residues. The chromium residue treatment facilities in Tianjin and Jilin Province are under construction.
30

2010
There were increasing projects on nuclear facilities and nuclear technology application, and the radiation environment was good across the country in 2010. The environment ionizing radiation level was stable, and no obvious changes occurred in such level in the vicinity of nuclear facilities and projects using nuclear technologies. The environment electromagnetic radiation level was good at large. And such level in the vicinity of electromagnetic radiation facilities witnesses no obvious changes.
Environment Ionizing Radiation The environment γ radiation dose rate, the radioactivity levels of gross α and gross β in aerosol and air precipitum, and the radioactivity of HTO in the air in cities at or above the prefectural level were within the normal range. The radioactivity of radionuclides in the seven major waters (Yangtze River, Yellow River, Pearl River, Songhua River, Huaihe River, Haihe River and Liaohe River), rivers in southwest and northwest China, regions along the routes of the South-to-North Water Diversion Project, rivers in Zhejiang and Fujian Provinces, and major lakes and reservoirs did not change much compared with the monitoring results in previous years. Among others, the radioactivity of natural radionuclides was the same as those monitored during the national survey on natural radioactive levels from 1983 to 1990. The radioactive levels of gross α and gross β in monitored drinking water sources were lower than the limits specified in Standards for Drinking Water Quality (GB5749-2006) . The radioactive levels of artificial radionuclides Sr-90 and Cs-137 in coastal seawaters were within the limits specifi ed in the Sea Water Quality Standard (GB3097-1997). The radioactivity of radionuclides in soils of metropolitan cities and some of the prefectural cities did not change compared with monitoring results in previous years, among others, the radioactive level of natural radionuclide was about the same as those monitored during the national survey on natural radioactive levels from 1983 to 1990.
Environment ionizing radiation in the vicinity of in-service nuclear power plants Nuclear power plants in Qinshan Nuclear Power Base in Zhejiang Province, Dayawan/
Radiation Environment
General SituationLing'ao Nuclear Power Plant in Guangdong Province, and Tianwan Nuclear Power Plant in Jiangsu Province were in safe and normal operation. The annual average γ radiation dose rates (without deducting the response to the cosmic rays) monitored by the consecutive monitoring systems in the vicinities of the above power plants recorded 102.6nGy/h, 122.6nGy/h and 101.0nGy/h respectively, within the natural background levels of their whereabouts. In the air, rainwater, surface water and some life-form samples taken from key residential areas near Zhejiang Qinshan Nuclear Power Base, the radioactivity of Tritium was higher than those before the Base was put into use, so did the Tritium radioactivity in seawaters near the outlets of Guangdong Dayawan/Ling'ao Nuclear Power Plant and Jiangsu Tianwan Nuclear Power Plant. However, their additive doses exposed to the public was far lower than the limits set by the national standards. The radioactivity of radionuclides other than Tritium in the environment media in the vicinity of in-service power plants did not have obvious changes compared with those in previous years.
Environment ionizing radiation in the vicinity of other reactors and nuclear fuel cycle facilities In the vicinities of scientific research institutions such as China Institute of Atomic Energy (CIAE), Institute of Nuclear and New Energy Technology of Tsinghua University, Nuclear Power Institute of China, and Northwest Institute of Nuclear Technology in Shaanxi Province, the γ radiation dose rate, and radioactivity levels of radionuclide in samples of aerosol, air precipitum, surface water, soils and life forms did not have obvious changes compared with the monitoring results in previous years. The radioactive levels of gross α and gross β in drinking groundwater were lower than the limits set by Standards for Drinking Water Quality (GB5749-2006).
The γ radiation dose rate was within the normal range in the vicinity of nuclear fuel cycle facilities like Lanzhou Uranium Enrichment Co., Ltd., Shaanxi Uranium Enrichment Company, Baotou Nuclear Fuel Plant, China Jianzhong Nuclear Fuel Co., Ltd., and the 404 Ltd. of CNNC, as well as Northwest Disposal Site for Low-and Medium-level Radioactive Solid Wastes, Beilong Disposal Site for Low-and Medium-level Radioactive Solid Wastes. Rising level of radionuclide due to the production, processing, storage,
31

2010
treatment and transportation activities of the companies was not observed in the environmental media.
Environment ionizing radiation in the vicinity of uranium mines, metallurgical plants and associated radioactive mines The Radon radioactivity in the ambient air, the radioactivity of gross α in the aerosol and air precipitum, and the radionuclides including Uranium and Radium-226 in ground water and life form samples saw no abnormal levels. However, the mining, metallurgical and processing activities in some associated radioactive mines including Baiyun'ebo Mine affected local environment to some extent.
Environment electromagnetic radiation level in the vicinity of electromagnetic radiation facilities The environment electromagnetic radiation level was generally good. The electromagnetic radiation levels in environmentally sensitive sites around the antennas of mobile communication stations were lower than the limits specified by Regulations for Electromagnetic Radiation Protection (GB8702-88) for public exposure. The power frequency field strength and magnetic induction intensity in the environmentally sensitive sites near the power transmission lines and transformers under the monitoring program were lower than the power frequency evaluation standard for residential areas and the around-the-clock public exposure limits set by the Technical Specifications for Environmental Impact Assessment of Electromagnetic Radiation by the 500kV Ultra-high Pressure Power Transmission and Transformation Projects (HJ/T24-1998).
【Nuclear and radiation safety regulation】Following the principle of “being active and proactive, advancing nuclear power development in an orderly manner, and achieving balanced development”, nuclear power units of varied types were under examination, and construction permits were given to ten such units in 2010, so the construction quality was under control. Standards were set for nuclear safety supervision, and the performance evaluation indicators were worked out. Site supervision and inspection was introduced to the whole process of siting, design, construction, and commissioning of nuclear power plants. Six in-service nuclear power plants were reviewed for major upgrading out of safety concern and the operation experience was feedback. Efforts were made to advance the IT management of national radiation safety system for nuclear technology application, and whole process control and management was exercised for radiation safety licensing as well as the import, export, displacement and transfer of radioactive isotopes. Thematic campaign was organized to treat source blockage incidents of γ irradiation equipment, and treatment of previous radioactive sources was advanced. More efforts were made to build radioactive waste tank in metropolitan cities and by the end of the year 29 provinces (autonomous regions and municipalities directly under the Central Government) had built such tanks.
Measures and Actions
32
Cleaner production audit in key companies
The cleaner production process was advanced in key companies in 2010. The Circular on Further Advancing the Cleaner Production Process in Key Companies was announced, which further identifi ed the goals, tasks and requirements for cleaner production in key companies, proposed to set up a system for releasing the cleaner production situation in key companies, and identifi ed the Catalogue of Classifi ed Management of Cleaner Production in Key Companies.
The scheme for announcement of national key companies with cleaner production was initially set up. The key companies in local areas that had gone through cleaner production audit and passed the check and evaluation were summarized and listed. Two announcements on cleaner production in key companies nationwide were released, sharing with the public the basic information on the 4,396 key companies that had passed the evaluation and check on cleaner production audit.
The annual report on cleaner production in key companies was made public. In order to master the progress made by local key companies in cleaner production, efforts were made to summarize and analyze the information about the cleaner production by local key companies in the year 2010, and the 2009 Report on the Cleaner Production Audit, Evaluation and Check in Key Companies Nationwide was drafted and released.

2010
Implementation of international environmental conventions
Stockholm Convention The fi fth session of the coordination group for the implementation of Stockholm Convention was held, and the coordination mechanism for implementation of environmental conventions was operating orderly. Efforts were made to proofread the Chinese text of the amendments which adding nine new kinds of POPs and to coordinate Hong Kong SAR and Macao SAR to fi nish the Second National Report and report them to the Secretariat of the Convention. Work was under way to collect and analyze samples for fi ve air background sites in order to evaluate for the second time the performance in implementing this convention, and the annual performance evaluation report was prepared. China was represented at the sixth session of the Chemical Review Committee of Stockholm Convention, and the country’s position was safeguarded. Continuous efforts were made to implement relevant international cooperation programs.
Rotterdam Convention The Prior Informed Consent Procedure (PIC) was implemented in accordance with Rotterdam Convention on the Prior Informed Consent Procedure for Certain Hazardous Chemicals and Pesticides in International Trade. Replies were given in the year 2010 to 85 export notices of the EU countries including UK. More than 40 export notices were forwarded to Hong Kong. Investigations were conducted on 10 new kinds of hazardous chemicals to be included in the Convention, and investigation report was drafted. A Chinese delegation attended the sixth session of the Chemical Review Committee of the Rotterdam Convention, and China’s position was safeguarded.
Basel Convention The Basel Convention on the Control of Transboundary Movement of Hazardous Wastes was strictly implemented. The prior informed consent procedure was followed, and the export of hazardous wastes was examined, approved and controlled strictly. Chinese representatives were sent to attend the seventh session of the open-ended working group of the Basel Convention, to negotiate relevant matters.
Joint Convention on the Safety of Spent Fuel Management and on the Safety of Radioactive Waste Management To be well-prepared for the fourth session of COP to the Joint Convention on the Safety of Spent Fuel Management and on the Safety of Radioactive Waste Management (hereinafter referred to as the Joint Convention) to be held in May 2012 in Austria, China renewed the Drafting Committee of the National Report on the Joint Convention, established the second editing committee of the national report, and fi nished the outline and work plan for the second national report on Joint Convention.
Convention on Biological Diversity Since China acceded to the Convention on Biological Diversity, a coordination group was established for the implementation of this convention, and its members increased to 24 departments. Annual meetings were organized and a series of activities were conducted, thus forming the national work mechanism for biological diversity conservation and for implementing this convention. China participated in four meetings relevant to the Convention on Biological Convention in the year 2010.
33
【Monitoring of the radiation environment】The Plan for Evaluation of the Radiation Environment Monitoring Capacity (on trial) was mapped out, and pilot projects were conducted on the evaluation of such capacities of the provincial radiation environment monitoring agencies in Jiangsu, Zhejiang, Beijing, Sichuan, and Guangdong. The national radiation environment monitoring network was in steady operations and accomplished the monitoring tasks of the year with compliment. Efforts were inaugurated to set up supervision-oriented monitoring system in the vicinity of new nuclear power plants. Substantial progress was made
in establishing the national radiation environment auto-monitoring system. And the software, hardware and large-screen display system were installed in the national radiation monitoring data center. Nuclear and radiation security were guaranteed for major events including 2010 Shanghai World Expo and 2010 Guangzhou Asian Games, providing essential supports for securing the nuclear and radiation environment in the venues of these events. Emergency monitoring on radiation environment was deepened, and efforts were made to monitor Xenon isotope, the radioactive inert gas.

2010
Part of the ecosystem functions in the country were improved, but the integral ecosystem functions were still poor, because biodiversity degradation trends were not controlled effectively, the genetic resources were being degraded and lost, and alien invasive species infl icted serious damages. In particular, there were prominent ecological problems caused by the natural factors such as global climate warming in recent years, compounded by artificial reclamation, overgraze, and damages to lands for ecological purposes.
Species and endangered species In 2010, based on the continued efforts to consolidate the achievements in saving and protecting 15 wild fauna and fl ora species, pilot projects were conducted on escorting and monitoring nearly 80 rare and endangered wild animals as well as on the restoration of their habitats, which advanced the optimization of the environment. Continued efforts were also made in artificial breeding of rare and endangered wild animals including the Giant Panda, Crested Ibis, Golden Monkey and cranes. 250-odd wild animal species witnessed growing population thanks to artifi cial breeding. Among others, up to 312 Giant Pandas were in captivity, and the Crested Ibis population increased from over 800 to over 1,600. Work continued to return Elaphurus davidianus and mustang to the nature and the returning of Cervus elaphus yarkandensis and Tragopan caboti started. International cooperation continued on conservation of wild animals such as tigers, Creste Ibis, and Chlamydotis macqueeni, so as to uplift the conservation level in China. For the time being, more than 4,000 wild plant species are under threat, taking up 15% to 20% of the total species, and over 1,000 of them are endangered. The fi rst national census on wild plant resources under key protection, which ran from 1997 to 2003 by State Forestry Administration, indicated that 55 wild plant species including Abies beshanzuensis, Cathaya argyrophylla, Manglietiastrum sinicum and Manglietia decidua saw their populations below the limits for maintaining stable survival. In order to step up the conservation of wild plants, continued efforts were made in 2010 to save and protect wild plants with extremely small populations, and the
Nature and Ecology
General Situationtrial projects were advanced for returning endangered wild plants such as Cycas revoluta and orchidaceous plants to the nature.
Nature reserves By the end of the year, there had been 2,588 nature reserves of varied kinds and at all levels. The nature reserves cover an area of 149.44 million hectares, and the terrestrial nature reserves occupied about 14.9% of the
national land area. There are 319 national nature reserves, which cover 92.6756 million hectares.
Wetland protection Special fund from the Central Budget as subsidies for wetland protection was set up for the fi rst time in 2010, and 200 million yuan was allocated as subsidies to wetlands of international signifi cance, wetland nature reserves, and national wetland parks, and for wetland surveillance and monitoring and ecological restoration. Earnest efforts were made to implement the Ramsar Convention, the role of China National Committee for the Implementation of Ramsar Convention was strengthened, and international cooperation programs with Australia, Germany, and U.S. were carried out smoothly. There are now more than 550 wetland nature reserves at all levels nationwide, 145 pilot national wetland parks, and 37 wetlands of international signifi cance.
Biodiversity As one of the top 12 countries with the richest biodiversity in the world, China boasts terrestrial ecosystems including forests, shrubs, meadows, grasslands, deserts, and wetlands, as well as marine ecosystems which include the Yellow Sea, East China Sea, South China Sea, and Heichao Basins. China has 34,984 species of higher plants, ranking the third in the world; 6,445 species of vertebrate animals, taking up 13.7% of the world total; and over 10,000 species of fungi, accounting for 14% of the world total.
China has abundant biological genetic resources. It is the origin of major crops such as paddy rice and soybean, and one of the primary origins of wild and cultivated fruit trees. According to statistics available, China has 1,339 varieties of cultivated crops and 1,930 kinned wild species. It tops the world in terms of fruit tree varieties. China is also one the world countries with richest domestic livestock varieties, which are up to 576 ones.
Some of the ecosystem functions were increasingly degraded. The artificial forests in China have single tree varieties and are vulnerable to diseases and insect pests. 90%
34

2010
【Comprehensive management of national nature reserves】The Norm for Comprehensive Scientific Survey on Nature Reserves (on trial) was developed, printed and distributed. The scheme on monitoring nature reserves by satellite remote sensing technology was established for review
Measures and Actions
purposes, in order to make it more scientifi c and reasonable in demarcating and re-demarcating nature reserves. Efforts were made in in 2010 applying for and screening projects fi nanced by the special fund for capacity building of national nature reserves, when the Central Budget allocated 150 million yuan to fi nance the capacity building for 48 national nature reserves. MEP, together with Ministry of Land Resources, Ministry of Water Resources, Ministry of Agriculture, State Forestry Administration, Chinese Academy of Sciences, and State Oceanic Administration, evaluated 69 national nature reserves located in six provinces and autonomous regions including Henan, Hubei, Hunan, Guangdong, Guangxi, and Hainan. Efforts were made to step up the supervision on development activities regarding nature reserves. Thematic campaigns were launched to inspect nationwide nature reserves, and the priority was given to the development activities regarding nature reserves. Some environmental violation cases concerning national nature reserves were looked into.
【Strategy and Action Plan in China for Biological Diversity Protection (2011-2030)】MEP played a leading role in developing Strategy and Action Plan in China for Biological Diversity Protection (hereinafter referred to as Strategy and Action Plan), and over 20 ministries and commissions took part in it as organized by the Coordination Group in China for Implementation of Convention on Biological Diversity. The efforts were inaugurated in April 2007 and lasted for four years. On May 18, 2010, Vice Premier Li Keqiang chaired the plenary session of China National Committee for 2010 International Year of Biodiversity, which adopted the Strategy and Action Plan. On September 15, 2010, Premier Wen Jiabao presided over the 126th executive meeting of the State Council, which considered and adopted in principle the Strategy and Action Plan. And on September 17, 2010, it was offi cial announced.
35
of the grasslands were degraded to some extent. The inland freshwater ecosystems were under threat, and some of the major wetlands deteriorated. The marine and coastal species and their habitats suffered from constant losses, and the marine fi shery resources decreased.
There were increasing endangered species. It was estimated that up to 15% to 20% of the wild higher plants were endangered. Among others, over 40% of the gymnosperm and orchidaceous plants were endangered. Wild animals were also increasingly endangered. Two hundred and thirty three vertebrates faced extinction, about 44% of the wild animals had smaller populations, and wild animals other than those under national key protection saw much smaller populations.
Genetic resources were lost constantly, and the alien invasive species caused significant damages. The living environment of the wild relatives of some crops was damaged and the habitats disappeared. 60% to 70% of the original distribution scopes of wild rice disappeared or shrank. Some of the rare and special germplasm resources including crops, woods, flowers, livestock, poultry, and fishes suffered from great losses. Traditional and rare species in some local areas were lost, and alien invasive species already played havoc on the agricultural and forestry production and resulted in huge economic losses.

2010
Chemicals management
Drafting plans The draft National 12th Five-Year Plan for Prevention and Control of Pollution by Persistent Organic Pollutants in Major Industries, the fi rst of its kind, and the draft 12th Five-Year Plan for Prevention and Control of Environmental Risks of Chemicals were prepared. And instructions were given to local areas in mapping out the Provincial 12th Five-Year Plan for Prevention and Control of Pollution by Persistent Organic Pollutants in Major Industries.
Legislation on chemicals Measures on Environmental Management of New Chemical Substances was released and effective as of October 15, 2010. A circular was released on announcing six supplementary documents for the above said measures for their implementation. Research and argumentation on toxic and hazardous chemicals were conducted, and the List of Toxic Chemicals Forbidden for Import and Export in China was amended and made public. The chemical substances testing agencies were evaluated, and the Announcement on the 2010 List of Chemical Substances Testing Agencies was released.
Examination and approval of chemicals The Circular on Strengthening the Environmental Management Registration for the Import and Export of Toxic Chemicals and Measures on the Environmental Management of New Chemical Substances were strictly implemented, improving the examination and approval systems for the environmental management registration of chemicals. In 2010, 118 Environmental Management Registration Forms for the Import of Toxic Chemicals were examined and issued, which included 102 new forms, eight forms specifying increment to import amounts, and eight forms making alterations. There were 1,911 clearance notifi cations issued for the environmental management of the import of toxic chemicals, and 3,820 clearance notifications for the environmental management of the export of such chemicals. These notifications involved 38 varieties of chemical substances and 300 domestic and international companies and public institutions. The granted import volume reached 1,169,815.6 tons, down by 31.48% than the previous year, and the export volume was up to 155,712.67 tons, down by 43.94% compared with last year. The total export and import volume were in decline. One hundred and two registration forms for new chemical substances were granted, and substances on 4,712 registration forms were exempted declaration. Two hundred and twenty four chemical substances were listed on the Inventory of Existing Chemical Substances in China.
Prevention and control of POPs Eight ministries with MEP as the leading agency and including Ministry of Foreign Affairs and NDRC printed and distributed the Guiding Opinions on Strengthening the Prevention and Control of Dioxins Pollution, and distributed to lower level departments the Circular on Printing and Distributing the List of Dioxin Sources under Key Supervision. The Announcement on Forbidding the Production, Circulation, Use, Import and Export of DDT, Chlordane, Mirex and Hexachlorobenzene was followed, and environmental supervision on the POPs used as pesticides, the fi rst of its kind, was carried out in major provinces. The survey on the renewed pollution sources by POPs was deepened, and local environmental protection departments nationwide were organized to launch surveys on the renewed pollution sources by dioxins in four major sectors including production of renewable non-ferrous metals, sintering of iron ore, steel-making, and waste incineration. A survey was concluded in eight major provinces on the list of PCBs-containing power equipment and their wastes in the industries other than the power industries.
Survey on mercury pollution sources The National Program on the Survey on Mercury Pollution Sources was mapped out. On-the-spot investigations were conducted in typical companies in 14 mercury-relevant key industries of ten provinces, and relevant forms were fi lled in. The above-said national program was revised and improved in accordance with the feedbacks, and reported to the National Bureau of Statistics for keeping records.
Research on the countermeasures for prevention and control of mercury pollution The Application to the State Council for the Approval on Attending the Session of the UNEP Intergovernmental Negotiating Committee on Mercury Pollution Control was drafted, signed by ministries concerned, and reported to the State Council, and Premier Wen Jiabao gave approval in June 2010. The Circular on Strengthening the Mercury Pollution Control in the PVC Production by Calcium Carbide Process and Relevant Industries was announced, to guide local EPBs at all levels to strengthen the mercury pollution control in the PVC producers by calcium carbide process and other companies.
36

2010
Major progress in environmental economic policies
In 2010, the country continued to speed up the development and implementation of a series of environmental economic policies, and through effective application of economic instruments, advanced energy conservation, emissions reduction, and environmental protection, and facilitated the industrial restructuring. All these efforts were quite effective.
The green credit policy was further deepened. Pilot projects on environmental pollution liability insurance were facilitated. The catalogue of highly polluting projects with high environmental risks continued to play an important role. A new Catalogue of Supplementary Instruments to the Environmental Economic Policies was drafted in 2010. This catalogue included 349 highly polluting products which have high environmental risks, 29 environment-friendly processes, and 15 kinds of key environmental equipment for pollution reduction. It played an essential role in the country’s efforts to develop and adjust economic policies such as export rebate, trade, credit and insurance policies, and improve industrial policies and safety regulation policies.
In the early 2010, MEP and China Insurance Regulatory Commission printed and distributed the Technical Guidelines for Evaluation of Environmental Risks-Measures for Rating the Environmental Risks of Chlor-Alkali Companies, providing technical basis for measuring the environmental risks of chlor-alkali companies and determining the insurance premium. Local regulations of Shanghai Municipality, Jiangsu Province, Henan Province, Hebei Province, and Shenyang City had provisions on environmental pollution liability insurance.
In order to encourage companies to carry out environmental projects, China released the List of Preferential Policies in Income Tax for Environment-friendly and Energy-and Water Effi cient Companies (on trial) , setting standards for the income tax reduction and exemption policies for companies in charge of municipal wastewater treatment or garbage treatment after they are deemed qualifi ed by environmental protection departments for operation of environmental facilities and after they go through the examination by environmental departments on total amount control.
While introducing the policy of providing subsidies for power generated with desulfurization facilities, the State also punished thermal power companies that operated desulfurization facilities with low operation rates or low efficiencies, by lowering their power price or collecting pollution discharge fees and fining penalties, and announced the punishments to the public. The pricing of power generated with desulfurization facilities accelerated the construction and operation of desulfurization facilities in the thermal power industry, and advanced the reduction of sulfur dioxide.
“The special fund under the Central Budget as rewards and subsidies for construction of pipes for municipal wastewater treatment facilities” was used as “rewards for subsidies” to fi nance the key river basins and central and western regions to construct pipes for municipal wastewater treatment facilities included in the 11th Five-Year Plan, in order to give incentives for improving the municipal wastewater treatment capacities.
Positive progress was made in the pilot projects on emission trading. By now, eight provinces (autonomous regions and municipalities directly under the Central Government) were approved by the State as pilot regions for emission trading.
The environmental check scheme of the public companies was deepened. The Circular on Further Tightening the Environmental Check on Public Companies and Strengthening Post-supervision after Environmental Check was released in July 2010, which provided the post-supervision scheme and on-the-spot inspection scheme, and improved the requirements for information sharing by public companies.
37

2010
Water and soil erosion An area of 3.5692 million km2 witnessed water and soil erosion, accounting for 37.2% of the national land area. Among them, 1.6122 million km2 suffered from water erosion, taking up 16.8% of the national land area, and 1.957 million km2 suffered from wind erosion, accounting for 20.4%.
Environmental conditions in rural areas Environmental problems in rural areas were increasingly prominent, the total pollutant load from agricultural sources was large, and the general situation was still tough despite some improvement in local areas. The major problems included a large amount of pollutants from livestock and poultry breeding farms, serious situation of agricultural non-point pollution, worsening domestic pollution in some of the rural areas, emerging pollution by industries and mines in the countryside, accelerated transfer of urban pollution to rural areas, and failure to effectively curb rural ecological degradation.
Land and Rural Environment
General Situation
【Key projects on treatment of water and soil erosion】In 2010, the national key projects on water and soil conservation focused on the upstream and middle stream of the Yangtze River and Yellow River, the upstream of Pearl River, and rivers in Southwest China, and also gave considerations to other areas suffering from bad water and soil erosion, including Northeast China. These projects helped treat 3,250 small watersheds, and prevent and control water and soil erosion in about 76,500 km2 of area, including about 48,500 km2 by integrated treatment and 28,000 km2 by ecological restoration.
【Integrated treatment of rural environment】Since the policy of “offering fi nancial rewards as incentives to control pollution in rural areas” was introduced three years ago, the Central Budget has spent 4 billion yuan,
Measures and Actions
with collateral local money up to nearly 8 billion yuan, in financing over 6,600 villages and towns for integrated environmental treatment and ecological demonstration, so a number of prominent rural environmental problems that have adverse impact on the public health and that are strongly complained by the public have been treated. More than 24 million rural populations benefited from that. Also, to make the above-said policy more effective, MEP and Ministry of Finance organized eight provinces (autonomous regions and municipalities directly under the Central Government) to launch model projects on integral rural environment treatment. Twenty four regions were selected as model regions for integral rural environment treatment, which involved over 8 million populations from 4,000-odd villages in 181 counties (autonomous regions and municipalities directly under the Central Government). The model projects made steady progress and began to have demonstrative effects.
【National key project on public health services】2.865 billion yuan from the Central Budget was spent in the 2009 and 2010 projects on improving toilets in rural households, one of the national key projects on public health services, to help 7.58 million rural households to build environmentally sound and sanitary toilets in 30 provinces (autonomous regions and municipalities directly under the Central Government) as well as Xinjiang Production and Construction Corps. By the end of 2010, such toilets had been available in 8.2732 million rural households, overfulfilling the tasks. Since the projects were implemented, local governments have attached more importance to toilet improvement in the countryside and regarded them as actual deeds done for the people. The tasks were allocated and responsibilities were to be honored. Local areas seriously wrapped up the experience, strengthened the project management, ambitiously introduced innovative working patterns, and ensured that the tasks were accomplished as scheduled, to the full extent and with high quality. Jiangsu Province listed the toilet improvement project in the countryside among the top ten actual deeds for the people, and included it as one of the annual key goals of the provincial Party committee and government. As a result, the tasks in Jiangsu were completed by 546%. In Shaanxi Province, the toilet improvement project was integrated with the bid to build into a sanitary province; leading provincial
38

201039
government offi cials paid close attention to it, and the public was in dire need of it, so the whole province was enthusiastic about toilet improvement. Chongqing Municipality regarded the toilet improvement as integral part of developing into “healthy Chongqing” and “Livable Chongqing”, began with raising the awareness of the majority of the cadres and mass, and launched extensive campaign on health education. In Anhui Province, standards were set for the management of such projects, and quality control was introduced in all links. Serial numbers were used to mark the households involved in the project, and there were unified standards, materials, construction, and environmental check procedures. Guangxi provided rewards for accomplishing the tasks ahead of schedule for the community-level advanced units and workers in toilet improvement as well as for the rural households managing to do so, mobilizing the incentives at the community level.
【Vigorously extending the water saving in agriculture and developing eco-friendly irrigation districts】The agricultural departments at all levels have in recent years vigorously extended water-saving agricultural technologies and obtained remarkable economic, social, and ecological benefits. In 2010, the water saving and conservation technologies as follows were extended to a large area, including full film cover for harvesting rainwater and increasing soil moisture, drip irrigation with fi lm, integration of water with fertilizer, sprinkler irrigation, irrigation with hose, drought resisting and under-bed irrigating sowing, irrigation by testing soil moisture, coverage by stalks and subsoiling. These technologies were highly effective in water saving and conservation and cost-effective. In Northwest China, full film cover technology was applied to harvest rainwater and increase the soil moisture, and in hilly lands with precipitation of 300 mm where corn was planted, this technology helped increase the corn output by over 200 kg/mu, and 70~80% of the rainwater was used; drip irrigation technology with film was applied to cottons, and the output of ginned cotton increased by over 15 kg/mu, the water consumption was cut down by over 30%, and fertilizer was reduced by more than 20%. In the western and Northeast China, the drip irrigation with film technology was used to grow corn, increasing the output by 400 kg/mu and saving water by over 100 m3/mu. In North China, the drip irrigation with film technology was used to grow potatoes, increasing
the output by 2,000 kg/mu and saving water by more than 40%; the stalks were returned to the farmland and fi lmed, and the grain output per millimeter of rainwater amounted to 1 kg, making the rainwater effi ciency threefold of the national average; drip irrigation with fi lm technology was also applied to vegetables and fruits, cutting the cost by over 500 yuan/mu.
In 2010, the whole nation continued to promote water efficient irrigation. Three hundred and sixty seven projects on building supplementary facilities and on water effi ciency upgrading were completed in large-and medium scale irrigation districts. There were 155 model projects on water saving and 40,000 hectares of water-efficient irrigation areas. Projects were carried out in farmlands, small-scale irrigation districts, small embankments, and small-scale pumping stations on rainwater harvesting and use.
The short-term treatment of watersheds in Northwest China began to be effective. Three projects were carried out on short-term treatment of Heihe Watershed, integrated treatment of Shiyanghe Watershed, and short-term treatment of Tarim Watershed.
【National survey on soil pollution】By the end of the year 2010, there had been 213,754 samples of soils and farm produce nationwide, 4.95 million valid data, 2.18 million environmental information data and 210,000 pictures at monitoring sites, and nearly 11,000 prepared graphics. The database and sample tank for national survey on soil pollution were set up, the data amounted to 1TB, and the samples in the tank reached 54,407 pieces. The general report and thematic reports on the national survey on soil pollution was drafted. Pilot projects were carried out on research on sites contaminated by heavy metals, oils, PCBs, and chemicals, as well as farmland soils in wastewater-irrigation districts. Twelve pilot projects were completed, and 18 study reports and seven draft technical guidelines for restoration of contaminated soils were worked out. The Study Report on Soil Conservation Strategies was finished. Investigations were organized for legislation on prevention and control of soil pollution, and the draft Law on Prevention and Control of Soil Pollution was formulated and interpretations on the articles were available. There were recommendations on the framework of the environmental standards for soils, and the draft amendments to Soil Environmental Quality Standard were completed.

2010 40
General situation of and progress in environmental standards and technical documents
In the 11th Five-Year Plan period (2006-2010), the amount of national environmental standards increased by 100 standards year on year; 60-odd emission standards for key industries were released, and efforts were under way to develop and amend 1,050 national environmental standards. There were 1,300 valid national environmental standards, and 67 local environmental standards in record.
Eighty seven national environmental standards were introduced in the year 2010, including emission standards for 11 key industries such as starch, yeast, oil ink, ceramics, vitriol, nitric acid, and non-ferrous metal industry. The draft emission standards for the rare earths, vanadium, weapons, glass, phosphor fertilizer, car maintenance and repair, rubber and alcohol industries were completed and submitted for approval. The exposure drafts for 124 environmental standards were made public, including Ambient air quality standard, Standard of environmental vibration and Discharge standards for petroleum refi ning industry. Efforts were started on amending important standards including Integrated wastewater discharge standard, Discharge standard of pollutants for municipal wastewater treatment plant, Emission standard of air pollutants for thermal power plants, Emission standard of air pollutants for boilers, and Discharge standard of pollutants for livestock and poultry breeding. The 12th Five-Year Plan for National Environmental Standards was drafted and public opinions were solicited on it. The Measures on the Administration of Keeping Records of Local Environmental Quality Standards and Emission Standards, Measures on the Administration of the Plan for Developing and Amending National Environmental Standards, and Technical Guidelines for Developing and Amending Environmental Monitoring Analytical Approaches, and Technical Guidelines for Developing and Publishing Environmental Standards were released. Nineteen local emission standards were kept on records, and administrative interpretations were given in accordance with law to eleven environmental standards.
During the 11th Five-Year Plan period, six technical policies on pollution control including Technical Policy for Prevention and Control of Nitrogen Oxides in Thermal Power Plants, eight best available technical guidelines including Best Available Technical Guidelines for the Treatment and Disposal of Sludge from Municipal Wastewater Treatment Plants , and 17 engineering technical criteria including Engineering Technical Criteria for Treatment of Wastewater from Artifi cial Wetlands were made public.
Ecological Improvement and Conservation Culture
Deepening the work on ecological improvement model districts The Opinions on Further Deepening the Work on Ecological Improvement Model Districts and Regulations on Application for and Administration of National Eco-towns were printed and distributed. The Norms on the Administration of National Model Districts for Ecological Improvement was formulated, and the sixth National Forum on Eco-province was held. Technical evaluation was conducted in 26 model districts for ecological improvement including Xiqing District in Tianjin Municipality. Nineteen districts including Shenbei New District in Shenyang City of Liaoning Province was evaluated and checked, and announcement was made on evaluation of 398 national environment-friendly townships and 83 national eco-villages.
Actively exploring the development of model districts for conservation culture The fi rst general assembly of China Conservation Culture Research and Promotion Society was held. Research on the indicators measuring conservation culture model districts was carried out. Efforts were made to explore the possibility of setting up a mechanism in key regions to advance conservation culture development crossing administrative regions. A symposium on conservation culture in Taihu Lake basins was organized, investigations were under way on the pattern to develop conservation culture in some regions, and argumentation meetings were held on the ecological conservation development planning in six region including Wuxi City, Jiangsu Province.

2010
Environmental publicity and education
The environmental publicity and education work made new progress in terms of leading the public opinions, organizing publicity campaigns, deepening the reform of the press, and encouraging public participation, in accordance with the requirements for focusing on priorities and serving for the general situation, and work proactively and down-to-earth, with innovative spirits.
Strengthening news coverage and publicity from all dimensions and constantly improving the capacity for leading the public opinions. In 2010, the news and publicity work focused on the central tasks for environmental protection and guided the public opinions by coordinating media like TV, newspaper and magazines and internet, making full use of news resources, trying to have in-depth cooperation with mainstream media, and elaborately organizing and planning the important news coverage events. According to statistics available, efforts were made to organize and coordinate the media to report over 100 important meetings of MEP, prepare 28 news manuscripts, and handled 94 applications from media for interviews throughout the year. As a result, sixteen mainstream media published or broadcast 1,003 piece•times of news regarding environmental protection, including 122 pieces by People’s Daily, 177 pieces by Xinhua News Agency, and 237 piece•times by CCTV. Among others, news manuscripts were released consecutively to guide the public opinions in a timely and correct manner, playing an active role in maintaining social stability, regarding the environmental quality problems concerned by all parties, and in the event of earthquake in Yushu Prefecture of Qinghai Province, mud and rock fl ow in Zhouqu County of Gansu Province, and chemicals in Jilin Province fl ushed into Songhua River. Moreover, a TV news column entitled Environment was opened with the collaboration of China Xinhua News Network Corp under the Xinhua News Agency. Since it was opened on June 5, the column Environment has broadcast 30 terms in Chinese and English languages for 240 times, spoken highly by all walks of life in society especially the overseas audience.
Organizing colorful publicity campaigns and vigorously advancing the environmental education for all and capacity building in publicity and education A series of publicity and commemoration activities were planned and organized around the theme of “low-carbon, emissions reduction • green life”, such as the exhibition of environmental protection achievements, and the “2010 World Environment Day commemoration meeting-Young environment ambassadors advancing pollution reduction by all & the ceremony for the debut of the special post stamps on energy conservation, emissions reduction and environmental protection”. Li Keqiang, member of the Standing Committee of the Political Bureau of CPC Central Committee and Vice Premier of the State Council, visited the above-said exhibition and met with representatives of environment ambassadors from all walks of life. A set of four-piece posters with the theme of “low carbon, emissions reduction•green life” were prepared and distributed nationwide through the Energy Conservation Center of the Government Offi ces Administration of the State Council. Efforts were made to sponsor the 2010 University Art Festival for Environmental Protection and the premiere of the fi lm River Chief, the fi rst fi lm in China to refl ect the water crisis. Moreover, earnest efforts were made in the standardization of provincial publicity and education departments for environmental protection, laying a solid foundation for the sustainable development of the national environmental publicity and education undertaking.
Making earnest efforts to prepare the 12th Five-Year Plan, advancing the reform of the press, newspapers and magazines, and encouraging public participation The Outline of the National Campaign on Environmental Publicity and Education (2011-2015) was developed. The Interim Measures on the Review of Periodicals affiliated to Ministry of Environmental Protection was developed and introduced. Research was conducted on green deal and conservation culture by a task force established together with Chinese Public Administration Society (CPAS), and a research report entitled Implementing the Green Deal with Chinese Characteristics and Advancing Scientifi c Development and Conservation Culture was produced, on which Vice Premier Li Keqiang and State Councilor Ma Kai made important written instructions. The Guiding Opinions on Channeling the Orderly Development of Environmental NGOs was developed and made public.
41

2010
Overview of forest resources According to the seventh national investigation on forest resources (2004-2008), the forest area reached 195.4522 million hectares, forest coverage was 20.36%, the total growing stock volume was 14.913 billion m3, and forest reserve was 13.721 billion m3. The arbor forest reserve was 85.88 m3 per hectare. China ranks the fi fth in the world in terms of forest area, the sixth in terms of forest stock, and the fi rst in terms of the area of artifi cial forests.
As for forest area, when it comes to the forests for public interests, the shelter forest accounted for 45.81% of total forest area, and their stock was 55.01% of the total stock; forest for special purposes accounted for 6.60% of the total forest area, and their stock was 13.07% of the total stock. When it comes to the commercial forests, the timber forests took up 35.38% of the total forest area, and their stock was 31.63% of the total stock; fuel-wood forests took up 0.96% of the total area, and their stock was 0.29%; the non-timber forests accounted for 11.25% of the total area.
From the perspective of the economic regions, the eastern region occupied 9% of the national land area, its forest area was 15.10% of the total, thus the forest coverage 35.68%; the central region occupied 11% of the national land area, its forest area was 15.88% of the total, making the forest coverage 33.30%; the western region occupied 71% of the national land area, its forest area was 54.27% of the total, and forest coverage was 17.05%; the northeastern region had the highest forest coverage, which was up to 40.22%.
Biological disasters in forests China experienced extensive abnormal weathers including high temperature, drought, low temperature, and frosts in 2010. The abnormal weathers had adverse impact on the health and growth of woods and caused more frequent biological disasters, which were very serious in some regions. The year 2010 saw hazardous biological disasters happening to 11.99 million hectares of forests, including 8.66 million hectares affected by insect pests, 1.4 million hectares by diseases, and 1.93 million hectares by rats (rabbits). Preventive measures were taken on 8.37 million hectares of forests. Also, 115,000 hectares
Forest
General Situationwere plagued by hazardous plants. Both the area affected by biological disasters and disaster area increased compared with the same period last year.
Forest fires The year 2010 witnessed 7,723 forest fires (including 4,795 ordinary fi res, 2,902 big fi res, 22 major fi res, and 4 extreme fi res). The forest area affected by fi res reached 45,800.46 hectares, and there were 108 casualties (including 65 deaths). The whole nation conquered the difficulties brought by increasing extreme weathers and major droughts, pooled wisdoms and made concerted efforts to bring down the frequency of forest fi res, their affected area, and the casualties by 13%, 1% and 2% respectively.
【Key forestry projects】 In 2010, forestry departments at all levels made tremendous efforts to reclaim mountainous areas, plant trees, and develop bases for non-timber forests for special purposes, forests for carbon sink, and forests as energy sources, worked harder to cultivate high-quality soils and rare trees, and planted forests of 5.9225 million hectares throughout the year. Among them, about 116,000 hectares were shelter forests in Yangtze River Basins, 231,500 hectares were shelter forests in coastal regions, 67,500 hectares were shelter forests in Pearl River Basins, 33,900 hectares were forests for greening Mount Taihang, 857,900 hectares were shelter forests under the North China, Northwest China and Northeast China Shelter Forest Project, 853,000 hectares were forests for public interests under the natural forest resource conservation project, 437,000 hectares were forests for treatment of wind and sand sources of Beijing-Tianjin region, 168,700 hectares were forests for integrated treatment of rock desertification, and 783,300 hectares were forests returned from farmlands.
【Urban virescence】Local areas were actively engaged in the bid to developing into national model entity for virescence, national forest city, or national garden city (district, county, town). The virescence area in built areas of nationwide cities reached 1.4945 million hectares, green area
Measures and Actions
42

2010
was up to 1.3381 million hectares, and green area in parks was 401,600 hectares. The green coverage in built areas was 38.22%, and the green area accounted for 34.17% in urban areas. There had been 63 national key parks and 41 national municipal wetland parks by the end of the year. Three hundred and thirty fi ve national model entities (including 21 cities, 89 counties, and 225 organizations) were commended in 2010, by the end of which there had been 180 national garden cities, seven national garden districts, 61 national garden counties, 15 national garden towns, and 22 national forest cities.
【Desert ecosystem conservat ion and desert treatment】Active efforts were made to establish national
43
conservation areas for deserted land and to prevent and treat region-wide desertification. The fourth national monitoring program on desertification and sand was completed. Efforts were made to effectively respond to major sandstorms and minimize the losses. Opinions on Further Accelerating the Development of Sand Industry was developed and released, to provide scientific guidance and set standards for the healthy development of sand industry. Active cooperation and communications were under way under the platform of United Nations Convention to Combat Desertification. According to statistics available, 1.3728 million hectares of sandy land across the country was treated in 2010.

2010
Grassland resources There were 400 million hectares of grassland across the nation, accounting for 41.7% of the national land area. The grasslands in Inner Mongolia, Guangxi, Yunnan, Tibet, Qinghai, Xinjiang, Shaanxi, Gansu, Ningxia, Chongqing, Sichuan and western part of Guizhou amounted to about 330 million hectares, which was about 84.4% of the total grassland area. Liaoning, Jilin, and Heilongjiang have about 17 million hectares of grasslands, taking up 4.3% of the total. Grasslands in other provinces (municipalities directly under the Central Government) were around 45 million hectares, representing 11.3% of the total.
Grassland productivity The vegetation in grasslands across the nation was in better shape in 2010. The output of fresh grass from natural grasslands nationwide was up to 976.3221 million tons, up by 4.04% than the previous year. It was equivalent to about 305.4971 million tons of dry grass, and the livestock carrying capacity was around 240.1311 million sheep units.
Grassland disasters The year 2010 saw 109 grassland fi res, which affected 5,158.4 hectares of grasslands. There was one major fire, and the area affected decreased by 19,636.8 hectares compared with last year, down by 79.2%. The rats affected 38.678 million hectares of grasslands, which accounted for 10% of the total grassland area and was down by 5.4% than the previous year. Insect pests affected 18.067 million hectares, which accounted for 4.5% of the total area and was down by 13% than the previous year.
Grassland
General Situation
【Policies and regulations on grasslands】Policies on subsidies and rewards for ecological conservation in
Measures and Actions
44
grasslands were introduced. Subsidies for banning grazing, rewards for balancing the pasture carrying capacity with livestock size, production subsidies, and performance evaluation rewards were available in Tibet, Inner Mongolia, Xinjiang (including Xinjiang Production and Construction Corps), Qinghai, Sichuan, Gansu, Ningxia, and Yunnan. The Contingency Plan of Ministry of Agriculture for Grassland Fires was amended and upgraded to National Contingency Plan for Grassland Fires. The Circular of Ministry of Finance and National Development and Reform Commission on Issues Regarding the Approval to Collect Grassland Revegetation Fees and Circular of National Reform and Development Commission and Ministry of Finance on Issues Concerning the Charging Standards of Grassland Revgetation Fees were printed and distributed.
【Grassland projects】In 2010, the project on returning pasture to grasslands was carried out in Inner Mongolia, Sichuan, Gansu, Ningxia, Qinghai, Tibet, Xinjiang, Yunnan, Guizhou and Xinjiang Production and Construction Corps. The Central Budget spent 2 billion yuan in building fences which enclosed 6.727 million hectares of grasslands, and seeded 2.7 million hectares of badly degraded grasslands. The project on treating grasslands at the sources of wind and sand plaguing Beijing-Tianjin region was carried out in Beijing, Inner Mongolia, Shanxi and Hebei. The Central Budget spent 378 million yuan in treating 223,800 hectares of grasslands, building 1.32 million m2 of livestock shelters, and purchasing 12,705 feedstuff processing machines for the farmers and herdsmen.
【Environmental supervision in grasslands】There were 20,462 cases of environmental violations concerning grasslands nationwide in 2010, 19,477 cases of which were fi led for investigation, and 19,122 were concluded, accounting for 98.2%. Among them, eight cases went to administrative review or litigation, and 75 cases were transferred to the judicial departments. These grassland violation cases damaged 15,568.2 hectares of grasslands, and 1,996 hectares were in transactions or illegal circulation.

201045
In 2010, China saw complicated and abnormal climate situations including frequent extreme weathers, and the climate disasters caused the greatest losses ever seen in this century. There was much more precipitation, which was unevenly distributed among seasons and regions, and drought and fl oods occurred by turns. The annual average temperature was on the higher side, there was delay in shift of seasons, and the number of days with high temperature hit a historical
Climate and Natural Disasters
Climaterecord.
Temperature distribution The annual average temperature in 2010 registered 9.5℃, up by 0.7℃ than the average year. It was the tenth highest record since the year 1961 and the 14th hot years since the year 1997. The majority of the country saw temperature on the higher side, except that Northeast region, northeast Hebei Province, and northern part of Xinjiang Autonomous Region saw temperature at the lower side. The temperatures in Qinghai-Tibet Plateau, southern and eastern parts of Xinjiang, central Gansu, most part of Ningxia, Yunnan, and southern part of Sichuan increased by 1 to 2℃ than normal years.
7.5
8
8.5
9
9.5
10
10.5
1961 1965 1969 1973 1977 1981 1985 1989 1993 1997 2001 2005 2009Year
Ann
ual a
vera
gete
mpe
r atu
re(℃)
Values in previous years
Average value from 1961 to 2010
Annual average temperature curves from 1961 to 2010 in China (℃)
The average number of days registered with high temperature in the year 2010 was 11.1, 4.1 days more than that of the average year (7.0 days), and the highest since the year 1961. Such days went up by 5 to 15 days in the most part of South China, the central and western parts of North China, the western part of Yellow River-Huaihe River basins and eastern
part of Xinjiang Autonomous Region, the central, western and northeastern parts of Inner Mongolia, and northwestern part of Heilongjiang Province. Among others, the number of such days increased by more than 15 days in the central and southern parts of Jiangxi Province, the southern part of Hunan Province, the southwestern part of Fujian Province, and

2010 46
Histogram of annual average precipitation in China from 1961 to 2010 (mm)
northern part of Hainan Province. Precipitation distribution The annual average rainfall
in China in the year 2010 recorded 681mm, up by 11.1% than the average year and the second highest since the year 1961. The annual rainfall of the most part of South China and the majority of the regions south of Yangtze River exceeded 1,500mm, that in the most part of Northeast China, eastern
part of North China, Yellow River-Huaihe River basins, regions between Yangtze River and Huaihe River, Jianghan Plain, southeastern part of the Northwest China, and central and eastern parts of Southwest China ranged between 500 mm to 1,500 mm, and other regions in the countries had rainfall below 500 mm.
Compared with the average year, apart from the eastern
The anomaly distribution of annual average temperature in China in 2010 (℃)
550
600
650
700
750
1961 1965 1969 1973 1977 1981 1985 1989 1993 1997 2001 2005 2009
Year
Prec
ipita
tion
mm
Values in previous vearsAverage values from 1961 to 2010

201047
Meteorological disasters The year 2010 saw much more meteorological disasters and frequent extreme weathers.
Natural Disasters
part of Inner Mongolia and the central and eastern parts of Yunnan Province where precipitation dropped by 10% to 50%, most part of the country had more or about the same precipitation as the average year, but the rainfall increased by 10% to 50% in central and southern parts of Northeast China, central and western parts of Northwest China, most of the region south of Yangtze River, eastern part of Heilongjiang Province, northern part of Hebei Province, northern part of Shandong Province, central and western parts of Henan Province, southern part of Shaanxi Province, western part of Inner Mongolia, southern part of Anhui Province, eastern part of Hubei Province, most region in Fujian Province, western part of Guangdong Province, eastern part of Guangxi Autonomous Region, most part of Hainan Province, northwestern part of Yunnan Province, and eastern and western parts of Tibet. Some regions in Xinjiang, Qinghai, Liaoning, and Jilin also saw rainfall up by over 50%.
Major droughts, which ran through the 2009 autumn, winter and 2010 spring and which were rarely seen in history, struck Southwest China. Lingering low temperatures, which lasted from winter to spring and which were rarely seen in nearly four decades, plagued Northeast China and North China. The most serious snow disasters ever recorded hit the northern part of Xinjiang. High temperatures ran rampant, and the temperatures in many places in Northeast China broke historical records in early summer. South China and regions south of Yangtze River were hit by 14 rainstorms from May to July. Northern and western regions were struck by ten rainstorms from the middle July to the first ten days of September, when serious geological disasters such as fl ash fl oods, mud and rock fl ows, and landslides were triggered by strong rainfalls in some areas of Gansu Province, Sichuan Province, Guizhou Province, and Yunnan Province. More tropical cyclones landed and affected almost the same regions. Typhoon Chanthu and Typhoon Fanapi caused great losses. Hainan Province saw lingering strong rainfall rarely seen in history in October.
——Abnormally more precipitation and frequent rainstorms. The number of days with rainstorms in 2010 went up by 21.5% than the average year, the third highest since the year 1961. Rainstorms were frequent and intense, triggering floods in many river basins during the same
Precipitation distribution in China in 2010 (mm)

2010 48
period. From January to March, the regions between Yangtze River and Huaihe River and regions south of Yangtze River experienced rainfalls very frequently, and in early March Jiangxi Province and Zhejiang Province witnessed early floods rarely seen in history. From May to July, southern China was struck by 14 strong rainstorms and resulted in serious fl oods in many watersheds. From the middle July to the first ten days of September, northern China was struck by ten rainstorms. Some areas in Jilin Province and Liaoning Province broke historical records in terms of daily rainfalls and saw serious floods. Weihe River, Liaohe River, and No.2 Songhua River also witnessed serious floods. In the first twenty days of October, Hainan Province experienced continuous and intensive rainfalls rarely seen in history, the average precipitation reached 1,060.1mm and the rainstorm days averaged at 6.6 days, both a historical high during the same periods in previous years. The intensive rainfalls caused serious fl oods in many counties and cities.
——Plenty of sudden and intensive rainfalls in certain regions, and serious secondary disasters such as flash floods and mud and rock flows. From June 27 to 28, the rainfall reached 260.4 mm in Gangwu Town, Guanling County of Guizhou Province, which triggered major landslides. On July 17, local rainstorms caused major floods and mud and rock flows in Qiaojia County, Yunnan Province. On July 27, Hanyuan County in Sichuan Province saw serious mountainous landslides caused by rainstorms. On August 7, Zhouqu County in Gansu Province was struck by sudden and intensive rainstorms, the maximum rainfall reached 77.3 mm/h and the precipitation exceeded the average level in August. As a result, major flash floods happened to Zhouqu County, claiming huge casualties. From August 12 to 15, local rainstorms caused serious fl ash fl oods and mud and rock fl ows in Wenchuan County, Mianzhu City, and Dujiangyan City in Sichuan Province.
——Much less rainfalls in some regions and periods, and Southwest China and other regions saw droughts rarely seen in history. The precipitation in China in the year 2010 was more than those in previous years, but there were much less rainfalls in some regions and periods. From September 2009 to March 2010, southwestern region had little rain and higher temperature; Yunnan Province and Guizhou Province observed the lowest rainfall ever recorded, and southwestern region experienced the most serious droughts ever recorded from autumn and winter of 2009 to spring of 2010. From June to July, the precipitation in North China and eastern Inner Mongolia plummeted by 30% to 80% compared with the same period in average year. Inner Mongolia observed the record low rainfall since the year 1961. High temperature and little rain resulted in drought in summer, and
in the central and eastern Inner Mongolia, the drought lingered until October. In October, the rainfall in most part of North China dropped by 50% to 80%, and that in Yellow River-Huaihe River basins was down by over 80% compared with the same period in average year. Shandong Province observed the second lowest average rainfalls in the same period of year since 1961. The Yellow River-Huaihe River basins and North China suffered from droughts in autumn and winter.
——Much lower temperature during some periods of time and serious low-temperature damages and snow disasters. Larger area in the country was hit by low-temperature damages and snow disasters in the year 2010. From November 2009 to April 2010, Northeast China and North China were struck by lingering low temperatures rarely seen in nearly four decades, the average temperature in Beijing-Tianjin-Hebei region hit the record low in the same period since 1971, and the three provinces in Northeast China observed the second lowest temperature. From January to March, the average precipitation in northern Xinjiang registered 94.8 mm (three times higher than the same period in average year), and the number of rainy days averaged at 36 days (nearly twice of that in the same period in average year), both hitting the record high in the same period of previous years. The snow in Altay Region of Xinjiang was as deep as 94 cm and in Fuyun County it was 88 cm deep, both breaking the records in winter. Strong snow storms caused the most serious snow disaster ever recorded in northern Xinjiang. In December, cold spells were frequent nationwide. Cold snaps, which were rarely seen in early winter, hit Northeast China, region to the south of the Yangtze River, and South China from December 9 to 16. Southern China experienced large-scale strong rain and snow storms, which brought about huge losses.
——More tropical cyclones landed, affecting almost the same regions in a short period. The year 2010 recorded the least tropical cyclones in Northwest Pacific Ocean and the South China Sea since the New China was founded. However, seven of these cyclones landed in coastal regions in South China, accounting for 50% of the total and hitting a record high. Typhoons appeared at about the same period and landed in almost the same places. From the end of August to early September, fi ve tropical cyclones came into being, and a total of five tropical cyclones landed at coastal regions of Fujian Province throughout the year. Strong Typhoon Fanapi landed in Taiwan Region with maximum wind force at scale 15 (50 m/s) and had great impact on Guangdong Province and Taiwan Region. Super Typhoon Megi turned out to be the most powerful typhoon in Northwest Pacifi c Ocean and South China Sea in nearly two decades. It was also the world most powerful typhoon in 2010.

201049
【Guarantee ing meteorological services and emergency response to meteorological disasters】China initiated 31 emergency responses in 2010, which took 208 days in total. The monitoring on disaster-prone weathers was strengthened, and weather forecasts and pre-warnings were released on a timely basis. Meteorological departments at all levels strengthened the real-time monitoring with satellites, radars, and automatic meteorological observation stations. The observation stations were available in over 85% of the townships and towns nationwide; the amount of new-generation weather radars was up to 164, and 1,210 automatic soil moisture observation stations were built up. Double polar-orbiting meteorological satellites were available to observe both in the morning and afternoon; and double Geostationary Meteorological Satellites were also available and able to back up data for each other during orbiting. Intensive meteorological observation programs were initiated in different regions and periods, in order to monitor the change of weathers on a real-time basis. In 2010, National Meteorological Center released 967 pre-warnings of meteorological disasters including cold fronts, rainstorms, gales at sea, typhoons, droughts, and high temperatures. The decision-making level was constantly improved in light of the needs, and earnest efforts were made in emergency response to major meteorological disasters such as rainstorms, droughts, low temperature, and snowstorms, as well as emergencies such as earthquakes, flash floods, geological disasters, and forest and grassland fires. Communications and cooperation were strengthened, and inter-departmental joint action proved effective. MEP signed agreement of cooperation with Ministry of Land Resources, State Forest Fire Prevention Command Post, National Tourism Administration, and State Grid Corporation, conducted researches together on technologies for pre-warning of geological disasters and forest fires,
Measures and Actions
——Temperature on the higher side, and the most high temperatures in nearly five decades. It was the 14th consecutive year which recorded temperatures on the higher side in China. The temperatures in summer reached a historic high since the year 1961. High temperatures frequented and affected a large area. The amount of days hitting annual average high temperature nationwide was the largest in nearly fi ve decades, and the amount of days with high temperatures in Hainan, Yunnan, Heilongjiang, Inner Mongolia, and Qinghai was the largest since 1961. Northeastern region and Inner Mongolia saw rare high temperatures in June, and the daily maximum high temperature in many places broke the historical records. From the last ten days of July to the last ten days of August, southern China recorded lingering high temperatures and the power loads in many regions of the country hit new records.
Geological disasters The year 2010 witnessed 30,670 geological disasters nationwide, which claimed 3,449 casualties and caused about 6.39 billion yuan of direct economic losses. The amount of geological disasters, the casualties and missing persons, and direct economic losses went up by a large margin compared with the same period last year. Among the geological disasters, there were 22,329 landslides, 5,575 rockslides, 1,988 mud and rock fl ows, 499 ground collapses, 238 ground fissures, and 41 ground sink, and 382 of these disasters claimed casualties. Geological disasters happened mostly in East China, Central-south China, Southwest China, and some part of Northwest China. Jiangxi, Hunan and Fujian were the top three provinces regarding geological disasters. Gansu, Shaanxi, and Yunnan were the top three regions concerning the casualties and missing persons claimed by such disasters. And, Shaanxi, Sichuan and Jilin were the top three regions concerning the direct economic losses caused by such disasters.
Seismic disasters In 2010, the mainland China was struck by 17 earthquakes measuring at or above magnitude 5.0 on the Richter Scale and 10 disasters caused by earthquakes. The disasters caused about 850,000 victims, 2,705 deaths, 270 missing and 11,088 injured in the mainland China; affected about 30,759 km2 of area, destroyed 3,562,151 m2 of houses, seriously damaged 1,069,406 m2, moderately damaged 3,350,522 m2, and slightly damaged 1,073,050 m2. The direct economic losses amounted to 23.57 billion yuan.
Oceanic disasters There were 69 red tides in sea areas in 2010, which covered a total area of 10,892 km2. Nineteen species were responsible for the red tides, among which Prorocentrum donghainese Lu caused the most red tides and affected the largest area, which was up to 4,539 km2. Enteromorpha prolifera appeared in the Yellow Sea in the year 2010, and compared with the previous year, the largest
distribution area of Enteromorpha prolifera dropped by around 50%, and its actual coverage was down by 75% or so. The damages caused by Enteromorpha prolifera were much less.
In 2010, environmental monitoring was conducted on seawater intrusion and soil salination in coastal regions across the country. The monitoring results indicated that seawater intrusion and soil salination affected more areas in the coastal plains of Yellow Sea, such situation aggravated in some regions near South China Sea, and the area suffering from seawater intrusion and soil salination in the monitored regions of Bohai Sea and East China Sea remained stable.

2010 50
making the meteorological services to be more specialized and detailed. Moreover, efforts were made to accelerate the establishment of two systems for the agricultural sector, that is, the system of providing meteorological services for agriculture and the meteorological disaster defense system in the countryside, and to give full play to the meteorological services for the agricultural sector. MEP also intensified the real-time communications and consultation with the agricultural departments and provided meteorological services for the sowing in spring, the harvest and sowing in summer and autumn, and for the defense against major meteorological disasters. Agreements of cooperation on providing better meteorological services for the agriculture were signed between MEP and the provincial (regional) governments of Shanxi, Anhui, Hubei, Henan, Guangxi, and Sichuan. The www.weather.com.cn South Station and its 31 provincial stations were established, and the click-through ratio of the portal was around 10 million each day. Hotlines were available for meteorological services in 31 provinces. There were 80,000 althorns for pre-warning of meteorological disasters available in the rural areas, over 59,100 electronic display screens for metrological conditions in the countryside, and 18,460 meteorological information service stations.
【Strengthening capacity building for the prevention and control of geological disasters】The State Council issued Some Opinions on Earnestly Strengthening the Treatment of Medium-and Small-scale Rivers and the Prevention and Control of Geological Disasters-the Flash Floods. Ministry of Land Resources and China Meteorological Administration signed the Framework Agreement on Strengthening the Cooperation on Meteorological Pre-warning and Forecast of Geological Disasters. The supplementary schemes for emergency response to geological disasters were improved, expert tank for emergency response to geological disasters was set up, and drills for emergency response to large-scale geological disasters were organized. Efforts were facilitated in prevention and control of geological disasters, including developing counties with “organization, expenditure, planning, contingency plan, scheme, publicity, forecast, monitoring, instruments, and warnings” of geological disasters, developing five lines including “governance by administrative departments, supports by public institutions, emergency response, expert consultation, and intermediate services”, and to make sure that the evaluation, inspection, contingency plans, publicity, and personnel are in place for prevention and control of geological disasters, so as to improve the capacity in this regard at the community level.
【Strengthening the prevention and control of major geological disasters in key regions】 More efforts were made in the professional monitoring of 255 sites with
potential risks of major geological disasters in Three Gorges Reservoir area, and in the monitoring and prevention of 3,049 sites with such risks. One hundred experts were organized to go to earthquake-shaken Yushu County and Zhouqu County which was hit by major fl ash fl oods for rescue and relief and for prevention of secondary geological disasters. Altogether 1,166 would-be geological disasters were avoided, 96,000 people were safely displaced, and 930 million yuan of direct economic losses were avoided.
【Flood control and disaster relief】In 2010, 17.06 million person•times of populations were removed out of typhoon-struck regions, regions vulnerable to flash floods, regions threatened by floods, and the downstream of reservoirs with great risks; and nearly one million victims of floods were rescued, minimizing the casualties. After the major fl ash fl oods striking Zhouqu County on August 8, 2010, Secretary General Hu Jintao and Premier Wen Jiabao made important instructions and guided the rescue and relief work. The PLA and Armed Police Hydropower Troops mobilized over 1,000 manpower and 200-odd large-scale construction machinery, and fought day and night against fl oods and mud and rock fl ows. Ministry of Water Resources mobilized over 120 experts and rescue and relief teams, and took disaster relief measures including digging-up, explosion and fl ooding. Thanks to the staunch fights of all parties involved for over 20 days and nights, the risks caused by barrier lakes were removed quickly, and the silted watercourses were dredged. The disaster relief work was accomplished successfully, which created favorable conditions for the disaster victims to return to their homeland, for restoration of production and life, and for post-disaster reconstruction.
【Setting up seismic monitoring, earthquake disaster defense, and emergency response schemes】More efforts were made to develop and implement the operation and management systems of earthquake monitoring stations and networks. The network’s operation rate was above 95%, and the output of data and products reached about 30G per day. The environmental upgrading was completed in 30 key stations. The service for sharing earthquake information and data was further strengthened, and the registered users reached up to over 4,400. The Measures on the Administration on Seismic Monitoring of Reservoirs was released, providing regulations on the construction, operation, management, and services of the monitoring stations and networks. The 12th
Five-Year Plan for Defense against Seismic Disasters, the 12th Five-Year Plan for Publicity for Earthquake Prevention and Disaster Relief, as well as the 12th Five-Year Plan for the Social Management and Public Services for the Earthquake Prevention and Disaster Relief were formulated. Over 3,000 administrative permits for earthquake-resistant requirements

201051
of key construction projects and approvals for dividing earthquake-prone residential quarters in urban areas were granted. More than 20,000 model settlements with quake-resistant houses were built up across the country, which included such houses for 6.6 million households. There were over 6,000 new model settlements in 2010, which consisted quake-resistant houses for 700,000 households. Instructions were given to about 50 cities on fundamental work of disaster prevention, including detecting of active fault, small-scale zoning, forecast of earthquake disasters, and survey on earthquake-resistant performances, which would serve for the city planning and earthquake prevention and relief. On April 14, a major earthquake measuring magnitude 7.1 on the Richter scale shook Yushu County of Qinghai Province, causing 2,968 deaths and missing persons, 11,000 persons injured, and direct economic losses up to 22.847 billion yuan. The positioning of the earthquake was done in five minutes after the quake, and the monitoring of aftershocks was available in two minutes. A variety of earthquake monitoring products such as earthquake parameters and the quake source mechanism were shared, and rescue teams consisting of over 23,000 members were sent out. China International Search and Rescue Team performed rescue tasks for Haiti Earthquake, Yushu Earthquake, Zhouqu flash floods and mud and rock fl ows and Pakistani Floods.
Note: The national data involved in this report does not include those of Taiwan Province, Hong Kong Special Administrative Region and Macao Special Administration Region, expect for the data on division of administrative regions, national land area, and seismic disasters.
【Emergency response to major marine pollution incidents】At 18:00 on July 16, 2010, an explosion happened to the pipeline of the oil reserves of China National Petroleum Corporation in Dalian New Port. A great deal of crude oil leaked into the sea, caused serious pollution to the sea areas in Dalian Bay, Dayao Bay, and Xiaoyao Bay, and had adverse impact on a dozen of sea beaches and coastal tourism sites including Boshi Bay, Jinshi Beach, and Bangchui Island, as well as sensitive marine function zones such as Sanshan Island Nature Reserve for Proliferation of Rare Marine Resources, Laopian Island-Yuhuangding Marine Ecology Nature Reserve, and Jinshi Beach Nature Reserve for Offshore Landform. In the aftermath of the incident, as arranged by the State Council, MEP organized Ministry of Transport and State Oceanic Administration to coordinate local governments in their emergency response and monitoring and surveillance work. Under the concerted and unremitting efforts of all parties involved, the oil spill was soon under control and effectively disposed, minimizing the pollution to the marine environment. By September 7, the oil level in the incident-affected seawaters returned to what was before the incident, the rare marine product cultivation bases in Changshan Islands were not affected by the oils, and the spilled oil did not enter Bohai Sea and high seas.

2010
Participating Agencies for Compilation of 2010 Report
Leading agency
Ministry of Environmental Protection
Contributing agencies
National Development and Reform Commission
The Ministry of Land and Resources
The Ministry of Housing and Urban-rural Development
The Ministry of Water Resources
The Ministry of Agriculture
The Ministry of Health
National Bureau of Statistics
State Forestry Administration
China Meteorological Administration
China Seismological Administration
State Oceanic Administration