Embed Size (px)
Citation preview

2011/02/09 CJCPropensity score
担当:小尾 佳嗣

What is propensity score?
多くの因子のデータをもとに
多重回帰解析を用いて算出した、
ある介入が行われる確率。

Why propensity score ?• 最も確実に介入効果を検証するには、RCTに代表される実験
的な研究が適当である。
• ただし、RCTが現実的ではない状況がある。– 倫理的問題– 費用的問題
• ICUの重症患者における右心カテーテルモニタリングの効果Conors A, et al. JAMA. 1996;276:889-897
• CADの既往/疑い症例に対するAspirinの生命予後に対する効果Gum P, et al. JAMA. 2001;286:1187-1194
• RCTを実行する前の予備的な仮説の検証
• RCTでも、補正が必要となる状況もある。– プロトコル逸脱などによるランダム化の失敗– Cluster randomized control trial
観察研究から、可能な限りBiasを除去する手法が必要。

Why not multivariate analysisusing OLS regression?
• モデル化したOutcomeと変数の関係が本当に正しいのか?– 複雑な関数や交互作用が存在すると、結果は不正確になる。
– 変数が多くなれば多くなるほど、この確率は高くなる。
• イベント発生数:変数の比が、10:1より小さいときは、多変量解析によるモデルは飽和してしまう。(バイアスが大きく不正確)– Logistic regressionでは、7:1以下ならpropensity scoreを用いる方が正確
という報告も。 (Cepeda AS, et al. Am J Epidemiol. 2003;158:280-287.)
多くの因子を一つにまとめたPS という変数を使った
マッチングや層別化、weighting により、RCTに擬似的な解析
(quasi-randomized experiment) を行うことができる。
0

Protocol for PS analysis
I. PS analysisに適したモデルの作成
① PSの仮定に基づいた変数の選択とdataの収集
② PS調整前における背景dataの比較 [E(+)群 vs E(-)群]
③ PS estimation
④ PSによるマッチング or 層化後における背景dataの比較
II. PSを用いた回帰分析

Assumptions of PSA) Strongly ignorable treatment assignment
割付けは観測した変数に依存し,アウトカムには依存しない。
変数の測定が介入の割り当て以前に行われること 介入後に生じた変数の変動は、アウトカムに影響するため。
観測した変数によって、割付けを説明できること C-indexでCheck
観測されていない共変数・交絡要因が割付けに影響を与えないこと理想的には、割付けや予後に影響を与える因子を全て事前に列挙する。
Retrospective に行う際や追加研究では、実際に観測した全変数である場合が多い。
B) Overlap assumption比較しうる症例の重なりが存在する。 ガイドラインに沿って割り当てが決定されていれば、同じような条件の
症例がほどんどいないために、両者を比較することができない。

PS estimation
• アウトカムや割り当てに関連する可能性のある因子は全て含める。
• 集めた全ての変数を用いてExposureをアウトカムとしたLogistic
regressionを行うことが一般的
連続変数を正規分布に近づけるよう適切に変換、もしくは区分変数化する。
例外的に、Over fittingは許容される。 (10:1を超えて良い)
• モデルの作成方法は、色々あります。(後述)
それでは、過去の実際の論文を見ていきましょう!

Aspirin Use and All-Cause Mortality Among Patients Being Evaluated for Known or Suspected Coronary Artery Disease
Gum P, et al. JAMA. 2001;286:1187-1194
…[Design and Setting] Prospective, nonrandomized, observational cohort study conducted between 1990 and 1998 at an academic medical institution, with a median follow-up of 3.1 years.
[Patients]Of 6174 consecutive adults undergoing stress echocardiography for evaluation of known or suspected coronary disease, 2310 (37%) were taking aspirin. Patients with significant valvular disease or documented contraindication to aspirin use, including peptic ulcer disease, renal insufficiency, and use of nonsteroidal antiinflammatory drugs, were excluded.
[Main Outcome Measure ] All-cause mortality according to aspirin use.
[Results] During 3.1 years of follow-up, 276 patients (4.5%) died. …

Strongly ignorable treatment assignment
• Data on baseline demographics, medical history, cardiovascular risk factors,
and medication use (including regular use of aspirin) were collected
prospectively at the time of testing. All data were entered online prior to
the start of the stress test by either a physician or a trained exercise
physiologist, with those entering data into the database blinded to the
hypothesis of this study as well as to the results of the subsequent stress
test and stress echocardiogram.
ここで選択された変数は、同様に死亡をアウトカムとして運動負荷エ
コー時の心拍変時能との関係をみた先行研究で測定されたもの。
アスピリンの使用に関わる変数として選択されたものではない。
全て観察開始時点で、各変数を測定している。

PS estimation• The propensity for aspirin use was determined without regard to outcome, using
multivariable logistic regression analysis. A full non-parsimonious model was
developed that included 34 covariates, some of which are listed in TABLE 1. This
model yielded a c statistic of 0.83, indicating a strong ability to differentiate
between aspirin users and nonusers. A propensity score for aspirin use was then
calculated from the logistic equation for each patient. This score ranged from
0.03 to 0.98 and, in effect, represented the probability that a patient would be
using aspirin.
観察期間中の死亡が276例なので、34もの変数を生存解析に直接投入す
ることは困難なため、PSを用いている。
フルモデルでPSを算出し、C-indexも提示。
Resultで、Interactionもモデルに組み込んでいることが記載されている。

Comparison baseline characteristics between 2 groups
マッチング後、男性のpeak exercise capacity以外は全て有意差なし!

Result単変量解析では有意差は認められなかったが、多変量解析では有意になっている。
PSによるmatchingを行った後に様々なモデ
ルで検討しても、その結果はほぼ変わらず認められることから、アスピリンの有効性がより確かなものとなった。

PitfallComparison of the baseline characteristics
A) マッチング後における解析
独立したサンプルではないことを考慮する必要がある!
Paired t-test (Not t-test)
Willcoxon matched pairs signed-rank test (Not Willcoxn rank sum test)
McNemar test (Not Chi squared test)
Absolute standardized difference in covariate means
• Sample sizeも考慮に入れた比較方法
B) マッチング以外の手法を用いるときの背景比較
一般的には5群のQuintileに分けて、各層で比較
Nが少ないときは3~4層になることも
通常の比較方法でOK
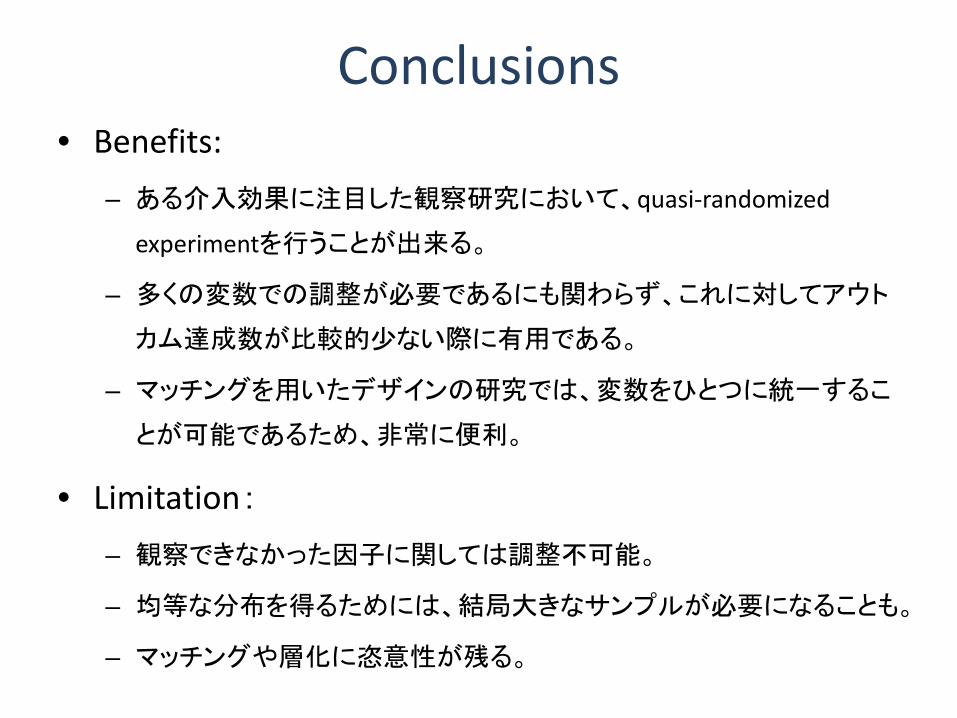
Conclusions• Benefits:
– ある介入効果に注目した観察研究において、quasi-randomized
experimentを行うことが出来る。
– 多くの変数での調整が必要であるにも関わらず、これに対してアウト
カム達成数が比較的少ない際に有用である。
– マッチングを用いたデザインの研究では、変数をひとつに統一するこ
とが可能であるため、非常に便利。
• Limitation:– 観察できなかった因子に関しては調整不可能。
– 均等な分布を得るためには、結局大きなサンプルが必要になることも。
– マッチングや層化に恣意性が残る。

各種PS model作成法
Author Procedure
Rosenbaum & Rubin (1984)
① 変数選択法 [|t|>1.5 (df 20でP = 0.15)] でPS model を作成
② E(+)群 vs E(-)群 で有意な変数があれば、2乗項や2変数間の交互作用項を含め、再度PSを作成する。
Eichler & Lechner (2002) 最初から2乗項と全ての1次交互作用項を含める。
Dehejima & Wahba (1999)
① 全ての1次項で作成したPSで層別化し、各層で群間比較を行う。
② 群間に有意差があれば、より高次の項や交互作用項を含める。
Hirano & Imbens (2001)
① 有意差をいくつか設定(e.g. t=0, 1, 2, 4, 8, 16, ∞)
② 各変数の1次項で、介入に対するLogistic regressionを行う
③ 同様に 各変数の1次項で、Outcomeの適切なregressionを行う
④ 一方でも有意な変数を用いて、設定した各t値におけるPSを作成
⑤ それぞれのPSで解析を行う。(Sensitivity analysisのようなもの)