Embed Size (px)
Citation preview
2016 LEGISLATIVE REPORT
EDUCATOR PREPARATION REPORT AY2014-2015
FEBRUARY 2016
1560 Broadway, Suite 1600Denver, Colorado 80204(303) 866-2723
LT. GOVERNOR JOSEPH GARCIA, EXECUTIVE DIRECTOR
2
TABLE OF CONTENTS
Executive Summary …………………………………………………………………………… 4
I. INTRODUCTION ……………………………....………………………………………..…. 5
II. COMPLETERS …………………………………………………………………….…….. 5
III. ENROLLMENT …………………………………………………………………….…….. 13
IV. DEMOGRAPHICS ………………………………………………………………….……….. 17
V. REAUTHORIZATION AND PROGRAMMATIC APPROVAL ………………………….………… 19
VI. AREAS OF FOCUS AND RECOMMENDATIONS ………………………………………….…… 19
3
This report was prepared by the Student Success and Academic Affairs Division at the Colorado Department of
Higher Education (CDHE) with the assistance of the Office of Educator Preparation, Licensing and
Enforcement at the Colorado Department of Education (CDE) pursuant to the requirements of §23-1-121(6)
Colorado Revised Statutes.
For more information please contact:
Robert Mitchell, Academic Policy Officer for Educator Preparation, Colorado Department of Higher Education,
303-862-3006 or [email protected]
4
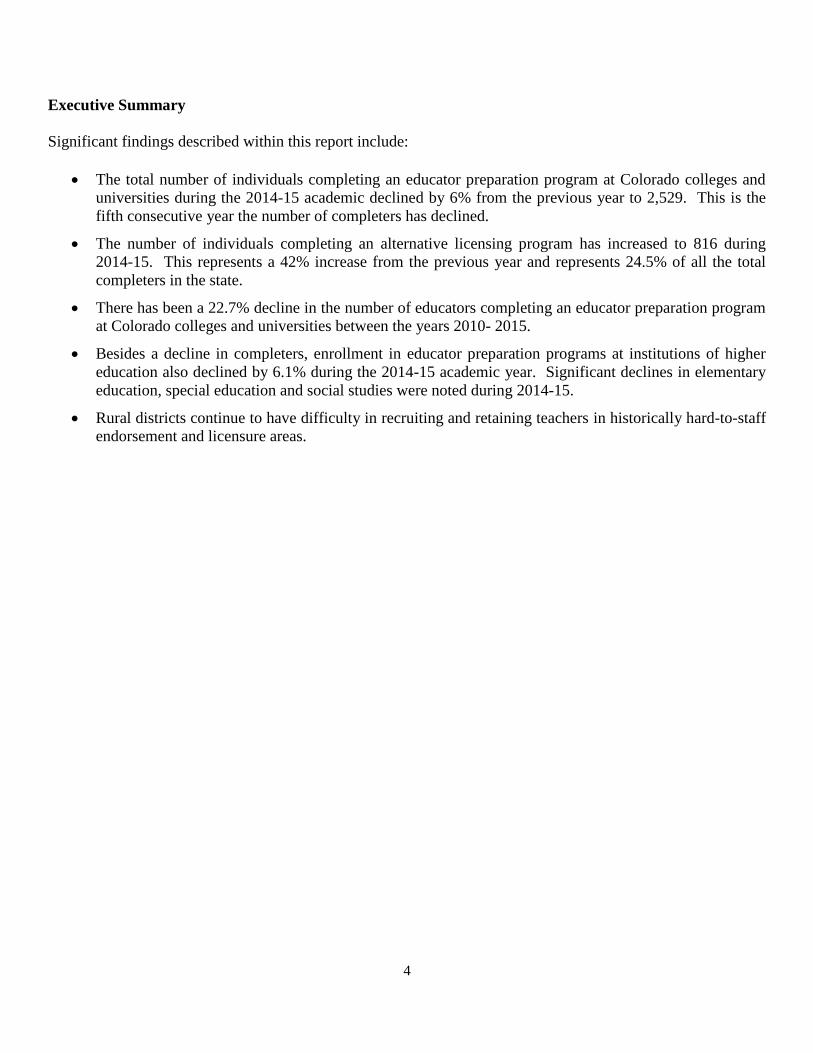
Executive Summary
Significant findings described within this report include:
The total number of individuals completing an educator preparation program at Colorado colleges and
universities during the 2014-15 academic declined by 6% from the previous year to 2,529. This is the
fifth consecutive year the number of completers has declined.
The number of individuals completing an alternative licensing program has increased to 816 during
2014-15. This represents a 42% increase from the previous year and represents 24.5% of all the total
completers in the state.
There has been a 22.7% decline in the number of educators completing an educator preparation program
at Colorado colleges and universities between the years 2010- 2015.
Besides a decline in completers, enrollment in educator preparation programs at institutions of higher
education also declined by 6.1% during the 2014-15 academic year. Significant declines in elementary
education, special education and social studies were noted during 2014-15.
Rural districts continue to have difficulty in recruiting and retaining teachers in historically hard-to-staff
endorsement and licensure areas.
5
I. Introduction
Pursuant to §23-1-121(6) Colorado Revised Statutes, the Colorado Commission on Higher Education (CCHE)
reports annually to the Joint Education Committee of the General Assembly on enrollment in, graduation
(completion) rates from, and effectiveness of the review of educator preparation programs at institutions of
higher education and designated agencies. This report fulfills this statutory requirement.
This report was completed by the Colorado Department of Higher Education (CDHE). The materials utilized in
this report originate from data submitted annually to the department by the 20 institutions of higher education
offering educator preparation. Additional material to supplement the report has been provided by the Colorado
Department of Education (CDE) and the Colorado Workforce Development Council.
The report is divided into five sections: an analysis of completers of educator preparation programs, data related
to enrollment in educator preparation programs, demographic composition of enrolled populations, a review of
reauthorization activities and alignment with national accreditation, and recommendations to meet the projected
needs and trends impacting the development of educators.
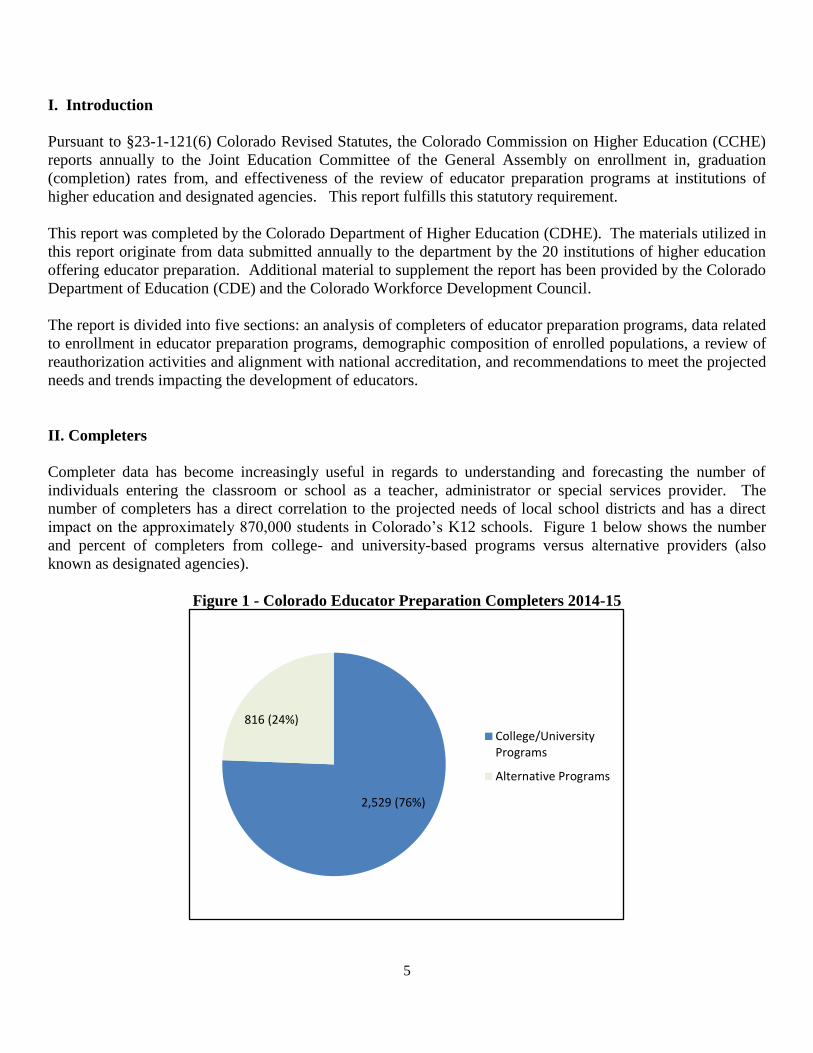
II. Completers
Completer data has become increasingly useful in regards to understanding and forecasting the number of
individuals entering the classroom or school as a teacher, administrator or special services provider. The
number of completers has a direct correlation to the projected needs of local school districts and has a direct
impact on the approximately 870,000 students in Colorado’s K12 schools. Figure 1 below shows the number
and percent of completers from college- and university-based programs versus alternative providers (also
known as designated agencies).
Figure 1 - Colorado Educator Preparation Completers 2014-15
2,529 (76%)
816 (24%) College/UniversityPrograms
Alternative Programs
6
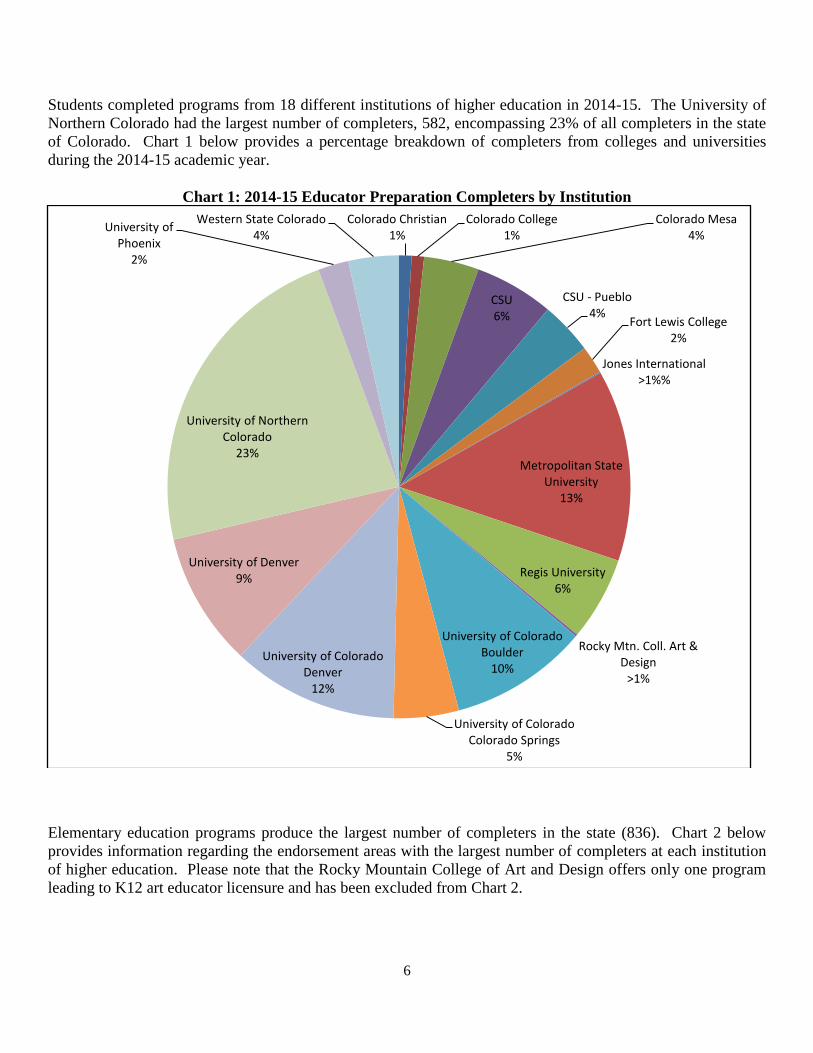
Students completed programs from 18 different institutions of higher education in 2014-15. The University of
Northern Colorado had the largest number of completers, 582, encompassing 23% of all completers in the state
of Colorado. Chart 1 below provides a percentage breakdown of completers from colleges and universities
during the 2014-15 academic year.
Chart 1: 2014-15 Educator Preparation Completers by Institution
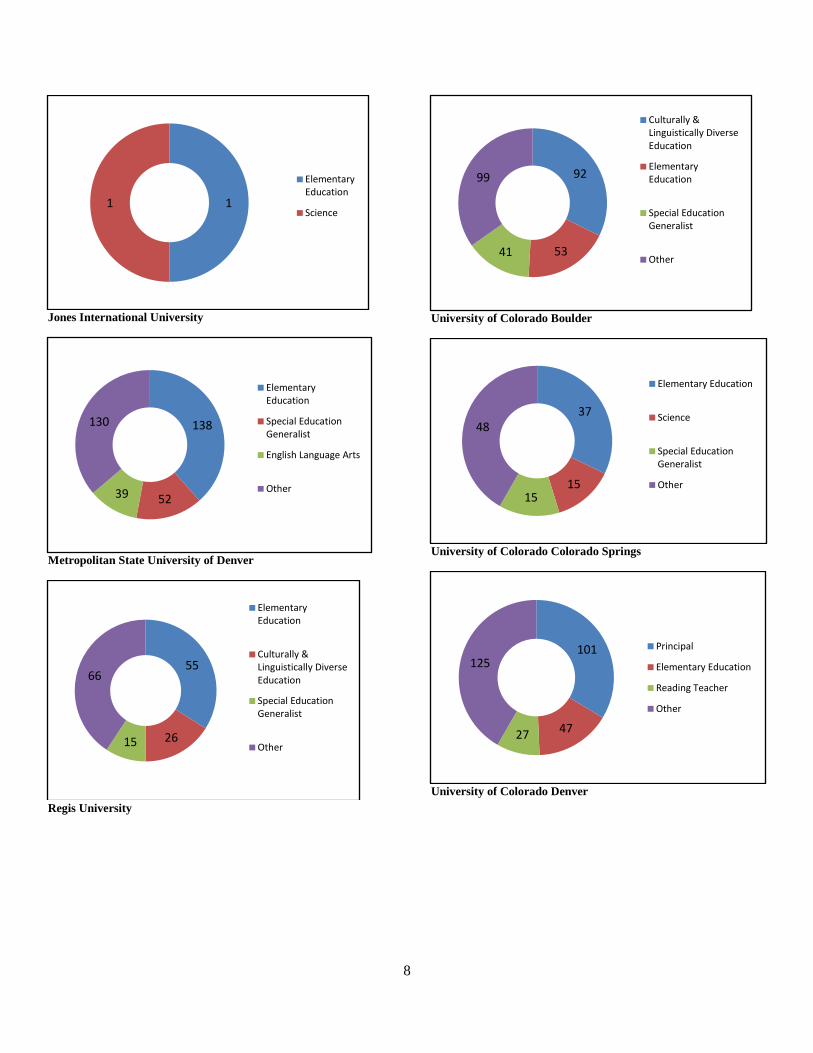
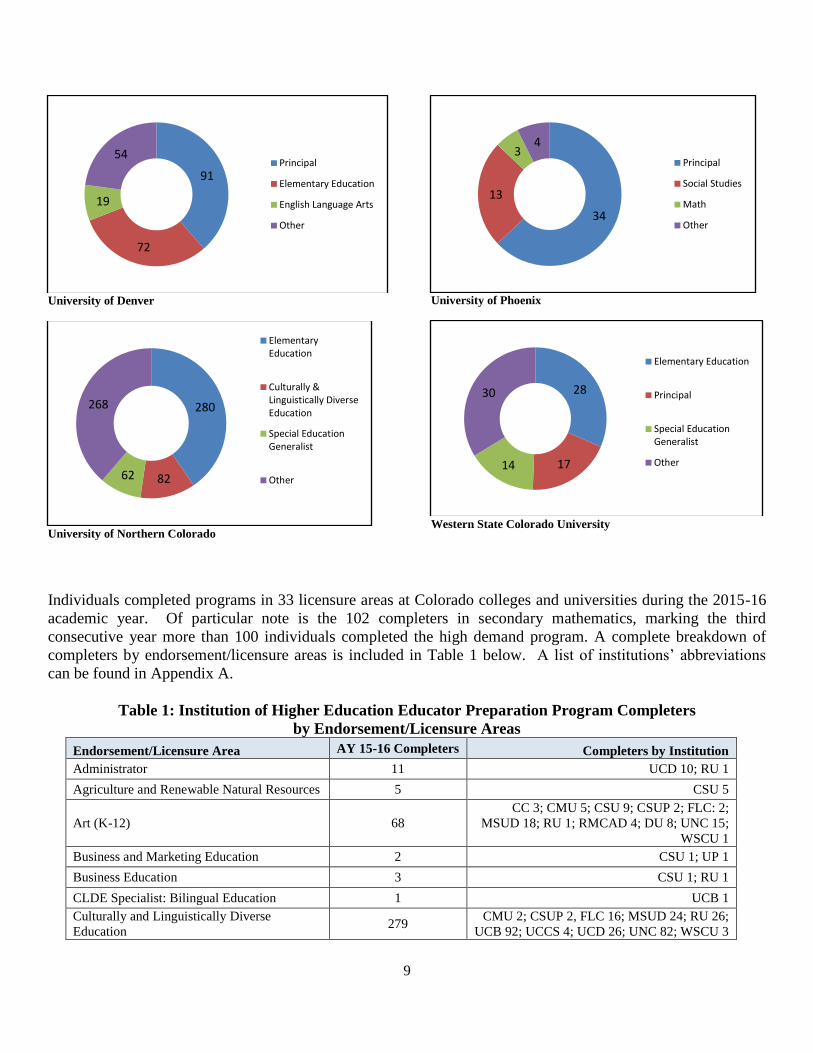
Elementary education programs produce the largest number of completers in the state (836). Chart 2 below
provides information regarding the endorsement areas with the largest number of completers at each institution
of higher education. Please note that the Rocky Mountain College of Art and Design offers only one program
leading to K12 art educator licensure and has been excluded from Chart 2.
Colorado Christian 1%
Colorado College 1%
Colorado Mesa 4%
CSU 6%
CSU - Pueblo 4%
Fort Lewis College 2%
Jones International >1%%
Metropolitan State University
13%
Regis University 6%
Rocky Mtn. Coll. Art & Design
>1%
University of Colorado Boulder
10%
University of Colorado Colorado Springs
5%
University of Colorado Denver
12%
University of Denver 9%
University of Northern Colorado
23%
University of Phoenix
2%
Western State Colorado 4%
7
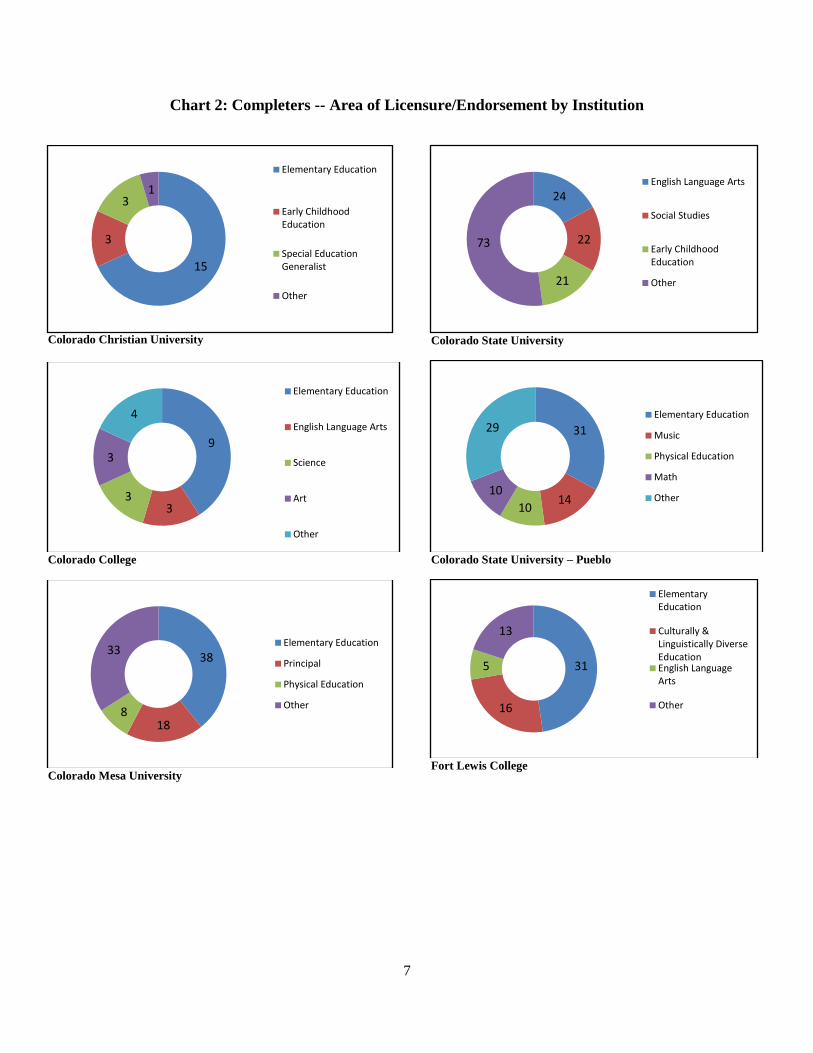
Chart 2: Completers -- Area of Licensure/Endorsement by Institution
Colorado Christian University
Colorado College
Colorado Mesa University
Colorado State University
Colorado State University – Pueblo
Fort Lewis College
15
3
3 1
Elementary Education
Early ChildhoodEducation
Special EducationGeneralist
Other
9
3 3
3
4
Elementary Education
English Language Arts
Science
Art
Other
38
18 8
33 Elementary Education
Principal
Physical Education
Other
24
22
21
73
English Language Arts
Social Studies
Early ChildhoodEducation
Other
31
14 10
10
29 Elementary Education
Music
Physical Education
Math
Other
31
16
5
13
ElementaryEducation
Culturally &Linguistically DiverseEducationEnglish LanguageArts
Other
8
Jones International University
Metropolitan State University of Denver
Regis University
University of Colorado Boulder
University of Colorado Colorado Springs
University of Colorado Denver
1 1
ElementaryEducation
Science
138
52 39
130
ElementaryEducation
Special EducationGeneralist
English Language Arts
Other
55
26 15
66
ElementaryEducation
Culturally &Linguistically DiverseEducation
Special EducationGeneralist
Other
92
53 41
99
Culturally &Linguistically DiverseEducation
ElementaryEducation
Special EducationGeneralist
Other
37
15 15
48
Elementary Education
Science
Special EducationGeneralist
Other
101
47 27
125
Principal
Elementary Education
Reading Teacher
Other
9
University of Denver
University of Northern Colorado
University of Phoenix
Western State Colorado University
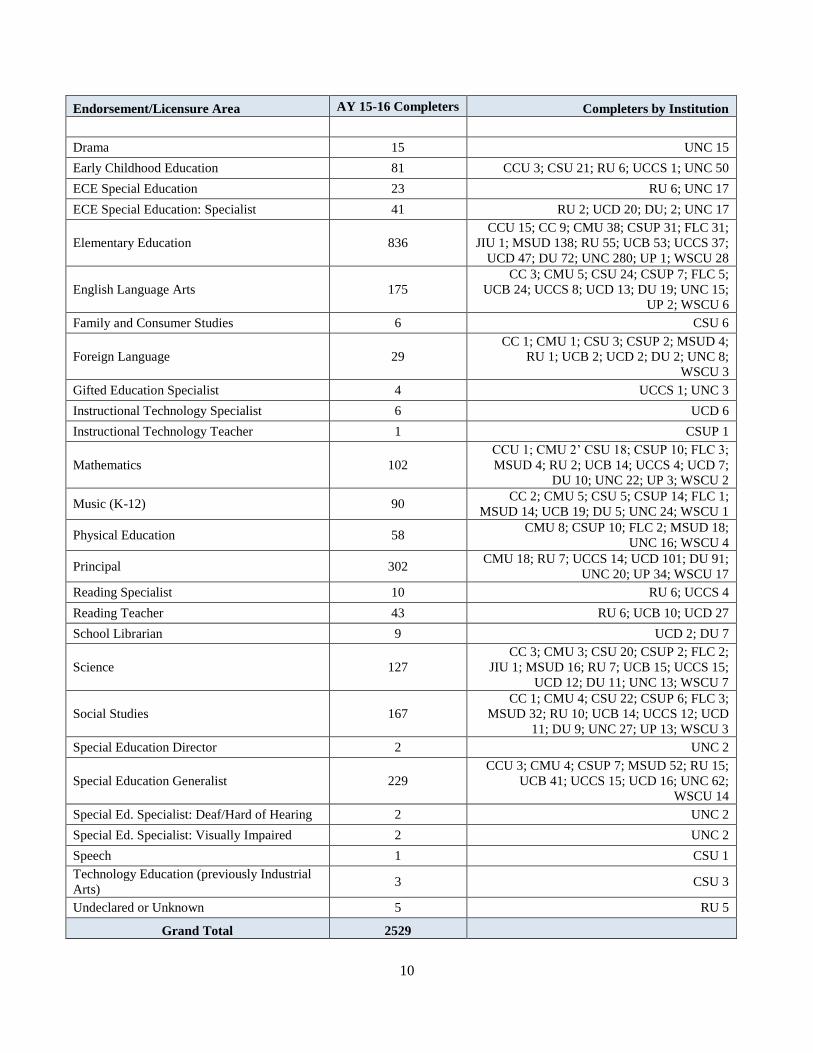
Individuals completed programs in 33 licensure areas at Colorado colleges and universities during the 2015-16
academic year. Of particular note is the 102 completers in secondary mathematics, marking the third
consecutive year more than 100 individuals completed the high demand program. A complete breakdown of
completers by endorsement/licensure areas is included in Table 1 below. A list of institutions’ abbreviations
can be found in Appendix A.
Table 1: Institution of Higher Education Educator Preparation Program Completers
by Endorsement/Licensure Areas
Endorsement/Licensure Area AY 15-16 Completers Completers by Institution
Administrator 11 UCD 10; RU 1
Agriculture and Renewable Natural Resources 5 CSU 5
Art (K-12) 68
CC 3; CMU 5; CSU 9; CSUP 2; FLC: 2;
MSUD 18; RU 1; RMCAD 4; DU 8; UNC 15;
WSCU 1
Business and Marketing Education 2 CSU 1; UP 1
Business Education 3 CSU 1; RU 1
CLDE Specialist: Bilingual Education 1 UCB 1
Culturally and Linguistically Diverse
Education 279
CMU 2; CSUP 2, FLC 16; MSUD 24; RU 26;
UCB 92; UCCS 4; UCD 26; UNC 82; WSCU 3
91
72
19
54 Principal
Elementary Education
English Language Arts
Other
280
82 62
268
ElementaryEducation
Culturally &Linguistically DiverseEducation
Special EducationGeneralist
Other
34
13
3 4
Principal
Social Studies
Math
Other
28
17 14
30
Elementary Education
Principal
Special EducationGeneralist
Other
10
Endorsement/Licensure Area AY 15-16 Completers Completers by Institution
Drama 15 UNC 15
Early Childhood Education 81 CCU 3; CSU 21; RU 6; UCCS 1; UNC 50
ECE Special Education 23 RU 6; UNC 17
ECE Special Education: Specialist 41 RU 2; UCD 20; DU; 2; UNC 17
Elementary Education 836
CCU 15; CC 9; CMU 38; CSUP 31; FLC 31;
JIU 1; MSUD 138; RU 55; UCB 53; UCCS 37;
UCD 47; DU 72; UNC 280; UP 1; WSCU 28
English Language Arts 175
CC 3; CMU 5; CSU 24; CSUP 7; FLC 5;
UCB 24; UCCS 8; UCD 13; DU 19; UNC 15;
UP 2; WSCU 6
Family and Consumer Studies 6 CSU 6
Foreign Language 29
CC 1; CMU 1; CSU 3; CSUP 2; MSUD 4;
RU 1; UCB 2; UCD 2; DU 2; UNC 8;
WSCU 3
Gifted Education Specialist 4 UCCS 1; UNC 3
Instructional Technology Specialist 6 UCD 6
Instructional Technology Teacher 1 CSUP 1
Mathematics 102
CCU 1; CMU 2’ CSU 18; CSUP 10; FLC 3;
MSUD 4; RU 2; UCB 14; UCCS 4; UCD 7;
DU 10; UNC 22; UP 3; WSCU 2
Music (K-12) 90 CC 2; CMU 5; CSU 5; CSUP 14; FLC 1;
MSUD 14; UCB 19; DU 5; UNC 24; WSCU 1
Physical Education 58 CMU 8; CSUP 10; FLC 2; MSUD 18;
UNC 16; WSCU 4
Principal 302 CMU 18; RU 7; UCCS 14; UCD 101; DU 91;
UNC 20; UP 34; WSCU 17
Reading Specialist 10 RU 6; UCCS 4
Reading Teacher 43 RU 6; UCB 10; UCD 27
School Librarian 9 UCD 2; DU 7
Science 127
CC 3; CMU 3; CSU 20; CSUP 2; FLC 2;
JIU 1; MSUD 16; RU 7; UCB 15; UCCS 15;
UCD 12; DU 11; UNC 13; WSCU 7
Social Studies 167
CC 1; CMU 4; CSU 22; CSUP 6; FLC 3;
MSUD 32; RU 10; UCB 14; UCCS 12; UCD
11; DU 9; UNC 27; UP 13; WSCU 3
Special Education Director 2 UNC 2
Special Education Generalist 229
CCU 3; CMU 4; CSUP 7; MSUD 52; RU 15;
UCB 41; UCCS 15; UCD 16; UNC 62;
WSCU 14
Special Ed. Specialist: Deaf/Hard of Hearing 2 UNC 2
Special Ed. Specialist: Visually Impaired 2 UNC 2
Speech 1 CSU 1
Technology Education (previously Industrial
Arts) 3 CSU 3
Undeclared or Unknown 5 RU 5
Grand Total 2529
11
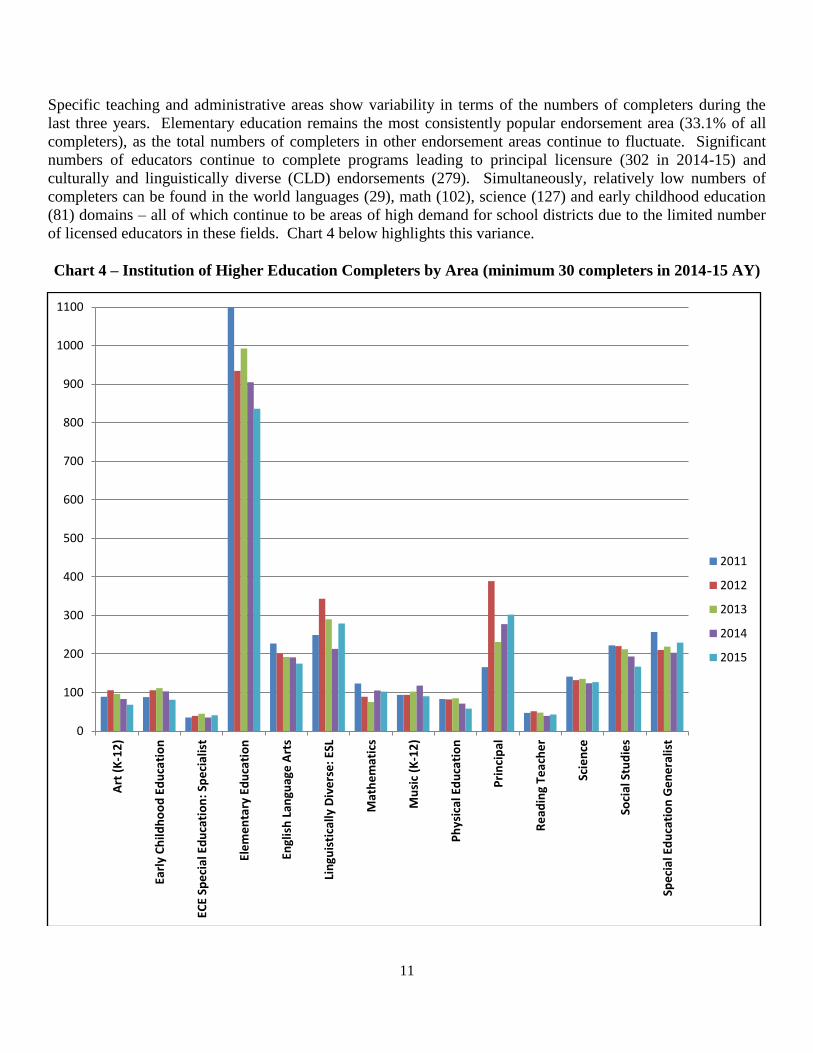
Specific teaching and administrative areas show variability in terms of the numbers of completers during the
last three years. Elementary education remains the most consistently popular endorsement area (33.1% of all
completers), as the total numbers of completers in other endorsement areas continue to fluctuate. Significant
numbers of educators continue to complete programs leading to principal licensure (302 in 2014-15) and
culturally and linguistically diverse (CLD) endorsements (279). Simultaneously, relatively low numbers of
completers can be found in the world languages (29), math (102), science (127) and early childhood education
(81) domains – all of which continue to be areas of high demand for school districts due to the limited number
of licensed educators in these fields. Chart 4 below highlights this variance.
Chart 4 – Institution of Higher Education Completers by Area (minimum 30 completers in 2014-15 AY)
0
100
200
300
400
500
600
700
800
900
1000
1100
Art
(K
-12
)
Earl
y C
hild
ho
od
Ed
uca
tio
n
ECE
Spe
cial
Ed
uca
tio
n:
Spe
cial
ist
Ele
me
nta
ry E
du
cati
on
Engl
ish
Lan
guag
e A
rts
Lin
guis
tica
lly D
ive
rse
: ES
L
Mat
he
mat
ics
Mu
sic
(K-1
2)
Ph
ysic
al E
du
cati
on
Pri
nci
pal
Re
adin
g Te
ach
er
Scie
nce
Soci
al S
tud
ies
Spe
cia
l Ed
uca
tio
n G
en
era
list
2011
2012
2013
2014
2015
12
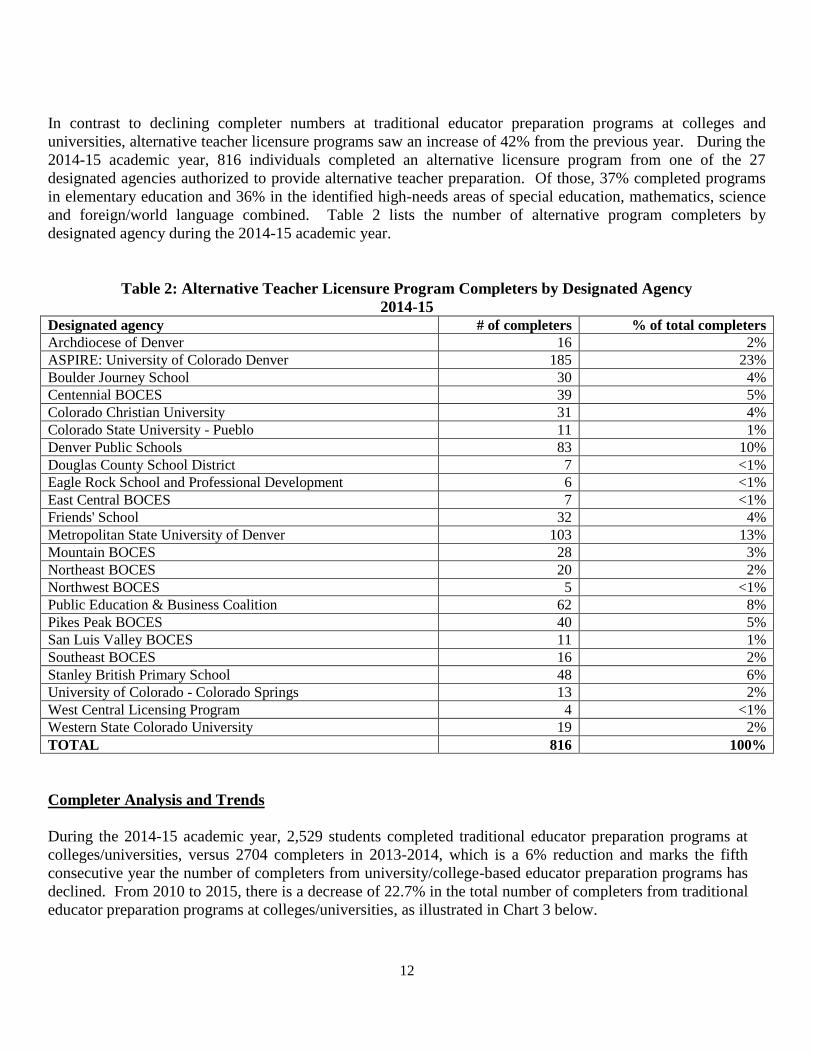
In contrast to declining completer numbers at traditional educator preparation programs at colleges and
universities, alternative teacher licensure programs saw an increase of 42% from the previous year. During the
2014-15 academic year, 816 individuals completed an alternative licensure program from one of the 27
designated agencies authorized to provide alternative teacher preparation. Of those, 37% completed programs
in elementary education and 36% in the identified high-needs areas of special education, mathematics, science
and foreign/world language combined. Table 2 lists the number of alternative program completers by
designated agency during the 2014-15 academic year.
Table 2: Alternative Teacher Licensure Program Completers by Designated Agency
2014-15
Designated agency # of completers % of total completers
Archdiocese of Denver 16 2%
ASPIRE: University of Colorado Denver 185 23%
Boulder Journey School 30 4%
Centennial BOCES 39 5%
Colorado Christian University 31 4%
Colorado State University - Pueblo 11 1%
Denver Public Schools 83 10%
Douglas County School District 7 <1%
Eagle Rock School and Professional Development 6 <1%
East Central BOCES 7 <1%
Friends' School 32 4%
Metropolitan State University of Denver 103 13%
Mountain BOCES 28 3%
Northeast BOCES 20 2%
Northwest BOCES 5 <1%
Public Education & Business Coalition 62 8%
Pikes Peak BOCES 40 5%
San Luis Valley BOCES 11 1%
Southeast BOCES 16 2%
Stanley British Primary School 48 6%
University of Colorado - Colorado Springs 13 2%
West Central Licensing Program 4 <1%
Western State Colorado University 19 2%
TOTAL 816 100%
Completer Analysis and Trends
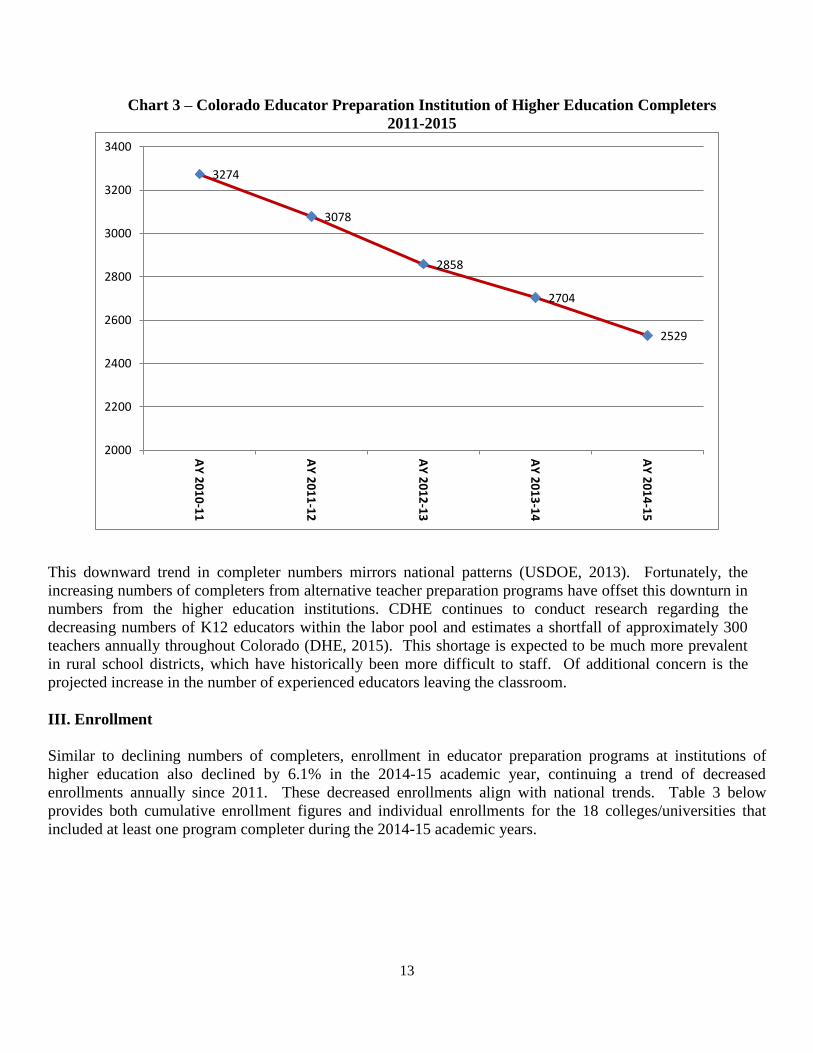
During the 2014-15 academic year, 2,529 students completed traditional educator preparation programs at
colleges/universities, versus 2704 completers in 2013-2014, which is a 6% reduction and marks the fifth
consecutive year the number of completers from university/college-based educator preparation programs has
declined. From 2010 to 2015, there is a decrease of 22.7% in the total number of completers from traditional
educator preparation programs at colleges/universities, as illustrated in Chart 3 below.
13
Chart 3 – Colorado Educator Preparation Institution of Higher Education Completers
2011-2015
This downward trend in completer numbers mirrors national patterns (USDOE, 2013). Fortunately, the
increasing numbers of completers from alternative teacher preparation programs have offset this downturn in
numbers from the higher education institutions. CDHE continues to conduct research regarding the
decreasing numbers of K12 educators within the labor pool and estimates a shortfall of approximately 300
teachers annually throughout Colorado (DHE, 2015). This shortage is expected to be much more prevalent
in rural school districts, which have historically been more difficult to staff. Of additional concern is the
projected increase in the number of experienced educators leaving the classroom.
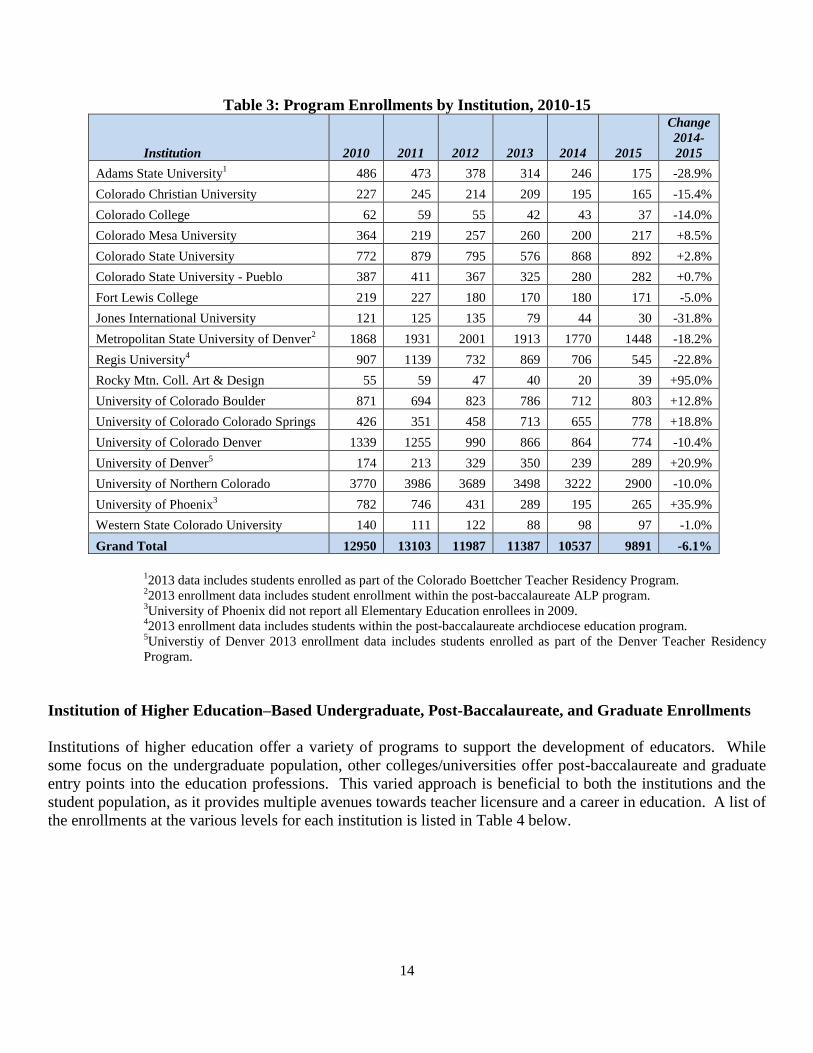
III. Enrollment
Similar to declining numbers of completers, enrollment in educator preparation programs at institutions of
higher education also declined by 6.1% in the 2014-15 academic year, continuing a trend of decreased
enrollments annually since 2011. These decreased enrollments align with national trends. Table 3 below
provides both cumulative enrollment figures and individual enrollments for the 18 colleges/universities that
included at least one program completer during the 2014-15 academic years.
3274
3078
2858
2704
2529
2000
2200
2400
2600
2800
3000
3200
3400
AY
20
10
-11
AY
20
11
-12
AY
20
12
-13
AY
20
13
-14
AY
20
14
-15
14
Table 3: Program Enrollments by Institution, 2010-15
Institution 2010 2011 2012 2013 2014 2015
Change
2014-
2015
Adams State University1 486 473 378 314 246 175 -28.9%
Colorado Christian University 227 245 214 209 195 165 -15.4%
Colorado College 62 59 55 42 43 37 -14.0%
Colorado Mesa University 364 219 257 260 200 217 +8.5%
Colorado State University 772 879 795 576 868 892 +2.8%
Colorado State University - Pueblo 387 411 367 325 280 282 +0.7%
Fort Lewis College 219 227 180 170 180 171 -5.0%
Jones International University 121 125 135 79 44 30 -31.8%
Metropolitan State University of Denver2 1868 1931 2001 1913 1770 1448 -18.2%
Regis University4 907 1139 732 869 706 545 -22.8%
Rocky Mtn. Coll. Art & Design 55 59 47 40 20 39 +95.0%
University of Colorado Boulder 871 694 823 786 712 803 +12.8%
University of Colorado Colorado Springs 426 351 458 713 655 778 +18.8%
University of Colorado Denver 1339 1255 990 866 864 774 -10.4%
University of Denver5
174 213 329 350 239 289 +20.9%
University of Northern Colorado 3770 3986 3689 3498 3222 2900 -10.0%
University of Phoenix3 782 746 431 289 195 265 +35.9%
Western State Colorado University 140 111 122 88 98 97 -1.0%
Grand Total 12950 13103 11987 11387 10537 9891 -6.1%
12013 data includes students enrolled as part of the Colorado Boettcher Teacher Residency Program.
22013 enrollment data includes student enrollment within the post-baccalaureate ALP program.
3University of Phoenix did not report all Elementary Education enrollees in 2009.
42013 enrollment data includes students within the post-baccalaureate archdiocese education program.
5Universtiy of Denver 2013 enrollment data includes students enrolled as part of the Denver Teacher Residency
Program.
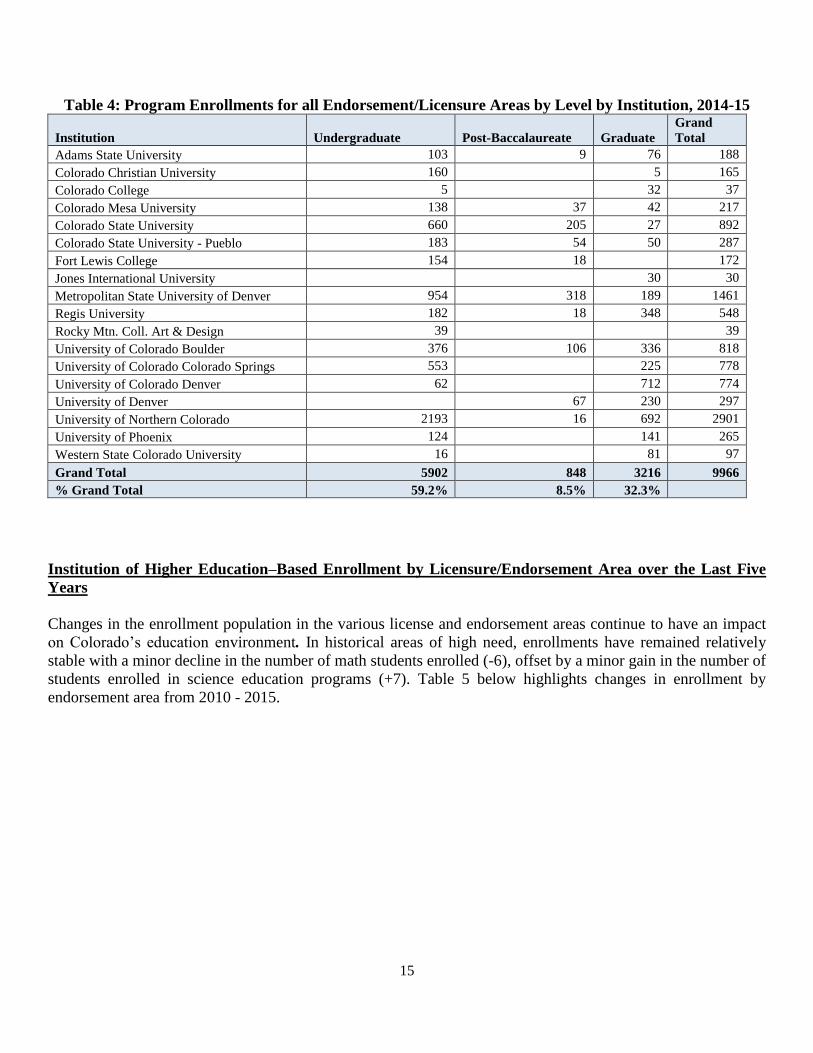
Institution of Higher Education–Based Undergraduate, Post-Baccalaureate, and Graduate Enrollments
Institutions of higher education offer a variety of programs to support the development of educators. While
some focus on the undergraduate population, other colleges/universities offer post-baccalaureate and graduate
entry points into the education professions. This varied approach is beneficial to both the institutions and the
student population, as it provides multiple avenues towards teacher licensure and a career in education. A list of
the enrollments at the various levels for each institution is listed in Table 4 below.
15
Table 4: Program Enrollments for all Endorsement/Licensure Areas by Level by Institution, 2014-15
Institution Undergraduate Post-Baccalaureate Graduate
Grand
Total
Adams State University 103 9 76 188
Colorado Christian University 160 5 165
Colorado College 5 32 37
Colorado Mesa University 138 37 42 217
Colorado State University 660 205 27 892
Colorado State University - Pueblo 183 54 50 287
Fort Lewis College 154 18 172
Jones International University 30 30
Metropolitan State University of Denver 954 318 189 1461
Regis University 182 18 348 548
Rocky Mtn. Coll. Art & Design 39 39
University of Colorado Boulder 376 106 336 818
University of Colorado Colorado Springs 553 225 778
University of Colorado Denver 62 712 774
University of Denver 67 230 297
University of Northern Colorado 2193 16 692 2901
University of Phoenix 124 141 265
Western State Colorado University 16 81 97
Grand Total 5902 848 3216 9966
% Grand Total 59.2% 8.5% 32.3%
Institution of Higher Education–Based Enrollment by Licensure/Endorsement Area over the Last Five
Years
Changes in the enrollment population in the various license and endorsement areas continue to have an impact
on Colorado’s education environment. In historical areas of high need, enrollments have remained relatively
stable with a minor decline in the number of math students enrolled (-6), offset by a minor gain in the number of
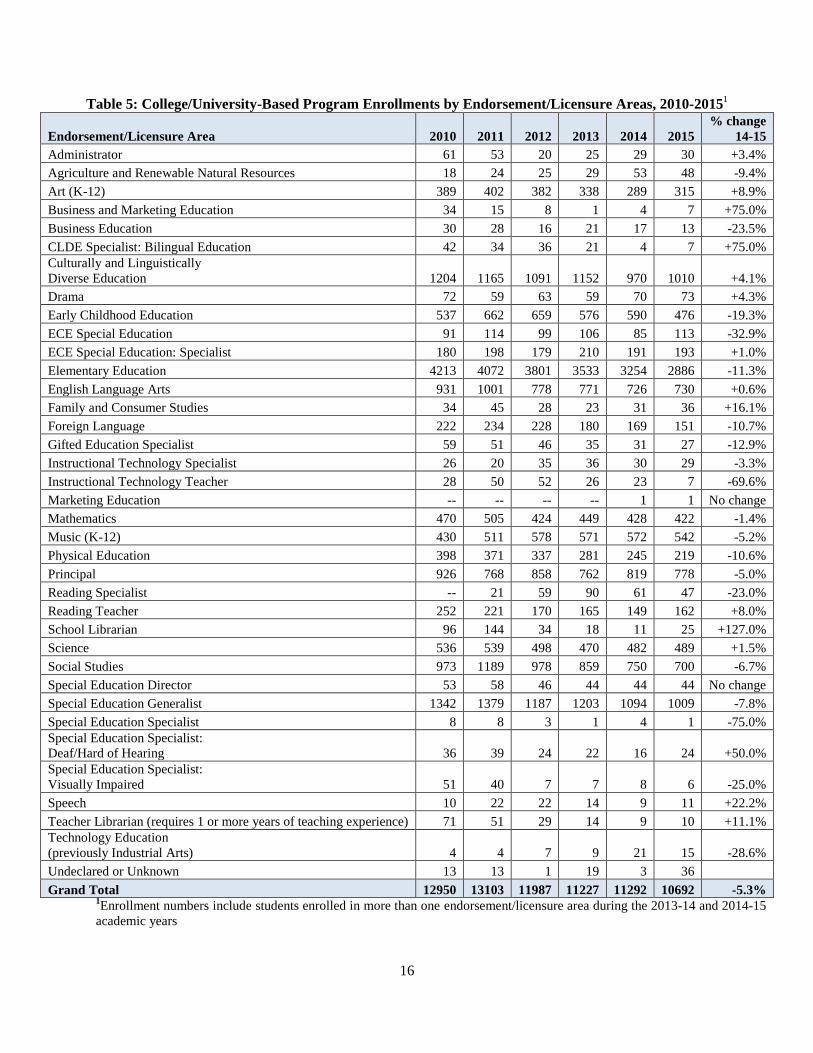
students enrolled in science education programs (+7). Table 5 below highlights changes in enrollment by
endorsement area from 2010 - 2015.
16
Table 5: College/University-Based Program Enrollments by Endorsement/Licensure Areas, 2010-20151
1Enrollment numbers include students enrolled in more than one endorsement/licensure area during the 2013-14 and 2014-15
academic years
Endorsement/Licensure Area 2010 2011 2012 2013 2014 2015
% change
14-15
Administrator 61 53 20 25 29 30 +3.4%
Agriculture and Renewable Natural Resources 18 24 25 29 53 48 -9.4%
Art (K-12) 389 402 382 338 289 315 +8.9%
Business and Marketing Education 34 15 8 1 4 7 +75.0%
Business Education 30 28 16 21 17 13 -23.5%
CLDE Specialist: Bilingual Education 42 34 36 21 4 7 +75.0%
Culturally and Linguistically
Diverse Education 1204 1165 1091 1152 970 1010 +4.1%
Drama 72 59 63 59 70 73 +4.3%
Early Childhood Education 537 662 659 576 590 476 -19.3%
ECE Special Education 91 114 99 106 85 113 -32.9%
ECE Special Education: Specialist 180 198 179 210 191 193 +1.0%
Elementary Education 4213 4072 3801 3533 3254 2886 -11.3%
English Language Arts 931 1001 778 771 726 730 +0.6%
Family and Consumer Studies 34 45 28 23 31 36 +16.1%
Foreign Language 222 234 228 180 169 151 -10.7%
Gifted Education Specialist 59 51 46 35 31 27 -12.9%
Instructional Technology Specialist 26 20 35 36 30 29 -3.3%
Instructional Technology Teacher 28 50 52 26 23 7 -69.6%
Marketing Education -- -- -- -- 1 1 No change
Mathematics 470 505 424 449 428 422 -1.4%
Music (K-12) 430 511 578 571 572 542 -5.2%
Physical Education 398 371 337 281 245 219 -10.6%
Principal 926 768 858 762 819 778 -5.0%
Reading Specialist -- 21 59 90 61 47 -23.0%
Reading Teacher 252 221 170 165 149 162 +8.0%
School Librarian 96 144 34 18 11 25 +127.0%
Science 536 539 498 470 482 489 +1.5%
Social Studies 973 1189 978 859 750 700 -6.7%
Special Education Director 53 58 46 44 44 44 No change
Special Education Generalist 1342 1379 1187 1203 1094 1009 -7.8%
Special Education Specialist 8 8 3 1 4 1 -75.0%
Special Education Specialist:
Deaf/Hard of Hearing 36 39 24 22 16 24 +50.0%
Special Education Specialist:
Visually Impaired 51 40 7 7 8 6 -25.0%
Speech 10 22 22 14 9 11 +22.2%
Teacher Librarian (requires 1 or more years of teaching experience) 71 51 29 14 9 10 +11.1%
Technology Education
(previously Industrial Arts) 4 4 7 9 21 15 -28.6%
Undeclared or Unknown 13 13 1 19 3 36
Grand Total 12950 13103 11987 11227 11292 10692 -5.3%
17
IV. Demographics
For students enrolled in educator preparation programs, the demographics of age, race and ethnicity, and gender
remains stable. In general, Colorado’s emerging teaching and educational administrative work force tends to be
young, female and white/non-Hispanic. One important factor to note, however, is that this demographic data
only includes those students enrolled in educator preparation programs at colleges/universities. Demographic
data from the alternative certification and licensure programs is not available, and not included.
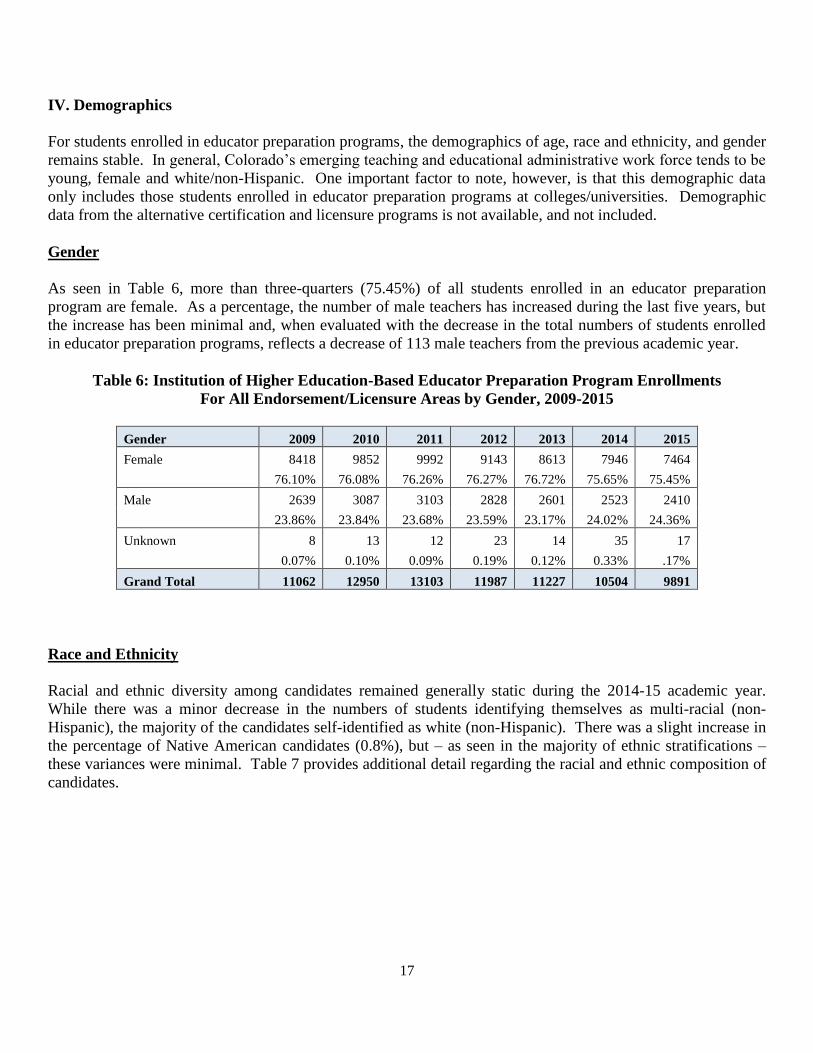
Gender
As seen in Table 6, more than three-quarters (75.45%) of all students enrolled in an educator preparation
program are female. As a percentage, the number of male teachers has increased during the last five years, but
the increase has been minimal and, when evaluated with the decrease in the total numbers of students enrolled
in educator preparation programs, reflects a decrease of 113 male teachers from the previous academic year.
Table 6: Institution of Higher Education-Based Educator Preparation Program Enrollments
For All Endorsement/Licensure Areas by Gender, 2009-2015
Gender 2009 2010 2011 2012 2013 2014 2015
Female 8418 9852 9992 9143 8613 7946 7464
76.10% 76.08% 76.26% 76.27% 76.72% 75.65% 75.45%
Male 2639 3087 3103 2828 2601 2523 2410
23.86% 23.84% 23.68% 23.59% 23.17% 24.02% 24.36%
Unknown 8 13 12 23 14 35 17
0.07% 0.10% 0.09% 0.19% 0.12% 0.33% .17%
Grand Total 11062 12950 13103 11987 11227 10504 9891
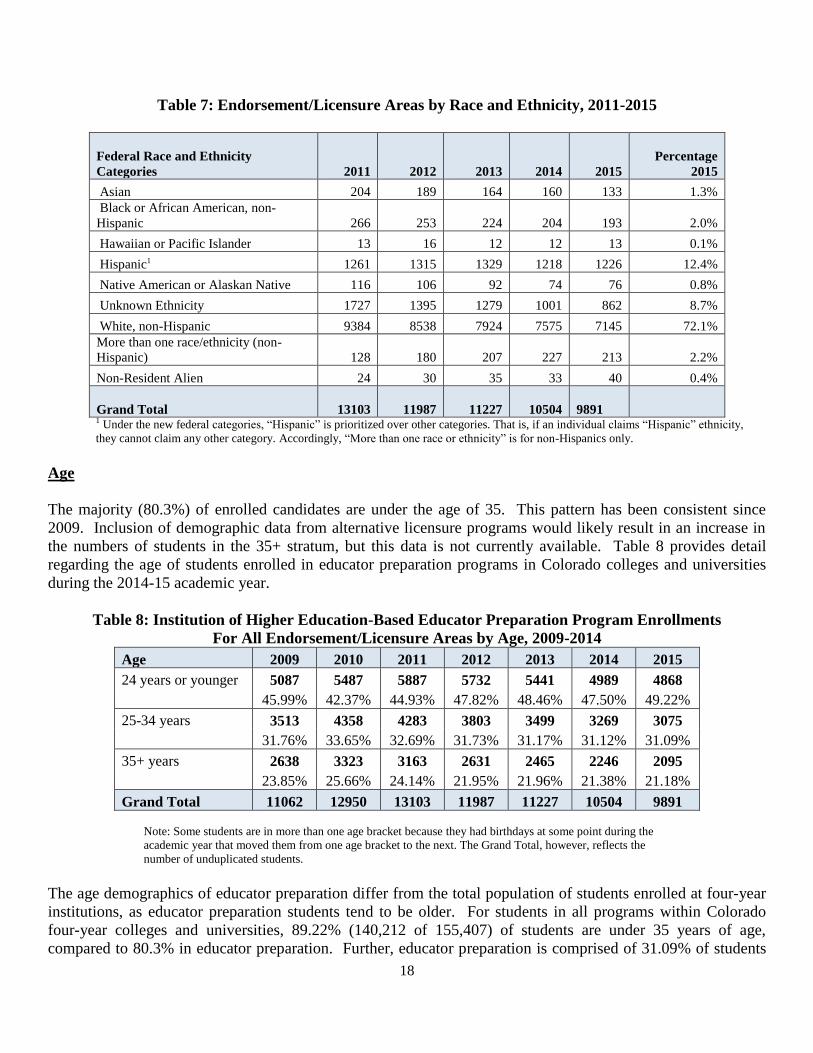
Race and Ethnicity
Racial and ethnic diversity among candidates remained generally static during the 2014-15 academic year.
While there was a minor decrease in the numbers of students identifying themselves as multi-racial (non-
Hispanic), the majority of the candidates self-identified as white (non-Hispanic). There was a slight increase in
the percentage of Native American candidates (0.8%), but – as seen in the majority of ethnic stratifications –
these variances were minimal. Table 7 provides additional detail regarding the racial and ethnic composition of
candidates.
18
Table 7: Endorsement/Licensure Areas by Race and Ethnicity, 2011-2015
Federal Race and Ethnicity
Categories 2011 2012 2013 2014
2015
Percentage
2015
Asian 204 189 164 160 133 1.3%
Black or African American, non-
Hispanic 266 253 224 204 193 2.0%
Hawaiian or Pacific Islander 13 16 12 12 13 0.1%
Hispanic1 1261 1315 1329 1218 1226 12.4%
Native American or Alaskan Native 116 106 92 74 76 0.8%
Unknown Ethnicity 1727 1395 1279 1001 862 8.7%
White, non-Hispanic 9384 8538 7924 7575 7145 72.1%
More than one race/ethnicity (non-
Hispanic) 128 180 207 227 213 2.2%
Non-Resident Alien 24 30 35 33 40 0.4%
Grand Total 13103 11987 11227 10504
9891
1 Under the new federal categories, “Hispanic” is prioritized over other categories. That is, if an individual claims “Hispanic” ethnicity,
they cannot claim any other category. Accordingly, “More than one race or ethnicity” is for non-Hispanics only.
Age
The majority (80.3%) of enrolled candidates are under the age of 35. This pattern has been consistent since
2009. Inclusion of demographic data from alternative licensure programs would likely result in an increase in
the numbers of students in the 35+ stratum, but this data is not currently available. Table 8 provides detail
regarding the age of students enrolled in educator preparation programs in Colorado colleges and universities
during the 2014-15 academic year.
Table 8: Institution of Higher Education-Based Educator Preparation Program Enrollments
For All Endorsement/Licensure Areas by Age, 2009-2014
Age 2009 2010 2011 2012 2013 2014 2015
24 years or younger 5087 5487 5887 5732 5441 4989 4868
45.99% 42.37% 44.93% 47.82% 48.46% 47.50% 49.22%
25-34 years 3513 4358 4283 3803 3499 3269 3075
31.76% 33.65% 32.69% 31.73% 31.17% 31.12% 31.09%
35+ years 2638 3323 3163 2631 2465 2246 2095
23.85% 25.66% 24.14% 21.95% 21.96% 21.38% 21.18%
Grand Total 11062 12950 13103 11987 11227 10504 9891
Note: Some students are in more than one age bracket because they had birthdays at some point during the
academic year that moved them from one age bracket to the next. The Grand Total, however, reflects the
number of unduplicated students.
The age demographics of educator preparation differ from the total population of students enrolled at four-year
institutions, as educator preparation students tend to be older. For students in all programs within Colorado
four-year colleges and universities, 89.22% (140,212 of 155,407) of students are under 35 years of age,
compared to 80.3% in educator preparation. Further, educator preparation is comprised of 31.09% of students
19
in the 25-34 age group, a number approximately 10% higher than the general population of 25-34 year old
students enrolled in four year institutions (21.79%) in Colorado.
V. Reauthorization and Programmatic Approval
CDHE and CDE monitor educator preparation providers through periodic and regular programmatic review. As
stipulated in 23-1-121(4)(a)(I),C.R.S., the Colorado Commission on Higher Education (CCHE) and CDHE, in
conjunction with the State Board of Education (SBoE) and CDE, are required to review all educator preparation
providers not more frequently than once every five years to ensure the programs meet the statutory requirements
for reauthorization.
In addition to on-campus reauthorization site visits, both CDE and CDHE review all new educator preparation
program proposals submitted by institutions of higher education. Upon successful review by CDE and CDHE
staff, new program proposals are approved by both the SBoE and CCHE.
Reauthorization
During the 2015 calendar year, the educator preparation providers at the following institutions underwent
reauthorization review:
Colorado State University
Denver Seminary
Rocky Mountain College of Art and Design
In all instances, review teams are comprised of academic experts in the field of educator preparation,
individuals familiar with the P20 pipeline in Colorado and, when possible, a local K12 practitioner from a
partner district associated with the institution. Per statute, each reauthorization visit coincided with
accreditation visits from national accreditation agencies to reduce or eliminate duplicative reporting.
Programmatic Approval
During the 2015 calendar year, the following new programs were approved by both the CSBoE and CCHE:
Culturally and Linguistically Diverse Education Endorsement at Colorado State University – Pueblo
Culturally and Linguistically Diverse Bilingual Education Endorsement at the University of Colorado
Boulder
Dance Teaching Endorsement at the University of Northern Colorado
Culturally and Linguistically Diverse Bilingual Education Endorsement at Fort Lewis College
Science and Mathematics Educator Endorsement Programs at Colorado State University
VI. Areas of Focus and Recommendations
In 2016, CDHE and CDE will embark on various initiatives designed to support educator preparation providers
and the educator population throughout Colorado. These ventures center on: modifying and adopting best
practices regarding teacher quality and educator preparation program review, supporting the development of
20
rural educator recruiting and retention throughout Colorado, and supporting existing initiatives such as
concurrent enrollment and educator effectiveness.
Areas of Focus
The Professional Services and Educator Licensing division of CDE began the task of analyzing and aligning the
current rules established with licensure in 2014. Through collecting and analyzing stakeholder feedback and
public commentary, the division is progressing with potential modifications that will result in a more
streamlined licensing experience for both new and existing educators. This process will be completed in 2016.
Supporting the recruitment and retention of educators within rural school districts in Colorado will be an area of
focus for the Student Success and Academic Affairs division of CDHE in 2016. Through strategic
collaboration with local organizations, such as Boards of Cooperative Educational Services (BOCES) and
Colorado Association of School Personnel Administrators (CASPA), external grant funds have been allocated
to support three specific initiatives for rural teacher recruitment, retention and academic content development.
It is expected that more cohesive avenues connecting educators and these rural districts will result in a more
robust and stable educator workforce in all regions of the state.
Concurrent enrollment (CE) programs, courses that allow students to earn high school and college/university
course credit simultaneously, currently exist within 95% of all school districts in Colorado. Yet, the number of
K12 educators meeting the academic requirements to teach CE remains limited and individual qualifications for
CE teachers have come under increased scrutiny by regional and national accreditation agencies. These
qualification requirements are a significant barrier to the objectives associated with reducing the academic
achievement gap for diverse student populations and preparing students to post-secondary academic success.
Further, CE programs are linked to the development of a viable pipeline of talented labor as concurrent
enrollment is largely seen as “a critical career pathways tool to align education, training and work based
learning” (CWDC, 2015).
To increase the number of teachers qualified to facilitate CE courses, CDHE continues to secure external
funding to support the development of these educators through collaboration with the Concurrent Enrollment
Advisory Board. In 2016, this will include the funding of graduate level instruction to teachers through CSU –
Global Campus in both the math and English language arts disciplines and with Adams State University to
provide instruction in U.S. History. Through these efforts, it is expected that an additional 30-45 teachers will
become CE qualified by the end of 2016.
Recommendations
Developing an understanding regarding the long-term decline of educator numbers in Colorado is a critical
component in the process of examining avenues to increase the number of individuals interested in pursuing a
career in education. Lines of research should be taken regarding the reasons individuals do not consider a
career as a teacher, principal or school service provider, and potential incentives to promote teaching and
education as a profession.
Continued collaboration and communication with school district leadership, including Human Resource
Directors, will continue to ensure alignment between institutions of higher education and the needs of local
districts. Further, additional research regarding out-of-state educator recruitment will continue in an effort to
21
ascertain why various Colorado districts continue to recruit teaching candidates from outside of Colorado, and
how the quality of the candidates emerging from Colorado institutions compare with their peers from other
colleges/universities throughout the United States.
Programmatic modification should continue to be reviewed by both CDE and CDHE to align with national
trends regarding outcome-based assessments, multi-disciplinary curriculum design and instruction and
adherence to district needs regarding culturally and linguistically diverse (CLD) endorsement and other areas of
licensure perceived as “high needs.”
References:
Colorado Department of Higher Education (2014). Annual Report on Concurrent Enrollment. CDHE: Denver,
CO.
Colorado Department of Higher Education (2015). Legislative Report on The Skills for Jobs Act. CDHE:
Denver, CO.
Colorado Workforce Development Council (2015). Talent Pipeline Report. CWDC: Denver, CO.
United States Department of Education (2013). Title II Report. USDOE: Washington, DC.
22
Appendix A: Institutions’ Abbreviations
ASU – Adams State University
CCU – Colorado Christian University
CC – Colorado College
CMU – Colorado Mesa University
CSU – Colorado State University
CSUP – Colorado State University Pueblo
FLC – Fort Lewis College
JIU – Jones International University
MSUD – Metropolitan State University of Denver
RU – Regis University
RMCAD – Rocky Mountain College of Art and Design
UCB – University of Colorado Boulder
UCCS – University of Colorado Colorado Springs
UCD – University of Colorado Denver
DU – University of Denver
UNC – University of Northern Colorado
UP – University of Phoenix
WSCU – Western State Colorado University