Embed Size (px)
Citation preview

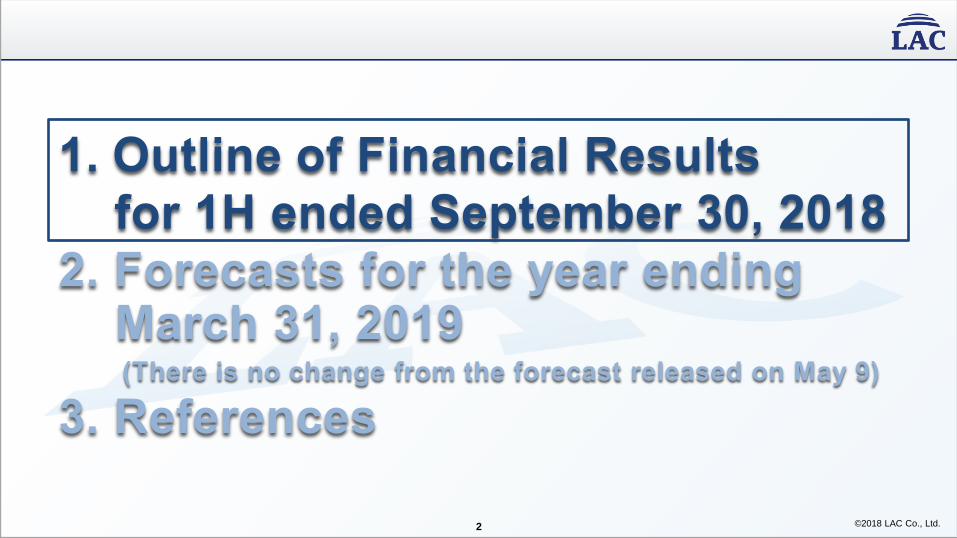
2018年8月1日
株式会社ラック
©2018 LAC Co., Ltd.
November 1, 2018
LAC Co., Ltd.
©2018 LAC Co., Ltd.
©2018 LAC Co., Ltd. 2

©2018 LAC Co., Ltd.
(Million yen)
Net Sales decreased slightly, income greatly increased to growth in service sales - SSS business contributed greatly to income profit by increasing sales and profits -
3
Highlights of 1H Consolidated Financial Results (YoY comparison)
Subject 2018/3
1H
2019/3
1H
YoY comparison
Difference Change(%)
Net sales 17,919 17,757 -162 -0.9
Operating income 299 571 +272 +91.1
Operating income ratio (%) 1.7 3.2 +1.6p -
Ordinary income 295 560 +265 +89.8
Ordinary income ratio (%) 1.6 3.2 +1.5p -
Net income attributable to owners of parent 92 276 +183 +197.9
【Net sales】
SSS segment +1,396 (Maintenance services decreased, other subsegment increased)
SIS segment -1,559 (Development services increased, other subsegment decreased)
【Operating income】
Increase due to growth in service
sales
Cost of sales +745
SG&A expenses -310
【Net income attributable to owners of
parent】
Ordinary income +265 (Decrease of equity earnings
of affiliate companies -9)
Point
Note: From the first quarter of the current consolidated accounting period, we have incorporated Asian Link Co., Ltd., which became a consolidated subsidiary on April 2, 2018, into consolidated results.
©2018 LAC Co., Ltd. 4
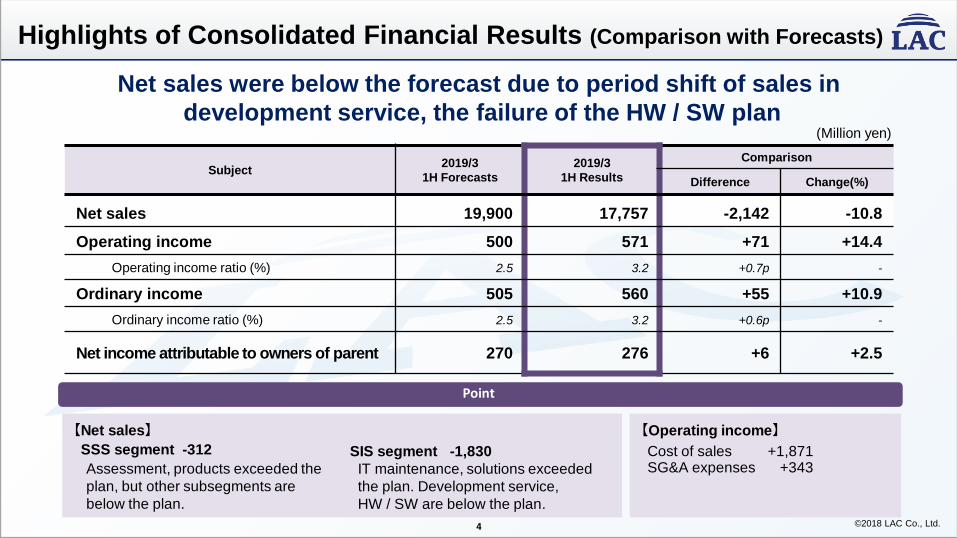
Highlights of Consolidated Financial Results (Comparison with Forecasts)
Subject 2019/3
1H Forecasts
2019/3
1H Results
Comparison
Difference Change(%)
Net sales 19,900 17,757 -2,142 -10.8
Operating income 500 571 +71 +14.4
Operating income ratio (%) 2.5 3.2 +0.7p -
Ordinary income 505 560 +55 +10.9
Ordinary income ratio (%) 2.5 3.2 +0.6p -
Net income attributable to owners of parent 270 276 +6 +2.5
【Net sales】
SSS segment -312
Assessment, products exceeded the
plan, but other subsegments are
below the plan.
【Operating income】
Cost of sales +1,871 SG&A expenses +343
SIS segment -1,830
IT maintenance, solutions exceeded
the plan. Development service,
HW / SW are below the plan.
(Million yen)
Point
Net sales were below the forecast due to period shift of sales in
development service, the failure of the HW / SW plan

©2018 LAC Co., Ltd.
Business Results by Segment (YoY comparison)
Sales 2018/3
1H
2019/3
1H
YoY comparison
Difference Change(%)
Security Solutions Services
(SSS) business 5,410 6,807 +1,396 +25.8
System Integration Services
(SIS) business 12,509 10,949 -1,559 -12.5
Total 17,919 17,757 -162 -0.9
Segment margin 2018/3
1H
2019/3
1H
YoY comparison
Difference Change(%)
Security Solutions Services
(SSS) business 506 892 +386 +76.2
System Integration Services
(SIS) business 1,093 1,213 +120 +11.0
Company-wide common expenses -1,300 -1,534 -234 -
Total 299 571 +272 +91.1
(Million yen)
5
SSS business significantly increased sales and profit,
SIS business increased sales and profit
*From the first quarter consolidated accounting period, the results of Asian Link Co., Ltd. are incorporated.
(Million yen)
*
*
©2018 LAC Co., Ltd. 6
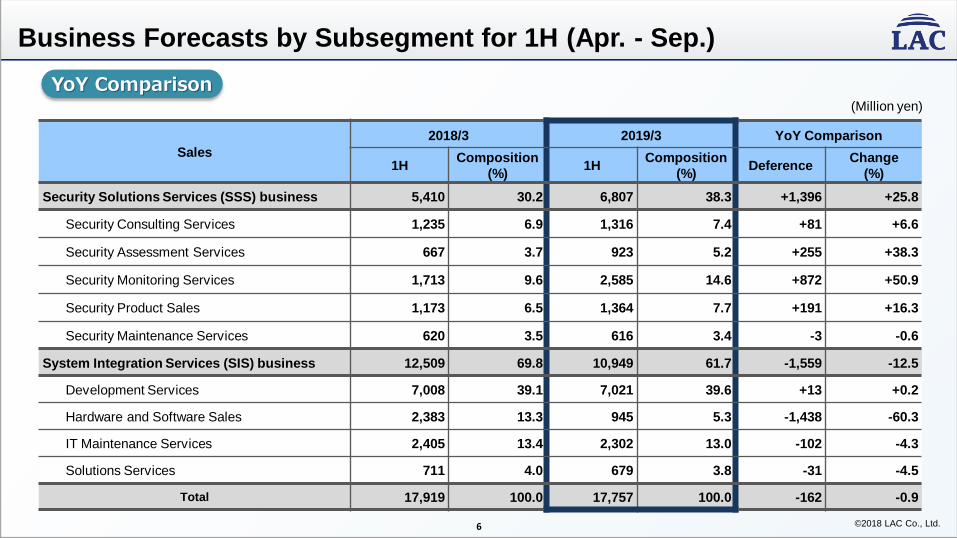
(Million yen)
Sales
2018/3 2019/3 YoY Comparison
1H Composition
(%) 1H
Composition
(%) Deference
Change
(%)
Security Solutions Services (SSS) business 5,410 30.2 6,807 38.3 +1,396 +25.8
Security Consulting Services 1,235 6.9 1,316 7.4 +81 +6.6
Security Assessment Services 667 3.7 923 5.2 +255 +38.3
Security Monitoring Services 1,713 9.6 2,585 14.6 +872 +50.9
Security Product Sales 1,173 6.5 1,364 7.7 +191 +16.3
Security Maintenance Services 620 3.5 616 3.4 -3 -0.6
System Integration Services (SIS) business 12,509 69.8 10,949 61.7 -1,559 -12.5
Development Services 7,008 39.1 7,021 39.6 +13 +0.2
Hardware and Software Sales 2,383 13.3 945 5.3 -1,438 -60.3
IT Maintenance Services 2,405 13.4 2,302 13.0 -102 -4.3
Solutions Services 711 4.0 679 3.8 -31 -4.5
Total 17,919 100.0 17,757 100.0 -162 -0.9
YoY Comparison
Business Forecasts by Subsegment for 1H (Apr. - Sep.)
©2018 LAC Co., Ltd.
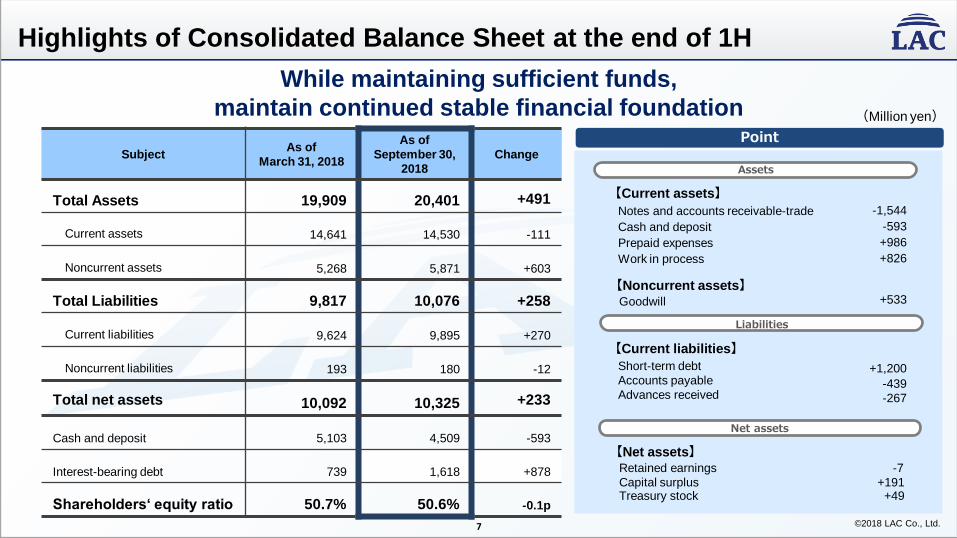
Highlights of Consolidated Balance Sheet at the end of 1H
Subject As of
March 31, 2018
As of
September 30,
2018
Change
Total Assets 19,909 20,401 +491
Current assets 14,641 14,530 -111
Noncurrent assets 5,268 5,871 +603
Total Liabilities 9,817 10,076 +258
Current liabilities 9,624 9,895 +270
Noncurrent liabilities 193 180 -12
Total net assets 10,092 10,325 +233
Cash and deposit 5,103 4,509 -593
Interest-bearing debt 739 1,618 +878
Shareholders‘ equity ratio 50.7% 50.6% -0.1p
(Million yen)
【Current assets】
Notes and accounts receivable-trade
Cash and deposit
Prepaid expenses
Work in process
Point
【Noncurrent assets】 Goodwill
【Current liabilities】
Short-term debt
Accounts payable
Advances received
【Net assets】 Retained earnings -7
Capital surplus +191 Treasury stock +49
-1,544
-593
+986
+826
+1,200
-439
-267
7
+533
Assets
Liabilities
Net assets
While maintaining sufficient funds,
maintain continued stable financial foundation

©2018 LAC Co., Ltd.
Although income before amortization was secure and increase,
operating cash flow by working capital factors decrease
Highlights of Consolidated Cash Flow
8
Subject 2018/3
1H
2019/3
1H
Cash Flows from Operating
Activities 1,619 -523
Cash Flows from Investing
Activities -702 -390
Cash Flows from Financing
Activities -614 317
Free Cash Flow 917 -914
Net Increase (Decrease) in Cash and Cash
Equivalents 299 -593
Cash and Cash Equivalents at Beginning of
Year 4,969 5,103
Cash and Cash Equivalents at End
of Year 5,268 4,509
【Cash Flows from Financing Activities】
Net decrease in short-term loans payable -1,090
Repayment of long-term loans payable -451
Cash dividends paid -284
Point
【Cash Flows from Operating Activities】
Income before income taxes 559
Depreciation and amortization 288
Amortization of goodwill 189
Trade receivables 1,726
Inventories -1,076
Decrease in other current assets
(mainly prepaid expenses) -915
Trade payables -503
Income taxes paid -505
(Million yen)
【Cash Flows from Investing Activities】
Purchase of stock of subsidiaries -98
Purchase of property, plant and equipment -200
Purchase of software -151
©2018 LAC Co., Ltd. 9

©2018 LAC Co., Ltd. 10
Point
【Operating income】
Absorb more costs increase, such as
human investment in higher sales
Gross profit +1.5billion yen
SG&A expenses +1.2billion yen
Subject 2018/3
Results
2019/3
Forecasts
YoY comparison
Difference Change (%)
Net sales 38,432 43,400 +4,967 +12.9
Operating income 2,224 2,500 +275 +12.4
Operating income ratio (%) 5.8 5.8 -0.0p -
Ordinary income 2,349 2,550 +200 +8.5
Net income attributable to owners
of parent 1,252 1,740 +487 +38.9
ROE (%) 12.7 16.1 +3.4p -
【Net sales】
SSS segment +3,366
Except for consulting, all
subsegment are expected to
outperform the previous fiscal year
SSS segment +1,600
Expected to exceed the previous
fiscal year in all sub-segments except IT maintenance.
Forecasts for the year ending March 31, 2019 (YoY Comparison)
(Million yen)

©2018 LAC Co., Ltd. 11
Sales 2018/3
Results
2019/3
Forecasts
YoY comparison
Difference Change (%)
Security Solutions Services
(SSS) business 13,333 16,700 +3,366 +25.3
System Integration Services
(SIS) business 25,099 26,700 +1,600 +6.4
Total 38,432 43,400 +4,967 +12.9
Segment margin 2018/3
Results
2019/3
Forecasts
YoY comparison
Difference Change (%)
Security Solutions Services
(SSS) business 2,239 2,570 +330 +14.7
System Integration Services
(SIS) business 2,623 3,200 +576 +22.0
Company-wide common expenses -2,639 -3,270 -630 -23.9
Total 2,224 2,500 +275 +12.4
Business Forecasts by Segment (YoY Comparison)
(Million yen)
(Million yen)

©2018 LAC Co., Ltd. 12
Sales
2018/3 2019/3 YoY Comparison
Results Composition
(%) Forecasts
Composition
(%) Deference
Change
(%)
Security Solutions Services (SSS) business 13,333 34.7 16,700 38.5 +3,366 +25.3
Security Consulting Services 3,536 9.2 3,300 7.6 -236 -6.7
Security Assessment Services 1,983 5.2 2,370 5.5 +386 +19.5
Security Monitoring Services 3,795 9.9 6,480 14.9 +2,684 +70.7
Security Product Sales 2,759 7.2 3,240 7.5 +480 +17.4
Security Maintenance Services 1,257 3.2 1,310 3.0 +52 +4.1
System Integration Services (SIS) business 25,099 65.3 26,700 61.5 +1,600 +6.4
Development Services 15,388 40.0 16,720 38.5 +1,331 +8.7
Hardware and Software Sales 3,399 8.8 4,200 9.7 +800 +23.5
IT Maintenance Services 4,753 12.4 4,180 9.6 -573 -12.1
Solutions Services 1,557 4.1 1,600 3.7 +42 +2.7
Total 38,432 100.0 43,400 100.0 +4,967 +12.9
Business Forecasts by Subsegment (YoY Comparison)
(Million yen)

©2018 LAC Co., Ltd. 13

©2018 LAC Co., Ltd. 14
Financial Results for 1H (Apr. - Sep.)
17,919 17,757
0
5,000
10,000
15,000
20,000
1H FY2017 1H FY2018
Net Sales
295
560
1.6
3.2
0.0
1.0
2.0
3.0
4.0
5.0
6.0
0
100
200
300
400
500
600
1H FY2017 1H FY2018
% Million yen Ordinary income
Ordinary income ratio %
92
276
0.5
1.6
0.0
1.0
2.0
3.0
4.0
5.0
6.0
0
100
200
300
400
500
600
1H FY2017 1H FY2018
% Million yen
Net income attributable to owners of parent
Net income attributable to owners of parent ratio %
Difference
-162
Change
-0.9%
Difference
+265
Change
+89.8%
Difference
+183
Change
+197.9%
299
571
1.7
3.2
0.0
1.0
2.0
3.0
4.0
5.0
6.0
0
100
200
300
400
500
600
1H FY2017 1H FY2018
% Million yen Operating income
Operating income ratio %
Difference
+272
Change
+91.1%
YoY Comparison

©2018 LAC Co., Ltd. 15
Financial Results for the year ending March 31, 2019 (Quarterly)
8,796 9,123 8,866
11,645
8,749 9,007
0
5,000
10,000
15,000
1Q 2Q 3Q 4Q
Net sales 2018/3
2019/3
32
267
456
1,469
118
453
0
500
1,000
1,500
2,000
1Q 2Q 3Q 4Q
Operating income 2018/3
2019/3
20
274
516
1,538
115
445
0
500
1,000
1,500
2,000
1Q 2Q 3Q 4Q
Ordinary income 2018/3
2019/3
-43 136
329
831
17
259
-100
600
1,300
2,000
1Q 2Q 3Q 4Q
Net income attributable to owners of parent
2018/3
2019/3
YoY Comparison

©2018 LAC Co., Ltd.
Consolidated Employees
343 393 507 558 832
1,011 1,051
1,117 1,138
1,151 151 158
113 113
154
0
500
1,000
1,500
2,000
2,500
2015/3 2016/3 2017/3 2018/3 2018/9
Managingsection
SIS business
SSS business
1,737
(People)
1,602 1,505
16
1,809
*1. We are changing to standards including contract employees and business classification according to the related business from fiscal year ended March 31, 2017. *2. As of September, 2018, consolidated employees of SSS business include employees of Asian Link Co., Ltd. Group which became a subsidiary of April 2, 2018.
2,137
*1 *2 *1 *1
©2018 LAC Co., Ltd.
※ Statements made in this documents or in the presentation to which they pertain regarding estimates or projections are forward-looking statements based
on the company’s judgments and assumptions in light of information currently available. Actual results may differ materially from those projected as a
result of uncertainties inherent in such judgments and assumptions, as well as changes in business
operations or other internal or external conditions. Accordingly, the company gives no guarantee regarding the reliability of any
information contained in these forward-looking statements.
※ These documents are for information purpose only, and do not constitute an inducement by the company to make investments.
※ LAC is trademark or registered trademark of LAC Co., Ltd.
LAC Co., Ltd.
Mori tower 16-1, hirakawa-cho 2-chome,
Chiyoda-ku, Tokyo 102-0093, Japan.
Tel +81-3-6757-0107
www.lac.co.jp