Embed Size (px)
Citation preview
7/28/2019 2_Jadranka_251-254
http://slidepdf.com/reader/full/2jadranka251-254 1/4
J. Blazevska-Gilev, D. Spaseska
251
Journal of the University of Chemical Technology and Metallurgy, 45, 3, 2010, 251-254
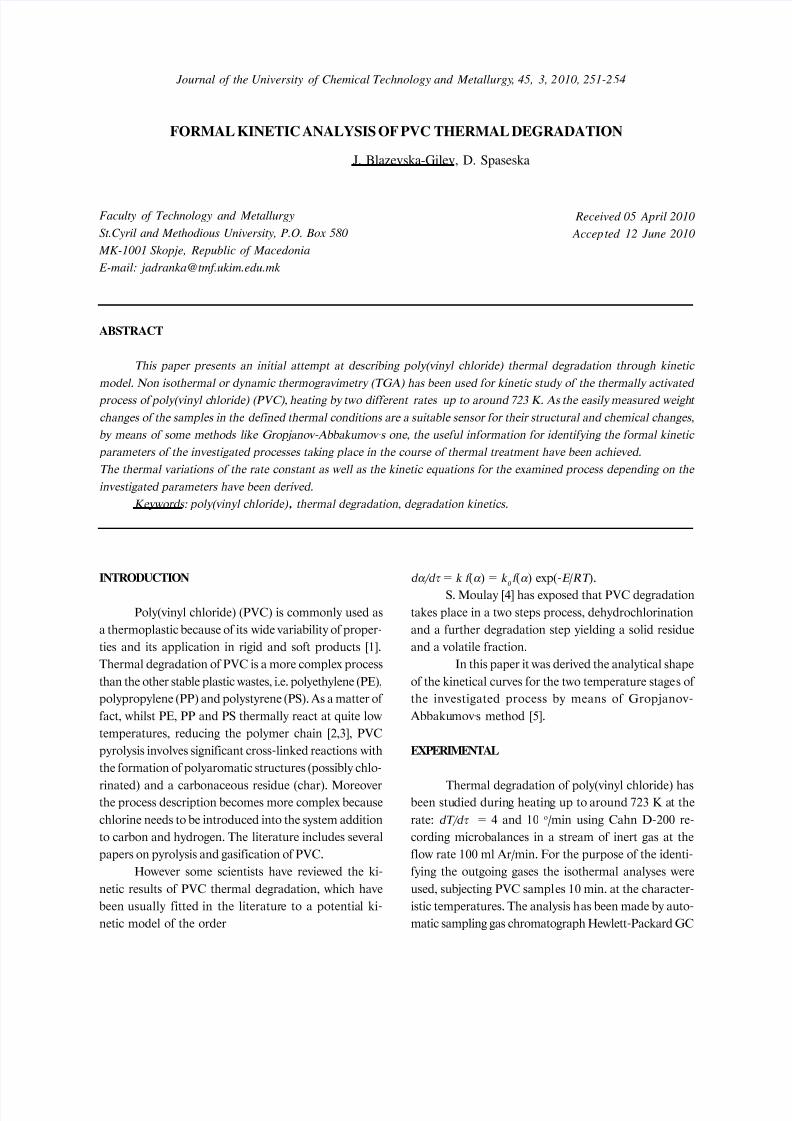
FORMAL KINETIC ANALYSIS OF PVC THERMAL DEGRADATION
J. Blazevska-Gilev, D. Spaseska
Faculty of Technology and Metallurgy
St.Cyril and Methodious University, P.O. Box 580
MK-1001 Skopje, Republic of Macedonia
E-mail: [email protected]
ABSTRACT
This paper presents an initial attempt at describing poly(vinyl chloride) thermal degradation through kinetic
model. Non isothermal or dynamic thermogravimetry (TGA) has been used for kinetic study of the thermally activated process of poly(vinyl chloride) (PVC), heating by two different rates up to around 723 K. As the easily measured weight
changes of the samples in the defined thermal conditions are a suitable sensor for their structural and chemical changes,
by means of some methods like Gropjanov-Abbakumov ,s one, the useful information for identifying the formal kinetic
parameters of the investigated processes taking place in the course of thermal treatment have been achieved.
The thermal variations of the rate constant as well as the kinetic equations for the examined process depending on the
investigated parameters have been derived.
Keywords: poly(vinyl chloride) , thermal degradation, degradation kinetics.
Received 05 April 2010
Accepted 12 June 2010
INTRODUCTION
Poly(vinyl chloride) (PVC) is commonly used as
a thermoplastic because of its wide variability of proper-
ties and its application in rigid and soft products [1].
Thermal degradation of PVC is a more complex process
than the other stable plastic wastes, i.e. polyethylene (PE),
polypropylene (PP) and polystyrene (PS). As a matter of
fact, whilst PE, PP and PS thermally react at quite low
temperatures, reducing the polymer chain [2,3], PVC
pyrolysis involves significant cross-linked reactions with
the formation of polyaromatic structures (possibly chlo-rinated) and a carbonaceous residue (char). Moreover
the process description becomes more complex because
chlorine needs to be introduced into the system addition
to carbon and hydrogen. The literature includes several
papers on pyrolysis and gasification of PVC.
However some scientists have reviewed the ki-
netic results of PVC thermal degradation, which have
been usually fitted in the literature to a potential ki-
netic model of the order
dá/dô = k f (á ) = k 0 f (á ) exp(-E /RT ).S. Moulay [4] has exposed that PVC degradation
takes place in a two steps process, dehydrochlorination
and a further degradation step yielding a solid residue
and a volatile fraction.
In this paper it was derived the analytical shape
of the kinetical curves for the two temperature stages of
the investigated process by means of Gropjanov-
Abbakumov,s method [5].
EXPERIMENTAL
Thermal degradation of poly(vinyl chloride) has
been studied during heating up to around 723 K at the
rate: dT/dô = 4 and 10 o/min using Cahn D-200 re-
cording microbalances in a stream of inert gas at the
flow rate 100 ml Ar/min. For the purpose of the identi-
fying the outgoing gases the isothermal analyses were
used, subjecting PVC samples 10 min. at the character-
istic temperatures. The analysis has been made by auto-
matic sampling gas chromatograph Hewlett-Packard GC
7/28/2019 2_Jadranka_251-254
http://slidepdf.com/reader/full/2jadranka251-254 2/4
Journal of the University of Chemical Technology and Metallurgy, 45, 3, 2010
252
5890 with FID and TCD detectors and the Porapak P
packed column (i.d 2 mm, length 2 m). At the same
time the outgoing gas was analyzed continually on mass
spectrometer VG GAS Analysis LTD.
RESULTS AND DISCUSSION
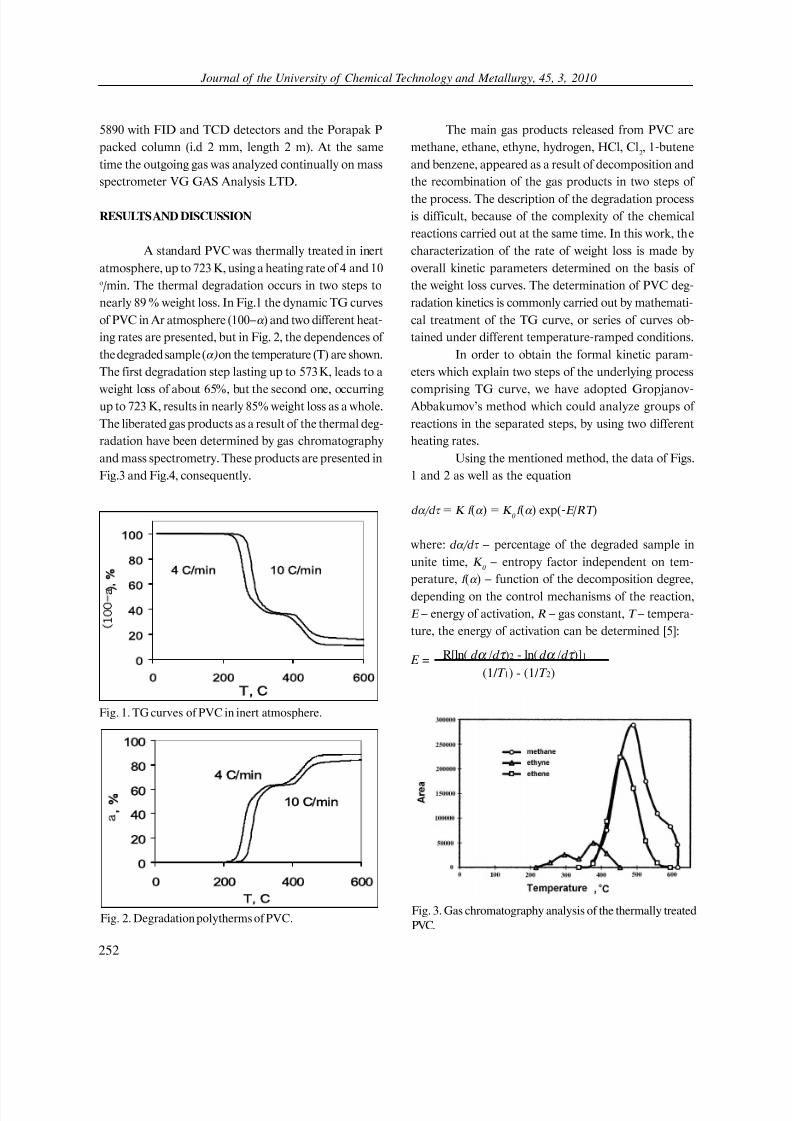
A standard PVC was thermally treated in inert
atmosphere, up to 723 K, using a heating rate of 4 and 10o/min. The thermal degradation occurs in two steps to
nearly 89 % weight loss. In Fig.1 the dynamic TG curves
of PVC in Ar atmosphere (100á ) and two different heat-
ing rates are presented, but in Fig. 2, the dependences of
the degraded sample (á) on the temperature (T) are shown.
The first degradation step lasting up to 573 K, leads to a
weight loss of about 65%, but the second one, occurring
up to 723 K, results in nearly 85% weight loss as a whole.
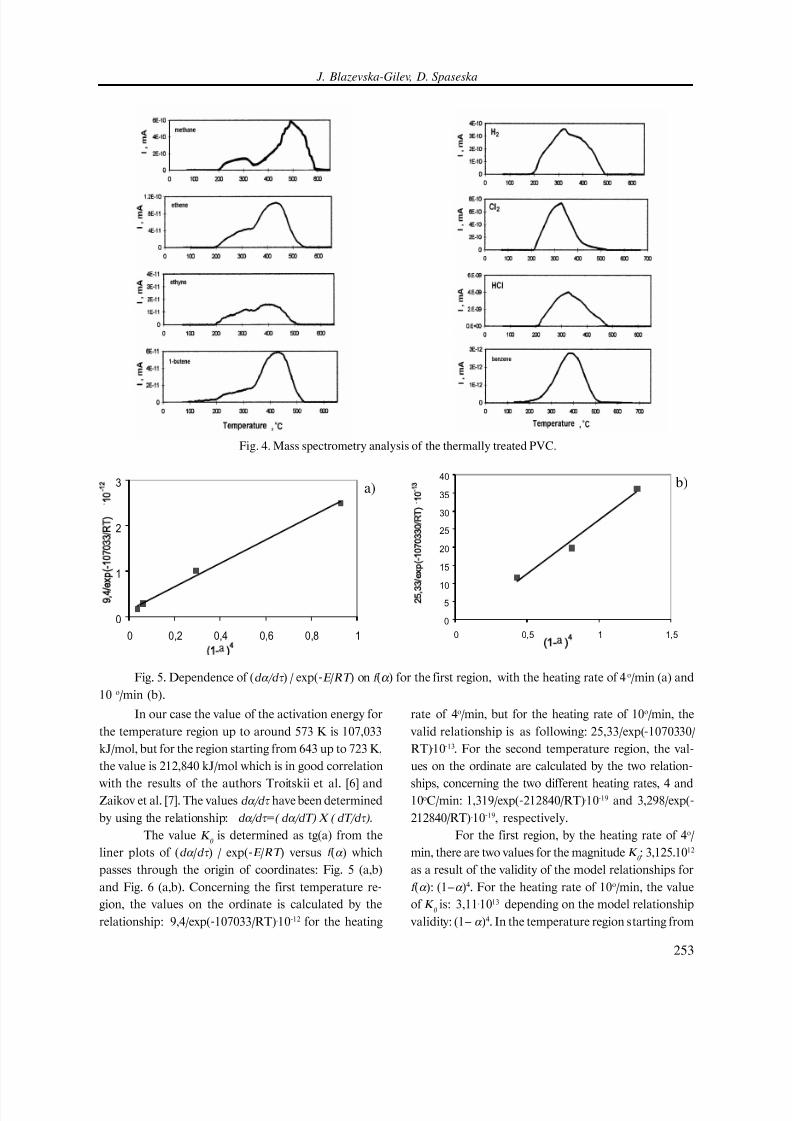
The liberated gas products as a result of the thermal deg-
radation have been determined by gas chromatography
and mass spectrometry. These products are presented in
Fig.3 and Fig.4, consequently.
The main gas products released from PVC are
methane, ethane, ethyne, hydrogen, HCl, Cl2, 1-butene
and benzene, appeared as a result of decomposition and
the recombination of the gas products in two steps of
the process. The description of the degradation process
is difficult, because of the complexity of the chemical
reactions carried out at the same time. In this work, the
characterization of the rate of weight loss is made by
overall kinetic parameters determined on the basis of
the weight loss curves. The determination of PVC deg-
radation kinetics is commonly carried out by mathemati-
cal treatment of the TG curve, or series of curves ob-
tained under different temperature-ramped conditions.
In order to obtain the formal kinetic param-
eters which explain two steps of the underlying process
comprising TG curve, we have adopted Gropjanov-
Abbakumovs method which could analyze groups of
reactions in the separated steps, by using two different
heating rates.
Using the mentioned method, the data of Figs.
1 and 2 as well as the equation
dá/dô = K f (á ) = K 0 f (á ) exp(-E /RT )
where: dá/dô percentage of the degraded sample in
unite time, K 0
entropy factor independent on tem-
perature, f (á ) function of the decomposition degree,
depending on the control mechanisms of the reaction,
E energy of activation, R gas constant, T tempera-
ture, the energy of activation can be determined [5]:
E = R[ln( d α /d τ )2 - ln(d α /d τ )]1
(1/ T 1) - (1/ T 2)0
20
40
60
80
100
0 200 400 600
T, C
(100-a% 4 C/min 10 C/min
0
20
40
60
80
100
0 200 400 600
T, C
=,%
4 C/min
10 C/min
Fig. 1. TG curves of PVC in inert atmosphere.
Fig. 2. Degradation polytherms of PVC.Fig. 3. Gas chromatography analysis of the thermally treated
PVC.
7/28/2019 2_Jadranka_251-254
http://slidepdf.com/reader/full/2jadranka251-254 3/4
J. Blazevska-Gilev, D. Spaseska
253
In our case the value of the activation energy for
the temperature region up to around 573 K is 107,033
kJ/mol, but for the region starting from 643 up to 723 K,
the value is 212,840 kJ/mol which is in good correlation with the results of the authors Troitskii et al. [6] and
Zaikov et al. [7]. The values dá/dô have been determined
by using the relationship: dá/dô=( dá/dT) × ( dT/dô).
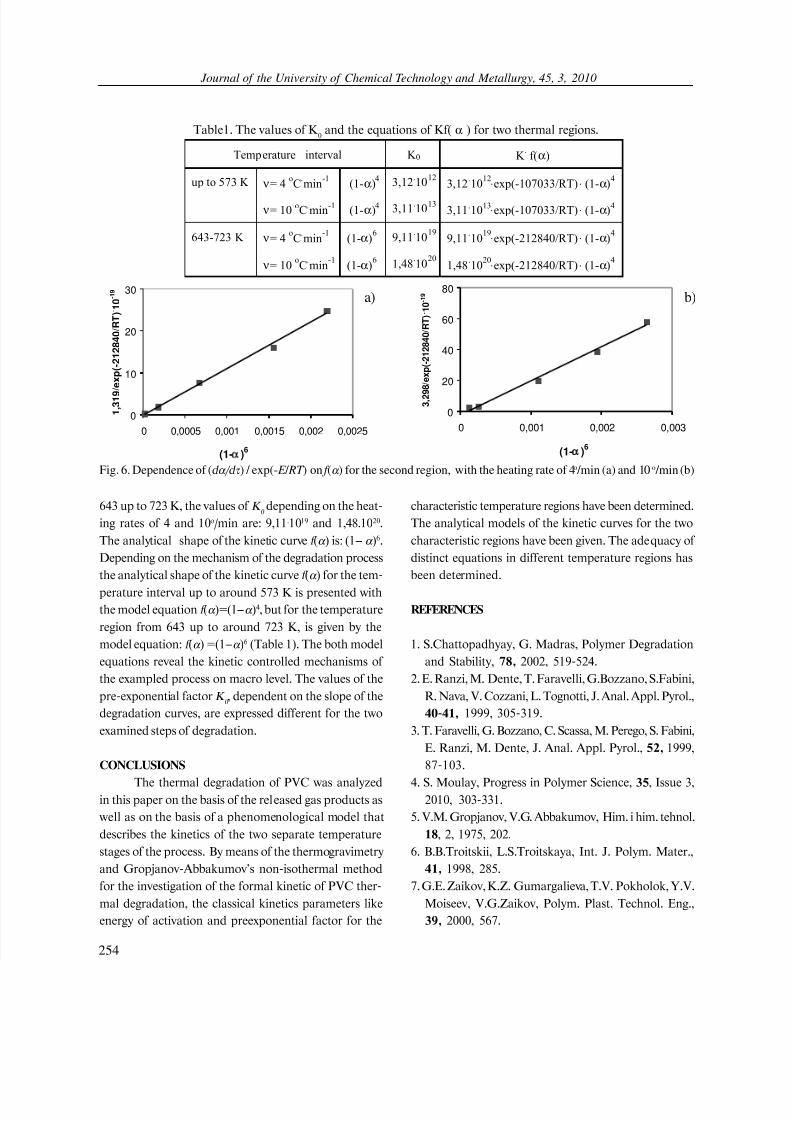
The value K 0
is determined as tg(a) from the
liner plots of (dá /dô ) / exp(-E /RT ) versus f (á ) which
passes through the origin of coordinates: Fig. 5 (a,b)
and Fig. 6 (a,b). Concerning the first temperature re-
gion, the values on the ordinate is calculated by the
relationship: 9,4/exp(-107033/RT).10-12 for the heating
rate of 4o/min, but for the heating rate of 10o/min, the
valid relationship is as following: 25,33/exp(-1070330/
RT).10-13. For the second temperature region, the val-
ues on the ordinate are calculated by the two relation-ships, concerning the two different heating rates, 4 and
10oC/min: 1,319/exp(-212840/RT).10-19 and 3,298/exp(-
212840/RT).10-19, respectively.
For the first region, by the heating rate of 4o/
min, there are two values for the magnitude K 0 : 3,125.1012
as a result of the validity of the model relationships for
f (á ): (1á )4. For the heating rate of 10o/min, the value
of K 0 is: 3,11.1013 depending on the model relationship
validity: (1 á )4. In the temperature region starting from
Fig. 4. Mass spectrometry analysis of the thermally treated PVC.
0
1
2
3
0 0,2 0,4 0,6 0,8 1
(1-= )"
94e1
RT. 112
0
5
10
15
20
25
30
35
40
0 0,5 1 1,5(1-= )
"
23e
1
R1
13
Fig. 5. Dependence of (dá/dô ) / exp(-E /RT ) on f (α ) for the first region, with the heating rate of 4 o/min (a) and
10 o/min (b).
a) b)
7/28/2019 2_Jadranka_251-254
http://slidepdf.com/reader/full/2jadranka251-254 4/4
Journal of the University of Chemical Technology and Metallurgy, 45, 3, 2010
254
643 up to 723 K, the values of K 0 depending on the heat-
ing rates of 4 and 10o/min are: 9,11.1019 and 1,48.1020.
The analytical shape of the kinetic curve f (á ) is: (1 á )6.
Depending on the mechanism of the degradation process
the analytical shape of the kinetic curve f (á ) for the tem-perature interval up to around 573 K is presented with
the model equation f (á )=(1á )4, but for the temperature
region from 643 up to around 723 K, is given by the
model equation: f (á ) =(1á )6 (Table 1). The both model
equations reveal the kinetic controlled mechanisms of
the exampled process on macro level. The values of the
pre-exponential factor K 0 , dependent on the slope of the
degradation curves, are expressed different for the two
examined steps of degradation.
CONCLUSIONSThe thermal degradation of PVC was analyzed
in this paper on the basis of the released gas products as
well as on the basis of a phenomenological model that
describes the kinetics of the two separate temperature
stages of the process. By means of the thermogravimetry
and Gropjanov-Abbakumovs non-isothermal method
for the investigation of the formal kinetic of PVC ther-
mal degradation, the classical kinetics parameters like
energy of activation and preexponential factor for the
characteristic temperature regions have been determined.
The analytical models of the kinetic curves for the two
characteristic regions have been given. The adequacy of
distinct equations in different temperature regions has
been determined.
REFERENCES
1. S.Chattopadhyay, G. Madras, Polymer Degradation
and Stability, 78, 2002, 519-524.
2. E. Ranzi, M. Dente, T. Faravelli, G.Bozzano, S.Fabini,
R. Nava, V. Cozzani, L. Tognotti, J. Anal. Appl. Pyrol.,
40-41, 1999, 305-319.
3. T. Faravelli, G. Bozzano, C. Scassa, M. Perego, S. Fabini,
E. Ranzi, M. Dente, J. Anal. Appl. Pyrol., 52, 1999,
87-103.4. S. Moulay, Progress in Polymer Science, 35, Issue 3,
2010, 303-331.
5. V.M. Gropjanov, V.G. Abbakumov, Him. i him. tehnol.
18, 2, 1975, 202.
6. B.B.Troitskii, L.S.Troitskaya, Int. J. Polym. Mater.,
41, 1998, 285.
7. G.E. Zaikov, K.Z. Gumargalieva, T.V. Pokholok, Y.V.
Moiseev, V.G.Zaikov, Polym. Plast. Technol. Eng.,
39, 2000, 567.
0
10
20
30
0 0,0005 0,001 0,0015 0,002 0,0025
(1-α )6
1 , 3
1 9 / e
x p ( - 2 1 2 8 4 0 / R T ) . 1 0 - 1 9
Fig. 6. Dependence of (dá/dô ) / exp(- E / RT ) on f (á ) for the second region, with the heating rate of 4o /min (a) and 10 o /min (b)
0
20
40
60
80
0 0,001 0,002 0,003
(1-α )6
3 , 2
9 8 /
e x p ( - 2 1 2 8 4 0 / R T ) . 1 0 - 1 9
Temperature interval K 0 K .f(α)
up to 573 K ν= 4oC
.min
-1
ν= 10oC
.min
-1
(1-α)4
(1-α)4
3,12.10
12
3,11.10
13
3,12.10
12⋅exp(-107033/RT)⋅ (1-α)
4
3,11.10
13⋅exp(-107033/RT)⋅ (1-α)
4
643-723 K ν= 4oC
.min
-1
ν= 10oC
.min
-1
(1-α)6
(1-α)6
9,11.10
19
1,48.10
20
9,11.10
19⋅exp(-212840/RT) ⋅ (1-α)
4
1,48.10
20⋅exp(-212840/RT) ⋅ (1-α)
4
Table1. The values of K 0and the equations of Kf( á ) for two thermal regions.
a) b)