Embed Size (px)
Citation preview
7212019 472 ib sl workbook
httpslidepdfcomreaderfull472-ib-sl-workbook 11
copy HAESE amp HARRIS PUBLICATIONS
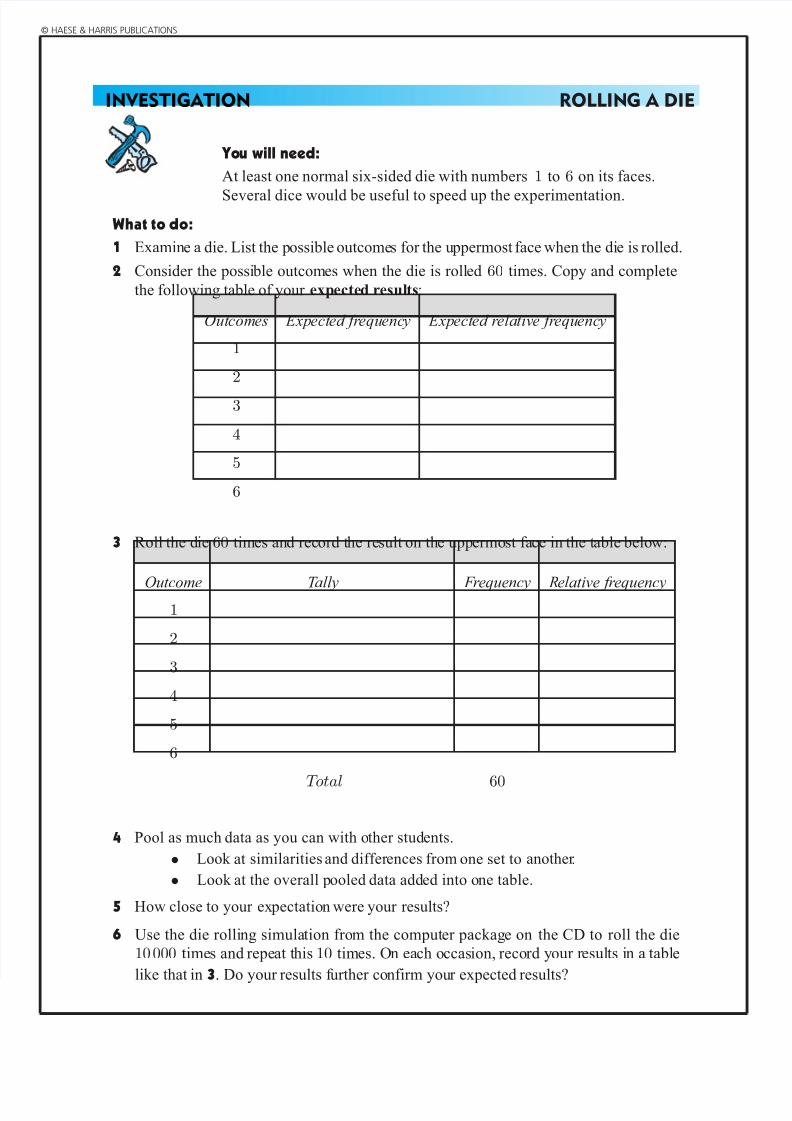
INVESTIGATION ROLLING A DIE
At least one normal six-sided die with numbers 1 to 6 on its faces
Several dice would be useful to speed up the experimentation
1
2 Consider the possible outcomes when the die is rolled 60 times Copy and complete
3
Outcomes Expected frequency Expected relative frequency
1
2
3
4
5
6
Outcome Tally Frequency Relative frequency1
2
3
4
5
6
Total 60
What to do
You will need
the following table of your expected esultsr
Examine die List the possible outcomes for the uppermost face when the die is rolleda
Roll the die times and record the result on the uppermost face in the table below60
4 Pool as much data as you can with other students
sup2 Look at similarities and differences from one set to another
sup2 Look at the overall pooled data added into one table
5 How close to your expectation were your results
6 Use the die rolling simulation from the computer package on the CD to roll the die
times and repeat this times On each occasion record your results in a table
like that in Do your results further confirm your expected results
10 000 10
3