Embed Size (px)
Citation preview
Feasibility Study for Expansion of Victoria Hydropower Station
Final Report 6-21
6.1.6 Power Generation Simulation
(1) Review of Reservoir Operation Rule
In the comparative study on the alternative options, the operation rule of the Victoria reservoir is revised. The purpose of revising reservoir operation rule is to produce more energy by the hydropower generation, and to compare the energy output for all options with applying the revised operation rule of the Victoria reservoir.
(2) Current Reservoir Operation Rule
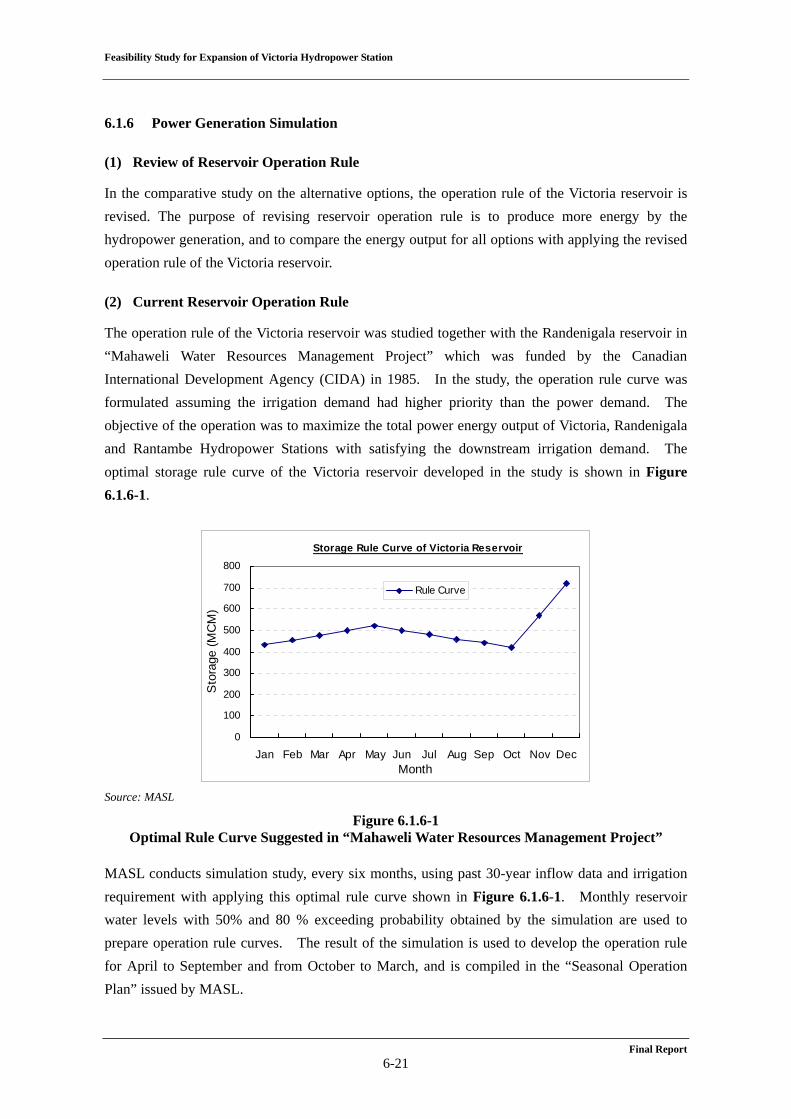
The operation rule of the Victoria reservoir was studied together with the Randenigala reservoir in “Mahaweli Water Resources Management Project” which was funded by the Canadian International Development Agency (CIDA) in 1985. In the study, the operation rule curve was formulated assuming the irrigation demand had higher priority than the power demand. The objective of the operation was to maximize the total power energy output of Victoria, Randenigala and Rantambe Hydropower Stations with satisfying the downstream irrigation demand. The optimal storage rule curve of the Victoria reservoir developed in the study is shown in Figure 6.1.6-1.
Storage Rule Curve of Victoria Reservoir
0
100
200
300
400
500
600
700
800
Jan Feb Mar Apr May Jun Jul Aug Sep Oct Nov DecMonth
Sto
rage
(MC
M)
Rule Curve
Source: MASL
Figure 6.1.6-1 Optimal Rule Curve Suggested in “Mahaweli Water Resources Management Project”
MASL conducts simulation study, every six months, using past 30-year inflow data and irrigation requirement with applying this optimal rule curve shown in Figure 6.1.6-1. Monthly reservoir water levels with 50% and 80 % exceeding probability obtained by the simulation are used to prepare operation rule curves. The result of the simulation is used to develop the operation rule for April to September and from October to March, and is compiled in the “Seasonal Operation Plan” issued by MASL.
Feasibility Study for Expansion of Victoria Hydropower Station
Final Report 6-22
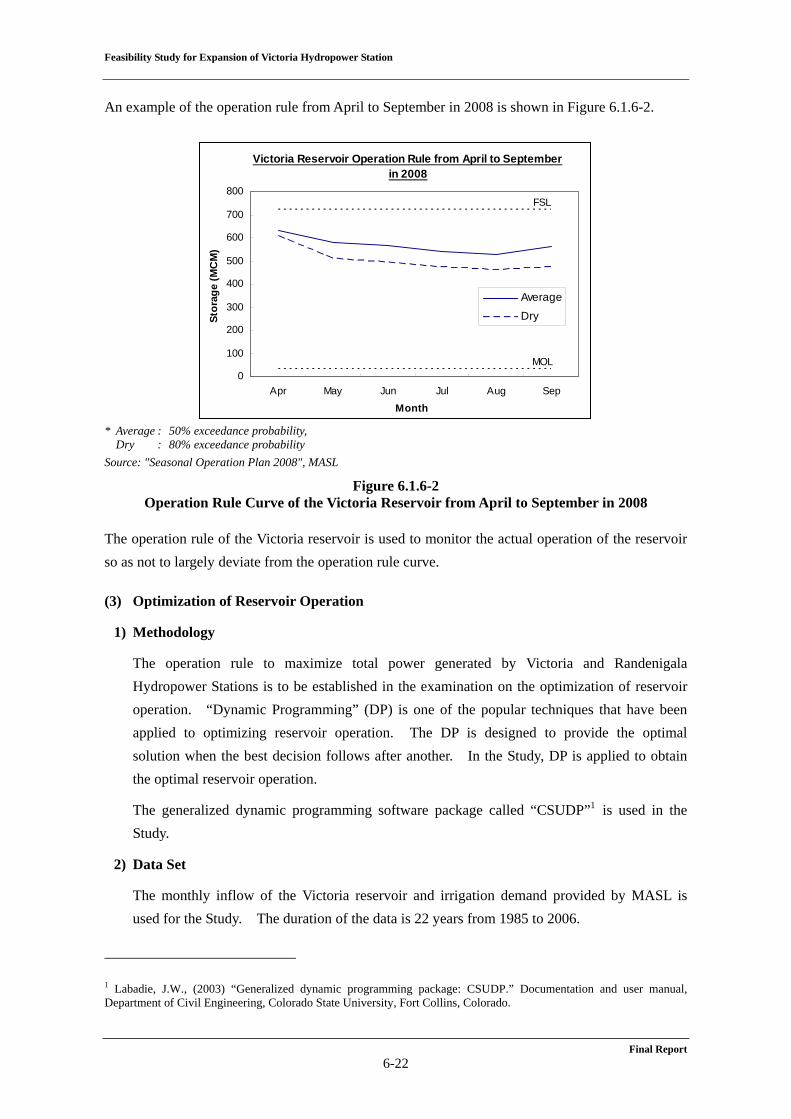
An example of the operation rule from April to September in 2008 is shown in Figure 6.1.6-2.
Victoria Reservoir Operation Rule from April to Septemberin 2008
0
100
200
300
400
500
600
700
800
Apr May Jun Jul Aug Sep
Month
Stor
age
(MC
M)
Average
Dry
FSL
MOL
* Average : 50% exceedance probability,
Dry : 80% exceedance probability Source: "Seasonal Operation Plan 2008", MASL
Figure 6.1.6-2 Operation Rule Curve of the Victoria Reservoir from April to September in 2008
The operation rule of the Victoria reservoir is used to monitor the actual operation of the reservoir so as not to largely deviate from the operation rule curve.
(3) Optimization of Reservoir Operation
1) Methodology
The operation rule to maximize total power generated by Victoria and Randenigala Hydropower Stations is to be established in the examination on the optimization of reservoir operation. “Dynamic Programming” (DP) is one of the popular techniques that have been applied to optimizing reservoir operation. The DP is designed to provide the optimal solution when the best decision follows after another. In the Study, DP is applied to obtain the optimal reservoir operation.
The generalized dynamic programming software package called “CSUDP”1 is used in the Study.
2) Data Set
The monthly inflow of the Victoria reservoir and irrigation demand provided by MASL is used for the Study. The duration of the data is 22 years from 1985 to 2006.
1 Labadie, J.W., (2003) “Generalized dynamic programming package: CSUDP.” Documentation and user manual, Department of Civil Engineering, Colorado State University, Fort Collins, Colorado.
Feasibility Study for Expansion of Victoria Hydropower Station
Final Report 6-23
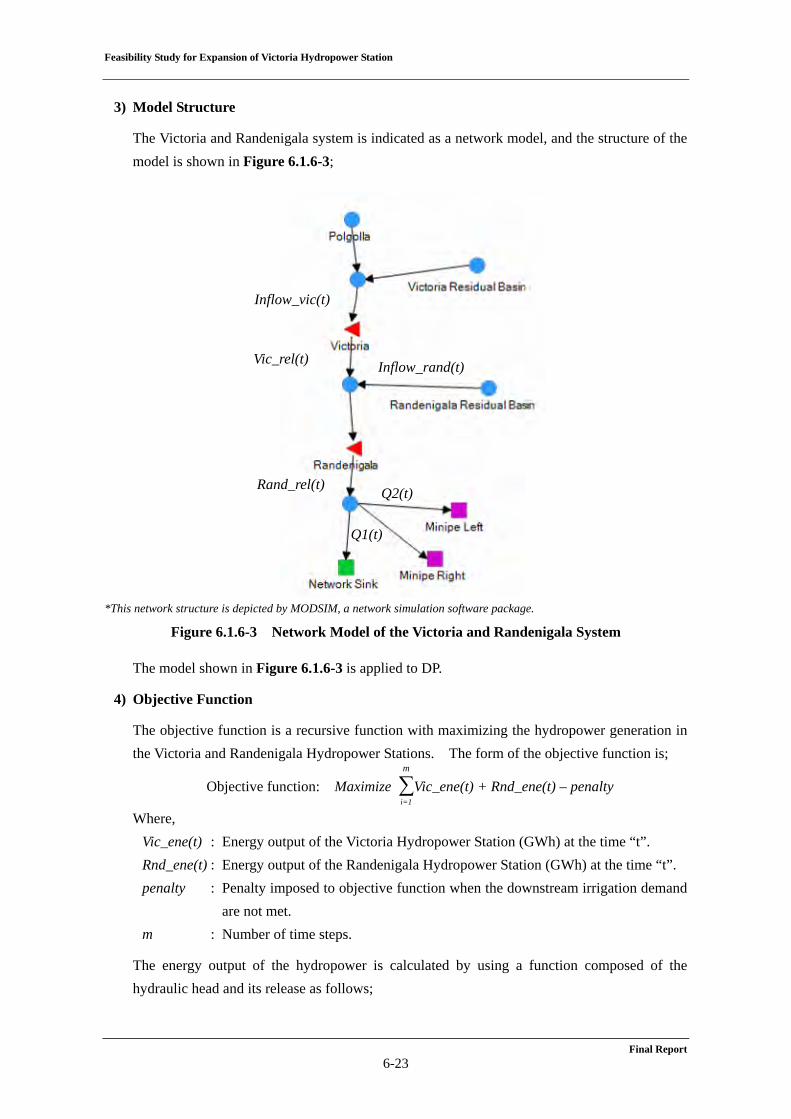
3) Model Structure
The Victoria and Randenigala system is indicated as a network model, and the structure of the model is shown in Figure 6.1.6-3;
*This network structure is depicted by MODSIM, a network simulation software package.
Figure 6.1.6-3 Network Model of the Victoria and Randenigala System
The model shown in Figure 6.1.6-3 is applied to DP.
4) Objective Function
The objective function is a recursive function with maximizing the hydropower generation in the Victoria and Randenigala Hydropower Stations. The form of the objective function is;
Objective function: Maximize ∑m
i=1
Vic_ene(t) + Rnd_ene(t) – penalty
Where, Vic_ene(t) : Energy output of the Victoria Hydropower Station (GWh) at the time “t”. Rnd_ene(t) : Energy output of the Randenigala Hydropower Station (GWh) at the time “t”. penalty : Penalty imposed to objective function when the downstream irrigation demand
are not met. m : Number of time steps.
The energy output of the hydropower is calculated by using a function composed of the hydraulic head and its release as follows;
Vic_rel(t)
Rand_rel(t)
Q1(t)
Q2(t)
Inflow_rand(t)
Inflow_vic(t)
Feasibility Study for Expansion of Victoria Hydropower Station
Final Report 6-24
Energy = g × Qpower × He× ε × t Where,
g : Gravity acceleration (m/s2) Qpower : Power discharge (m3/s) He : Effective head (m) ε : Combined efficiency t : Generation hour (hr)
The constraint of the objective function is that the discharge from the Victoria reservoir should fulfill the downstream irrigation demand, because the downstream demands have higher priority than the hydropower use. This constraint is represented by the penalty term involved in the objective function.
This penalty term is very large negative number and is imposed only if the downstream demand is not met in the iterative process. In this way, dynamic programming allocates water for the irrigation demand prior to hydropower generation. The purpose of employment of ‘penalty’ term instead of using simple constraints is to avoid optimization program easily fallen into infeasible solution during iteration process.
5) Decision Variables
Decision variables are;
Vic_rel(t) : Release from the Victoria Hydropower Station at time “t” Rnd_rel(t) : Release from Randenigala Hydropower Station at time “t” Q1(t) : Supply for Irrigation to “Minipe Right Bank” Q2(t) : Supply for Irrigation to “Minipe Left Bank”
6) Reservoir (State) Functions
The state functions of the reservoir for the Victoria and Randenigala reservoirs are expressed by water balance of the reservoir as follows.
Victoria reservoir Vic_vol(t) = Vic_vol(t-1) + Inflow_vic(t) – Vic_rel(t)
Randenigala reservoir Rand_vol(t) = Rand_vol(t-1) + Inflow_rand(t) + Vic_rel(t) – Rand_rel(t)
7) Constraints
The constraints of the model are; a. Water level of the Victoria reservoir and Randenigala reservoir should be more than the
minimum operating level. b. All variables are positive numbers.
Feasibility Study for Expansion of Victoria Hydropower Station
Final Report 6-25
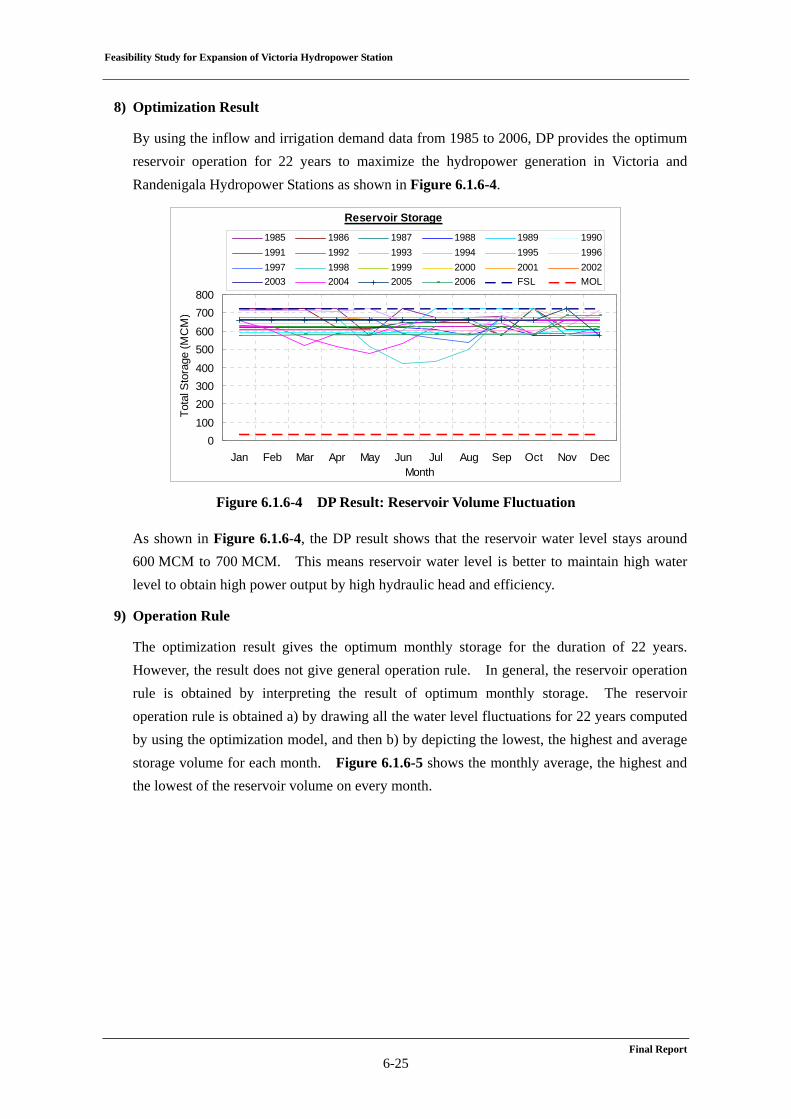
8) Optimization Result
By using the inflow and irrigation demand data from 1985 to 2006, DP provides the optimum reservoir operation for 22 years to maximize the hydropower generation in Victoria and Randenigala Hydropower Stations as shown in Figure 6.1.6-4.
Reservoir Storage
0100
200300400
500600
700800
Jan Feb Mar Apr May Jun Jul Aug Sep Oct Nov DecMonth
Tota
l Sto
rage
(MC
M)
1985 1986 1987 1988 1989 19901991 1992 1993 1994 1995 19961997 1998 1999 2000 2001 20022003 2004 2005 2006 FSL MOL
Figure 6.1.6-4 DP Result: Reservoir Volume Fluctuation
As shown in Figure 6.1.6-4, the DP result shows that the reservoir water level stays around 600 MCM to 700 MCM. This means reservoir water level is better to maintain high water level to obtain high power output by high hydraulic head and efficiency.
9) Operation Rule
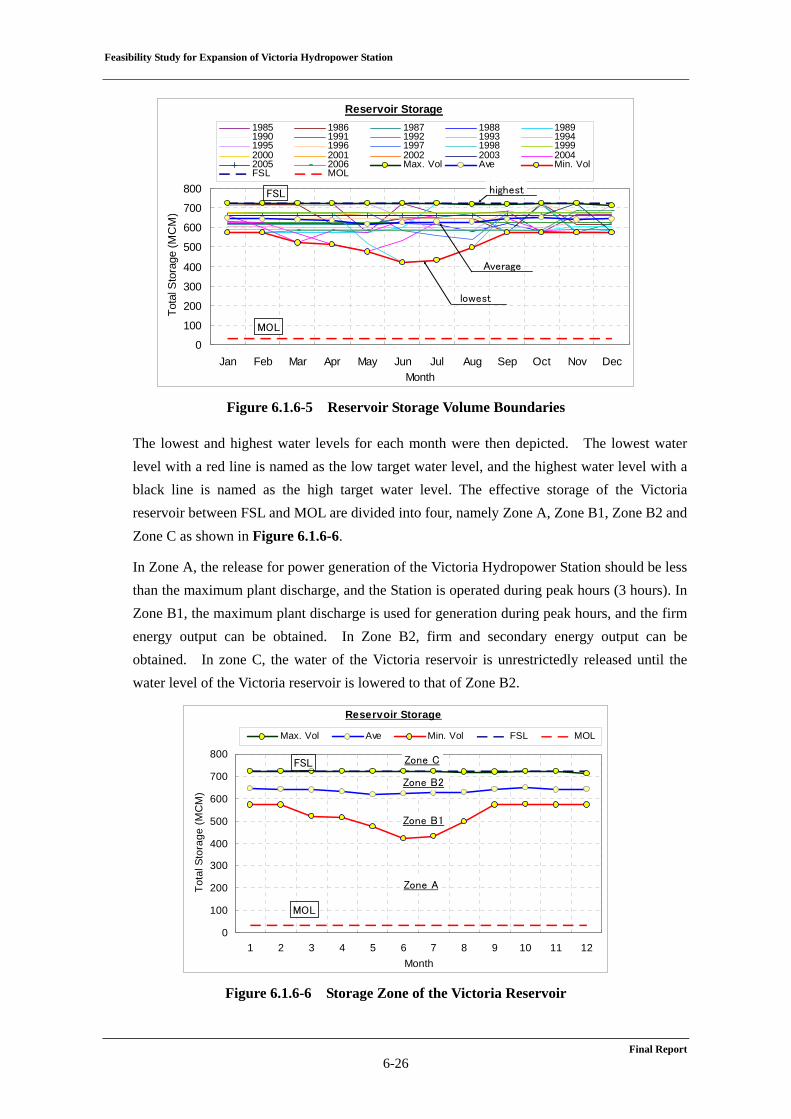
The optimization result gives the optimum monthly storage for the duration of 22 years. However, the result does not give general operation rule. In general, the reservoir operation rule is obtained by interpreting the result of optimum monthly storage. The reservoir operation rule is obtained a) by drawing all the water level fluctuations for 22 years computed by using the optimization model, and then b) by depicting the lowest, the highest and average storage volume for each month. Figure 6.1.6-5 shows the monthly average, the highest and the lowest of the reservoir volume on every month.
Feasibility Study for Expansion of Victoria Hydropower Station
Final Report 6-26
Reservoir Storage
0
100
200
300
400
500
600
700
800
Jan Feb Mar Apr May Jun Jul Aug Sep Oct Nov DecMonth
Tota
l Sto
rage
(MC
M)
1985 1986 1987 1988 19891990 1991 1992 1993 19941995 1996 1997 1998 19992000 2001 2002 2003 20042005 2006 Max. Vol Ave Min. VolFSL MOL
FSL
MOL
highest
lowest
Average
Figure 6.1.6-5 Reservoir Storage Volume Boundaries
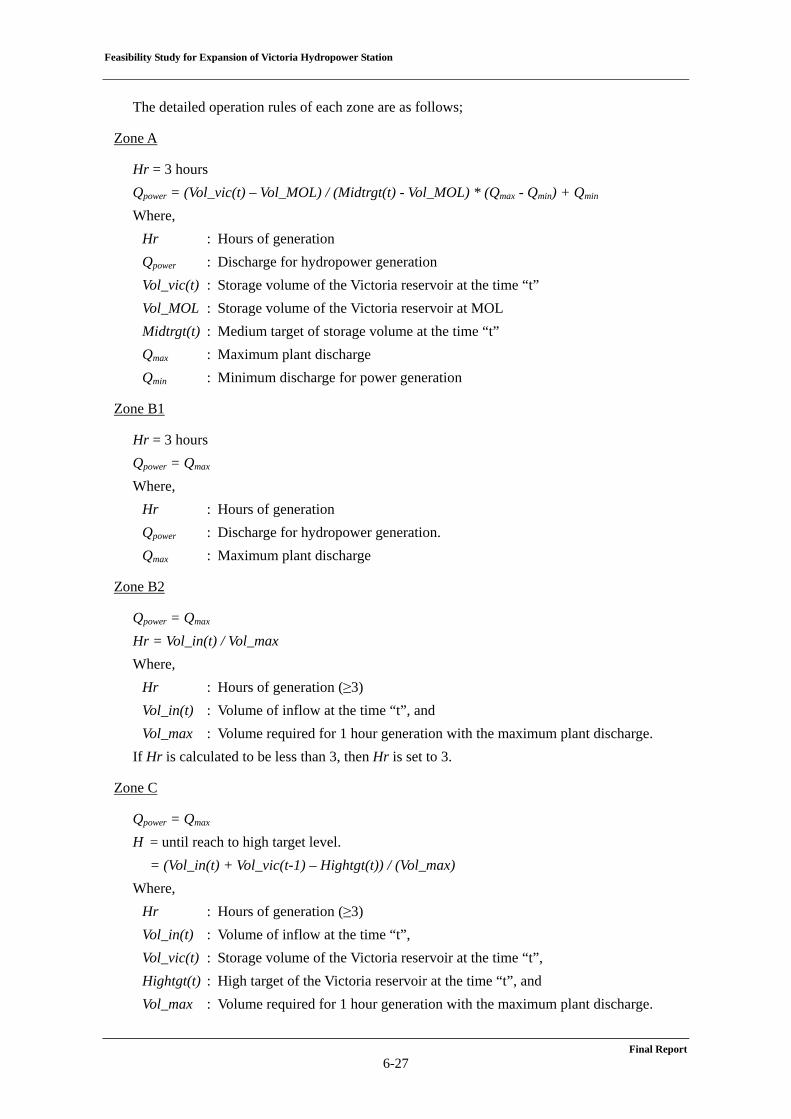
The lowest and highest water levels for each month were then depicted. The lowest water level with a red line is named as the low target water level, and the highest water level with a black line is named as the high target water level. The effective storage of the Victoria reservoir between FSL and MOL are divided into four, namely Zone A, Zone B1, Zone B2 and Zone C as shown in Figure 6.1.6-6.
In Zone A, the release for power generation of the Victoria Hydropower Station should be less than the maximum plant discharge, and the Station is operated during peak hours (3 hours). In Zone B1, the maximum plant discharge is used for generation during peak hours, and the firm energy output can be obtained. In Zone B2, firm and secondary energy output can be obtained. In zone C, the water of the Victoria reservoir is unrestrictedly released until the water level of the Victoria reservoir is lowered to that of Zone B2.
Reservoir Storage
0
100
200
300
400
500
600
700
800
1 2 3 4 5 6 7 8 9 10 11 12Month
Tota
l Sto
rage
(MC
M)
Max. Vol Ave Min. Vol FSL MOL
FSL
MOL
Zone A
Zone B1
Zone C
Zone B2
Figure 6.1.6-6 Storage Zone of the Victoria Reservoir
Feasibility Study for Expansion of Victoria Hydropower Station
Final Report 6-27
The detailed operation rules of each zone are as follows;
Zone A
Hr = 3 hours Qpower = (Vol_vic(t) – Vol_MOL) / (Midtrgt(t) - Vol_MOL) * (Qmax - Qmin) + Qmin Where,
Hr : Hours of generation Qpower : Discharge for hydropower generation Vol_vic(t) : Storage volume of the Victoria reservoir at the time “t” Vol_MOL : Storage volume of the Victoria reservoir at MOL Midtrgt(t) : Medium target of storage volume at the time “t” Qmax : Maximum plant discharge Qmin : Minimum discharge for power generation
Zone B1
Hr = 3 hours Qpower = Qmax Where,
Hr : Hours of generation Qpower : Discharge for hydropower generation. Qmax : Maximum plant discharge
Zone B2
Qpower = Qmax Hr = Vol_in(t) / Vol_max Where,
Hr : Hours of generation (≥3) Vol_in(t) : Volume of inflow at the time “t”, and Vol_max : Volume required for 1 hour generation with the maximum plant discharge.
If Hr is calculated to be less than 3, then Hr is set to 3.
Zone C
Qpower = Qmax H = until reach to high target level.
= (Vol_in(t) + Vol_vic(t-1) – Hightgt(t)) / (Vol_max) Where,
Hr : Hours of generation (≥3) Vol_in(t) : Volume of inflow at the time “t”, Vol_vic(t) : Storage volume of the Victoria reservoir at the time “t”, Hightgt(t) : High target of the Victoria reservoir at the time “t”, and Vol_max : Volume required for 1 hour generation with the maximum plant discharge.
Feasibility Study for Expansion of Victoria Hydropower Station
Final Report 6-28
If Hr is calculated to be less than 3, then Hr is set to 3.
(4) Generation Method of Pumped Storage Option
As discussed in Section 6.1.11, WASP study for the period from 2008 to 2027 analyzes the pumped storage option with condition of maximum possible annual energy assuming duration of generation was 1,000 hours a year. The analysis shows that energy by pumped storage power increases after the year 2021 and that the average annual generation hour amounts to 374 hours a year from 2021 to 2027.
In consideration of the result of WASP study, the simulation of power generation on the pumped storage option assumes the generation method combining pumped storage type which generates power for 374 hours per annum using pumped-up water and conventional type power generation using storage water with natural stream flow.
(5) Simulation on Power Generation
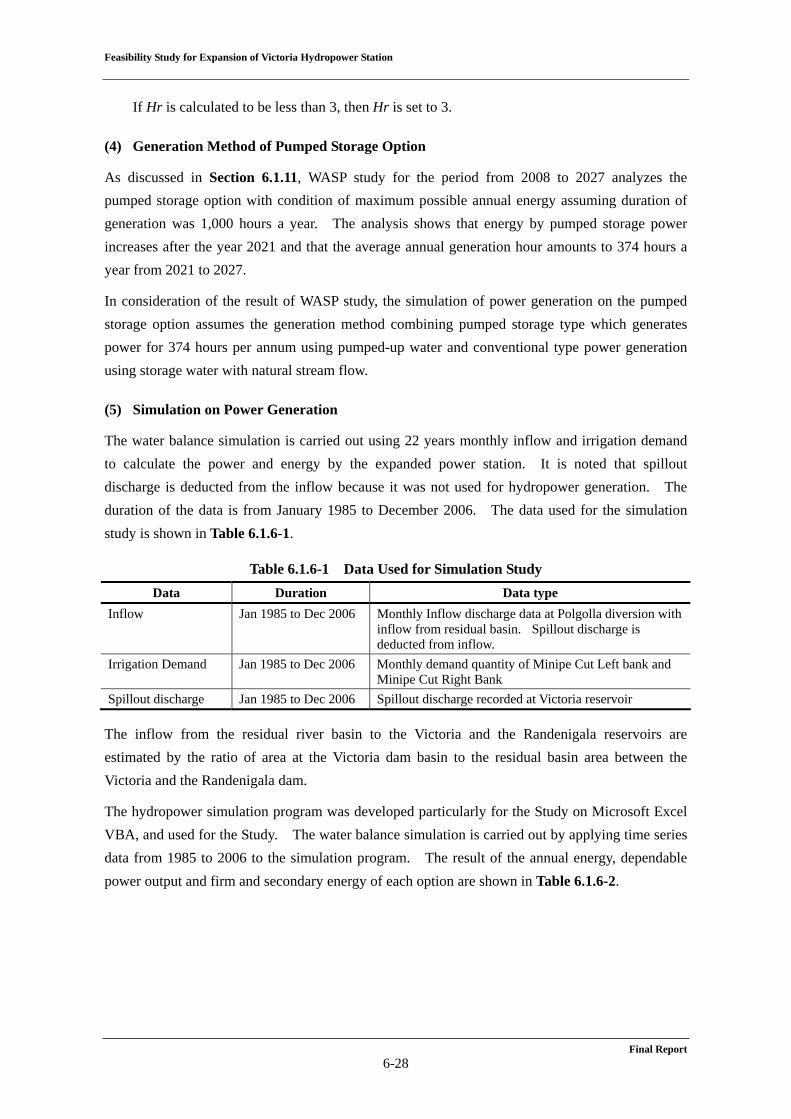
The water balance simulation is carried out using 22 years monthly inflow and irrigation demand to calculate the power and energy by the expanded power station. It is noted that spillout discharge is deducted from the inflow because it was not used for hydropower generation. The duration of the data is from January 1985 to December 2006. The data used for the simulation study is shown in Table 6.1.6-1.
Table 6.1.6-1 Data Used for Simulation Study Data Duration Data type
Inflow Jan 1985 to Dec 2006 Monthly Inflow discharge data at Polgolla diversion with inflow from residual basin. Spillout discharge is deducted from inflow.
Irrigation Demand Jan 1985 to Dec 2006 Monthly demand quantity of Minipe Cut Left bank and Minipe Cut Right Bank
Spillout discharge Jan 1985 to Dec 2006 Spillout discharge recorded at Victoria reservoir The inflow from the residual river basin to the Victoria and the Randenigala reservoirs are estimated by the ratio of area at the Victoria dam basin to the residual basin area between the Victoria and the Randenigala dam.
The hydropower simulation program was developed particularly for the Study on Microsoft Excel VBA, and used for the Study. The water balance simulation is carried out by applying time series data from 1985 to 2006 to the simulation program. The result of the annual energy, dependable power output and firm and secondary energy of each option are shown in Table 6.1.6-2.
Feasibility Study for Expansion of Victoria Hydropower Station
Final Report 6-29
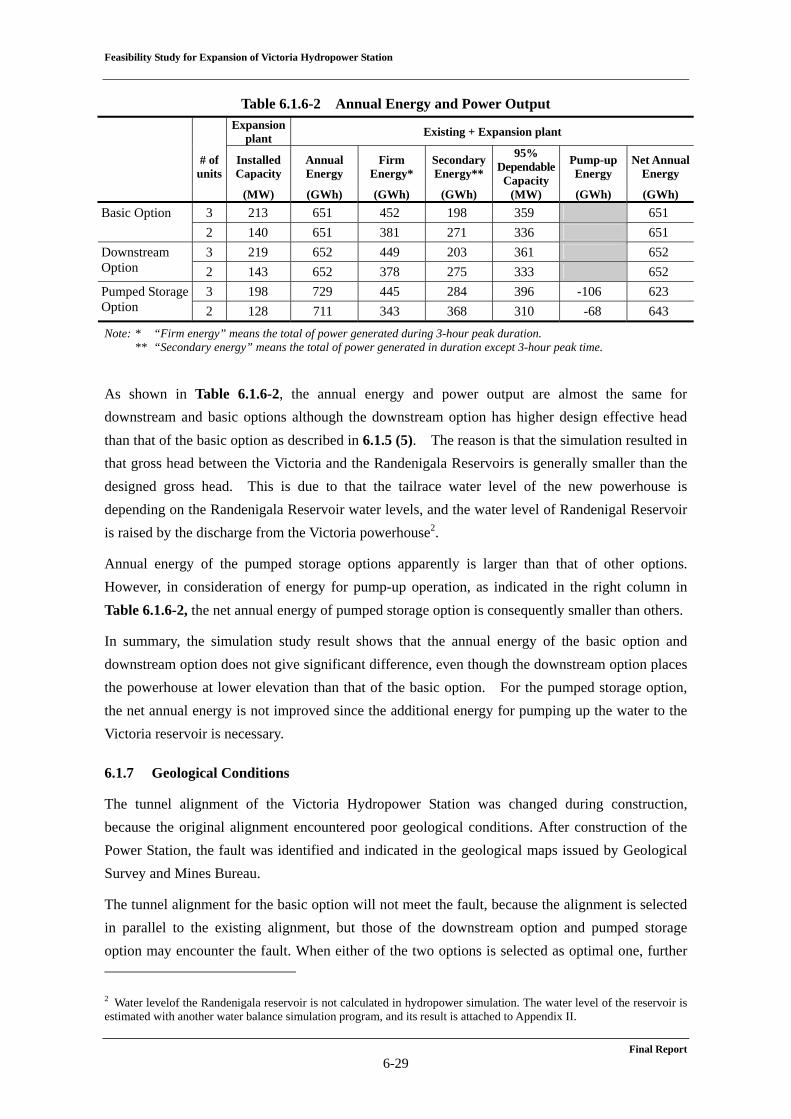
Table 6.1.6-2 Annual Energy and Power Output
Expansion plant Existing + Expansion plant
# of units
Installed Capacity
Annual Energy
Firm Energy*
Secondary Energy**
95% DependableCapacity
Pump-up Energy
Net Annual Energy
(MW) (GWh) (GWh) (GWh) (MW) (GWh) (GWh) 3 213 651 452 198 359 651 Basic Option 2 140 651 381 271 336 651 3 219 652 449 203 361 652 Downstream
Option 2 143 652 378 275 333 652 3 198 729 445 284 396 -106 623 Pumped Storage
Option 2 128 711 343 368 310 -68 643 Note: * “Firm energy” means the total of power generated during 3-hour peak duration.
** “Secondary energy” means the total of power generated in duration except 3-hour peak time.
As shown in Table 6.1.6-2, the annual energy and power output are almost the same for downstream and basic options although the downstream option has higher design effective head than that of the basic option as described in 6.1.5 (5). The reason is that the simulation resulted in that gross head between the Victoria and the Randenigala Reservoirs is generally smaller than the designed gross head. This is due to that the tailrace water level of the new powerhouse is depending on the Randenigala Reservoir water levels, and the water level of Randenigal Reservoir is raised by the discharge from the Victoria powerhouse2.
Annual energy of the pumped storage options apparently is larger than that of other options. However, in consideration of energy for pump-up operation, as indicated in the right column in Table 6.1.6-2, the net annual energy of pumped storage option is consequently smaller than others.
In summary, the simulation study result shows that the annual energy of the basic option and downstream option does not give significant difference, even though the downstream option places the powerhouse at lower elevation than that of the basic option. For the pumped storage option, the net annual energy is not improved since the additional energy for pumping up the water to the Victoria reservoir is necessary.
6.1.7 Geological Conditions
The tunnel alignment of the Victoria Hydropower Station was changed during construction, because the original alignment encountered poor geological conditions. After construction of the Power Station, the fault was identified and indicated in the geological maps issued by Geological Survey and Mines Bureau.
The tunnel alignment for the basic option will not meet the fault, because the alignment is selected in parallel to the existing alignment, but those of the downstream option and pumped storage option may encounter the fault. When either of the two options is selected as optimal one, further 2 Water levelof the Randenigala reservoir is not calculated in hydropower simulation. The water level of the reservoir is estimated with another water balance simulation program, and its result is attached to Appendix II.
Feasibility Study for Expansion of Victoria Hydropower Station
Final Report 6-30
geological investigation should be necessary during feasibility study stage or during detailed design stage, and measures to cope with the fault should be prepared before commencement of construction works.
The above geological conditions may need additional construction cost and additional period up to completion of the construction work of the downstream option and pumped storage option (see Section 7.2).
6.1.8 Construction Planning
(1) New Access Tunnel and New Access Road
Study Team examined necessity of new access tunnels and new access roads necessary for construction of each option. The result is shown in Table 6.1.8-1.
Table 6.1.8-1 New Access Tunnel and New Access Road New Access Tunnel New Access Road
Basic Option 3 units Not necessary Not necessary 2 units Not necessary Not necessary
3 units 1 tunnel with 500 m 2 roads with total length of 2.8 kmDownstream Option 2 units 1 tunnel with 500 m 2 roads with total length of 2.8 km
3 units 1 tunnel with 500 m and 1 tunnel with 600 m 2 roads with total length of 3.7 kmPumped Storage Option 2 units 1 tunnel with 500 m and 1 tunnel with 600 m 2 roads with total length of 3.7 km
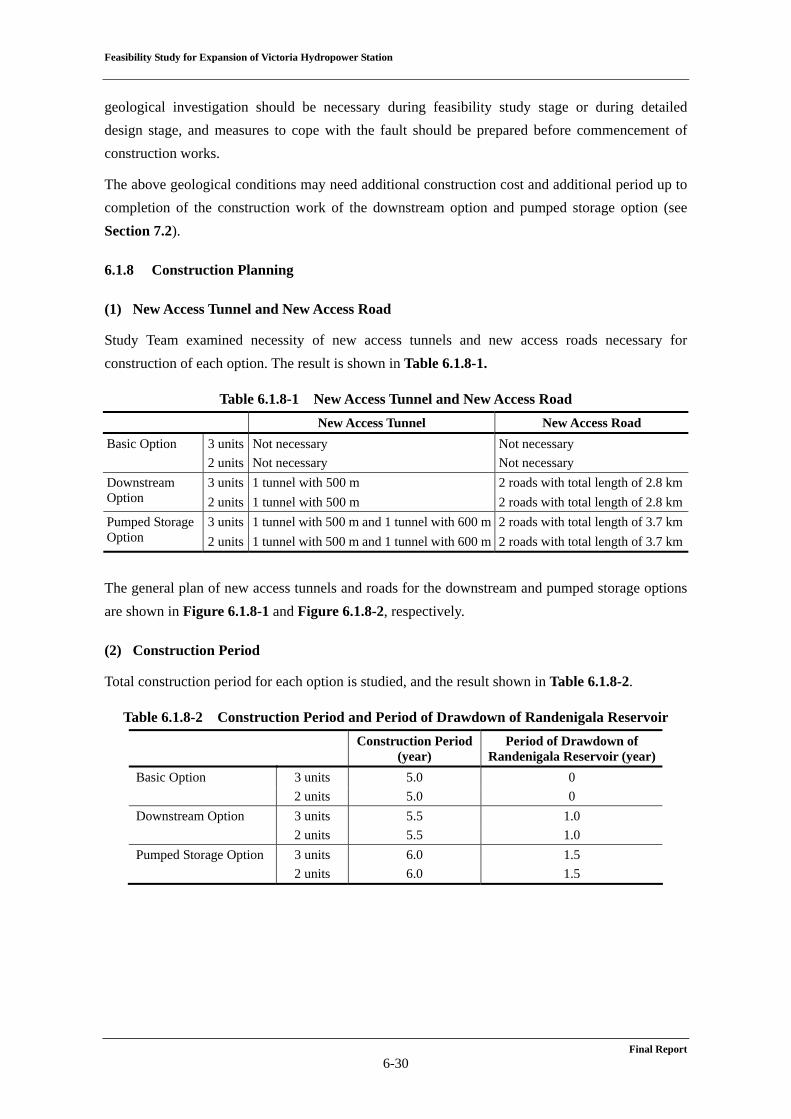
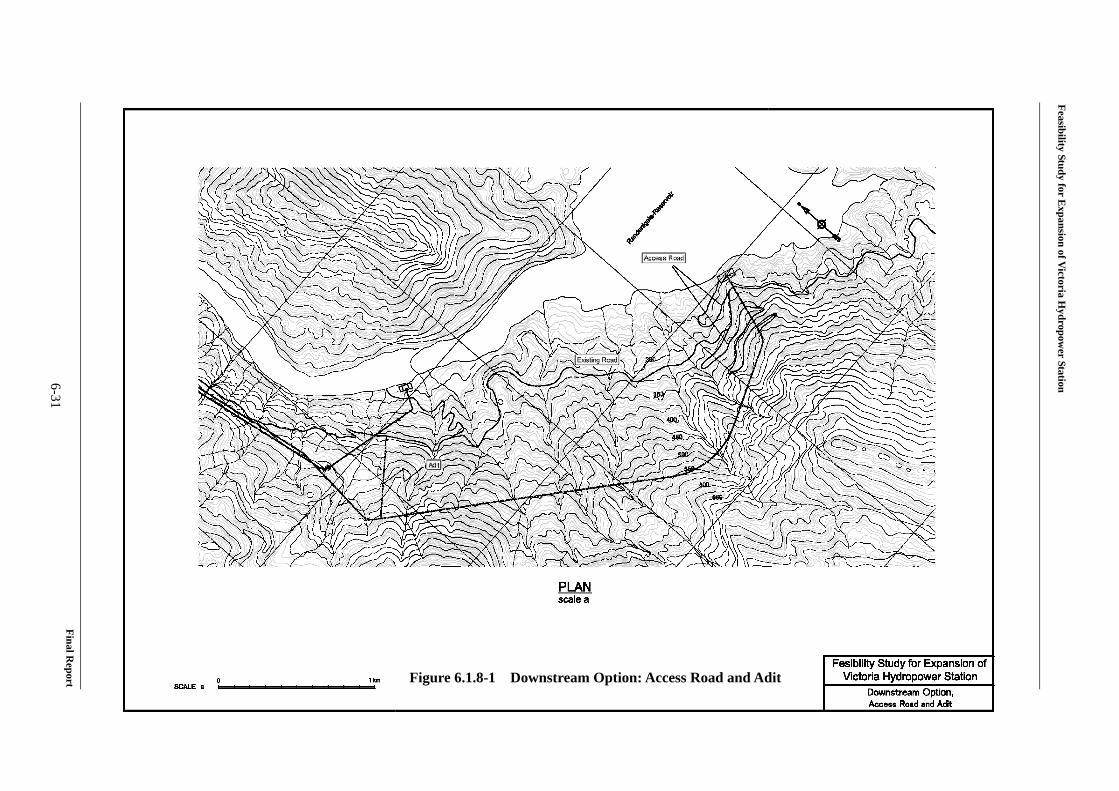
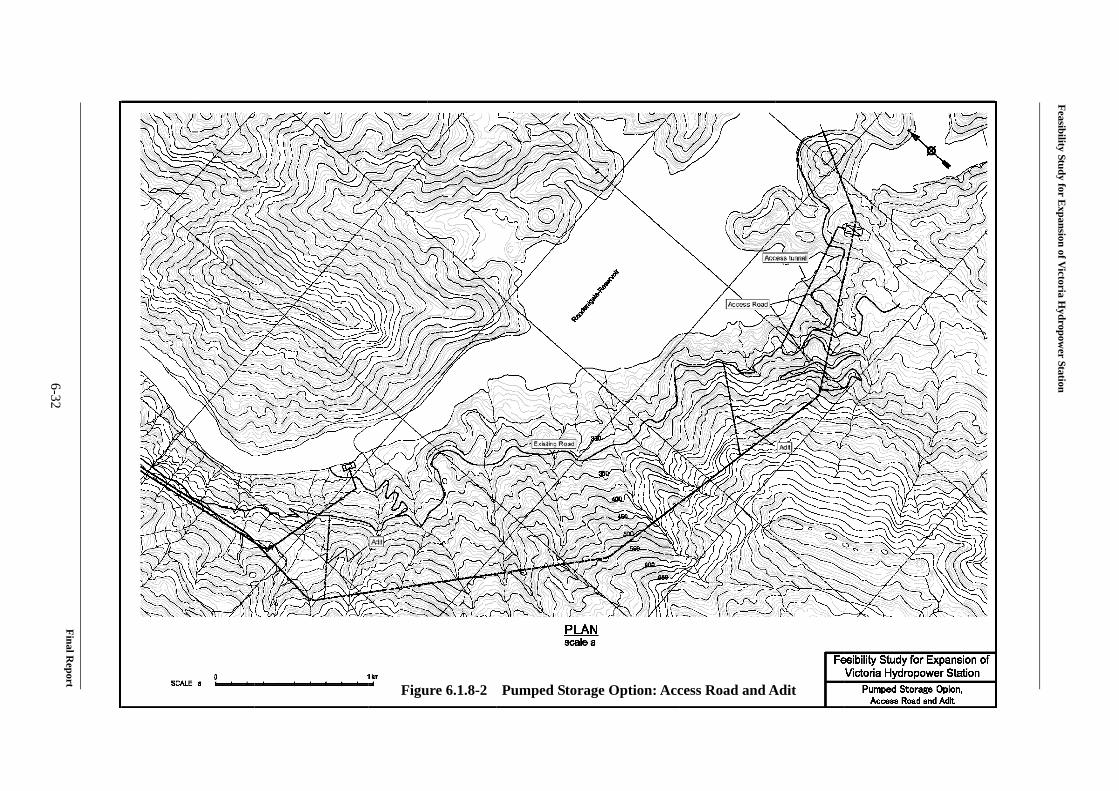
The general plan of new access tunnels and roads for the downstream and pumped storage options are shown in Figure 6.1.8-1 and Figure 6.1.8-2, respectively.
(2) Construction Period
Total construction period for each option is studied, and the result shown in Table 6.1.8-2.
Table 6.1.8-2 Construction Period and Period of Drawdown of Randenigala Reservoir
Construction Period(year)
Period of Drawdown of Randenigala Reservoir (year)
Basic Option 3 units 5.0 0 2 units 5.0 0 Downstream Option 3 units 5.5 1.0 2 units 5.5 1.0 Pumped Storage Option 3 units 6.0 1.5 2 units 6.0 1.5
Feasibility Study for Expansion of V
ictoria Hydropow
er Station
Final Report
6-31
Figure 6.1.8-1 Downstream Option: Access Road and Adit
Feasibility Study for Expansion of V
ictoria Hydropow
er Station
Final Report
6-32
Figure 6.1.8-2 Pumped Storage Option: Access Road and Adit
Feasibility Study for Expansion of Victoria Hydropower Station
Final Report 6-33
6.1.9 Environmental and Social Considerations
The study on the environmental and social impacts is examined in preliminary study level. The anticipated impacts caused by each option are assessed in Chapter 8. According to the study on the environmental and social aspect for each alternative option, the basic is the least impacts among three alternatives, while the pumped storage option imposes the largest impact on the environment, and the downstream option is the middle of the basic and the pumped storage option.
6.1.10 Benefit and Cost Analysis (B/C Analysis)
(1) Method
Three alternative options are compared by annualized economic benefit and cost of each option (B/C analysis). Economic benefit is composed of capacity and energy benefits. The capacity benefit is costs comprised of capital cost (construction cost) and fixed O&M cost of the alternative gas turbine plant which has equivalent generation capacity. The energy benefit consists of the fuel cost and variable O&M cost of the alternative gas turbine (in peak duration) and coal-fired thermal plant (in off-peak duration).
1) Capacity benefit (US$/kW) : Capital cost (construction cost) and fixed O&M cost 2) Energy benefit (US$/kWh) : Fuel cost and variable O&M cost
The capacity and energy benefit is annual value; and the benefit of each alternative option can be obtained by combining these two benefits.
The cost is annualized value converted from the total project cost. The conversion of the total project cost to annualized cost is made by using the following equation:
(Construction Cost + IDC) × β + Annual Operation & Maintenance Cost Where,
IDC : Interest during construction β : Capital recovery factor = i (1 + i)t/{(1 + i)t-1}
Where, i : Discount rate (= 10%) t : Operation period (= 50 years)
In the economic aspect, the optimal option is determined as one with the maximum B/C.
(2) Economic Data
Economic data on alternative thermal power plants are mainly obtained from the “Generation Expansion Plan 2008-2022 (Draft)” prepared by CEB. Those data were derived from the value at the beginning of 2007.
Feasibility Study for Expansion of Victoria Hydropower Station
Final Report 6-34
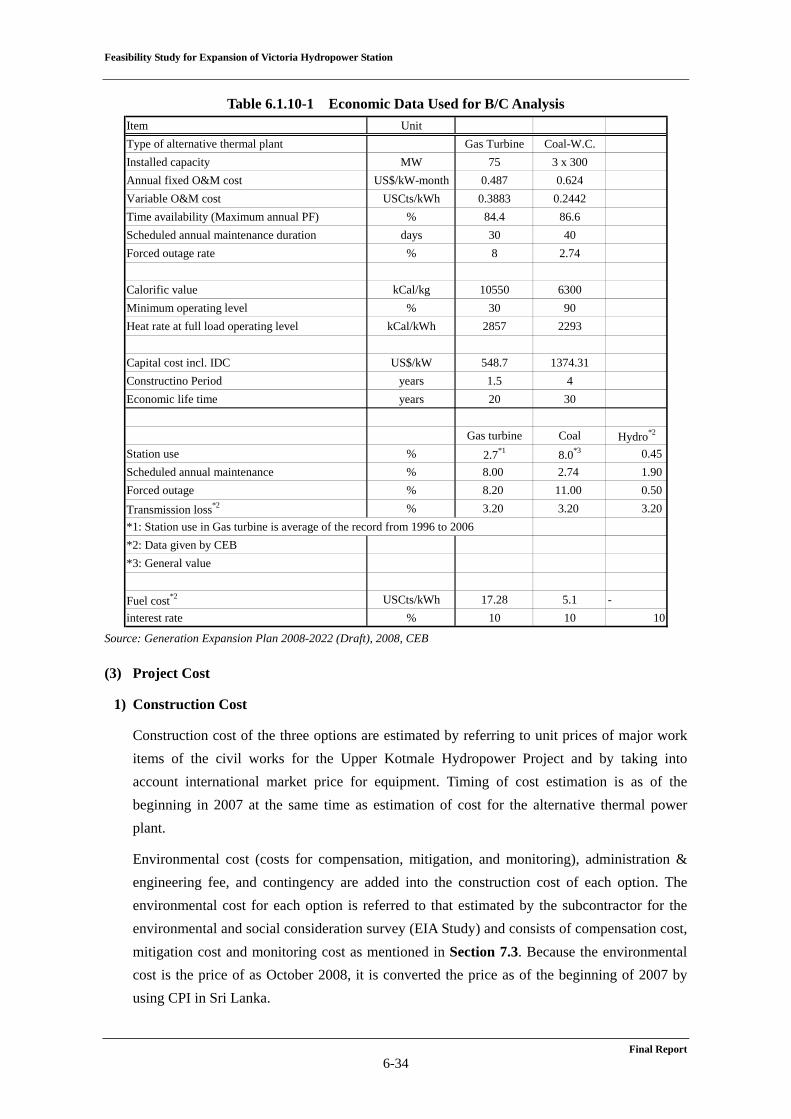
Table 6.1.10-1 Economic Data Used for B/C Analysis Item UnitType of alternative thermal plant Gas Turbine Coal-W.C.Installed capacity MW 75 3 x 300Annual fixed O&M cost US$/kW-month 0.487 0.624Variable O&M cost USCts/kWh 0.3883 0.2442Time availability (Maximum annual PF) % 84.4 86.6Scheduled annual maintenance duration days 30 40Forced outage rate % 8 2.74
Calorific value kCal/kg 10550 6300Minimum operating level % 30 90Heat rate at full load operating level kCal/kWh 2857 2293
Capital cost incl. IDC US$/kW 548.7 1374.31Constructino Period years 1.5 4Economic life time years 20 30
Gas turbine Coal Hydro*2
Station use % 2.7*1 8.0*3 0.45Scheduled annual maintenance % 8.00 2.74 1.90Forced outage % 8.20 11.00 0.50Transmission loss*2 % 3.20 3.20 3.20*1: Station use in Gas turbine is average of the record from 1996 to 2006*2: Data given by CEB*3: General value
Fuel cost*2 USCts/kWh 17.28 5.1 -interest rate % 10 10 10
Source: Generation Expansion Plan 2008-2022 (Draft), 2008, CEB
(3) Project Cost
1) Construction Cost
Construction cost of the three options are estimated by referring to unit prices of major work items of the civil works for the Upper Kotmale Hydropower Project and by taking into account international market price for equipment. Timing of cost estimation is as of the beginning in 2007 at the same time as estimation of cost for the alternative thermal power plant.
Environmental cost (costs for compensation, mitigation, and monitoring), administration & engineering fee, and contingency are added into the construction cost of each option. The environmental cost for each option is referred to that estimated by the subcontractor for the environmental and social consideration survey (EIA Study) and consists of compensation cost, mitigation cost and monitoring cost as mentioned in Section 7.3. Because the environmental cost is the price of as October 2008, it is converted the price as of the beginning of 2007 by using CPI in Sri Lanka.
Feasibility Study for Expansion of Victoria Hydropower Station
Final Report 6-35
The construction cost of each option is as shown in Table 6.1.10-2;
Table 6.1.10-2 Project Construction Cost for Each Option (unit: mil. US$) Basic Downstream Item Peak Duration: 3 hours Peak Duration: 3 hours
Pumped Storage
3 units 2 units 3 units 2 units 3 units 2 unitsA Preparatory Works 1.5 1.5 2.0 2.0 2.5 2.5 B Civil works 56.8 41.5 90.0 66.3 150.1 118.1 C Equipment & Transmission Line 82.5 67.0 82.5 67.9 123.4 95.7 D Total (A to C) 140.8 110.0 174.5 136.2 276.0 216.3 E Environmental Cost 1.5 1.5 1.9 1.9 2.2 2.2 F Administration & Engineering Fee 14.1 11.0 17.5 13.6 27.6 21.6 G Contingency 15.7 12.2 19.4 15.2 30.6 24.0 H Total construction cost 172.1 134.7 213.3 166.9 336.4 264.1
2) Reduction of Energy of Randenigala Power Station during Construction
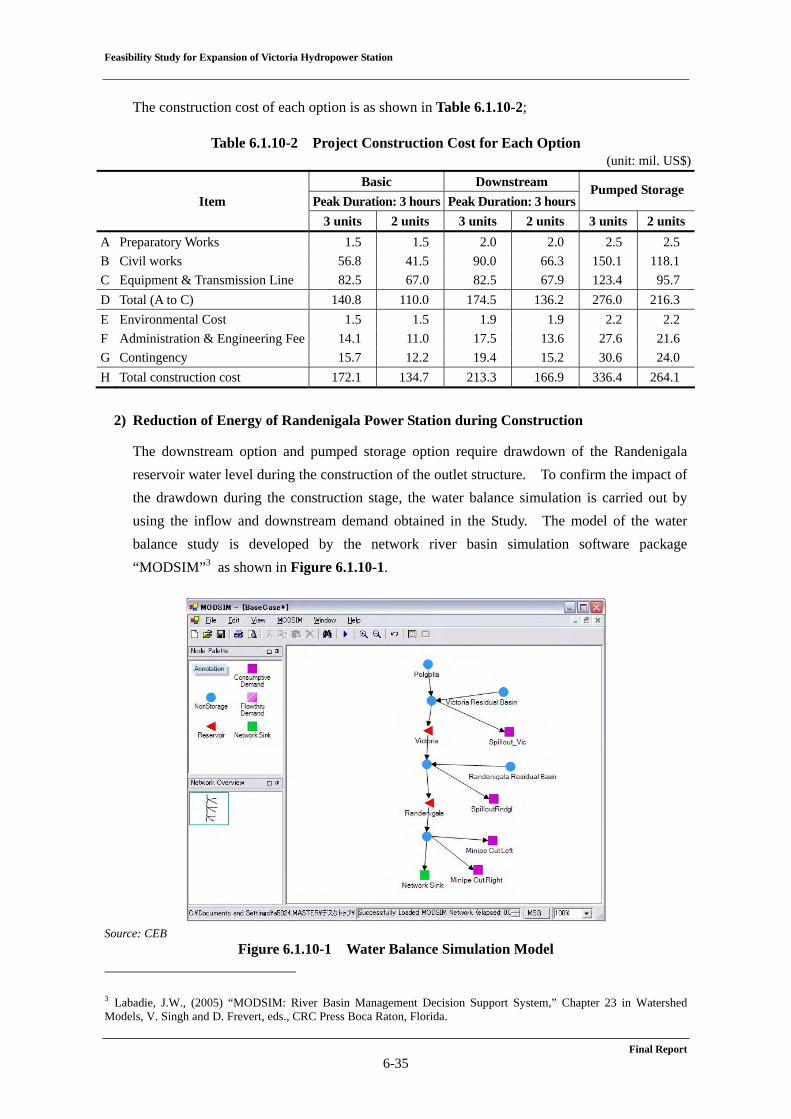
The downstream option and pumped storage option require drawdown of the Randenigala reservoir water level during the construction of the outlet structure. To confirm the impact of the drawdown during the construction stage, the water balance simulation is carried out by using the inflow and downstream demand obtained in the Study. The model of the water balance study is developed by the network river basin simulation software package “MODSIM”3 as shown in Figure 6.1.10-1.
Source: CEB
Figure 6.1.10-1 Water Balance Simulation Model 3 Labadie, J.W., (2005) “MODSIM: River Basin Management Decision Support System,” Chapter 23 in Watershed Models, V. Singh and D. Frevert, eds., CRC Press Boca Raton, Florida.
Feasibility Study for Expansion of Victoria Hydropower Station
Final Report 6-36
The data used in this water balance are:
Inflow : Monthly Inflow discharge data at Polgolla diversion given by MASL.
Residual Basin Inflow : Inflow calculated in proportion to the river basin area. Demand : Monthly demand quantity of “Minipe Cut Left Bank”
and ”Minipe Right Bank” given by MASL. Spill out : Spillout discharge is the water quantity not used for
hydropower generation.
The operation of the Victoria and Randenigala reservoirs and hydropower stations is envisaged as shown in the Table 6.1.10-3.
Table 6.1.10-3 Operation Rule during Construction
Basic Option Downstream option Pumped Storage Option
VictoriaNormal Hydropower generation
considering with irrigation demandHydropower generationconsidering with irrigation demand
RandenigalaNormal Lowering WL to 209
Generating like run-of-river typeLowering to 207 mASL.No hydropower generation.
In the simulation of the above water balance, the Rendenigala reservoir water level is lowered to the sill elevation as described before. Following Table 6.1.10-4 shows the reduction of the annual energy by the Victoria and the Randenigala hydropower stations combined.
Table 6.1.10-4 Reduction of Annual Energy during Construction
Item Unit Basic option Downstream Option
Pumped Storage Option
Reduction of Annual Energy GWh/year 0 108 349 Duration of drawdown year 0 1 1.5 Total reduction of energy GWh 0 108 524
As shown in the above table, annual energy of the downstream option will be decreased of 108 GWh, and that of the pumped storage option will be decreased by 524 GWh during construction.
The reduction of energy in downstream option and pumped storage option is assumed to be recovered by the coal-fired thermal power plant generation. The increment cost of the coal-fired thermal power generation is;
E × C1 Where,
E : Total energy recovered by coal-fired thermal power generation (kWh) C1 : kWh value of coal-fired thermal power generation (US$/kWh)
Feasibility Study for Expansion of Victoria Hydropower Station
Final Report 6-37
The reduction of energy is calculated around 108 GWh/year for downstream option and 349 GWh/year for pumped storage option. The duration of the reduction of energy is 1.0 year for downstream option and 1.5 years for pumped storage option.
Annualized costs of the reduction energy are;
Downstream option: 108 (GWh/year) × 106 × 1.0 (year) × 0.0534 US$/kWh ≈ 5.8 Mill. US$
Pumped storage option: 349 (GWh/year) × 106 × 1.5 (year) × 0.0534 US$/kWh ≈ 28.0 Mill. US$
The electricity generated by the coal power plant is accounted as the cost of the downstream and pumped storage option.
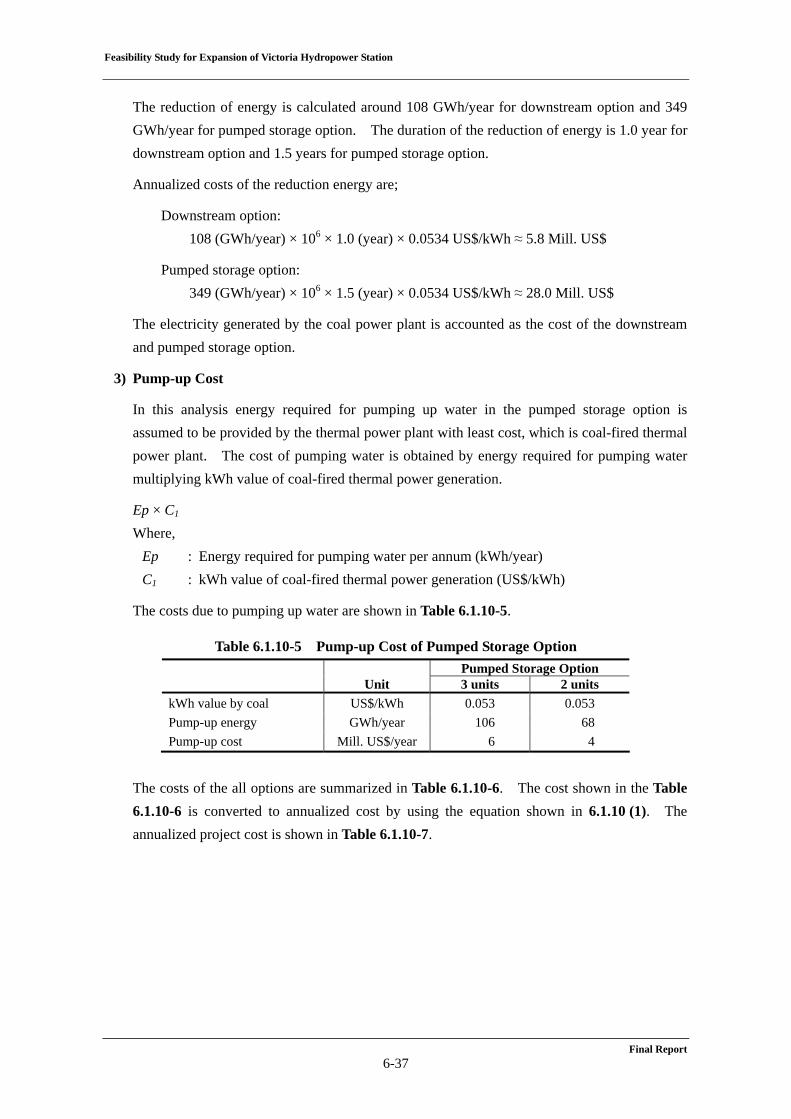
3) Pump-up Cost
In this analysis energy required for pumping up water in the pumped storage option is assumed to be provided by the thermal power plant with least cost, which is coal-fired thermal power plant. The cost of pumping water is obtained by energy required for pumping water multiplying kWh value of coal-fired thermal power generation.
Ep × C1 Where,
Ep : Energy required for pumping water per annum (kWh/year) C1 : kWh value of coal-fired thermal power generation (US$/kWh)
The costs due to pumping up water are shown in Table 6.1.10-5.
Table 6.1.10-5 Pump-up Cost of Pumped Storage Option Pumped Storage Option Unit 3 units 2 units
kWh value by coal US$/kWh 0.053 0.053 Pump-up energy GWh/year 106 68 Pump-up cost Mill. US$/year 6 4
The costs of the all options are summarized in Table 6.1.10-6. The cost shown in the Table 6.1.10-6 is converted to annualized cost by using the equation shown in 6.1.10 (1). The annualized project cost is shown in Table 6.1.10-7.

Feasibility Study for Expansion of Victoria Hydropower Station
Final Report 6-38
Table 6.1.10-6 Summary of the Project Cost Basic Downstream
Item Unit 3 hrs 3 hrs 3 hrs 3 hrs Pumped Storage
3 units 2 units 3 units 2 units 3 units 2 unitsPreparatory Works Mill. US$ 1.5 1.5 2.0 2.0 2.5 2.5Civil works Mill. US$ 56.8 41.5 90.0 66.3 150.1 118.1Equipment & Transmission Line Mill. US$ 82.5 67.0 82.5 67.9 123.4 95.7Environmental Cost Mill. US$ 1.5 1.5 1.9 1.9 2.2 2.2Administration & Engineering Fee Mill. US$ 14.1 11.0 17.5 13.6 27.6 21.6Contingency Mill. US$ 15.7 12.2 19.4 15.2 30.6 24.0Reduction of Energy GWh/year 0 0 108 108 349 349Period of reduction years 0 0 1 1 1.5 1.5kWh value by coal US$/kWh 0.053 0.053 0.053 0.053 0.053 0.053Cost of reduction of energy covered by Coal power
Mill. US$ 0 0 5.8 5.8 28.0 28.0
Total construction cost Mill. US$ 172.1 134.7 213.3 166.9 336.3 264.1Total construction cost incl. cost of reduction of energy
Mill. US$ 172.1 134.7 219.1 172.7 364.3 292.1
Pumped storage generation hours hours/year 374 374Pump-up power MW 198 128Pump-up efficiency % 70 70Pump-up hours hours/year 534 534Pump-up energy GWh/year 106 68Pump-up cost (using coal kWh value) Mill. US$/year 6 4 In Table 6.1.10-6, the pump-up hours of 534 is obtained by the pumped storage generation hours and efficiency of pumping up water (i.e. 534 = 374 / 0.7).
Feasibility Study for Expansion of Victoria Hydropower Station
Final Report 6-39
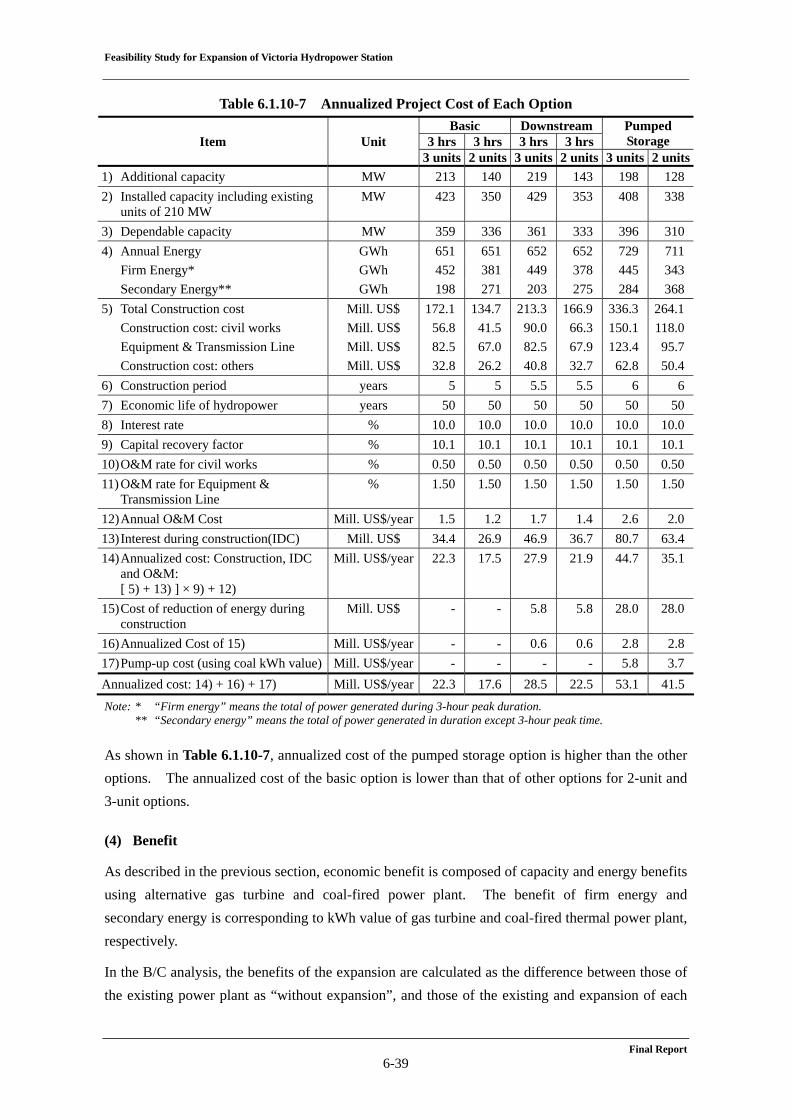
Table 6.1.10-7 Annualized Project Cost of Each Option Basic Downstream
Item Unit 3 hrs 3 hrs 3 hrs 3 hrs Pumped Storage
3 units 2 units 3 units 2 units 3 units 2 units1) Additional capacity MW 213 140 219 143 198 1282) Installed capacity including existing
units of 210 MW MW 423 350 429 353 408 338
3) Dependable capacity MW 359 336 361 333 396 3104) Annual Energy GWh 651 651 652 652 729 711 Firm Energy* GWh 452 381 449 378 445 343 Secondary Energy** GWh 198 271 203 275 284 3685) Total Construction cost Mill. US$ 172.1 134.7 213.3 166.9 336.3 264.1 Construction cost: civil works Mill. US$ 56.8 41.5 90.0 66.3 150.1 118.0 Equipment & Transmission Line Mill. US$ 82.5 67.0 82.5 67.9 123.4 95.7 Construction cost: others Mill. US$ 32.8 26.2 40.8 32.7 62.8 50.46) Construction period years 5 5 5.5 5.5 6 67) Economic life of hydropower years 50 50 50 50 50 508) Interest rate % 10.0 10.0 10.0 10.0 10.0 10.09) Capital recovery factor % 10.1 10.1 10.1 10.1 10.1 10.110) O&M rate for civil works % 0.50 0.50 0.50 0.50 0.50 0.5011) O&M rate for Equipment &
Transmission Line % 1.50 1.50 1.50 1.50 1.50 1.50
12) Annual O&M Cost Mill. US$/year 1.5 1.2 1.7 1.4 2.6 2.013) Interest during construction(IDC) Mill. US$ 34.4 26.9 46.9 36.7 80.7 63.414) Annualized cost: Construction, IDC
and O&M: [ 5) + 13) ] × 9) + 12)
Mill. US$/year 22.3 17.5 27.9 21.9 44.7 35.1
15) Cost of reduction of energy during construction
Mill. US$ - - 5.8 5.8 28.0 28.0
16) Annualized Cost of 15) Mill. US$/year - - 0.6 0.6 2.8 2.817) Pump-up cost (using coal kWh value) Mill. US$/year - - - - 5.8 3.7Annualized cost: 14) + 16) + 17) Mill. US$/year 22.3 17.6 28.5 22.5 53.1 41.5Note: * “Firm energy” means the total of power generated during 3-hour peak duration.
** “Secondary energy” means the total of power generated in duration except 3-hour peak time.
As shown in Table 6.1.10-7, annualized cost of the pumped storage option is higher than the other options. The annualized cost of the basic option is lower than that of other options for 2-unit and 3-unit options.
(4) Benefit
As described in the previous section, economic benefit is composed of capacity and energy benefits using alternative gas turbine and coal-fired power plant. The benefit of firm energy and secondary energy is corresponding to kWh value of gas turbine and coal-fired thermal power plant, respectively.
In the B/C analysis, the benefits of the expansion are calculated as the difference between those of the existing power plant as “without expansion”, and those of the existing and expansion of each
Feasibility Study for Expansion of Victoria Hydropower Station
Final Report 6-40
alternative option as “with expansion”. The benefit is an increment of benefit accrued from “with expansion” case. Thus the difference between “with expansion” case and “without expansion” case is the benefit of the option.
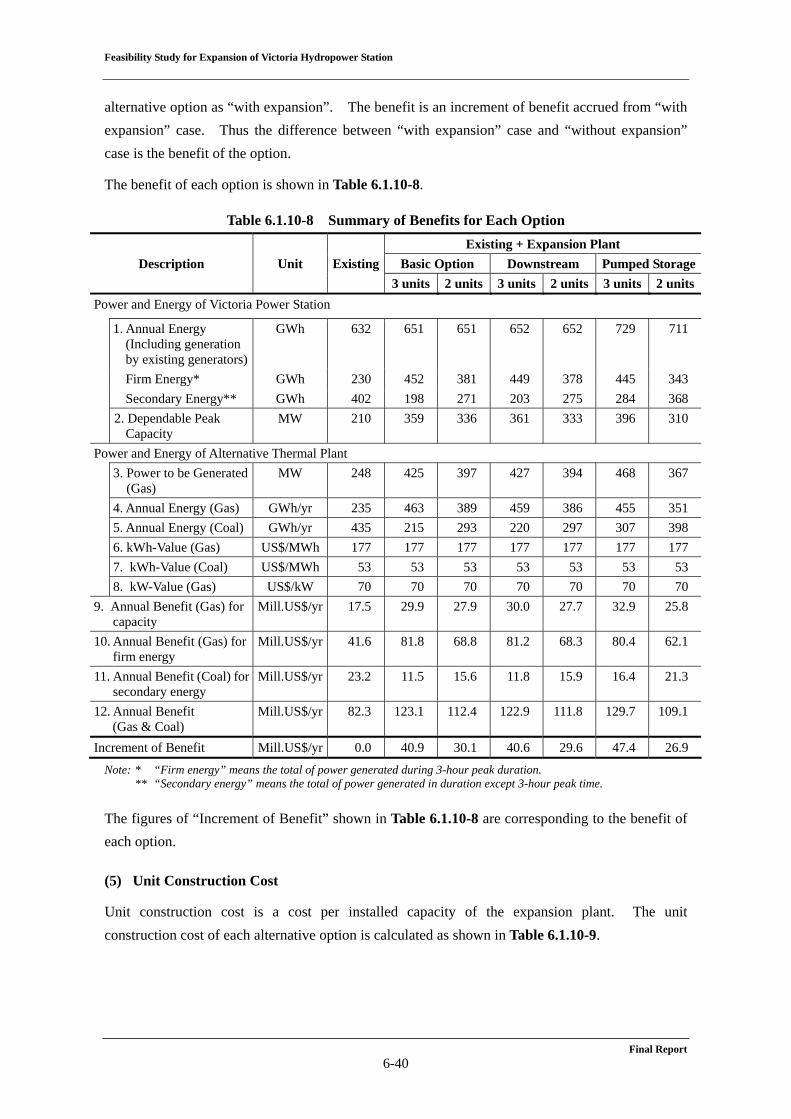
The benefit of each option is shown in Table 6.1.10-8.
Table 6.1.10-8 Summary of Benefits for Each Option Existing + Expansion Plant
Description Unit Existing Basic Option Downstream Pumped Storage 3 units 2 units 3 units 2 units 3 units 2 units
Power and Energy of Victoria Power Station
1. Annual Energy (Including generation by existing generators)
GWh 632 651 651 652 652 729 711
Firm Energy* GWh 230 452 381 449 378 445 343 Secondary Energy** GWh 402 198 271 203 275 284 368
2. Dependable Peak Capacity
MW 210 359 336 361 333 396 310
Power and Energy of Alternative Thermal Plant 3. Power to be Generated
(Gas) MW 248 425 397 427 394 468 367
4. Annual Energy (Gas) GWh/yr 235 463 389 459 386 455 351 5. Annual Energy (Coal) GWh/yr 435 215 293 220 297 307 398 6. kWh-Value (Gas) US$/MWh 177 177 177 177 177 177 177 7. kWh-Value (Coal) US$/MWh 53 53 53 53 53 53 53 8. kW-Value (Gas) US$/kW 70 70 70 70 70 70 70 9. Annual Benefit (Gas) for
capacity Mill.US$/yr 17.5 29.9 27.9 30.0 27.7 32.9 25.8
10. Annual Benefit (Gas) for firm energy
Mill.US$/yr 41.6 81.8 68.8 81.2 68.3 80.4 62.1
11. Annual Benefit (Coal) for secondary energy
Mill.US$/yr 23.2 11.5 15.6 11.8 15.9 16.4 21.3
12. Annual Benefit (Gas & Coal)
Mill.US$/yr 82.3 123.1 112.4 122.9 111.8 129.7 109.1
Increment of Benefit Mill.US$/yr 0.0 40.9 30.1 40.6 29.6 47.4 26.9 Note: * “Firm energy” means the total of power generated during 3-hour peak duration.
** “Secondary energy” means the total of power generated in duration except 3-hour peak time.
The figures of “Increment of Benefit” shown in Table 6.1.10-8 are corresponding to the benefit of each option.
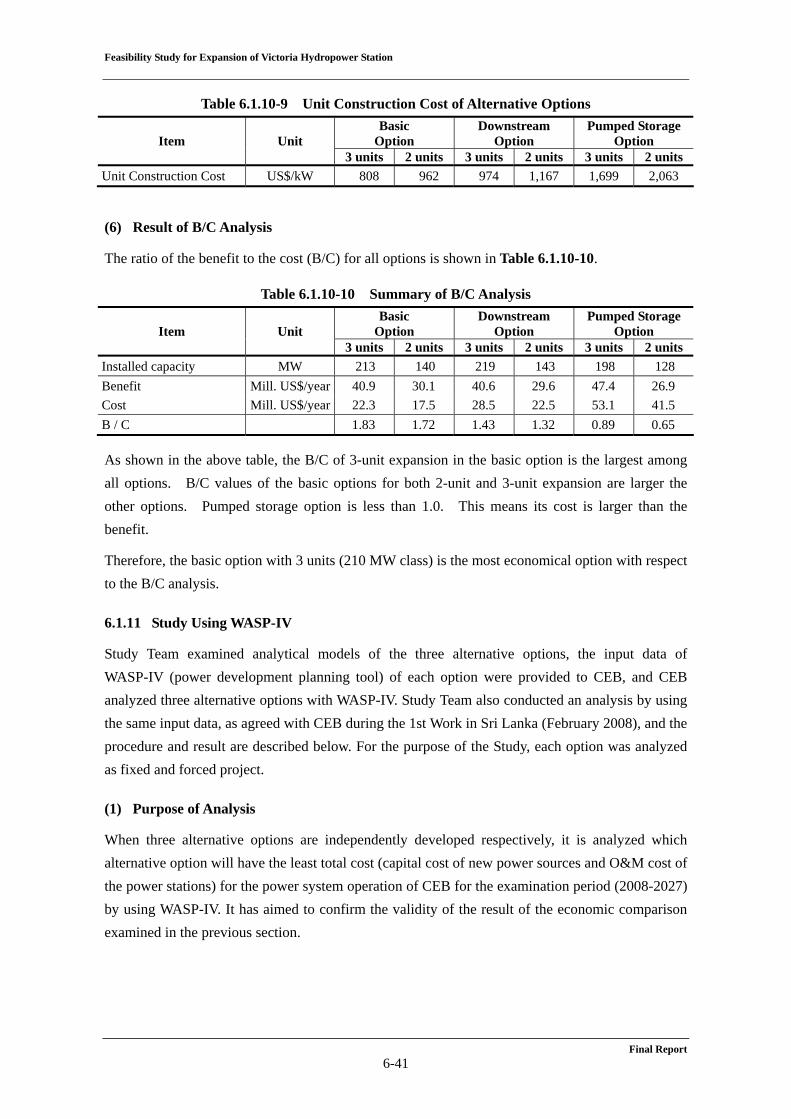
(5) Unit Construction Cost
Unit construction cost is a cost per installed capacity of the expansion plant. The unit construction cost of each alternative option is calculated as shown in Table 6.1.10-9.
Feasibility Study for Expansion of Victoria Hydropower Station
Final Report 6-41
Table 6.1.10-9 Unit Construction Cost of Alternative Options
Item Unit Basic
Option Downstream
Option Pumped Storage
Option 3 units 2 units 3 units 2 units 3 units 2 units
Unit Construction Cost US$/kW 808 962 974 1,167 1,699 2,063
(6) Result of B/C Analysis
The ratio of the benefit to the cost (B/C) for all options is shown in Table 6.1.10-10.
Table 6.1.10-10 Summary of B/C Analysis
Item Unit Basic
Option Downstream
Option Pumped Storage
Option 3 units 2 units 3 units 2 units 3 units 2 units
Installed capacity MW 213 140 219 143 198 128 Benefit Mill. US$/year 40.9 30.1 40.6 29.6 47.4 26.9 Cost Mill. US$/year 22.3 17.5 28.5 22.5 53.1 41.5 B / C 1.83 1.72 1.43 1.32 0.89 0.65 As shown in the above table, the B/C of 3-unit expansion in the basic option is the largest among all options. B/C values of the basic options for both 2-unit and 3-unit expansion are larger the other options. Pumped storage option is less than 1.0. This means its cost is larger than the benefit.
Therefore, the basic option with 3 units (210 MW class) is the most economical option with respect to the B/C analysis.
6.1.11 Study Using WASP-IV
Study Team examined analytical models of the three alternative options, the input data of WASP-IV (power development planning tool) of each option were provided to CEB, and CEB analyzed three alternative options with WASP-IV. Study Team also conducted an analysis by using the same input data, as agreed with CEB during the 1st Work in Sri Lanka (February 2008), and the procedure and result are described below. For the purpose of the Study, each option was analyzed as fixed and forced project.
(1) Purpose of Analysis
When three alternative options are independently developed respectively, it is analyzed which alternative option will have the least total cost (capital cost of new power sources and O&M cost of the power stations) for the power system operation of CEB for the examination period (2008-2027) by using WASP-IV. It has aimed to confirm the validity of the result of the economic comparison examined in the previous section.
Feasibility Study for Expansion of Victoria Hydropower Station
Final Report 6-42
(2) Examination of Analysis Model of Alternative Options
Study Team determined the WASP-IV analytical model of each alternative option, considering that the expansion of the hydropower station was analyzed and that there are limitations for the input data for WASP-IV, as follows.
1) Basic Option
- In WASP-IV, the expansion plan was defined as a candidate power plant because the capacity was not revocable during the examination period.
- Capacity of the reservoir was included in the existing hydropower station because the capacity of the Victoria reservoir did not change after expansion. The capacity of reservoir of expansion was set to be 0.
- Because an increase in the annual energy after expansion was a little, it was assumed that periodical power supply (Inflow Energy, Minimum Generation, Average Capacity) for the expansion was set to be 0.
2) Downstream Option
The model for downstream option was to be the same as above-mentioned in 1).
3) Pumped Storage Option
- The pumped storage power station was defined as a development candidate.
- After expansion of pumped storage power station, the operation of the existing hydropower station was assumed to be just like the current state.
- The maximum feasible energy of pumped storage station was estimated as 3 hours a day (for about 1,000 hours a year) according to the peak time duration of the demand in Sri Lanka.
(3) Provision of Input Data for WASP-IV to CEB for Each Alternative Option
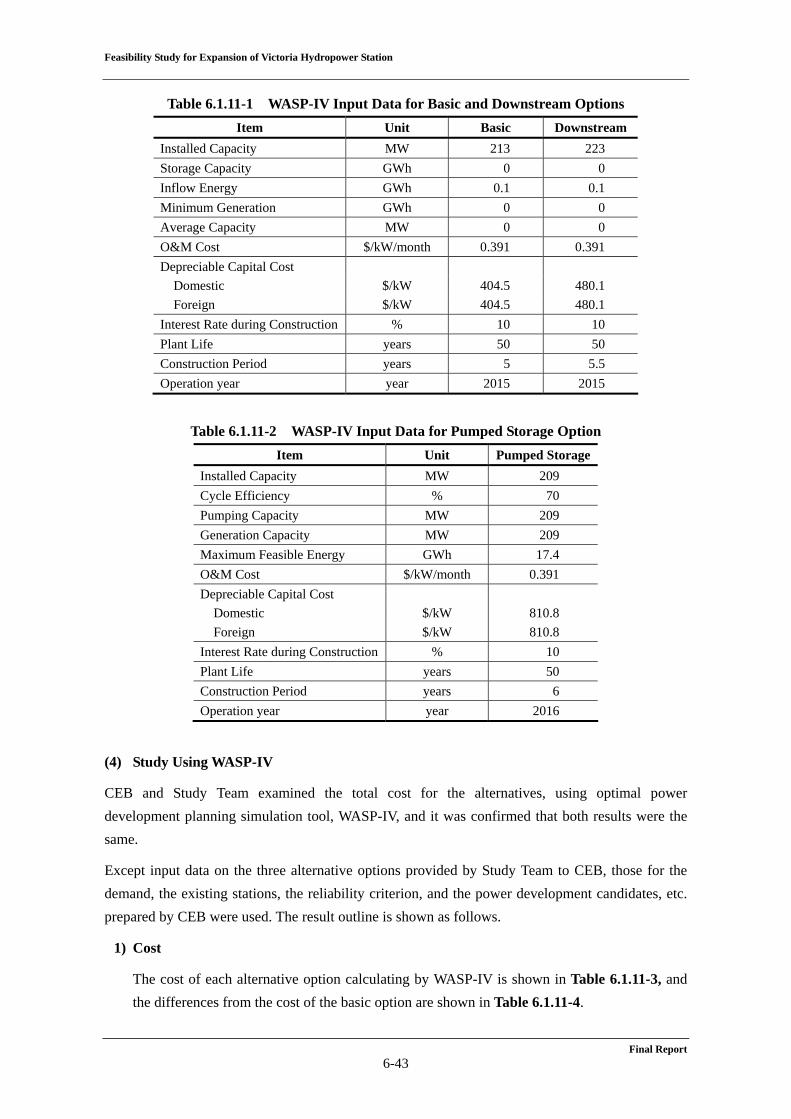
2-unit option and 3-unit of the generator were examined in the economic comparisons of the alternative options. As a result, in the examination of WASP-IV, 3-unit option was selected as expansion candidate power station in each alternative option, because 3-unit option had larger B/C than that of 2-unit option in economic comparison. The input data of WASP-IV provided to CEB are shown in Table 6.1.11-1 and Table 6.1.11-2.
The construction cost of the downstream option is set to be higher than that of the basic option, because it includes cost for longer waterway.
The construction cost of the pumped storage option is set to be higher than that of the other two options because the waterway is longer than the downstream option.
The commissioning year of the pumped storage option is set in 2016 in consideration of the construction period (six years).
Inflow energy of the basic option and the downstream option is set to be 0.1 in an actual analysis, because the error occurs when 0 values are input in WASP-IV.
Feasibility Study for Expansion of Victoria Hydropower Station
Final Report 6-43
Table 6.1.11-1 WASP-IV Input Data for Basic and Downstream Options Item Unit Basic Downstream
Installed Capacity MW 213 223 Storage Capacity GWh 0 0 Inflow Energy GWh 0.1 0.1 Minimum Generation GWh 0 0 Average Capacity MW 0 0 O&M Cost $/kW/month 0.391 0.391 Depreciable Capital Cost Domestic $/kW 404.5 480.1 Foreign $/kW 404.5 480.1 Interest Rate during Construction % 10 10 Plant Life years 50 50 Construction Period years 5 5.5 Operation year year 2015 2015
Table 6.1.11-2 WASP-IV Input Data for Pumped Storage Option Item Unit Pumped Storage
Installed Capacity MW 209 Cycle Efficiency % 70 Pumping Capacity MW 209 Generation Capacity MW 209 Maximum Feasible Energy GWh 17.4 O&M Cost $/kW/month 0.391 Depreciable Capital Cost Domestic $/kW 810.8 Foreign $/kW 810.8 Interest Rate during Construction % 10 Plant Life years 50 Construction Period years 6 Operation year year 2016
(4) Study Using WASP-IV
CEB and Study Team examined the total cost for the alternatives, using optimal power development planning simulation tool, WASP-IV, and it was confirmed that both results were the same.
Except input data on the three alternative options provided by Study Team to CEB, those for the demand, the existing stations, the reliability criterion, and the power development candidates, etc. prepared by CEB were used. The result outline is shown as follows.
1) Cost
The cost of each alternative option calculating by WASP-IV is shown in Table 6.1.11-3, and the differences from the cost of the basic option are shown in Table 6.1.11-4.
Feasibility Study for Expansion of Victoria Hydropower Station
Final Report 6-44
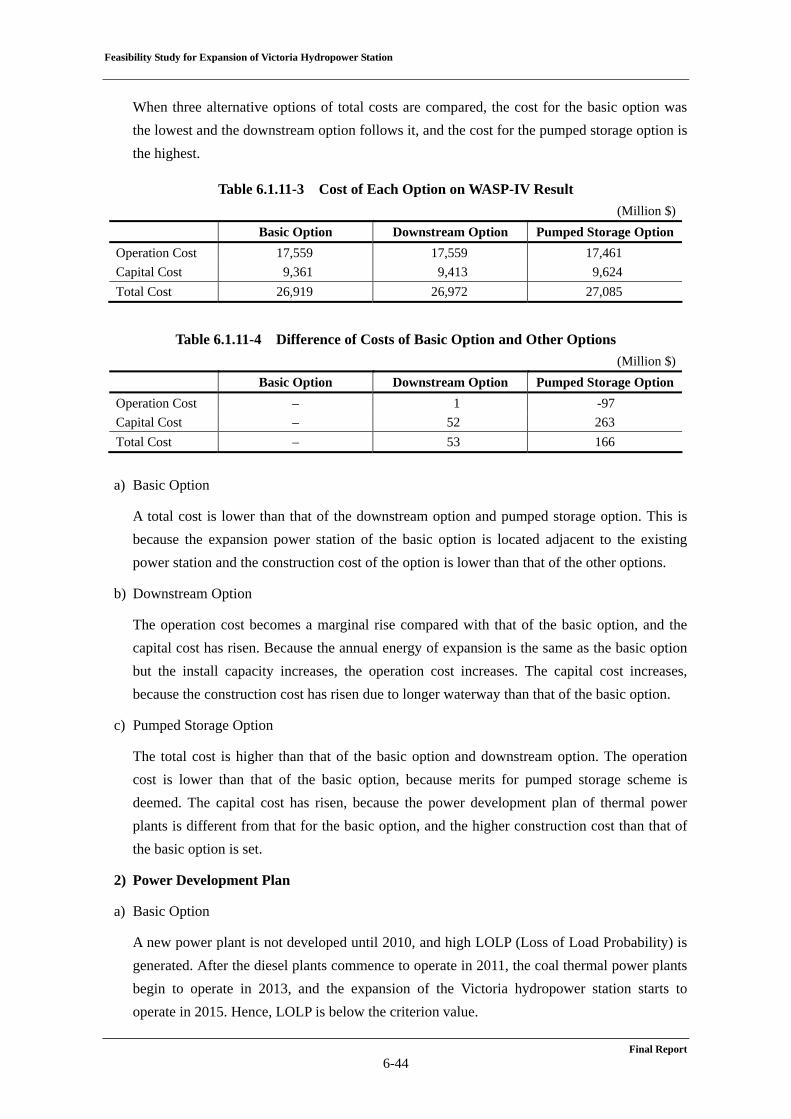
When three alternative options of total costs are compared, the cost for the basic option was the lowest and the downstream option follows it, and the cost for the pumped storage option is the highest.
Table 6.1.11-3 Cost of Each Option on WASP-IV Result (Million $)
Basic Option Downstream Option Pumped Storage OptionOperation Cost 17,559 17,559 17,461 Capital Cost 9,361 9,413 9,624 Total Cost 26,919 26,972 27,085
Table 6.1.11-4 Difference of Costs of Basic Option and Other Options (Million $)
Basic Option Downstream Option Pumped Storage OptionOperation Cost – 1 -97 Capital Cost – 52 263 Total Cost – 53 166
a) Basic Option
A total cost is lower than that of the downstream option and pumped storage option. This is because the expansion power station of the basic option is located adjacent to the existing power station and the construction cost of the option is lower than that of the other options.
b) Downstream Option
The operation cost becomes a marginal rise compared with that of the basic option, and the capital cost has risen. Because the annual energy of expansion is the same as the basic option but the install capacity increases, the operation cost increases. The capital cost increases, because the construction cost has risen due to longer waterway than that of the basic option.
c) Pumped Storage Option
The total cost is higher than that of the basic option and downstream option. The operation cost is lower than that of the basic option, because merits for pumped storage scheme is deemed. The capital cost has risen, because the power development plan of thermal power plants is different from that for the basic option, and the higher construction cost than that of the basic option is set.
2) Power Development Plan
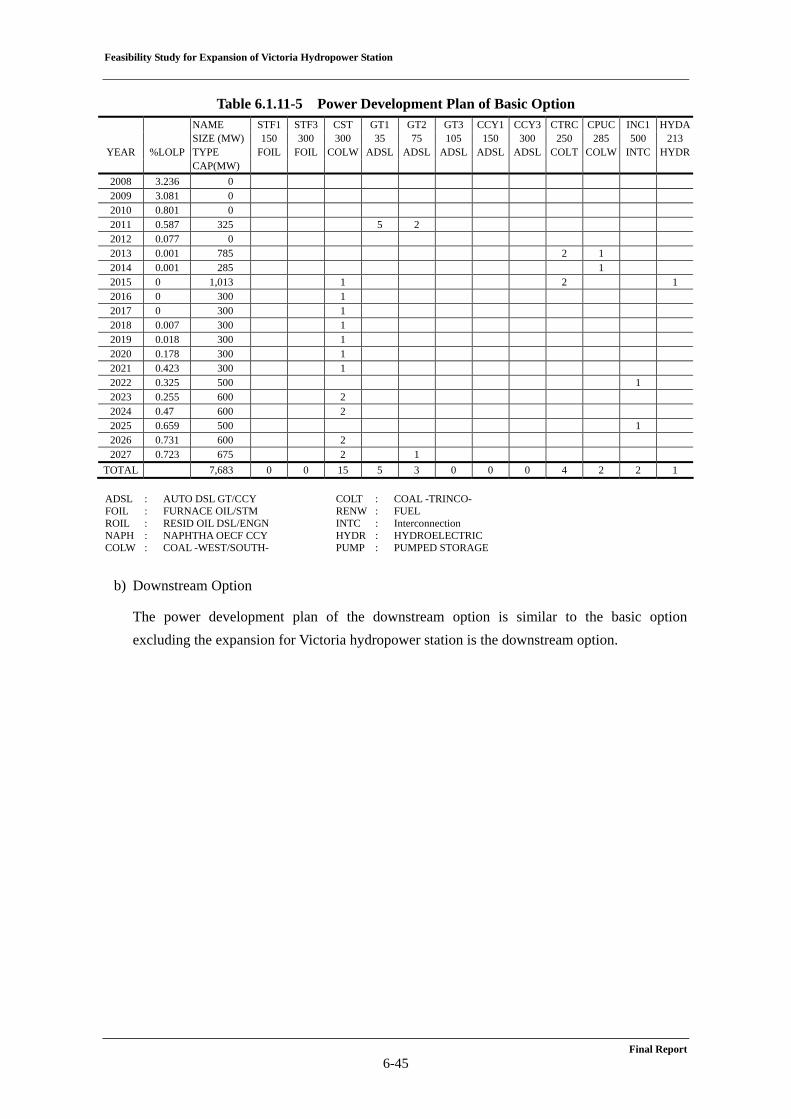
a) Basic Option
A new power plant is not developed until 2010, and high LOLP (Loss of Load Probability) is generated. After the diesel plants commence to operate in 2011, the coal thermal power plants begin to operate in 2013, and the expansion of the Victoria hydropower station starts to operate in 2015. Hence, LOLP is below the criterion value.
Feasibility Study for Expansion of Victoria Hydropower Station
Final Report 6-45
Table 6.1.11-5 Power Development Plan of Basic Option NAME STF1 STF3 CST GT1 GT2 GT3 CCY1 CCY3 CTRC CPUC INC1 HYDA SIZE (MW) 150 300 300 35 75 105 150 300 250 285 500 213
YEAR %LOLP TYPE FOIL FOIL COLW ADSL ADSL ADSL ADSL ADSL COLT COLW INTC HYDR CAP(MW)
2008 3.236 0 2009 3.081 0 2010 0.801 0 2011 0.587 325 5 2 2012 0.077 0 2013 0.001 785 2 1 2014 0.001 285 1 2015 0 1,013 1 2 1 2016 0 300 1 2017 0 300 1 2018 0.007 300 1 2019 0.018 300 1 2020 0.178 300 1 2021 0.423 300 1 2022 0.325 500 1 2023 0.255 600 2 2024 0.47 600 2 2025 0.659 500 1 2026 0.731 600 2 2027 0.723 675 2 1
TOTAL 7,683 0 0 15 5 3 0 0 0 4 2 2 1 ADSL : AUTO DSL GT/CCY FOIL : FURNACE OIL/STM ROIL : RESID OIL DSL/ENGN NAPH : NAPHTHA OECF CCY COLW : COAL -WEST/SOUTH-
COLT : COAL -TRINCO- RENW : FUEL INTC : Interconnection HYDR : HYDROELECTRIC PUMP : PUMPED STORAGE
b) Downstream Option
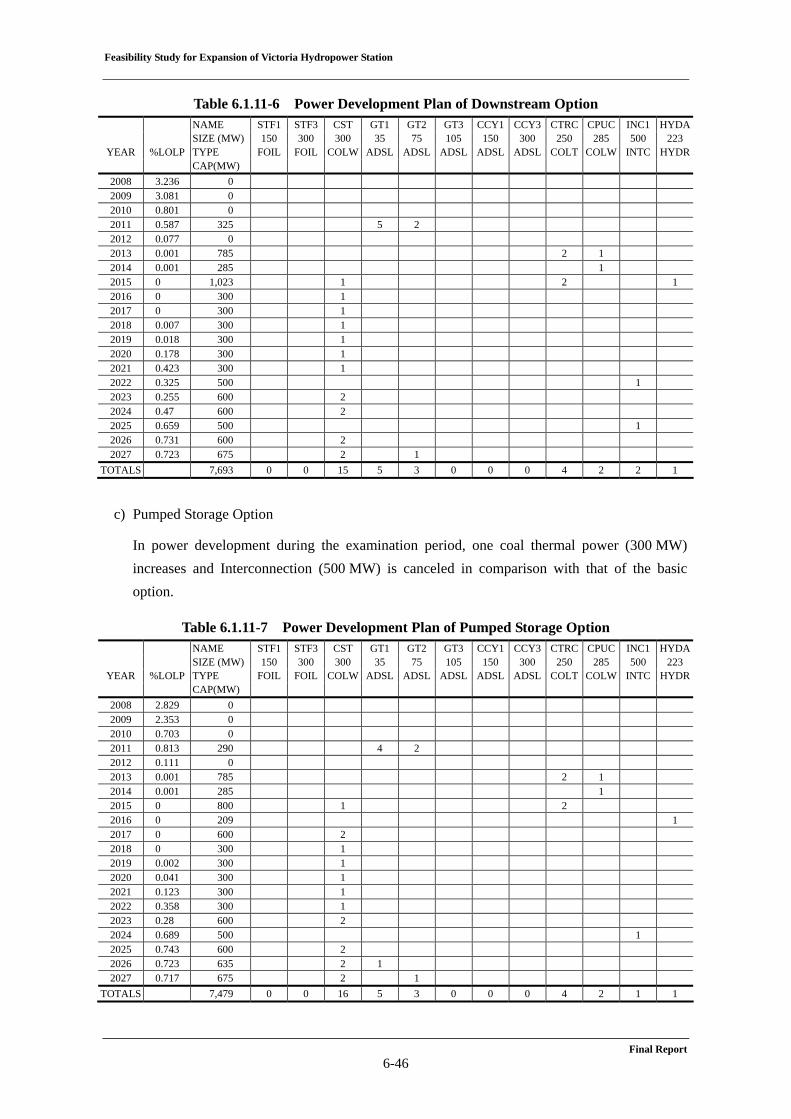
The power development plan of the downstream option is similar to the basic option excluding the expansion for Victoria hydropower station is the downstream option.
Feasibility Study for Expansion of Victoria Hydropower Station
Final Report 6-46
Table 6.1.11-6 Power Development Plan of Downstream Option NAME STF1 STF3 CST GT1 GT2 GT3 CCY1 CCY3 CTRC CPUC INC1 HYDA SIZE (MW) 150 300 300 35 75 105 150 300 250 285 500 223
YEAR %LOLP TYPE FOIL FOIL COLW ADSL ADSL ADSL ADSL ADSL COLT COLW INTC HYDR CAP(MW)
2008 3.236 0 2009 3.081 0 2010 0.801 0 2011 0.587 325 5 2 2012 0.077 0 2013 0.001 785 2 1 2014 0.001 285 1 2015 0 1,023 1 2 1 2016 0 300 1 2017 0 300 1 2018 0.007 300 1 2019 0.018 300 1 2020 0.178 300 1 2021 0.423 300 1 2022 0.325 500 1 2023 0.255 600 2 2024 0.47 600 2 2025 0.659 500 1 2026 0.731 600 2 2027 0.723 675 2 1
TOTALS 7,693 0 0 15 5 3 0 0 0 4 2 2 1
c) Pumped Storage Option
In power development during the examination period, one coal thermal power (300 MW) increases and Interconnection (500 MW) is canceled in comparison with that of the basic option.
Table 6.1.11-7 Power Development Plan of Pumped Storage Option NAME STF1 STF3 CST GT1 GT2 GT3 CCY1 CCY3 CTRC CPUC INC1 HYDA SIZE (MW) 150 300 300 35 75 105 150 300 250 285 500 223
YEAR %LOLP TYPE FOIL FOIL COLW ADSL ADSL ADSL ADSL ADSL COLT COLW INTC HYDR CAP(MW)
2008 2.829 0 2009 2.353 0 2010 0.703 0 2011 0.813 290 4 2 2012 0.111 0 2013 0.001 785 2 1 2014 0.001 285 1 2015 0 800 1 2 2016 0 209 1 2017 0 600 2 2018 0 300 1 2019 0.002 300 1 2020 0.041 300 1 2021 0.123 300 1 2022 0.358 300 1 2023 0.28 600 2 2024 0.689 500 1 2025 0.743 600 2 2026 0.723 635 2 1 2027 0.717 675 2 1
TOTALS 7,479 0 0 16 5 3 0 0 0 4 2 1 1
Feasibility Study for Expansion of Victoria Hydropower Station
Final Report 6-47
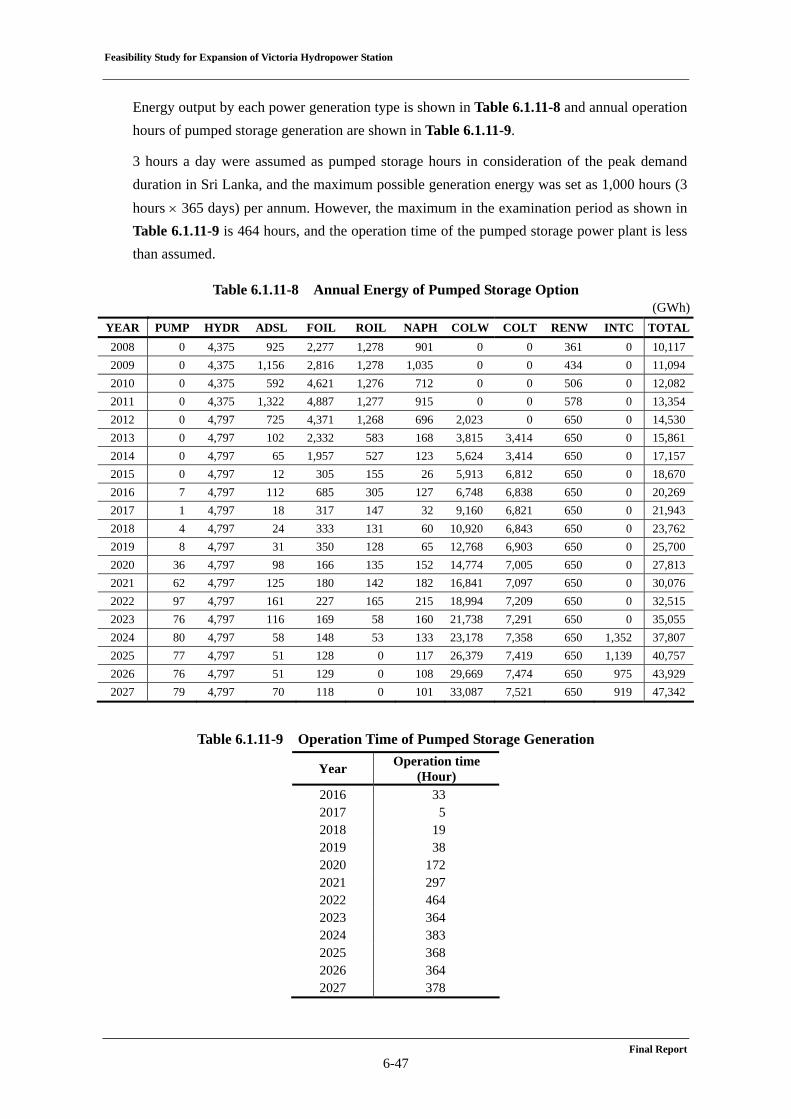
Energy output by each power generation type is shown in Table 6.1.11-8 and annual operation hours of pumped storage generation are shown in Table 6.1.11-9.
3 hours a day were assumed as pumped storage hours in consideration of the peak demand duration in Sri Lanka, and the maximum possible generation energy was set as 1,000 hours (3 hours × 365 days) per annum. However, the maximum in the examination period as shown in Table 6.1.11-9 is 464 hours, and the operation time of the pumped storage power plant is less than assumed.
Table 6.1.11-8 Annual Energy of Pumped Storage Option (GWh)YEAR PUMP HYDR ADSL FOIL ROIL NAPH COLW COLT RENW INTC TOTAL2008 0 4,375 925 2,277 1,278 901 0 0 361 0 10,1172009 0 4,375 1,156 2,816 1,278 1,035 0 0 434 0 11,0942010 0 4,375 592 4,621 1,276 712 0 0 506 0 12,0822011 0 4,375 1,322 4,887 1,277 915 0 0 578 0 13,3542012 0 4,797 725 4,371 1,268 696 2,023 0 650 0 14,5302013 0 4,797 102 2,332 583 168 3,815 3,414 650 0 15,8612014 0 4,797 65 1,957 527 123 5,624 3,414 650 0 17,1572015 0 4,797 12 305 155 26 5,913 6,812 650 0 18,6702016 7 4,797 112 685 305 127 6,748 6,838 650 0 20,2692017 1 4,797 18 317 147 32 9,160 6,821 650 0 21,9432018 4 4,797 24 333 131 60 10,920 6,843 650 0 23,7622019 8 4,797 31 350 128 65 12,768 6,903 650 0 25,7002020 36 4,797 98 166 135 152 14,774 7,005 650 0 27,8132021 62 4,797 125 180 142 182 16,841 7,097 650 0 30,0762022 97 4,797 161 227 165 215 18,994 7,209 650 0 32,5152023 76 4,797 116 169 58 160 21,738 7,291 650 0 35,0552024 80 4,797 58 148 53 133 23,178 7,358 650 1,352 37,8072025 77 4,797 51 128 0 117 26,379 7,419 650 1,139 40,7572026 76 4,797 51 129 0 108 29,669 7,474 650 975 43,9292027 79 4,797 70 118 0 101 33,087 7,521 650 919 47,342
Table 6.1.11-9 Operation Time of Pumped Storage Generation
Year Operation time (Hour)
2016 33 2017 5 2018 19 2019 38 2020 172 2021 297 2022 464 2023 364 2024 383 2025 368 2026 364 2027 378
Feasibility Study for Expansion of Victoria Hydropower Station
Final Report 6-48
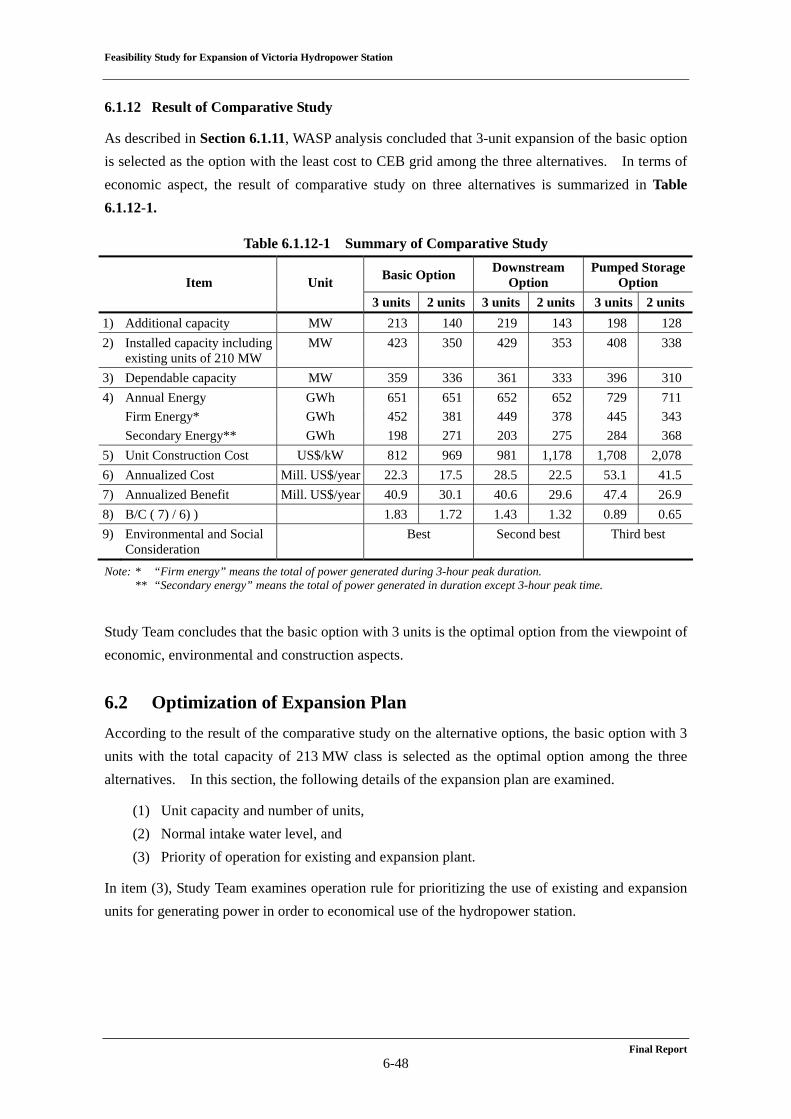
6.1.12 Result of Comparative Study
As described in Section 6.1.11, WASP analysis concluded that 3-unit expansion of the basic option is selected as the option with the least cost to CEB grid among the three alternatives. In terms of economic aspect, the result of comparative study on three alternatives is summarized in Table 6.1.12-1.
Table 6.1.12-1 Summary of Comparative Study
Item Unit Basic Option Downstream Option
Pumped Storage Option
3 units 2 units 3 units 2 units 3 units 2 units 1) Additional capacity MW 213 140 219 143 198 1282) Installed capacity including
existing units of 210 MW MW 423 350 429 353 408 338
3) Dependable capacity MW 359 336 361 333 396 3104) Annual Energy GWh 651 651 652 652 729 711 Firm Energy* GWh 452 381 449 378 445 343 Secondary Energy** GWh 198 271 203 275 284 3685) Unit Construction Cost US$/kW 812 969 981 1,178 1,708 2,0786) Annualized Cost Mill. US$/year 22.3 17.5 28.5 22.5 53.1 41.57) Annualized Benefit Mill. US$/year 40.9 30.1 40.6 29.6 47.4 26.98) B/C ( 7) / 6) ) 1.83 1.72 1.43 1.32 0.89 0.659) Environmental and Social
Consideration Best Second best Third best
Note: * “Firm energy” means the total of power generated during 3-hour peak duration. ** “Secondary energy” means the total of power generated in duration except 3-hour peak time.
Study Team concludes that the basic option with 3 units is the optimal option from the viewpoint of economic, environmental and construction aspects.
6.2 Optimization of Expansion Plan According to the result of the comparative study on the alternative options, the basic option with 3 units with the total capacity of 213 MW class is selected as the optimal option among the three alternatives. In this section, the following details of the expansion plan are examined.
(1) Unit capacity and number of units, (2) Normal intake water level, and (3) Priority of operation for existing and expansion plant.
In item (3), Study Team examines operation rule for prioritizing the use of existing and expansion units for generating power in order to economical use of the hydropower station.
Feasibility Study for Expansion of Victoria Hydropower Station
Final Report 6-49
6.2.1 Number of Units and Unit Capacity
In the comparative study on the alternative options, the unit capacity was tentatively fixed to 70 MW. In the Study, the optimum number of unit is studied by fixing the total capacity to 210 MW class. The number of units and unit capacity examined in the Study is as follows.
(1) 70 MW class × 3 units (2) 105 MW class × 2 units (3) 210 MW class × 1 unit
In general, the following factors are considered for the examination of the number of unit:
(1) System Frequency Deviation under Loss of the Unit (2) Maintenance Activities (3) Constraint of Transportation for Heavy Equipment Parts (4) Economic Validity
(1) System Frequency Deviation under Loss of the Unit
JICA Report “Master Plan Study on the Development of Power Generation and Transmission System in Sri Lanka” in 2006 shows the study of frequency deviation under loss of the largest generation unit. The study of the Victoria Expansion was carried out by the same methodology.
The Power System of Sri Lanka has the Load Shedding Scheme, and the Scheme is operated automatically when system frequency becomes less than 48.75 Hz. Therefore, the unit capacity of the Victoria Expansion was studied in order that the frequency deviation of the Unit-Trip would be within 1.25 Hz.
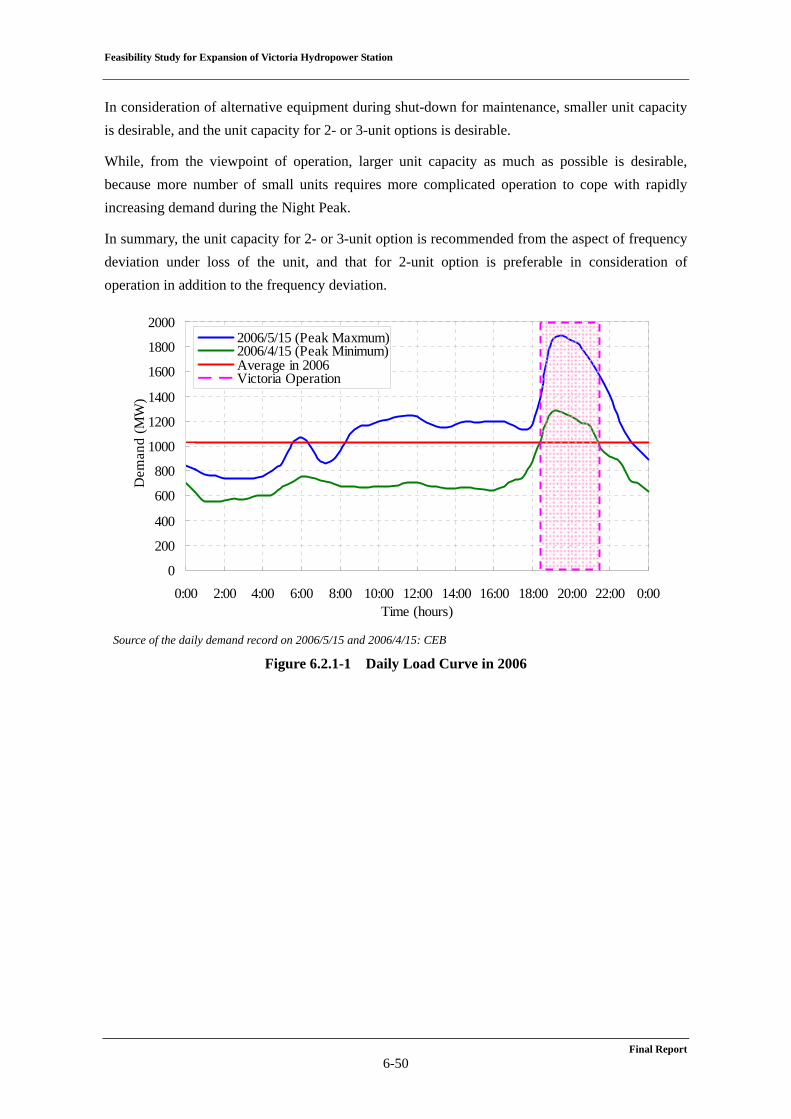
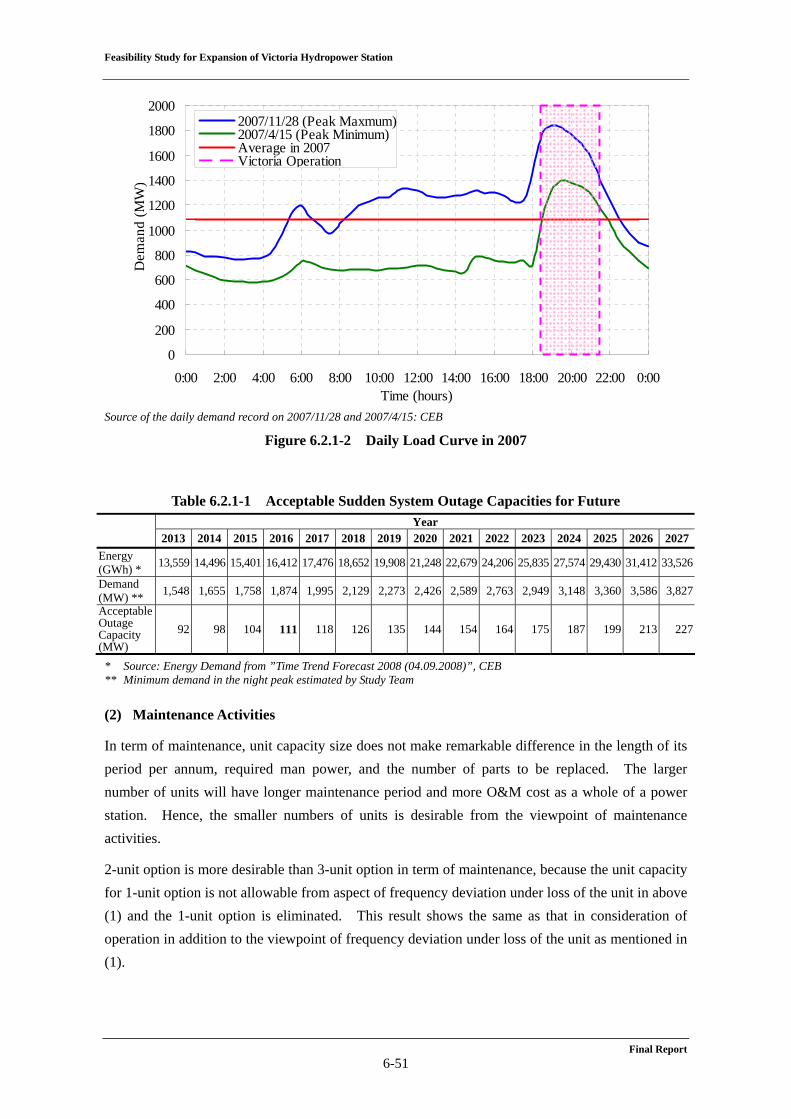
The Study should be carried out for the Night Peak Time when the Victoria Hydropower Station will be expected to be operated as peak power sources after expansion. Because smaller demand causes larger frequency deviation, the Study should be carried out for the minimum demand in the Night Peak Time. The actual demands in 2006 and 2007, Figure 6.2.1-1 and Figure 6.2.1-2, show that the minimum demands in the Night Peak are almost equal to the average demand in the year. The annual demands in future were calculated by the annual energy demands which were estimated by CEB in “Time Trend Forecast 2008 (04.09.2008)” described in 4.1.4 of Chapter 4. Also in order to calculate the frequency deviation, 4.75% MW/Hz of the System Frequency Characteristic Constant shown in the JICA Report in 2006 was adopted in the Study. This constant indicates 1.0 Hz of frequency deviation for changing 4.75% of demand or generation in MW.
Table 6.2.1-1 shows the results of the study of allowable unit capacity loss at the Night Peak, and 100 MW Class of the unit capacity will be nearly acceptable maximum for the Night Peak in 2016. On the other hand, 210 MW Class of the unit capacity will not be acceptable in 2016 due to possibility to cause large frequency deviation and be acceptable after 2026.
Consequently, the unit capacity for 1-unit option is not allowable, and that for 2- or 3-unit options is desirable for the expansion units.
Feasibility Study for Expansion of Victoria Hydropower Station
Final Report 6-50
In consideration of alternative equipment during shut-down for maintenance, smaller unit capacity is desirable, and the unit capacity for 2- or 3-unit options is desirable.
While, from the viewpoint of operation, larger unit capacity as much as possible is desirable, because more number of small units requires more complicated operation to cope with rapidly increasing demand during the Night Peak.
In summary, the unit capacity for 2- or 3-unit option is recommended from the aspect of frequency deviation under loss of the unit, and that for 2-unit option is preferable in consideration of operation in addition to the frequency deviation.
0
200
400
600
800
1000
1200
1400
1600
1800
2000
0:00 2:00 4:00 6:00 8:00 10:00 12:00 14:00 16:00 18:00 20:00 22:00 0:00Time (hours)
Dem
and
(MW
)
2006/5/15 (Peak Maxmum)2006/4/15 (Peak Minimum)Average in 2006Victoria Operation
Source of the daily demand record on 2006/5/15 and 2006/4/15: CEB
Figure 6.2.1-1 Daily Load Curve in 2006
Feasibility Study for Expansion of Victoria Hydropower Station
Final Report 6-51
0
200
400
600
800
1000
1200
1400
1600
1800
2000
0:00 2:00 4:00 6:00 8:00 10:00 12:00 14:00 16:00 18:00 20:00 22:00 0:00Time (hours)
Dem
and
(MW
)2007/11/28 (Peak Maxmum)2007/4/15 (Peak Minimum)Average in 2007Victoria Operation
Source of the daily demand record on 2007/11/28 and 2007/4/15: CEB
Figure 6.2.1-2 Daily Load Curve in 2007
Table 6.2.1-1 Acceptable Sudden System Outage Capacities for Future Year 2013 2014 2015 2016 2017 2018 2019 2020 2021 2022 2023 2024 2025 2026 2027
Energy (GWh) * 13,559 14,496 15,401 16,412 17,476 18,652 19,908 21,248 22,679 24,206 25,835 27,574 29,430 31,412 33,526
Demand (MW) ** 1,548 1,655 1,758 1,874 1,995 2,129 2,273 2,426 2,589 2,763 2,949 3,148 3,360 3,586 3,827
Acceptable Outage Capacity (MW)
92 98 104 111 118 126 135 144 154 164 175 187 199 213 227
* Source: Energy Demand from ”Time Trend Forecast 2008 (04.09.2008)”, CEB ** Minimum demand in the night peak estimated by Study Team
(2) Maintenance Activities
In term of maintenance, unit capacity size does not make remarkable difference in the length of its period per annum, required man power, and the number of parts to be replaced. The larger number of units will have longer maintenance period and more O&M cost as a whole of a power station. Hence, the smaller numbers of units is desirable from the viewpoint of maintenance activities.
2-unit option is more desirable than 3-unit option in term of maintenance, because the unit capacity for 1-unit option is not allowable from aspect of frequency deviation under loss of the unit in above (1) and the 1-unit option is eliminated. This result shows the same as that in consideration of operation in addition to the viewpoint of frequency deviation under loss of the unit as mentioned in (1).
Feasibility Study for Expansion of Victoria Hydropower Station
Final Report 6-52
(3) Constraint of Transportation for Heavy Equipment Parts
In this sub-section, Study Team examines whether or not heavy parts and large parts of generating equipment of each unit capacity option can be transported without any constraint from the Colombo port where generating equipment will be unloaded to the Victoria Hydropower Station. Transportation route is considered as the national highway (Category A) from the Colombo port via Kandy up to the entrance to existing access road to the Station and the existing access road to the Station.
There seems to be no constraint to transport parts for 3-unit option, because those for the existing equipment were transported during Stage I construction period.
The heaviest one is estimated as the main transformer with around 60 tons, and the largest one is considered as the runner with around 5 m in diameter for 1-unit option, while, those are 40 tons and around 3.5 m for 2-unit option.
Allowable loads against bridges on the transportation route should be considered, to haul heavy parts. Study Team asked Road Development Authority about constraints at transporting those. According to RDA, i) the contractor of the equipment should submit an application with weight of heavy parts and details of transportation vehicles when those with heavier than around 50 tons pass on Category A bridges, ii) RDA will check whether or not such loads are within allowable design loads of Category A bridges, and iii) RDA will give the applicant the transportation permission, when such loads is proved allowable. It was recorded that 68 ton main transformer was transported on Category A bridges during the construction of the Kukule Hydropower Station, according to information from CEB. Hence it is considered that the main transformer with 60 tons can be transported on Category A bridges. While, Category A road is 7.4 m wide with 2 lanes. Parts with 5 m in size can be transported on Category A roads, in the case that the contractor submits application to RDA. Therefore, there seems to be no constraint to transport heavy or large parts for 1-unit option.
Regarding the existing access road branching from the national highway to the Station, the minimum width is 4 m and radius of curves is around 12 m in minimum. It is considered that the access road should be constructed newly to transport the runner for 1-unit option and that the access road should be improved for 2-unit option. Those costs will be included into construction cost for each option in the examination of the economic validity mentioned in (4).
(4) Economic Validity
1) Study Scenario
The number of units and unit capacity is studied for the following cases.
a. 70 MW class × 3 units b. 105 MW class × 2 units c. 210 MW class × 1 unit
Feasibility Study for Expansion of Victoria Hydropower Station
Final Report 6-53
2) Comparison Method
Each option is compared by the benefit and cost analysis. The methodology of the comparison method for benefit and cost analysis is same as the method applied in the comparative study of alternative option which is described in Section 6.1.
3) Benefit
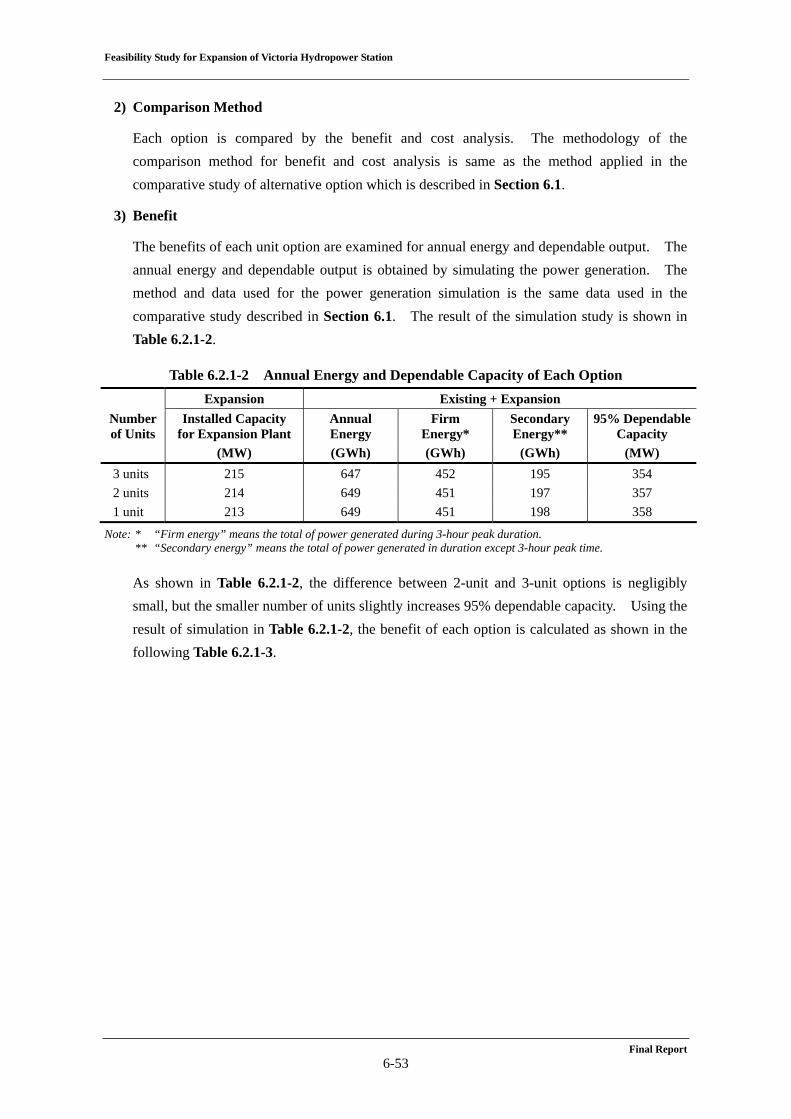
The benefits of each unit option are examined for annual energy and dependable output. The annual energy and dependable output is obtained by simulating the power generation. The method and data used for the power generation simulation is the same data used in the comparative study described in Section 6.1. The result of the simulation study is shown in Table 6.2.1-2.
Table 6.2.1-2 Annual Energy and Dependable Capacity of Each Option Expansion Existing + Expansion
Number of Units
Installed Capacity for Expansion Plant
Annual Energy
Firm Energy*
Secondary Energy**
95% Dependable Capacity
(MW) (GWh) (GWh) (GWh) (MW) 3 units 215 647 452 195 354 2 units 214 649 451 197 357 1 unit 213 649 451 198 358
Note: * “Firm energy” means the total of power generated during 3-hour peak duration. ** “Secondary energy” means the total of power generated in duration except 3-hour peak time.
As shown in Table 6.2.1-2, the difference between 2-unit and 3-unit options is negligibly small, but the smaller number of units slightly increases 95% dependable capacity. Using the result of simulation in Table 6.2.1-2, the benefit of each option is calculated as shown in the following Table 6.2.1-3.
Feasibility Study for Expansion of Victoria Hydropower Station
Final Report 6-54
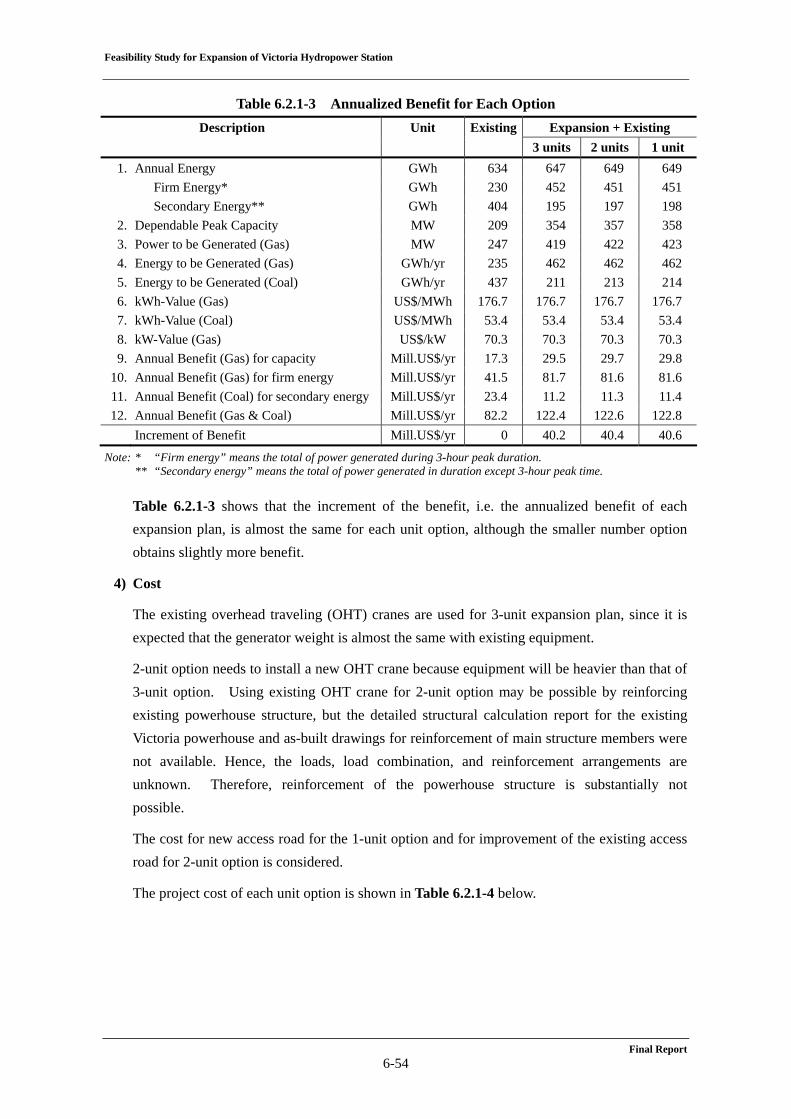
Table 6.2.1-3 Annualized Benefit for Each Option Description Unit Existing Expansion + Existing 3 units 2 units 1 unit 1. Annual Energy GWh 634 647 649 649
Firm Energy* GWh 230 452 451 451 Secondary Energy** GWh 404 195 197 198
2. Dependable Peak Capacity MW 209 354 357 358 3. Power to be Generated (Gas) MW 247 419 422 423 4. Energy to be Generated (Gas) GWh/yr 235 462 462 462 5. Energy to be Generated (Coal) GWh/yr 437 211 213 214 6. kWh-Value (Gas) US$/MWh 176.7 176.7 176.7 176.7 7. kWh-Value (Coal) US$/MWh 53.4 53.4 53.4 53.4 8. kW-Value (Gas) US$/kW 70.3 70.3 70.3 70.3 9. Annual Benefit (Gas) for capacity Mill.US$/yr 17.3 29.5 29.7 29.8
10. Annual Benefit (Gas) for firm energy Mill.US$/yr 41.5 81.7 81.6 81.6 11. Annual Benefit (Coal) for secondary energy Mill.US$/yr 23.4 11.2 11.3 11.4 12. Annual Benefit (Gas & Coal) Mill.US$/yr 82.2 122.4 122.6 122.8
Increment of Benefit Mill.US$/yr 0 40.2 40.4 40.6 Note: * “Firm energy” means the total of power generated during 3-hour peak duration.
** “Secondary energy” means the total of power generated in duration except 3-hour peak time.
Table 6.2.1-3 shows that the increment of the benefit, i.e. the annualized benefit of each expansion plan, is almost the same for each unit option, although the smaller number option obtains slightly more benefit.
4) Cost
The existing overhead traveling (OHT) cranes are used for 3-unit expansion plan, since it is expected that the generator weight is almost the same with existing equipment.
2-unit option needs to install a new OHT crane because equipment will be heavier than that of 3-unit option. Using existing OHT crane for 2-unit option may be possible by reinforcing existing powerhouse structure, but the detailed structural calculation report for the existing Victoria powerhouse and as-built drawings for reinforcement of main structure members were not available. Hence, the loads, load combination, and reinforcement arrangements are unknown. Therefore, reinforcement of the powerhouse structure is substantially not possible.
The cost for new access road for the 1-unit option and for improvement of the existing access road for 2-unit option is considered.
The project cost of each unit option is shown in Table 6.2.1-4 below.
Feasibility Study for Expansion of Victoria Hydropower Station
Final Report 6-55
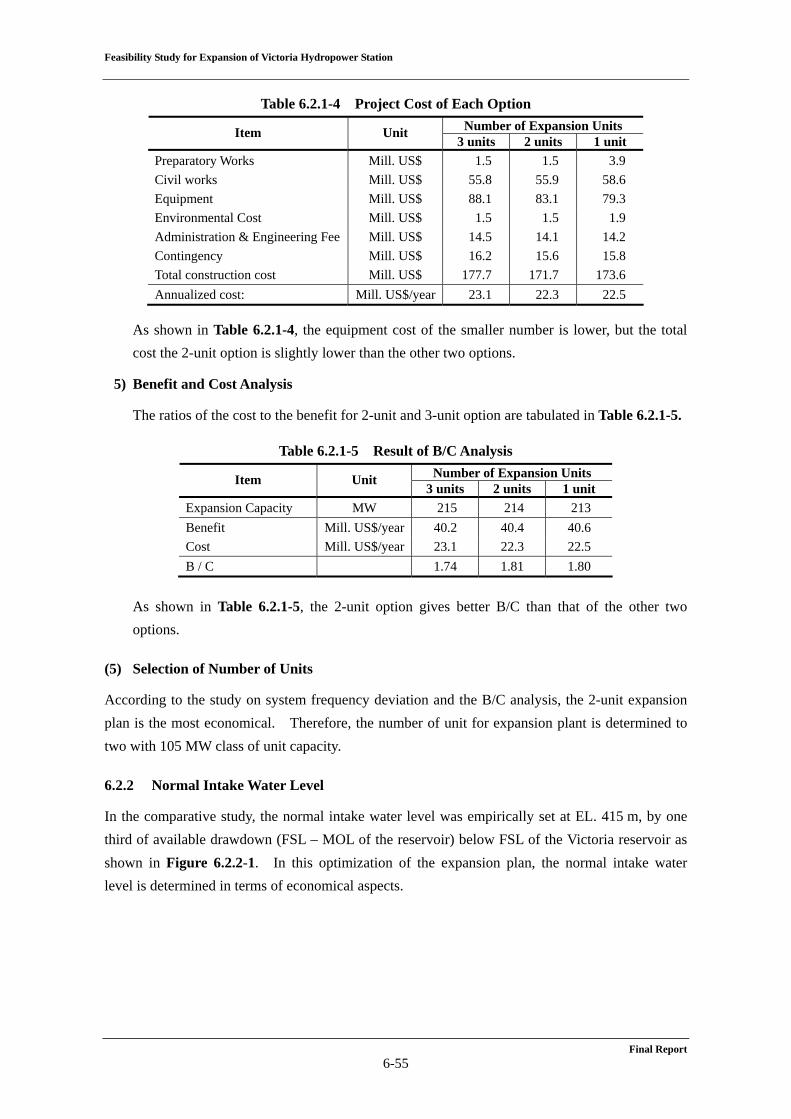
Table 6.2.1-4 Project Cost of Each Option Number of Expansion Units Item Unit
3 units 2 units 1 unit Preparatory Works Mill. US$ 1.5 1.5 3.9 Civil works Mill. US$ 55.8 55.9 58.6 Equipment Mill. US$ 88.1 83.1 79.3 Environmental Cost Mill. US$ 1.5 1.5 1.9 Administration & Engineering Fee Mill. US$ 14.5 14.1 14.2 Contingency Mill. US$ 16.2 15.6 15.8 Total construction cost Mill. US$ 177.7 171.7 173.6 Annualized cost: Mill. US$/year 23.1 22.3 22.5
As shown in Table 6.2.1-4, the equipment cost of the smaller number is lower, but the total cost the 2-unit option is slightly lower than the other two options.
5) Benefit and Cost Analysis
The ratios of the cost to the benefit for 2-unit and 3-unit option are tabulated in Table 6.2.1-5.
Table 6.2.1-5 Result of B/C Analysis Number of Expansion Units Item Unit
3 units 2 units 1 unit Expansion Capacity MW 215 214 213 Benefit Mill. US$/year 40.2 40.4 40.6 Cost Mill. US$/year 23.1 22.3 22.5 B / C 1.74 1.81 1.80
As shown in Table 6.2.1-5, the 2-unit option gives better B/C than that of the other two options.
(5) Selection of Number of Units
According to the study on system frequency deviation and the B/C analysis, the 2-unit expansion plan is the most economical. Therefore, the number of unit for expansion plant is determined to two with 105 MW class of unit capacity.
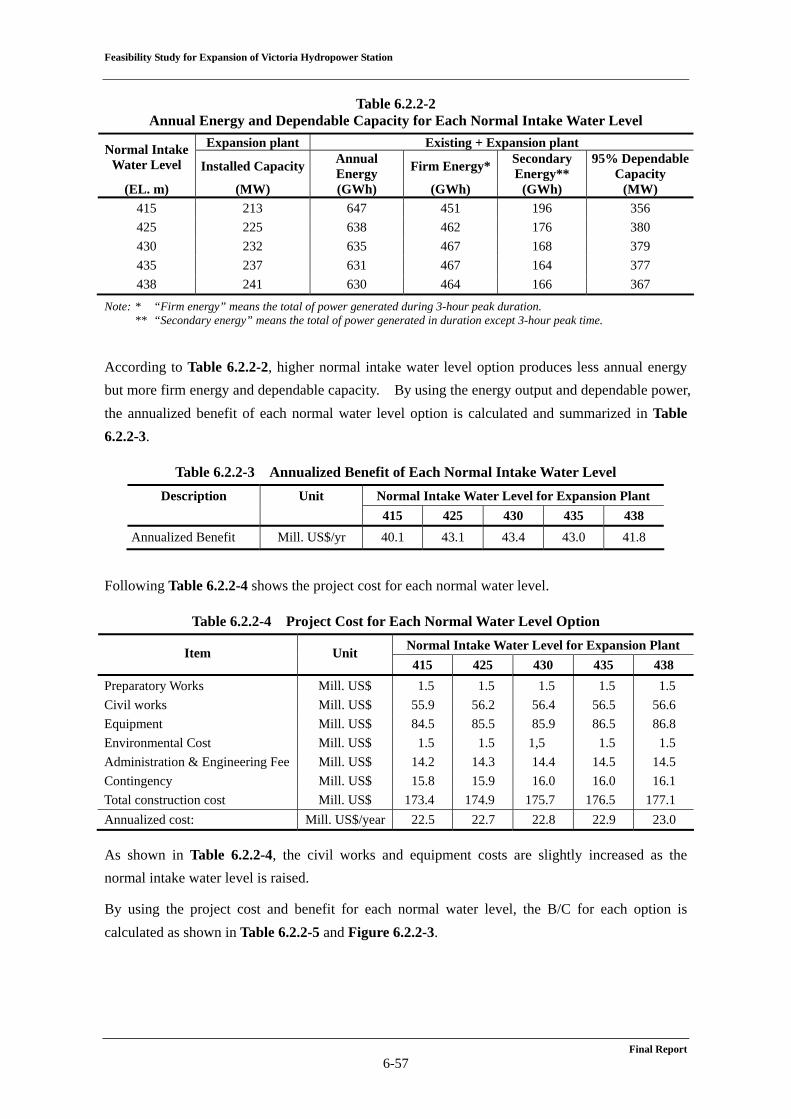
6.2.2 Normal Intake Water Level
In the comparative study, the normal intake water level was empirically set at EL. 415 m, by one third of available drawdown (FSL – MOL of the reservoir) below FSL of the Victoria reservoir as shown in Figure 6.2.2-1. In this optimization of the expansion plan, the normal intake water level is determined in terms of economical aspects.
Feasibility Study for Expansion of Victoria Hydropower Station
Final Report 6-56
he1
1/3he1
Gross head
powerhouse Figure 6.2.2-1 Normal Intake Water Level in the Comparative Study
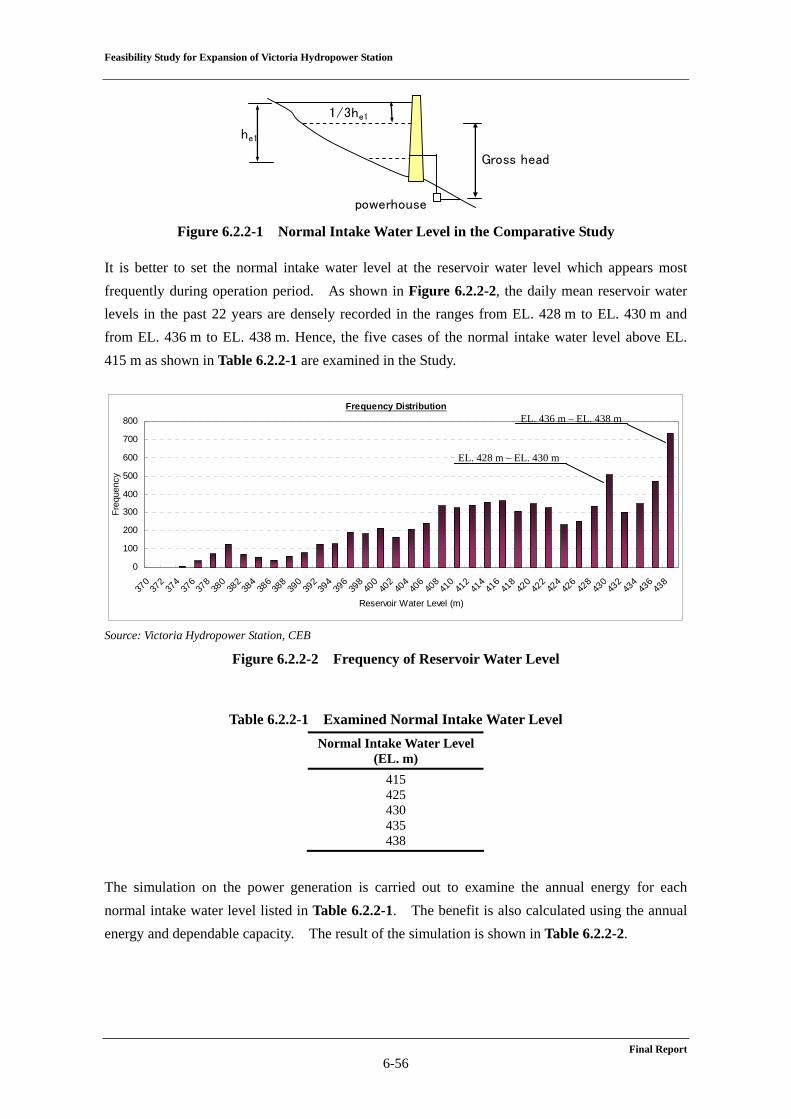
It is better to set the normal intake water level at the reservoir water level which appears most frequently during operation period. As shown in Figure 6.2.2-2, the daily mean reservoir water levels in the past 22 years are densely recorded in the ranges from EL. 428 m to EL. 430 m and from EL. 436 m to EL. 438 m. Hence, the five cases of the normal intake water level above EL. 415 m as shown in Table 6.2.2-1 are examined in the Study.
Frequency Distribution
0
100
200
300
400
500
600
700
800
370
372
374
376
378
380
382
384
386
388
390
392
394
396
398
400
402
404
406
408
410
412
414
416
418
420
422
424
426
428
430
432
434
436
438
Reservoir Water Level (m)
Freq
uenc
y
Source: Victoria Hydropower Station, CEB
Figure 6.2.2-2 Frequency of Reservoir Water Level
Table 6.2.2-1 Examined Normal Intake Water Level Normal Intake Water Level
(EL. m) 415 425 430 435 438
The simulation on the power generation is carried out to examine the annual energy for each normal intake water level listed in Table 6.2.2-1. The benefit is also calculated using the annual energy and dependable capacity. The result of the simulation is shown in Table 6.2.2-2.
EL. 428 m – EL. 430 m
EL. 436 m – EL. 438 m
Feasibility Study for Expansion of Victoria Hydropower Station
Final Report 6-57
Table 6.2.2-2 Annual Energy and Dependable Capacity for Each Normal Intake Water Level
Expansion plant Existing + Expansion plant Normal Intake Water Level Installed Capacity Annual
Energy Firm Energy* Secondary Energy**
95% DependableCapacity
(EL. m) (MW) (GWh) (GWh) (GWh) (MW) 415 213 647 451 196 356 425 225 638 462 176 380 430 232 635 467 168 379 435 237 631 467 164 377 438 241 630 464 166 367
Note: * “Firm energy” means the total of power generated during 3-hour peak duration. ** “Secondary energy” means the total of power generated in duration except 3-hour peak time.
According to Table 6.2.2-2, higher normal intake water level option produces less annual energy but more firm energy and dependable capacity. By using the energy output and dependable power, the annualized benefit of each normal water level option is calculated and summarized in Table 6.2.2-3.
Table 6.2.2-3 Annualized Benefit of Each Normal Intake Water Level Description Unit Normal Intake Water Level for Expansion Plant
415 425 430 435 438 Annualized Benefit Mill. US$/yr 40.1 43.1 43.4 43.0 41.8
Following Table 6.2.2-4 shows the project cost for each normal water level.
Table 6.2.2-4 Project Cost for Each Normal Water Level Option Normal Intake Water Level for Expansion Plant Item Unit 415 425 430 435 438
Preparatory Works Mill. US$ 1.5 1.5 1.5 1.5 1.5 Civil works Mill. US$ 55.9 56.2 56.4 56.5 56.6 Equipment Mill. US$ 84.5 85.5 85.9 86.5 86.8 Environmental Cost Mill. US$ 1.5 1.5 1,5 1.5 1.5 Administration & Engineering Fee Mill. US$ 14.2 14.3 14.4 14.5 14.5 Contingency Mill. US$ 15.8 15.9 16.0 16.0 16.1 Total construction cost Mill. US$ 173.4 174.9 175.7 176.5 177.1 Annualized cost: Mill. US$/year 22.5 22.7 22.8 22.9 23.0 As shown in Table 6.2.2-4, the civil works and equipment costs are slightly increased as the normal intake water level is raised.
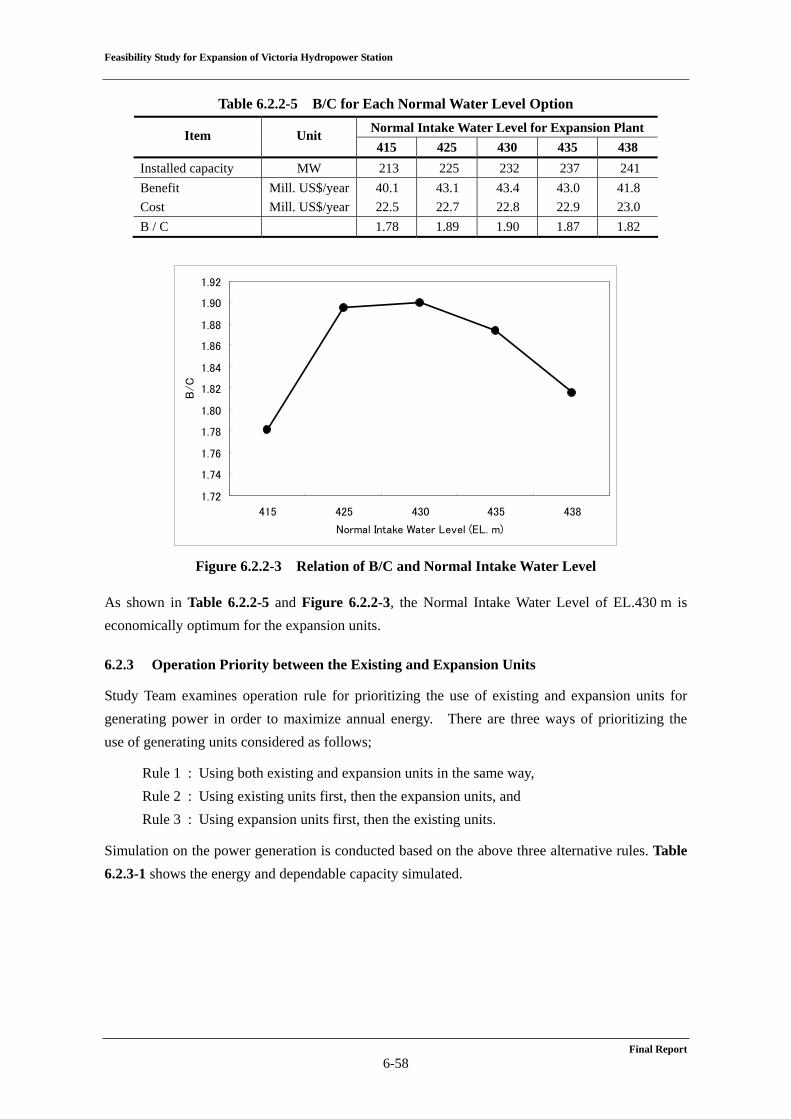
By using the project cost and benefit for each normal water level, the B/C for each option is calculated as shown in Table 6.2.2-5 and Figure 6.2.2-3.
Feasibility Study for Expansion of Victoria Hydropower Station
Final Report 6-58
Table 6.2.2-5 B/C for Each Normal Water Level Option Normal Intake Water Level for Expansion Plant Item Unit 415 425 430 435 438
Installed capacity MW 213 225 232 237 241 Benefit Mill. US$/year 40.1 43.1 43.4 43.0 41.8 Cost Mill. US$/year 22.5 22.7 22.8 22.9 23.0 B / C 1.78 1.89 1.90 1.87 1.82
1.72
1.74
1.76
1.78
1.80
1.82
1.84
1.86
1.88
1.90
1.92
415 425 430 435 438
Normal Intake Water Level (EL. m)
B/C
Figure 6.2.2-3 Relation of B/C and Normal Intake Water Level
As shown in Table 6.2.2-5 and Figure 6.2.2-3, the Normal Intake Water Level of EL.430 m is economically optimum for the expansion units.
6.2.3 Operation Priority between the Existing and Expansion Units
Study Team examines operation rule for prioritizing the use of existing and expansion units for generating power in order to maximize annual energy. There are three ways of prioritizing the use of generating units considered as follows;
Rule 1 : Using both existing and expansion units in the same way, Rule 2 : Using existing units first, then the expansion units, and Rule 3 : Using expansion units first, then the existing units.
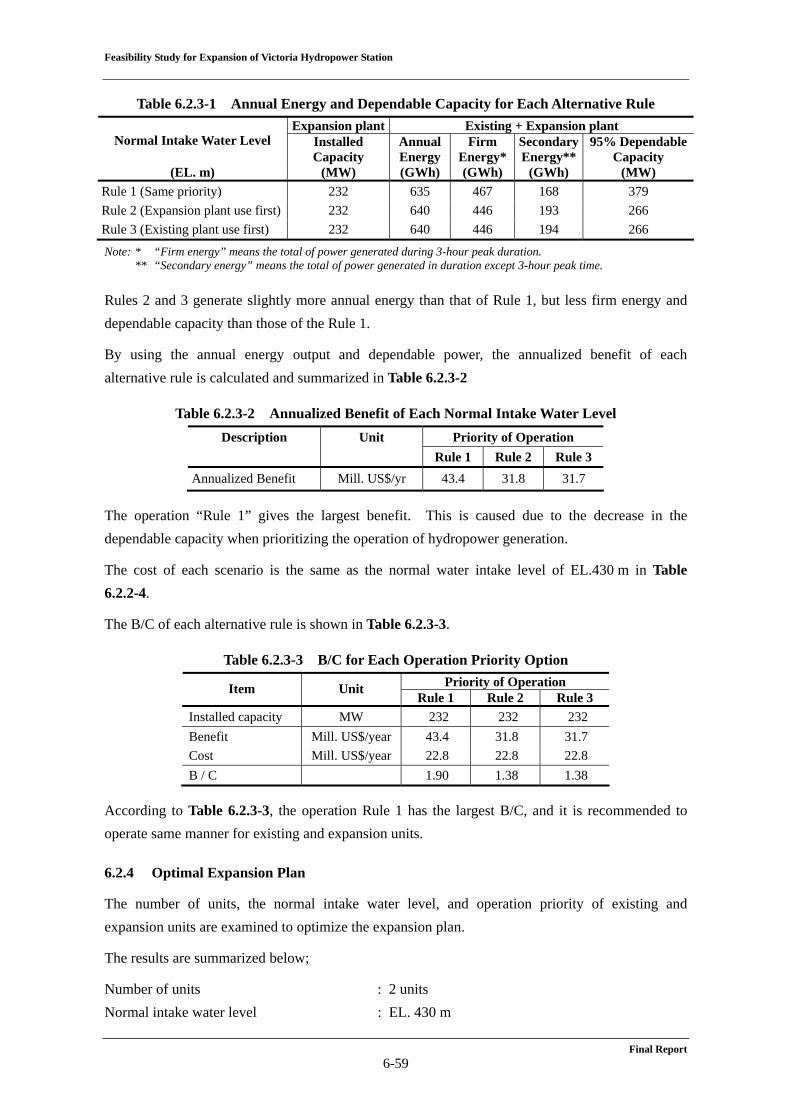
Simulation on the power generation is conducted based on the above three alternative rules. Table 6.2.3-1 shows the energy and dependable capacity simulated.
Feasibility Study for Expansion of Victoria Hydropower Station
Final Report 6-59
Table 6.2.3-1 Annual Energy and Dependable Capacity for Each Alternative Rule Expansion plant Existing + Expansion plant
Normal Intake Water Level Installed Capacity
Annual Energy
Firm Energy*
Secondary Energy**
95% Dependable Capacity
(EL. m) (MW) (GWh) (GWh) (GWh) (MW) Rule 1 (Same priority) 232 635 467 168 379 Rule 2 (Expansion plant use first) 232 640 446 193 266 Rule 3 (Existing plant use first) 232 640 446 194 266
Note: * “Firm energy” means the total of power generated during 3-hour peak duration. ** “Secondary energy” means the total of power generated in duration except 3-hour peak time.
Rules 2 and 3 generate slightly more annual energy than that of Rule 1, but less firm energy and dependable capacity than those of the Rule 1.
By using the annual energy output and dependable power, the annualized benefit of each alternative rule is calculated and summarized in Table 6.2.3-2
Table 6.2.3-2 Annualized Benefit of Each Normal Intake Water Level Description Unit Priority of Operation
Rule 1 Rule 2 Rule 3 Annualized Benefit Mill. US$/yr 43.4 31.8 31.7
The operation “Rule 1” gives the largest benefit. This is caused due to the decrease in the dependable capacity when prioritizing the operation of hydropower generation.
The cost of each scenario is the same as the normal water intake level of EL.430 m in Table 6.2.2-4.
The B/C of each alternative rule is shown in Table 6.2.3-3.
Table 6.2.3-3 B/C for Each Operation Priority Option Priority of Operation Item Unit
Rule 1 Rule 2 Rule 3 Installed capacity MW 232 232 232 Benefit Mill. US$/year 43.4 31.8 31.7 Cost Mill. US$/year 22.8 22.8 22.8 B / C 1.90 1.38 1.38
According to Table 6.2.3-3, the operation Rule 1 has the largest B/C, and it is recommended to operate same manner for existing and expansion units.
6.2.4 Optimal Expansion Plan
The number of units, the normal intake water level, and operation priority of existing and expansion units are examined to optimize the expansion plan.
The results are summarized below;
Number of units : 2 units Normal intake water level : EL. 430 m
Feasibility Study for Expansion of Victoria Hydropower Station
Final Report 6-60
Operation rule of existing and expansion units : Same operation for existing and expansion plants.
6.2.5 Maximum Possible Power Generation
In the comparative study on alternative options and optimization of expansion plant, spillout and sand-flushing discharge were deducted from inflow for power generation simulation, since those discharges were not used for hydropower generation. In this section, the spillout discharge is taken into account as available water for hydropower generation.
In the calculation of hydropower generation, the reservoir operation rule suggested in Section 6.1 was applied and power generation by existing hydropower station, existing and expansion hydropower plant was simulated. For the expansion hydropower generation, the installed number of units is two and normal intake water level of EL. 430 m was used as selected in the previous section. The operation rule of the existing and expansion plant is the same as suggested in the Section 6.2.4.
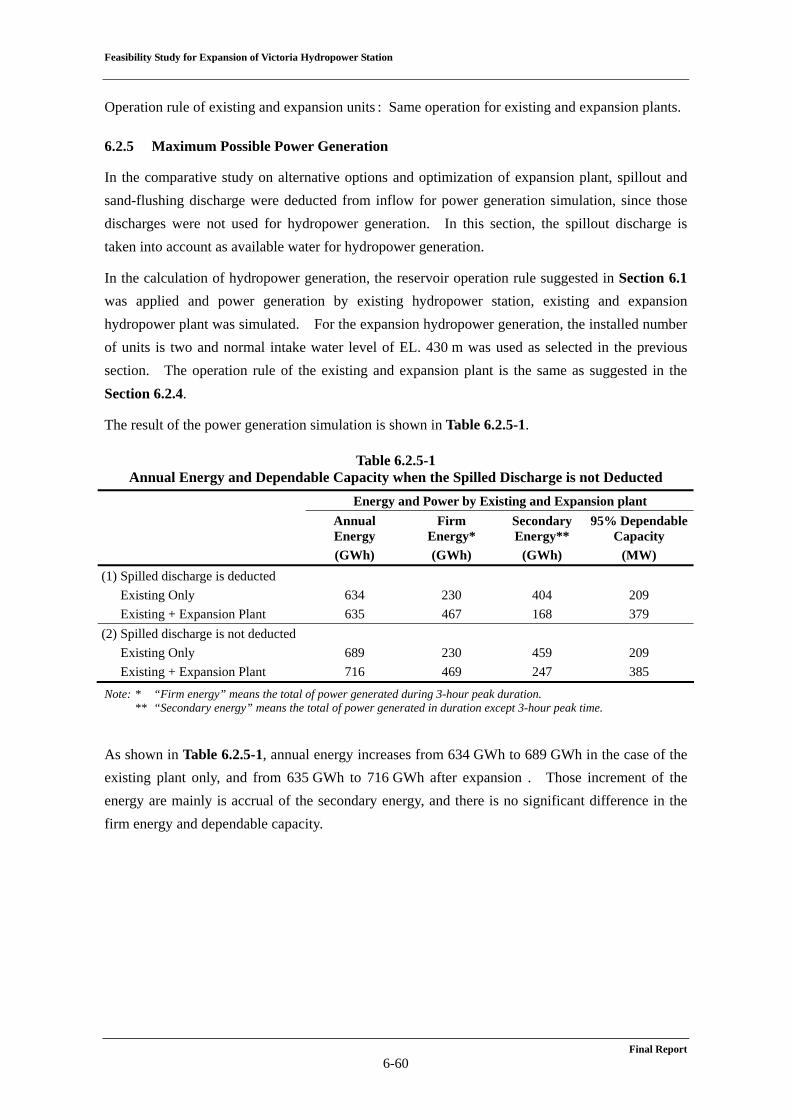
The result of the power generation simulation is shown in Table 6.2.5-1.
Table 6.2.5-1 Annual Energy and Dependable Capacity when the Spilled Discharge is not Deducted
Energy and Power by Existing and Expansion plant
Annual Energy
Firm Energy*
Secondary Energy**
95% DependableCapacity
(GWh) (GWh) (GWh) (MW) (1) Spilled discharge is deducted Existing Only 634 230 404 209 Existing + Expansion Plant 635 467 168 379 (2) Spilled discharge is not deducted Existing Only 689 230 459 209 Existing + Expansion Plant 716 469 247 385
Note: * “Firm energy” means the total of power generated during 3-hour peak duration. ** “Secondary energy” means the total of power generated in duration except 3-hour peak time.
As shown in Table 6.2.5-1, annual energy increases from 634 GWh to 689 GWh in the case of the existing plant only, and from 635 GWh to 716 GWh after expansion . Those increment of the energy are mainly is accrual of the secondary energy, and there is no significant difference in the firm energy and dependable capacity.