Embed Size (px)
Citation preview
Rose-Hulman Institute of Technology
GL458, International Trade & Globalization / K. Christ
7. Instruments of Trade Policy
7. Instruments of Trade Policy
Learning Objectives
Become familiar with the various instruments of trade policy – tariff and non-tariff barriers to
trade – and learn the meaning and implications of the effective rate of protection.
Learn the traditional approach to the cost-benefit analysis of tariffs, export subsidies and
import quotas.
Briefly examine other forms of protection and begin to evaluate their economic and social
impact.
Readings
Paul Krugman and Maruice Obstfeld, International Economics, Theory and Policy, 8th ed. (2009).
chapter 8, “The Instruments of Trade Policy”.
Outline
1. Basic welfare analysis of tariffs (cost-benefit analysis of a tariff)
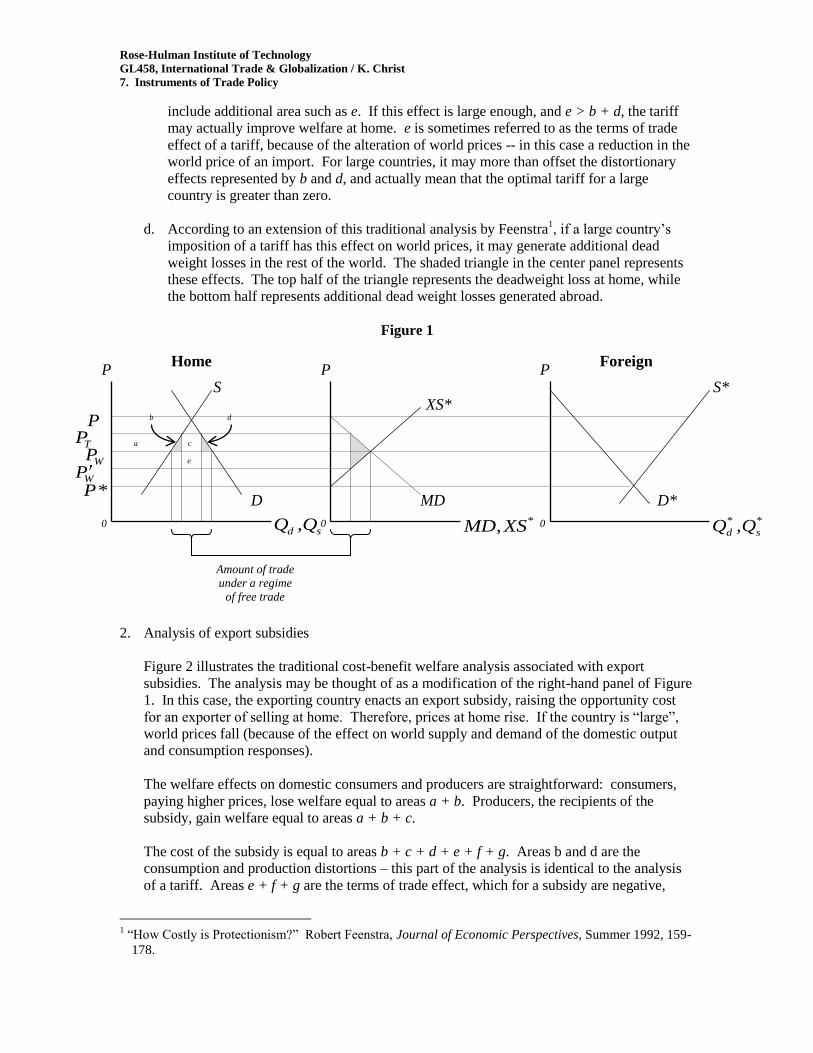
a. Figure 1 presents the traditional graphic analysis of a tariff on an import good. Without
trade, domestic supply and demand in the two countries will result in equilibrium prices
(or “autarky” prices) of P in the home country and P* in the foreign country. For any
price below P, the home country will generate the import demand, MD, in the center
panel of the diagram. For any price above P*, the foreign country will generate the
export supply, XS*. If there is free trade of the good, the trading price will settle between
P and P* at a price such as WP (the “world” price).
b. If the home country imposes a tariff on the good, the price will rise above WP to a price
such as TP . The welfare effects of this at home are usually summarized in terms of
changes in surplus. The higher price leads to a reduction in consumer surplus equal to a
+ b + c + d, an increase in producer surplus equal to a, and government tariff revenue
equal to c (assuming that the tariff-imposing country is a “small country” – see point (c)
below). In theory, the government can use this tariff revenue to offset some of the
welfare loss to consumers of the good, but as the diagram illustrates, this area is
insufficient to fully compensate consumers of the good. The uncompensated areas b and
d are usually referred to as the home country’s dead weight loss of the tariff. These areas
also are sometimes said to represent the distortionary effects of the tariff, with area b
representing a production distortion and area d representing a consumption distortion.
c. As the left panel shows, when the tariff leads to a higher domestic (or “internal”) price in
the home country, consumers respond by reducing the quantity demanded and producers
respond by increasing the quantity supplied. If the home country is sufficiently large
relative to the world economy, these domestic demand and supply responses potentially
will have a downward effect on the world price, to a price such as WP (the so-called
“large country” effect). In this case, the government tariff revenue potentially expands to
Rose-Hulman Institute of Technology
GL458, International Trade & Globalization / K. Christ
7. Instruments of Trade Policy
include additional area such as e. If this effect is large enough, and e > b + d, the tariff
may actually improve welfare at home. e is sometimes referred to as the terms of trade
effect of a tariff, because of the alteration of world prices -- in this case a reduction in the
world price of an import. For large countries, it may more than offset the distortionary
effects represented by b and d, and actually mean that the optimal tariff for a large
country is greater than zero.
d. According to an extension of this traditional analysis by Feenstra1, if a large country’s
imposition of a tariff has this effect on world prices, it may generate additional dead
weight losses in the rest of the world. The shaded triangle in the center panel represents
these effects. The top half of the triangle represents the deadweight loss at home, while
the bottom half represents additional dead weight losses generated abroad.
Figure 1
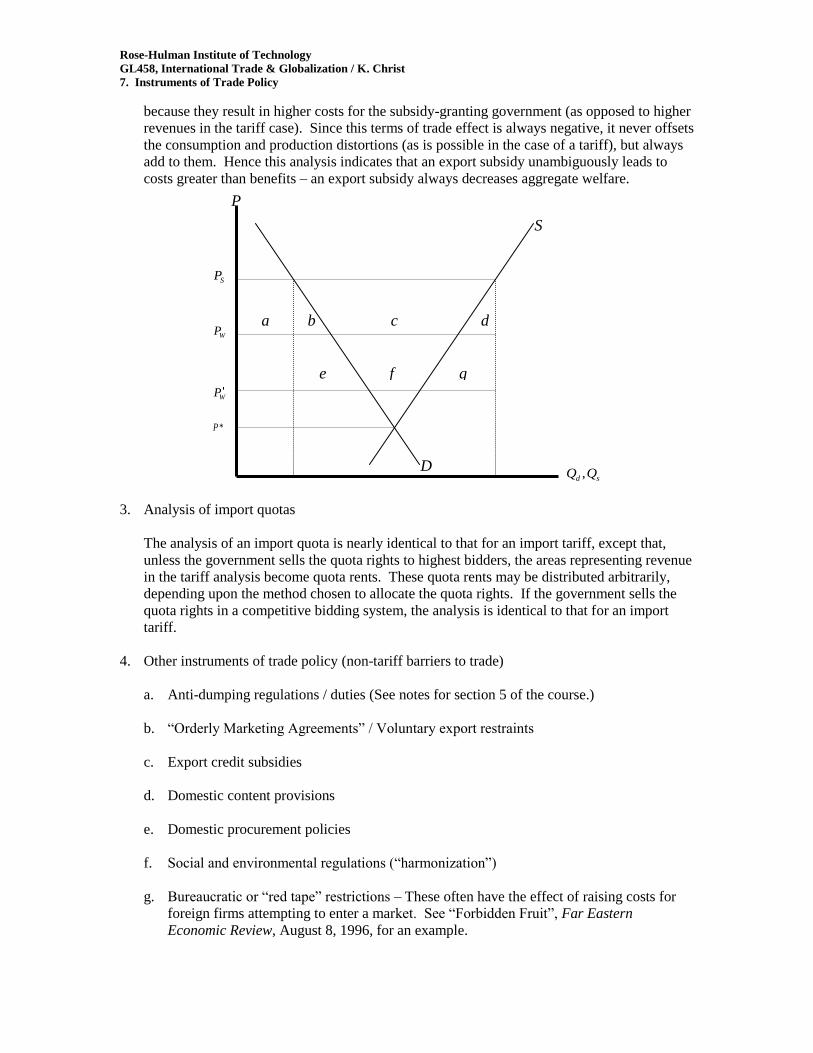
2. Analysis of export subsidies
Figure 2 illustrates the traditional cost-benefit welfare analysis associated with export
subsidies. The analysis may be thought of as a modification of the right-hand panel of Figure
1. In this case, the exporting country enacts an export subsidy, raising the opportunity cost
for an exporter of selling at home. Therefore, prices at home rise. If the country is “large”,
world prices fall (because of the effect on world supply and demand of the domestic output
and consumption responses).
The welfare effects on domestic consumers and producers are straightforward: consumers,
paying higher prices, lose welfare equal to areas a + b. Producers, the recipients of the
subsidy, gain welfare equal to areas a + b + c.
The cost of the subsidy is equal to areas b + c + d + e + f + g. Areas b and d are the
consumption and production distortions – this part of the analysis is identical to the analysis
of a tariff. Areas e + f + g are the terms of trade effect, which for a subsidy are negative,
1 “How Costly is Protectionism?” Robert Feenstra, Journal of Economic Perspectives, Summer 1992, 159-
178.
0
P
sd Q,Q 0
P
*XS,MD 0
P
*
s
*
d Q,Q
D
S
D*
S* XS*
MD
Home Foreign
a c
e
WPWP
TPP
*P
Amount of trade
under a regime
of free trade
b d
Rose-Hulman Institute of Technology
GL458, International Trade & Globalization / K. Christ
7. Instruments of Trade Policy
because they result in higher costs for the subsidy-granting government (as opposed to higher
revenues in the tariff case). Since this terms of trade effect is always negative, it never offsets
the consumption and production distortions (as is possible in the case of a tariff), but always
add to them. Hence this analysis indicates that an export subsidy unambiguously leads to
costs greater than benefits – an export subsidy always decreases aggregate welfare.
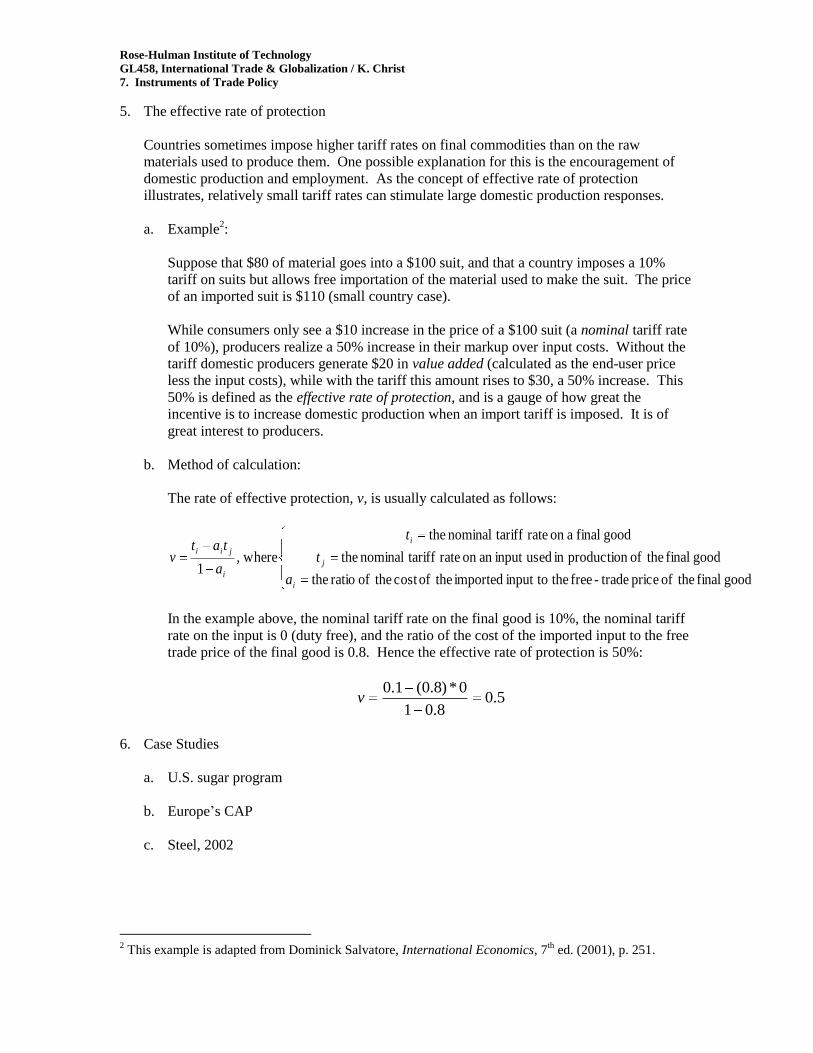
3. Analysis of import quotas
The analysis of an import quota is nearly identical to that for an import tariff, except that,
unless the government sells the quota rights to highest bidders, the areas representing revenue
in the tariff analysis become quota rents. These quota rents may be distributed arbitrarily,
depending upon the method chosen to allocate the quota rights. If the government sells the
quota rights in a competitive bidding system, the analysis is identical to that for an import
tariff.
4. Other instruments of trade policy (non-tariff barriers to trade)
a. Anti-dumping regulations / duties (See notes for section 5 of the course.)
b. “Orderly Marketing Agreements” / Voluntary export restraints
c. Export credit subsidies
d. Domestic content provisions
e. Domestic procurement policies
f. Social and environmental regulations (“harmonization”)
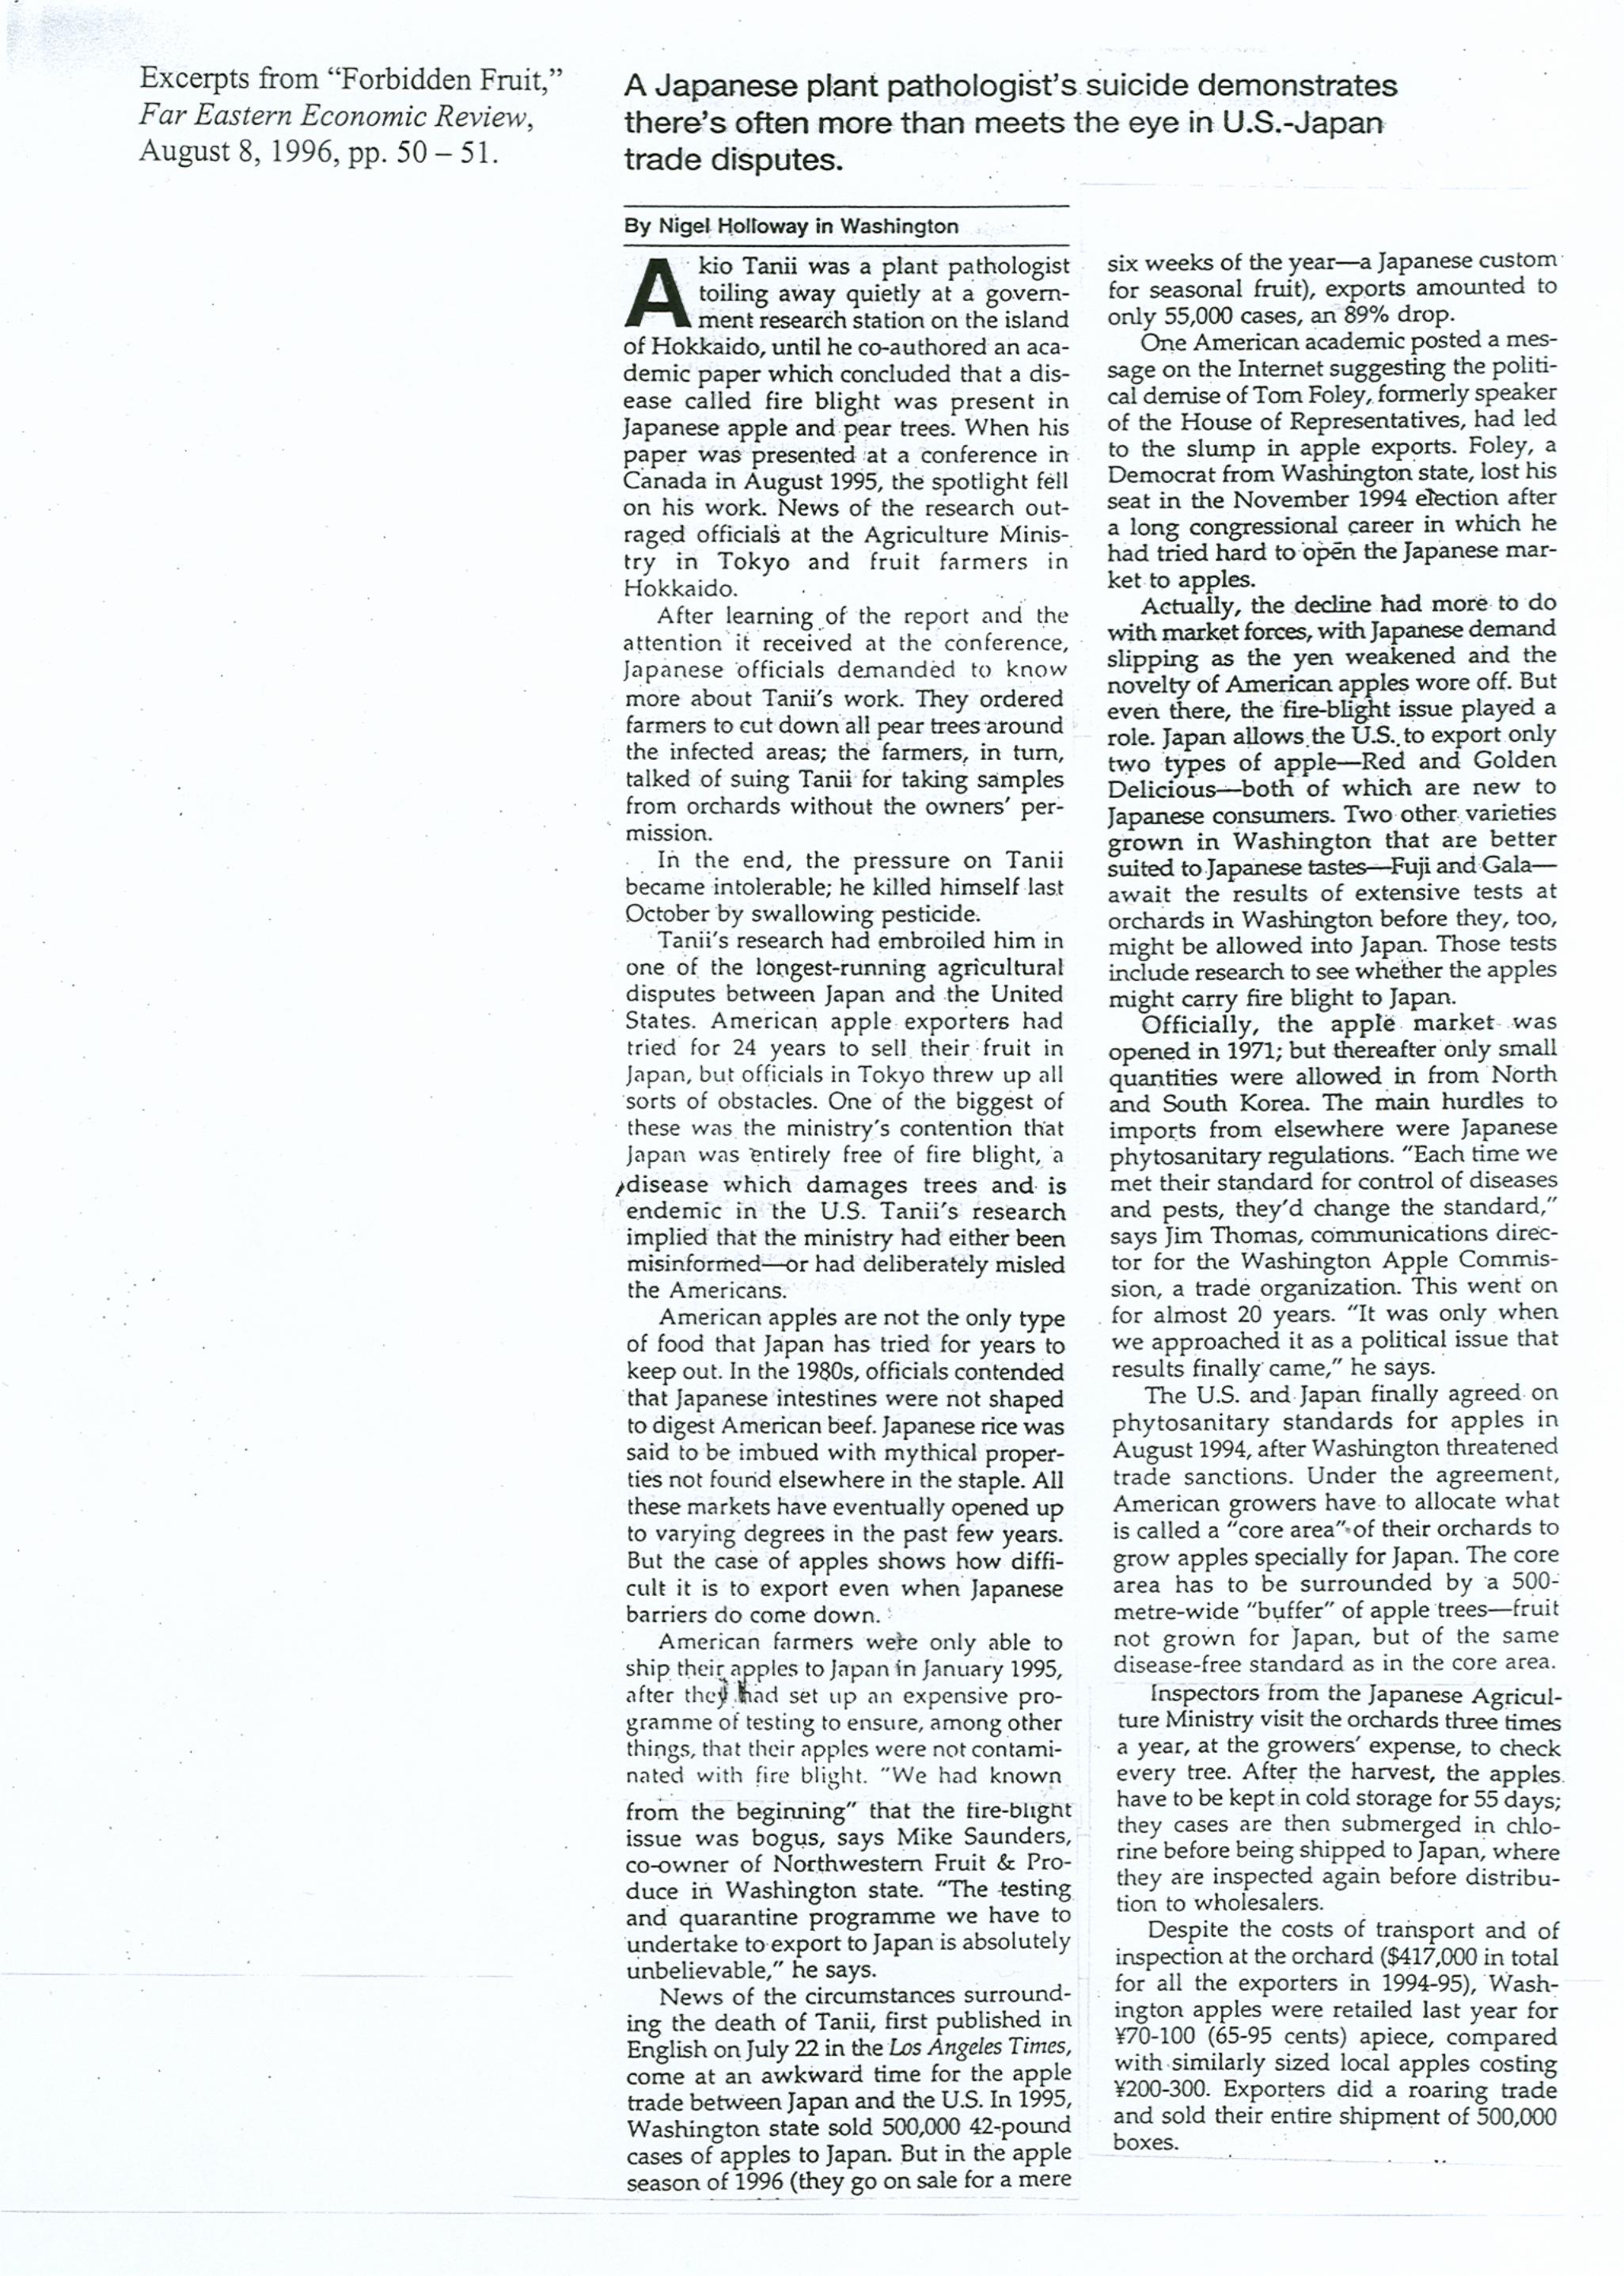
g. Bureaucratic or “red tape” restrictions – These often have the effect of raising costs for
foreign firms attempting to enter a market. See “Forbidden Fruit”, Far Eastern
Economic Review, August 8, 1996, for an example.
P
S
D
a b c d WP
sd QQ ,
f
WP
SP
*P
e g
Rose-Hulman Institute of Technology
GL458, International Trade & Globalization / K. Christ
7. Instruments of Trade Policy
5. The effective rate of protection
Countries sometimes impose higher tariff rates on final commodities than on the raw
materials used to produce them. One possible explanation for this is the encouragement of
domestic production and employment. As the concept of effective rate of protection
illustrates, relatively small tariff rates can stimulate large domestic production responses.
a. Example2:
Suppose that $80 of material goes into a $100 suit, and that a country imposes a 10%
tariff on suits but allows free importation of the material used to make the suit. The price
of an imported suit is $110 (small country case).
While consumers only see a $10 increase in the price of a $100 suit (a nominal tariff rate
of 10%), producers realize a 50% increase in their markup over input costs. Without the
tariff domestic producers generate $20 in value added (calculated as the end-user price
less the input costs), while with the tariff this amount rises to $30, a 50% increase. This
50% is defined as the effective rate of protection, and is a gauge of how great the
incentive is to increase domestic production when an import tariff is imposed. It is of
great interest to producers.
b. Method of calculation:
The rate of effective protection, v, is usually calculated as follows:
good final theof price trade-free theinput to imported theofcost theof ratio the
good final theof productionin usedinput an on rate tariffnominal the
good final aon rate tariffnominal the
where,1
i
j
i
i
jii
a
t
t
a
tatv
In the example above, the nominal tariff rate on the final good is 10%, the nominal tariff
rate on the input is 0 (duty free), and the ratio of the cost of the imported input to the free
trade price of the final good is 0.8. Hence the effective rate of protection is 50%:
5.08.01
0*)8.0(1.0v
6. Case Studies
a. U.S. sugar program
b. Europe’s CAP
c. Steel, 2002
2 This example is adapted from Dominick Salvatore, International Economics, 7
th ed. (2001), p. 251.
Rose-Hulman Institute of Technology
GL458, International Trade & Globalization / K. Christ
7. Instruments of Trade Policy
Assignment 7
Discussion Questions
1. What factors influence the magnitude of the production distortion, consumption distortion,
and government revenue that arise from the imposition of a tariff?
2. The two deadweight triangles are the Consumption distortion and Production distortion
losses. It is easy to understand why the Consumption distortion constitutes a loss for society.
After all it raises the prices of goods to consumers, and even causes some consumers to drop
out of the market altogether. It seems paradoxical that the Production distortion is
considered an equivalent burden on society. After all, in this case, profits increase, and
additional production (with its associated employment) comes on line. This would seem to be
an offset rather than an addition to the burden or loss borne by society. Explain why the
Production distortion is indeed a loss to society, and what is wrong with the logic that leads
to the apparent paradox.
Problem Set
Krugman and Obstfeld, problems 1 through 7 and 9 from pages 201 – 202.
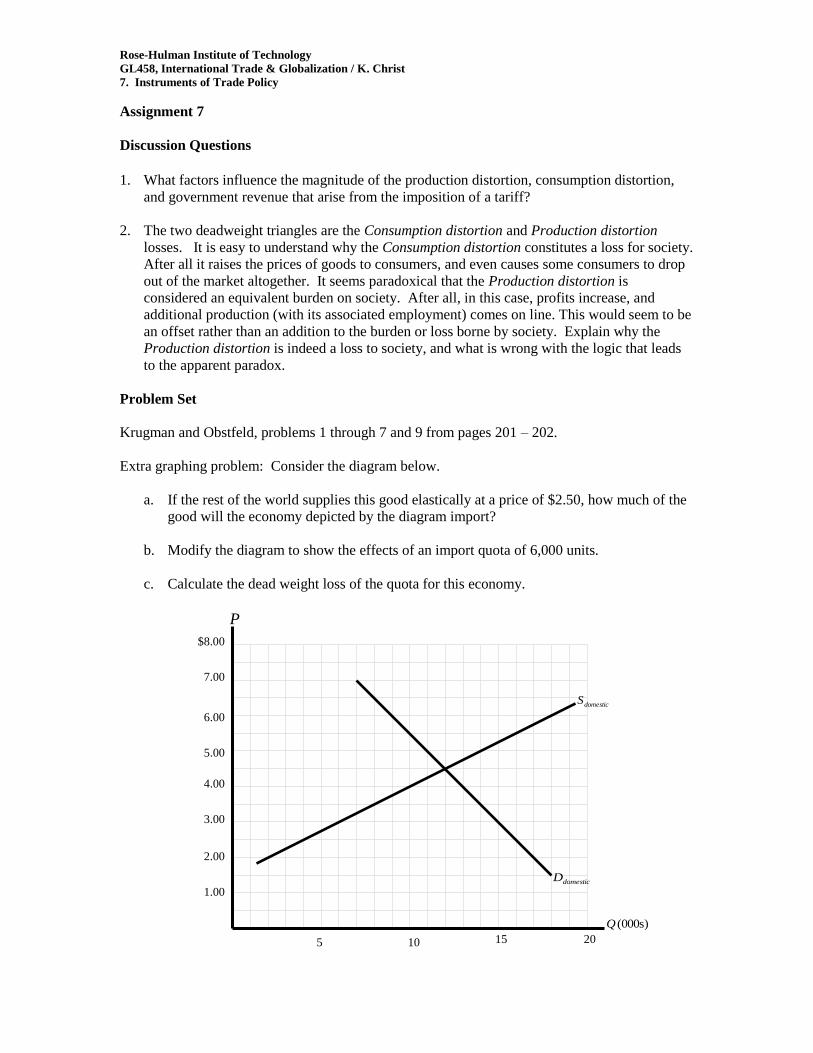
Extra graphing problem: Consider the diagram below.
a. If the rest of the world supplies this good elastically at a price of $2.50, how much of the
good will the economy depicted by the diagram import?
b. Modify the diagram to show the effects of an import quota of 6,000 units.
c. Calculate the dead weight loss of the quota for this economy.
(000s) Q
P
10 15 20 5
1.00
2.00
3.00
4.00
5.00
6.00
7.00
$8.00
domesticS
domesticD