Embed Size (px)
Citation preview

COLOMBIA Investment Environment and Business
Opportunities in Colombia
October 2013

About us
Proexport is Colombia’s entity in charge of the
promotion of International Tourism, Foreign Direct
Investment, and non-traditional exports
EXPORTS INVESTMENT TOURISM
Proexport’s network: 28 offices around the world
and 8 offices in Colombia

Joint work plans with entrepreneurial exporters. 1
6
Commercial information and tailored solutions (Information Centers,
International Strategic Development, and Cooperation & Agreements) 2
Buyers’ Trade Mission 3
5
Technical and Trade Missions
7
Co
lom
bia
O
vers
eas
C
olo
mb
ia a
nd
overs
eas
Business Matchmaking Forums 4
Commercial Agendas
8
9
10
Showrooms
International Trade Shows
Exporter Mission
Website for exporters and buyers
Exports Portfolio

Seminars for established Investors 1
International Seminars and Events
6
SIFAI (System to Facilitate and Attract Investment) 2
Preparation of custom-made information
3
5
7
Co
lom
bia
C
olo
mb
ia a
nd
Ove
rse
as
Coordination and development of investor agendas
4
Investment Portfolio
Contact with key public and private sector entities
Formulate regional level promotion
Overs
eas

Joint Work Plan – Exporter Plans 1
Joint promotion plans with tour operators 6
Institutional Projects 2
Special Projects 3
5
Workshops, destination showcases and international trade shows 7
Co
lom
bia
O
ve
rse
as
C
olo
mb
ia a
nd
Ove
rse
as
Specific promotional activities
Business Summits 4
Familiarization Trips / Media 8
Tourism Website 9
Branding and marketing strategies to increase visibility (activations) 10
Tourism Portfolio

Femsa, began construction of a new bottling plant in the country. Expected to be the third largest bottler in Latin
America
With support from Proexport Colombia, the Canadian company opened its first innovation center of Colombia.
Japanese fiber optic cable manufacturer Furukawa will open a production plant in Palmira, Valle del Cauca in
order to take advantage of Colombia’s FTA´s.
Mexichem, invested a total of USD 24 million to increase its production capacity in Colombia.
Hyatt is now one Key players in Colombia´s tourism sector due to the construction of a new five star hotel in Bogotá. It will also
have presence in Cali and Cartagena
Important multinationals have chosen Colombia as a
strategic location for their expansion projects – 2013

The facts behind the headlines
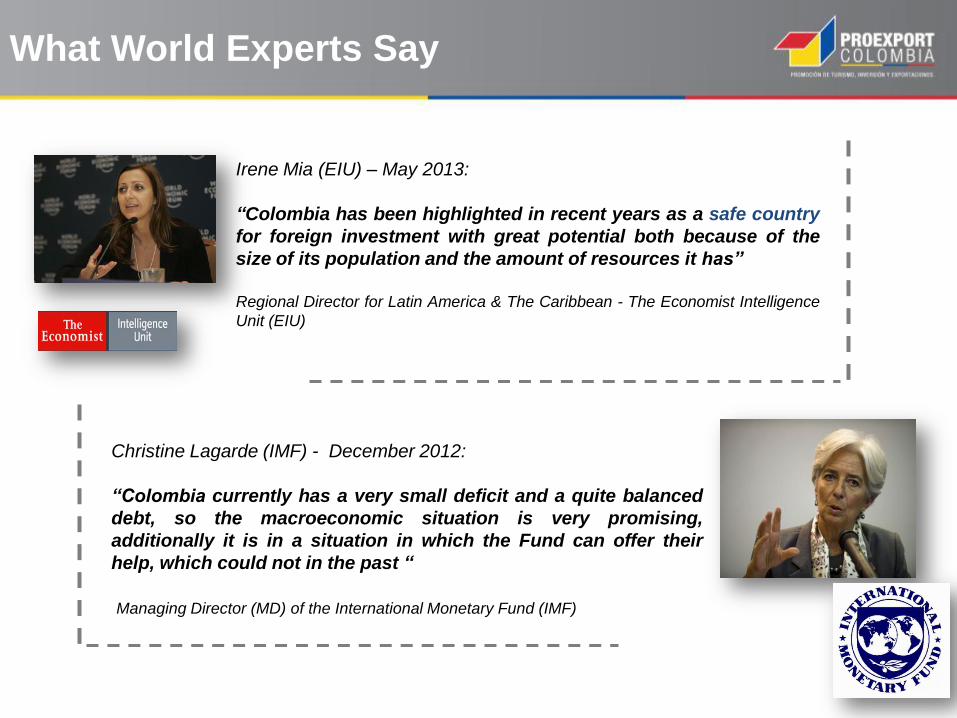
Irene Mia (EIU) – May 2013:
“Colombia has been highlighted in recent years as a safe country
for foreign investment with great potential both because of the
size of its population and the amount of resources it has”
Regional Director for Latin America & The Caribbean - The Economist Intelligence
Unit (EIU)
Christine Lagarde (IMF) - December 2012:
“Colombia currently has a very small deficit and a quite balanced
debt, so the macroeconomic situation is very promising,
additionally it is in a situation in which the Fund can offer their
help, which could not in the past “
Managing Director (MD) of the International Monetary Fund (IMF)
What World Experts Say
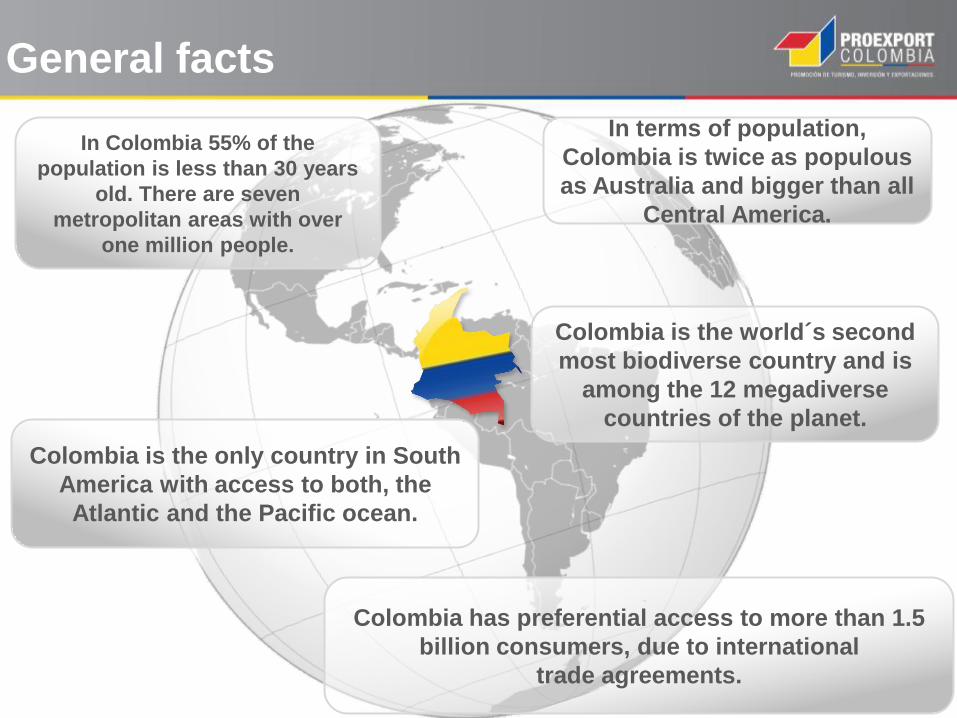
General facts
In terms of population,
Colombia is twice as populous
as Australia and bigger than all
Central America.
In Colombia 55% of the
population is less than 30 years
old. There are seven
metropolitan areas with over
one million people.
Colombia is the world´s second
most biodiverse country and is
among the 12 megadiverse
countries of the planet.
Colombia is the only country in South
America with access to both, the
Atlantic and the Pacific ocean.
Colombia has preferential access to more than 1.5
billion consumers, due to international
trade agreements.
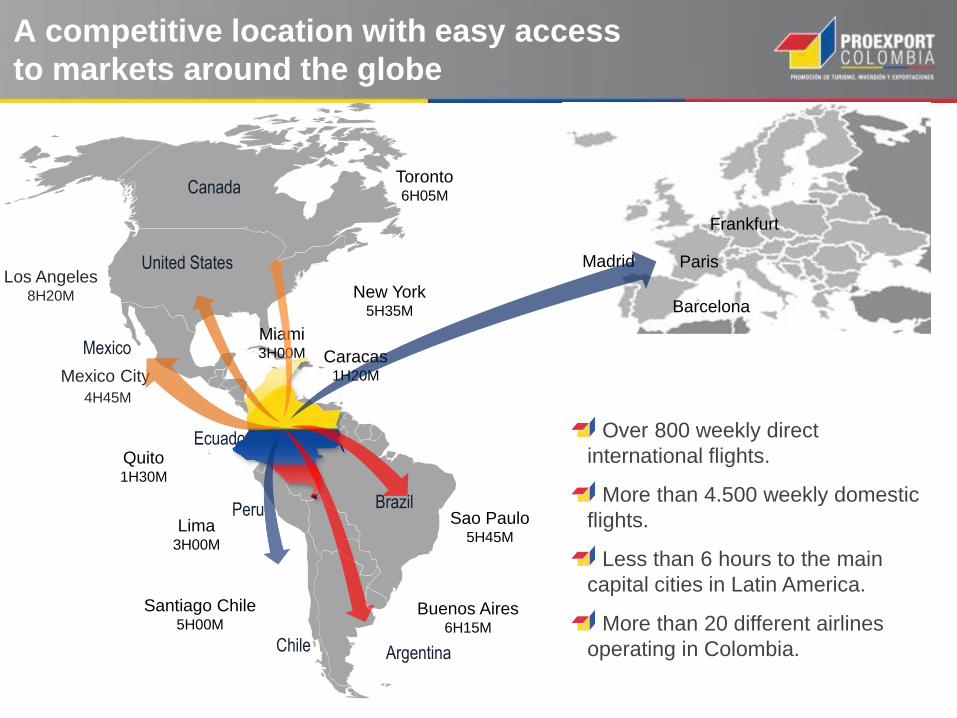
A competitive location with easy access
to markets around the globe
United States
Mexico
Brazil Peru
Ecuador Over 800 weekly direct
international flights.
More than 4.500 weekly domestic
flights.
Less than 6 hours to the main
capital cities in Latin America.
More than 20 different airlines
operating in Colombia.
New York 5H35M
Miami 3H00M Caracas
1H20M
Lima 3H00M
Sao Paulo 5H45M
Mexico City
4H45M
Santiago Chile 5H00M
Buenos Aires 6H15M
Los Angeles 8H20M
Toronto 6H05M
Quito 1H30M
Chile Argentina
Canada
Madrid Paris
Frankfurt
Barcelona
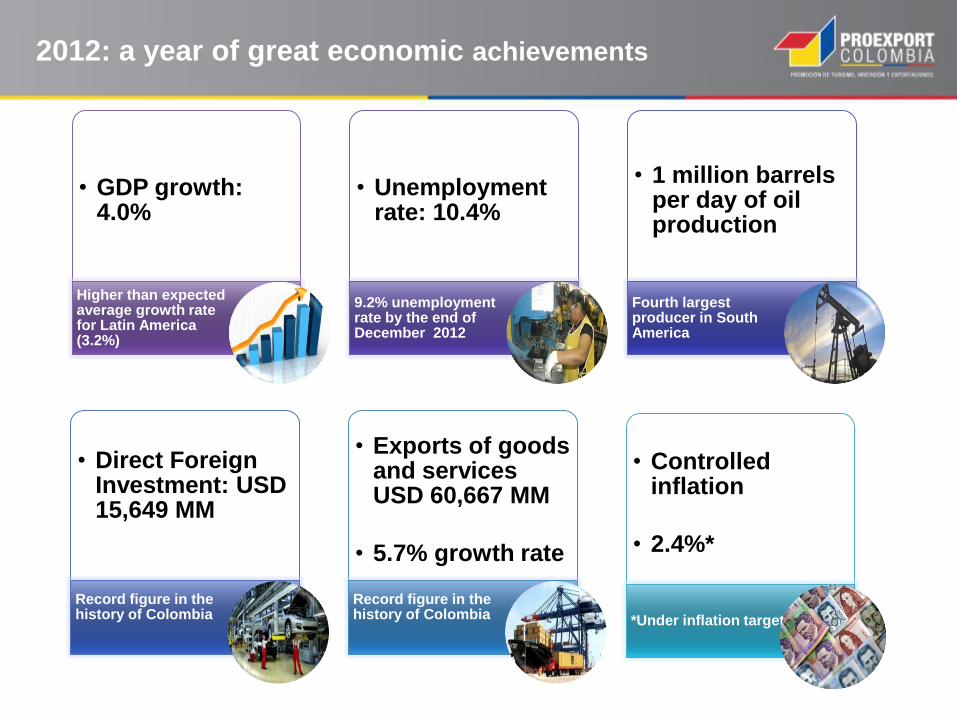
• GDP growth: 4.0%
Higher than expected average growth rate for Latin America (3.2%)
• Unemployment rate: 10.4%
9.2% unemployment rate by the end of December 2012
• 1 million barrels per day of oil production
Fourth largest producer in South America
• Direct Foreign Investment: USD 15,649 MM
Record figure in the history of Colombia
• Exports of goods and services USD 60,667 MM
• 5.7% growth rate
Record figure in the history of Colombia
• Controlled inflation
• 2.4%*
*Under inflation target
2012: a year of great economic achievements

Source: DANE. EIU - Economist Intelligence Unit. 2013.
* Forecast.
196,5
116,20
81,67 78,09 66,46
58,65 47,15 46,62
30,38 25,53 22,91 19,04 15,20 10,28 8,86 7,99 7,16 6,60 6,13 4,48 3,96 3,85
Population 2013* Million
The second largest spanish speaking country in the
world and the 23rd most populated

136
232
248
254
320
321
324
326
370
402
412
420
434
497
498
976
1.562
2.060
2.331
2.359
3.318
New Zealand
Denmark
Israel
Singapore
Vietnam
Chile
Norway
Peru
Hong Kong
Sweden
Switzerland
Philippines
Belgium
Malaysia
Colombia
Australia
South Korea
Mexico
France
Brazil
Germany
PPP - Purchasing Power Parity. e: estimated.
Source: EIU - Economist Intelligence Unit. 2012.
Colombia is the 28th largest economy in the world
and one of the largest non-OECD economies
GDP at PPP – 2012e
US$ Billion

Colombia will contribute significantly to world
economic growth
Source: “Diamonds in the rough: Unearthing opportunity in an uncertain world” .
The Economist March 2013.
Why? - Respect for private and intellectual
property.
- Natural resource boom
- Advance in national security and
peace process
- FTAs with almost 50 countries
(including the US)
- Rapid FDI growth
0 1 2 3 4 5 6 7 8 9
China
India
Nigeria
Vietnam
Indonesia
Colombia
Egipto
Turkey
Brazil
Russia
South Korea
Mexico
South Africa
United States
Canada
Japan
UK
Germany
France
Italy
BRICs
Other EM´s
CIVET´s
G7

5,826
8,940
10,910
14,400
0
2.000
4.000
6.000
8.000
10.000
12.000
14.000
16.000
2000 2001 2002 2003 2004 2005 2006 2007 2008 2009 2010 2011 2012 2013p 2015p 2018p
Per capita National Income (PPP)
2000 – 2018p, USD
Source: EIU – Economist Intelligence Unit. PPP = purchasing power parity.
Economies are divided according to 2012 income per capita, calculated using the World Bank Atlas method. The groups are: low income,
US$1,035 or less; lower middle income, US$1,036 - US$4,085; upper middle income, US$4,086 - US$12,615; and high income, US$12,616 or
more.
Colombia's per capita income has nearly
doubled since 2000
Middle High
Income
Middle Low
Income
Low Income
High Income

GDP Growth, Inflation and unemployment Rate. 2002 – 2016p
%
p: Projected. e: Estimated
Source: DANE- Colombia Central Bank - EIU: Economist Intelligence Unit. 2013.
Inflation
Unemployment
Macroeconomic stability and strong economic
performance in the long run
GDP
15,6
14,1 13,7
11,8 12,0 11,2 11,3
12,0 11,8 10,8 10,4
7,0 6,5
5,5 4,9 4,5
5,7
7,7
2,0 3,7
2,4
10,1 9,9 9,7 9,3
3,1 3,1 2,9 2,9
2,5 3,9
5,3 4,7
6,7 6,9
3,5
1,7
4,0
6,6
4,0 4,7 4,9 4,9 4,7
2002 2003 2004 2005 2006 2007 2008 2009 2010 2011 2012 2013p 2014p 2015p 2016p
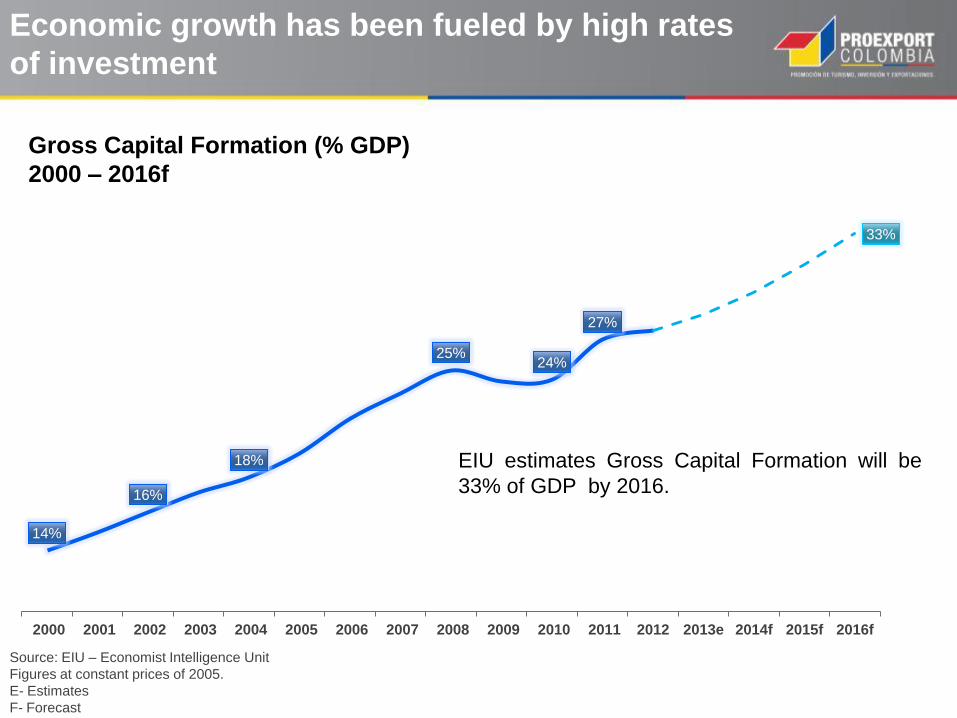
Economic growth has been fueled by high rates
of investment
Gross Capital Formation (% GDP)
2000 – 2016f
Source: EIU – Economist Intelligence Unit
Figures at constant prices of 2005.
E- Estimates
F- Forecast
14%
16%
18%
25% 24%
27%
33%
2000 2001 2002 2003 2004 2005 2006 2007 2008 2009 2010 2011 2012 2013e 2014f 2015f 2016f
EIU estimates Gross Capital Formation will be
33% of GDP by 2016.
0
100
200
300
400
500
600
700
800
900
1000
2000 2001 2002 2003 2004 2005 2006 2007 2008 2009e 2010e 2011e 2012e 2013p 2014p 2015p 2016p
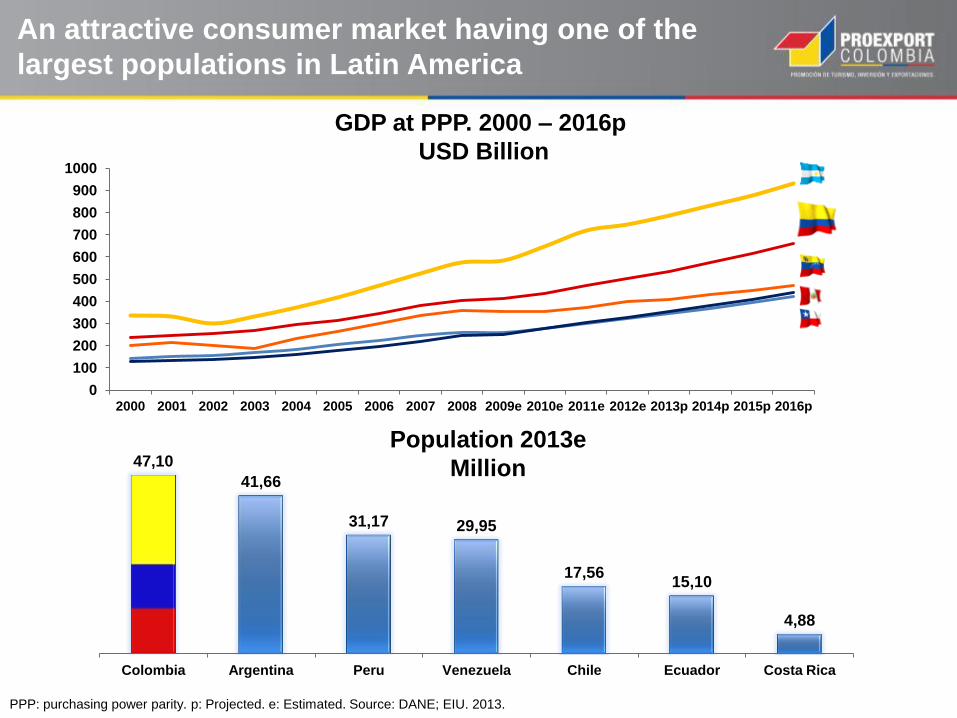
47,10
41,66
31,17 29,95
17,56 15,10
4,88
Colombia Argentina Peru Venezuela Chile Ecuador Costa Rica
PPP: purchasing power parity. p: Projected. e: Estimated. Source: DANE; EIU. 2013.
GDP at PPP. 2000 – 2016p
USD Billion
An attractive consumer market having one of the
largest populations in Latin America
Population 2013e
Million

Consumer expenditure in Colombia has almost
doubled in the last 5 years
0
50.000
100.000
150.000
200.000
250.000
300.000
350.000
2000 2001 2002 2003 2004 2005 2006 2007 2008 2009 2010 2011 2012e 2013p
Venezuela Colombia Chile Peru
Source: Euromonitor. 2013.
Consumer expenditure at current prices. 2000 - 2013p
USD million

A rapidly growing middle class
Middle class in Colombia as a
percentage of total population
6.7
6.7
22.3
19.0
32.1
24.7
Million
inhabitants
11.6
11.6
16.2%
25.3%
37.3%
46.3%
43.8%
59.9%
2002
2012
2020
2025
Below Baseline Scenario
Above Baseline Scenario
Baseline scenario: 4.6% GDP growth
Below baseline scenario: 4.2% GDP growth
Above baseline scenario: 5.3% GDP growth
Middle class: Monthly household income between 3.2MW and 13MW
(MW) Minimum wage in Colombia 2013: US $333. Source: Fedesarrollo
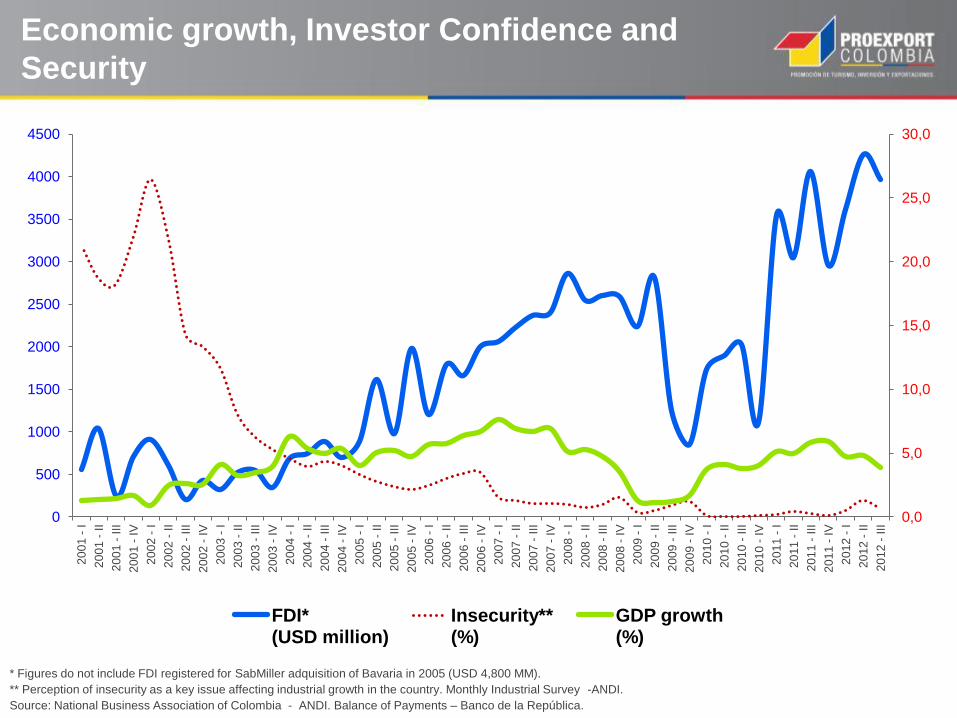
* Figures do not include FDI registered for SabMiller adquisition of Bavaria in 2005 (USD 4,800 MM).
** Perception of insecurity as a key issue affecting industrial growth in the country. Monthly Industrial Survey -ANDI.
Source: National Business Association of Colombia - ANDI. Balance of Payments – Banco de la República.
Economic growth, Investor Confidence and
Security
0,0
5,0
10,0
15,0
20,0
25,0
30,0
0
500
1000
1500
2000
2500
3000
3500
4000
4500
20
01
- I
20
01
- II
20
01
- III
20
01
- IV
20
02
- I
20
02
- II
20
02
- III
20
02
- IV
20
03
- I
20
03
- II
20
03
- III
20
03
- IV
20
04
- I
20
04
- II
20
04
- III
20
04
- IV
20
05
- I
20
05
- II
20
05
- III
20
05
- IV
20
06
- I
20
06
- II
20
06
- III
20
06
- IV
20
07
- I
20
07
- II
20
07
- III
20
07
- IV
20
08
- I
20
08
- II
20
08
- III
20
08
- IV
20
09
- I
20
09
- II
20
09
- III
20
09
- IV
20
10
- I
20
10
- II
20
10
- III
20
10
- IV
20
11
- I
20
11
- II
20
11
- III
20
11
- IV
20
12
- I
20
12
- II
20
12
- III
FDI* (USD million)
Insecurity** (%)
GDP growth (%)
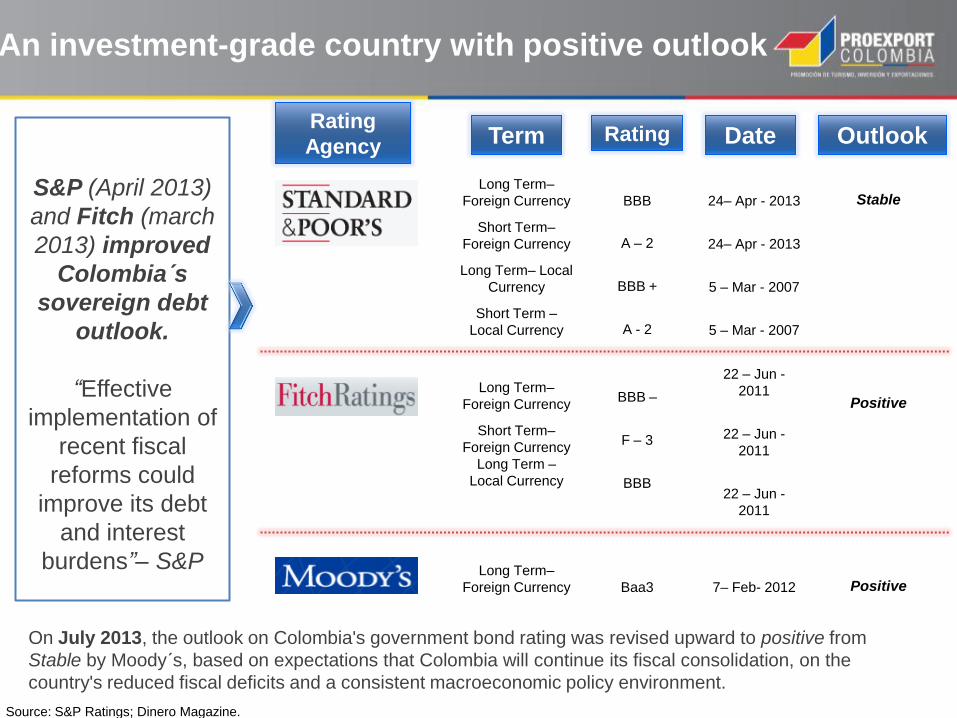
An investment-grade country with positive outlook
Long Term–
Foreign Currency Positive
Baa3
7– Feb- 2012
S&P (April 2013)
and Fitch (march
2013) improved
Colombia´s
sovereign debt
outlook.
“Effective
implementation of
recent fiscal
reforms could
improve its debt
and interest
burdens”– S&P
On July 2013, the outlook on Colombia's government bond rating was revised upward to positive from
Stable by Moody´s, based on expectations that Colombia will continue its fiscal consolidation, on the
country's reduced fiscal deficits and a consistent macroeconomic policy environment.
Rating Date Rating
Agency
Long Term–
Foreign Currency
Short Term–
Foreign Currency
Long Term– Local
Currency
Short Term –
Local Currency
Outlook
Stable
BBB
A – 2
BBB +
A - 2
24– Apr - 2013
24– Apr - 2013
5 – Mar - 2007
5 – Mar - 2007
Term
Long Term–
Foreign Currency
Short Term–
Foreign Currency
Long Term –
Local Currency
Positive
BBB –
F – 3
BBB
22 – Jun -
2011
22 – Jun -
2011
22 – Jun -
2011
Source: S&P Ratings; Dinero Magazine.
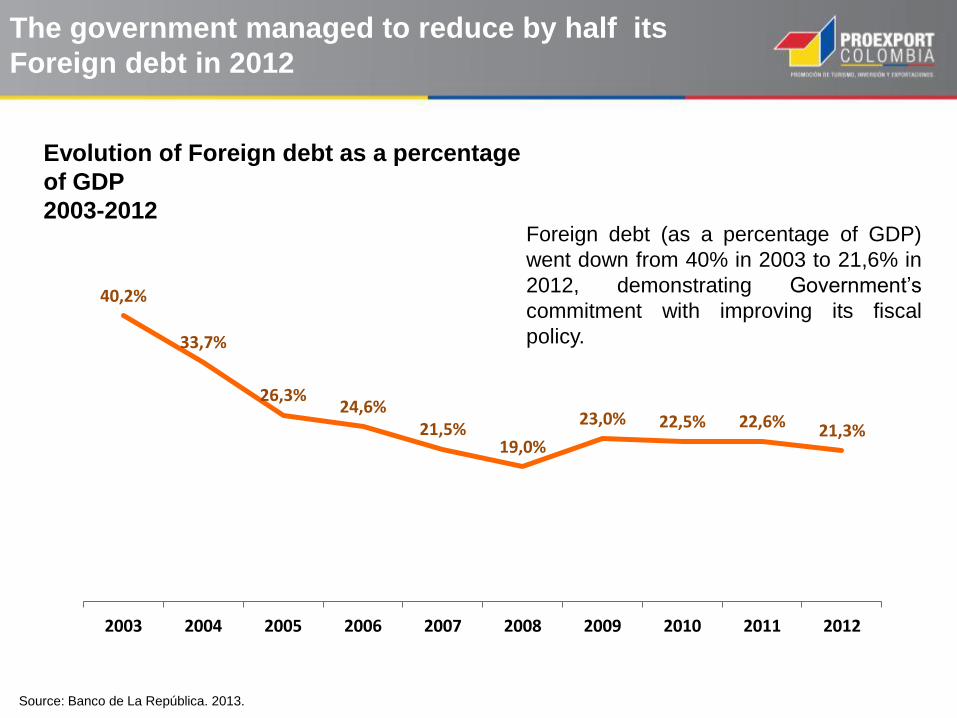
40,2%
33,7%
26,3% 24,6%
21,5% 19,0%
23,0% 22,5% 22,6% 21,3%
2003 2004 2005 2006 2007 2008 2009 2010 2011 2012
0%
5%
10%
15%
20%
25%
30%
35%
40%
45%
The government managed to reduce by half its
Foreign debt in 2012
Source: Banco de La República. 2013.
Foreign debt (as a percentage of GDP)
went down from 40% in 2003 to 21,6% in
2012, demonstrating Government’s
commitment with improving its fiscal
policy.
Evolution of Foreign debt as a percentage
of GDP
2003-2012

Higher
Risk
The risk perception of Colombia continues to improve
and is one of the lowest in the region
97,23bp 119,43bp 120,07bp 130,05bp 130,06bp 1.118,77bp
CDS*
Index
Average
2012
The current low risk perception is a
recognition of positive behavior of the
Colombian economy in recent years.
*Credit Default Swaps Index. Measures the difference between the interest rate paid over a Colombian bond in dollars abroad against the
interest rate paid for a US bond. The smaller the difference the lowest the risk in the country.
Source: Bloomberg, 2013
Chile
Argentina
Mexico Colombia
Peru
Brasil
50
70
90
110
130
150
170
190
210
230
250
ene/1
1
ene/1
1
feb/1
1
mar/
11
mar/
11
abr/
11
may/
11
may/
11
jun/1
1
jul/11
ago/1
1
ago/1
1
sep/1
1
oct/11
oct/11
nov/1
1
dic
/11
dic
/11
ene/1
2
feb/1
2
feb/1
2
mar/
12
abr/
12
abr/
12
may/
12
jun/1
2
jul/12
jul/12
ago/1
2
sep/1
2
sep/1
2
oct/12
nov/1
2
nov/1
2
dic
/12
Colombia
Brazil
Chile
Mexico
Peru
Francia
153,23bp
France

Top reformer in Latin America to improve the business
environment according to the World Bank’s ranking
Source: Doing Business 2013 – World Bank
* Total countries: 185
** Positive numbers indicate improvements in business environment
Doing Business Ranking**
2008 – 2013
Change in the number of positions
30
16
8
7
3
0
-2
-8
-13
-21
Colombia
Panama
Costa Rica
Mexico
Peru
Venezuela
Ecuador
Brazil
Chile
Argentina
Country Ranking
2013*
Chile 37
Peru 43
Colombia 45
Mexico 48
Panama 61
Costa Rica 110
Argentina 124
Brazil 130
Ecuador 139
Venezuela 180

Source: Doing Business Report – World Bank. 2013.
6 Colombia
13 Peru
32 Chile
49 México
82 Brazil
82 Panama
117 Argentina
181 Venezuela
Colombia is the leader in terms of Investor Protection
in the region, and sixth world wide
8,3 7,7
6,3 6,0 5,3 5,3
4,7
2,3
Co
lom
bia
Pe
ru
Ch
ile
Mex
ico
Bra
zil
Pan
ama
Arg
enti
na
Ven
ezu
ela
Investor Protection Index
Doing Business - 2013
World
Ranking Country
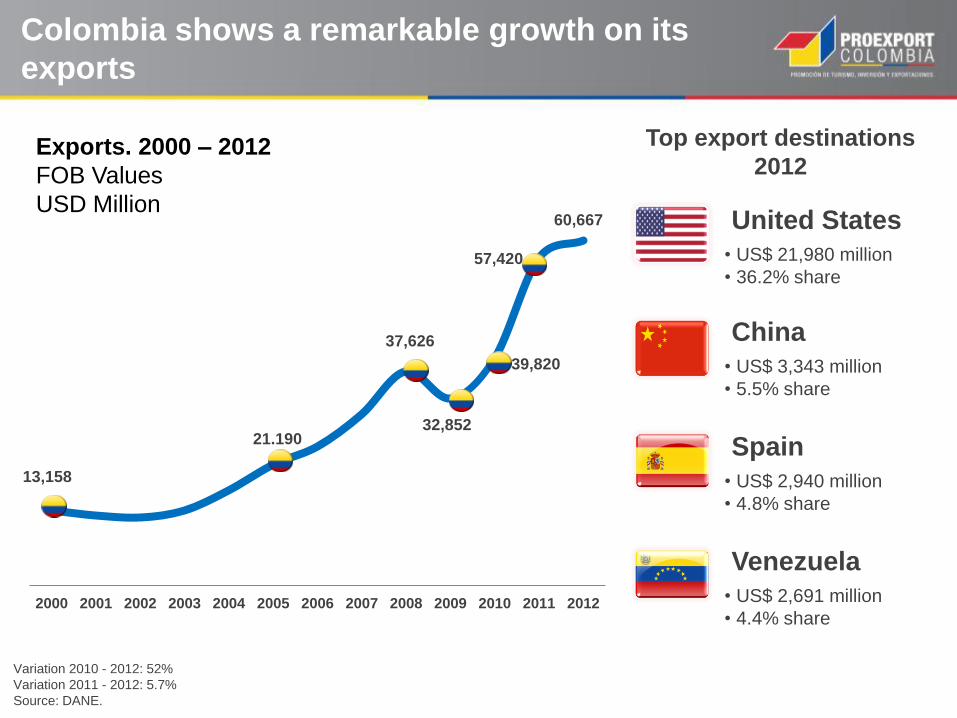
Colombia shows a remarkable growth on its
exports
Variation 2010 - 2012: 52%
Variation 2011 - 2012: 5.7%
Source: DANE.
Exports. 2000 – 2012
FOB Values
USD Million
13,158
21.190
37,626
32,852
39,820
57,420
60,667
2000 2001 2002 2003 2004 2005 2006 2007 2008 2009 2010 2011 2012
Top export destinations
2012
United States
• US$ 21,980 million
• 36.2% share
Spain
• US$ 2,940 million
• 4.8% share
China
• US$ 3,343 million
• 5.5% share
Venezuela
• US$ 2,691 million
• 4.4% share

Imports also have increased rapidly
Variation 2011 – 2012: 7.2%
Source: DANE
11,757
21,204
39,669
32,830
54,675
58,632
2000 2001 2002 2003 2004 2005 2006 2007 2008 2009 2010 2011 2012
Top imports by origin 2012 Imports, 2000 – 2012
USD Million
United States
• US $14,062 million
• 24% share
Mexico
• US$ 6,362 million
• 11% share
China
• US$ 9,565 million
• 16% share
Brazil
• US$ 2,796 million
• 4.8% share
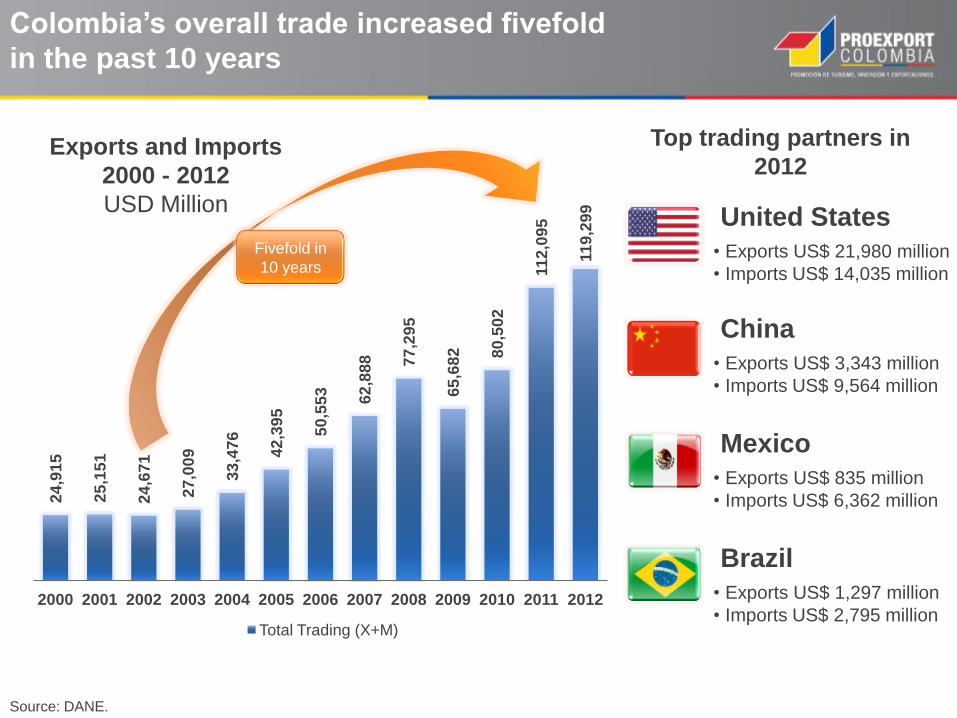
Colombia’s overall trade increased fivefold
in the past 10 years
Source: DANE.
Exports and Imports
2000 - 2012
USD Million
24
,91
5
25
,15
1
24
,67
1
27
,00
9
33
,47
6
42
,39
5
50
,55
3
62
,88
8
77
,29
5
65
,68
2
80
,50
2
11
2,0
95
11
9,2
99
2000 2001 2002 2003 2004 2005 2006 2007 2008 2009 2010 2011 2012
Total Trading (X+M)
Top trading partners in
2012
United States
• Exports US$ 21,980 million
• Imports US$ 14,035 million
Mexico
• Exports US$ 835 million
• Imports US$ 6,362 million
China
• Exports US$ 3,343 million
• Imports US$ 9,564 million
Brazil
• Exports US$ 1,297 million
• Imports US$ 2,795 million
Fivefold in
10 years
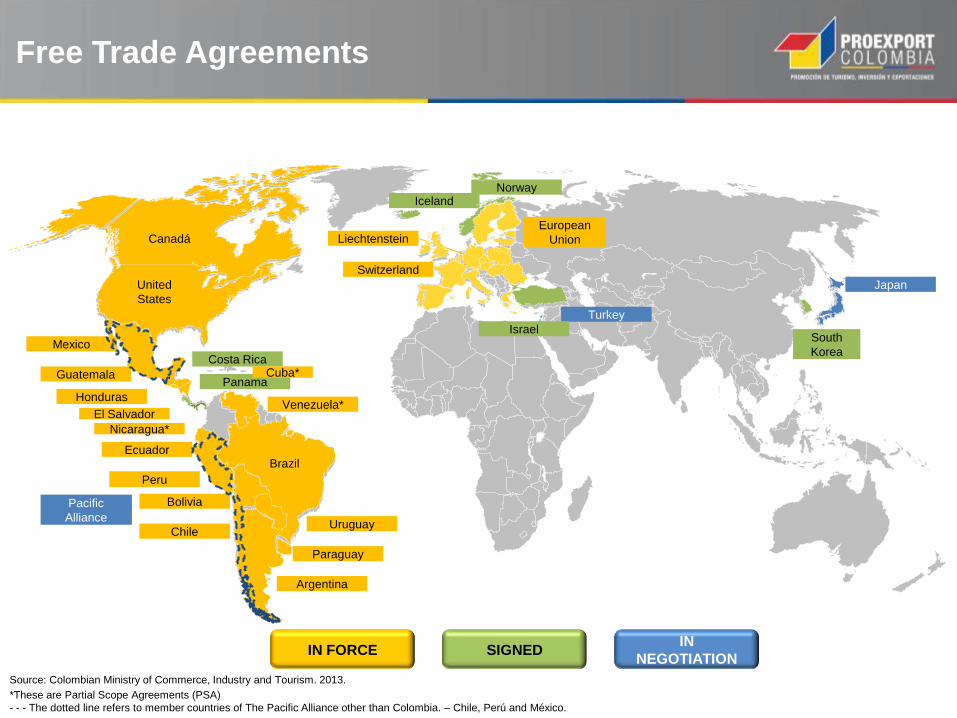
IN FORCE SIGNED IN
NEGOTIATION
Canadá
United
States
Mexico
Guatemala
Honduras
El Salvador
Ecuador Brazil
Peru
Argentina
Paraguay
Uruguay
Liechtenstein
Switzerland
Iceland Norway
European
Union
Turkey
Israel
Japan
Source: Colombian Ministry of Commerce, Industry and Tourism. 2013.
Free Trade Agreements
Panama
Chile
Bolivia
Costa Rica
Venezuela*
Pacific
Alliance
South
Korea
Nicaragua*
Cuba*
*These are Partial Scope Agreements (PSA)
- - - The dotted line refers to member countries of The Pacific Alliance other than Colombia. – Chile, Perú and México.
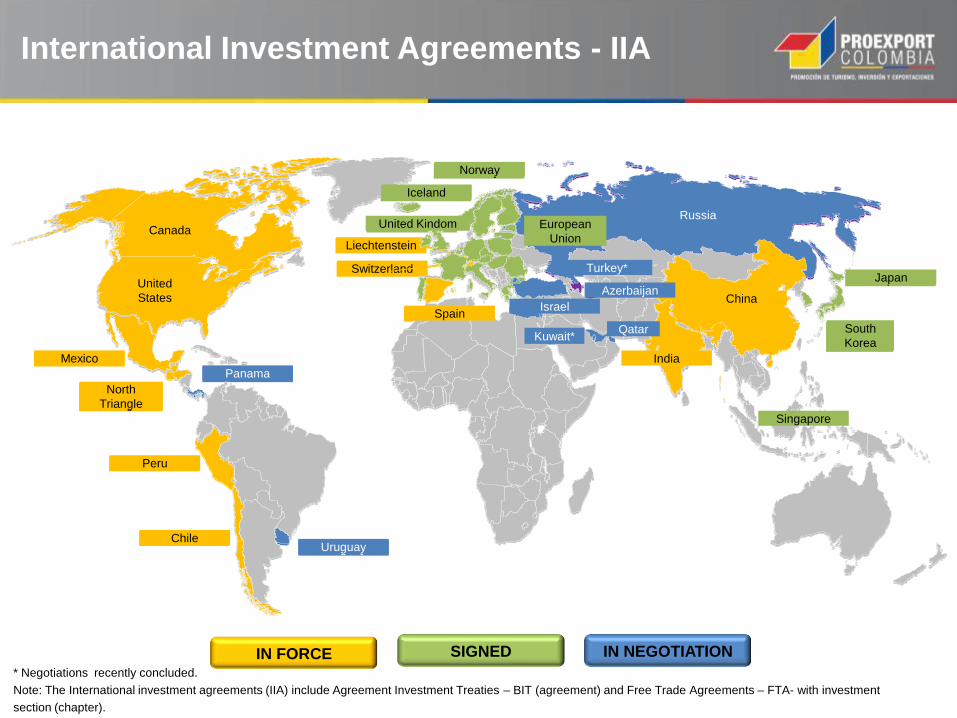
IN FORCE SIGNED IN NEGOTIATION
* Negotiations recently concluded.
Note: The International investment agreements (IIA) include Agreement Investment Treaties – BIT (agreement) and Free Trade Agreements – FTA- with investment
section (chapter).
International Investment Agreements - IIA
Canada
Peru
Mexico
Spain
Switzerland
Liechtenstein
Chile
India
North
Triangle
United
States
South
Korea
Japan
Iceland
Norway
United Kindom European
Union
Turkey
Panama
Kuwait
Israel
Uruguay
Russia
Azerbaijan
Canada
Peru
Mexico
Spain
Switzerland
Liechtenstein
Chile
China
India
North
Triangle
South
Korea
Japan United
States
Iceland
Norway
United Kindom European
Union
Turkey*
Panama
Kuwait*
Russia
Israel
Singapore
Uruguay
Azerbaijan
Qatar
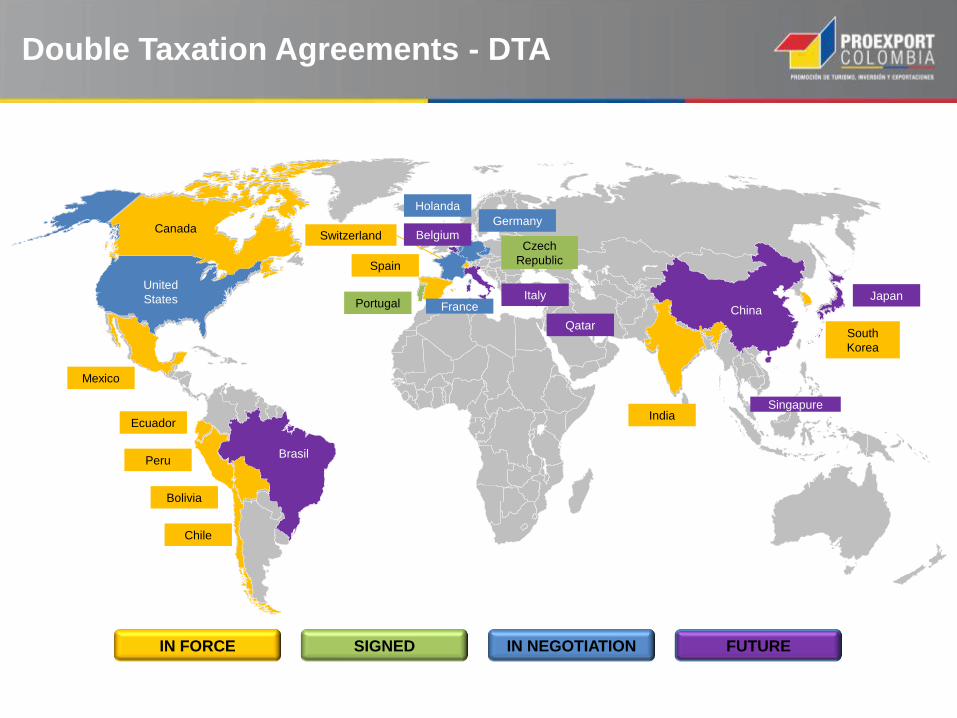
IN FORCE SIGNED IN NEGOTIATION
Ecuador
Peru
Bolivia
Spain
Chile
Switzerland Canada
Mexico
South
Korea
India
Japan
Germany
Czech
Republic
Holanda
Belgium
Portugal France
United
States
Double Taxation Agreements - DTA
FUTURE
Qatar
Italy
China
Brasil
Singapure
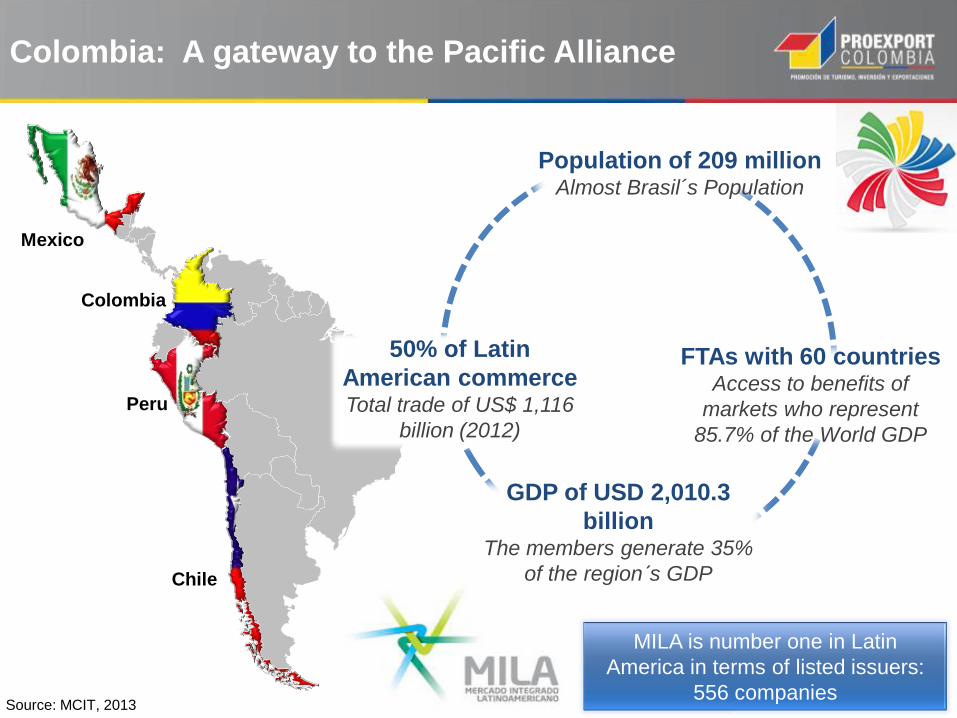
Mexico
Colombia
Peru
Chile
GDP of USD 2,010.3
billion The members generate 35%
of the region´s GDP
Population of 209 million Almost Brasil´s Population
50% of Latin
American commerce Total trade of US$ 1,116
billion (2012)
Source: MCIT, 2013
FTAs with 60 countries Access to benefits of
markets who represent
85.7% of the World GDP
Colombia: A gateway to the Pacific Alliance
MILA is number one in Latin
America in terms of listed issuers:
556 companies
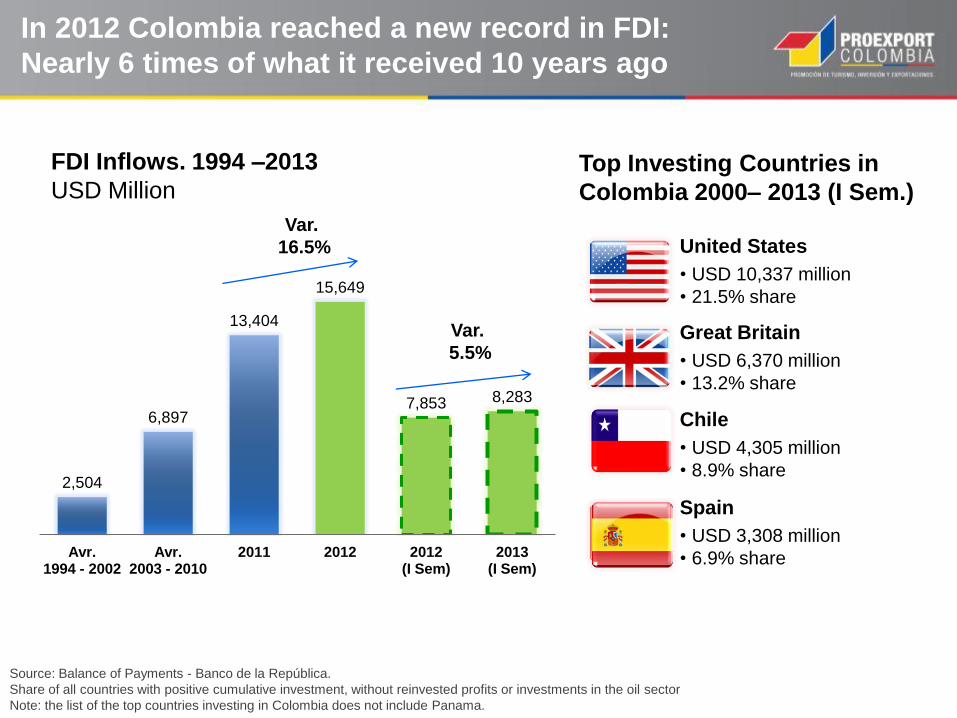
Top Investing Countries in
Colombia 2000– 2013 (I Sem.)
In 2012 Colombia reached a new record in FDI:
Nearly 6 times of what it received 10 years ago
United States
• USD 10,337 million
• 21.5% share
Spain
• USD 3,308 million
• 6.9% share
Great Britain
• USD 6,370 million
• 13.2% share
Chile
• USD 4,305 million
• 8.9% share
FDI Inflows. 1994 –2013
USD Million
2,504
6,897
13,404
15,649
7,853 8,283
Avr. 1994 - 2002
Avr. 2003 - 2010
2011 2012 2012 (I Sem)
2013 (I Sem)
Var.
16.5%
Var.
5.5%
Source: Balance of Payments - Banco de la República.
Share of all countries with positive cumulative investment, without reinvested profits or investments in the oil sector
Note: the list of the top countries investing in Colombia does not include Panama.

Colombia was among the top 20 destinations of FDI
in the world in 2012
According to The World Investment Report -UNCTAD Colombia is one of the
top twenty host economies for FDI in the world with USD 16 billion in 2012.
168
121
75
65
65
62
57
57
51
45
30
29
28
28
26
25
20
16
14
14
1; Estados Unidos
2; China
3; Hong Kong (China)
4; Brazil
5; Islas Virgenes (GB)
6; Reino Unido
7; Australia
8; SIngapore
9; Rusia
10; Canada
11; Chile
12; Irlanda
13; Luxemburgo
14; España
15; India
16; Francia
17; Indonesia
18; Colombia
19; Kazakhstan
20; Suecia
Source: World Investment Report, Overview 2013 and fDiMarkets, Global Greenfield Investement Trends. 2013
During 2012 Colombia attracted 93
Greenfield projects making it the third
country in the region in terms of the
number of projects
Colombia is the third destination
for FDI in Latin America with
USD 15,612 Million

Colombia was officially invited on May 2013 to initiate
the process to become full member of the OECD
OECD Investment Policy Review (February, 2012)
recognizes Colombia´s progress in pursuing policy
reforms to promote investment liberalization and
improving the business climate
“The review
examines
Colombia's
achievements in
developing an
open and
transparent
investment regime
and its efforts to
reduce
restrictions on
international
investment” OECD
As an adherent to the Declaration, Colombia:
I
II
III
Commits to treating foreign investors in the same way as
domestic investors and to promoting responsible business
conduct, in line with the Guidelines for Multinational
Enterprises
Colombia’s adherence provides further international support
for the principles of sound investment policy and corporate
responsibility laid down in the Declaration.
In turn, the country benefits from similar and fairly treatment
from other adherents.
Source: OECD, 2012.

2 3 4 1
Source: Banco de la Republica - Balance of Payments
The stock of Colombia’s outward FDI has grown
nine-fold since 1994
FDI outflows by sectors,
1994 - 2012
Industry 26%
Financial services
25%
Oil & Mining 21%
Electricity, gas & water
12%
Transport & communication
7%
Commerce, restaurants &
hotels 6%
Others 3%
United States
• USD 6,452 million
• 20% Share
United Kingdom
• USD 5,078 million
• 16% Share
Panama
• USD 3,904 million
• 12% Share
Mexico
• USD 2,403 million
• 7% Share
Stock of outward FDI. 1994 - 2012
USD Millions
3,652
32,134
Stock 1994 - 2002
Stock 1994 - 2012
492
1,445
2012 - 1 Sem 2013 - 1 Sem
Total FDI: US$ 32,134
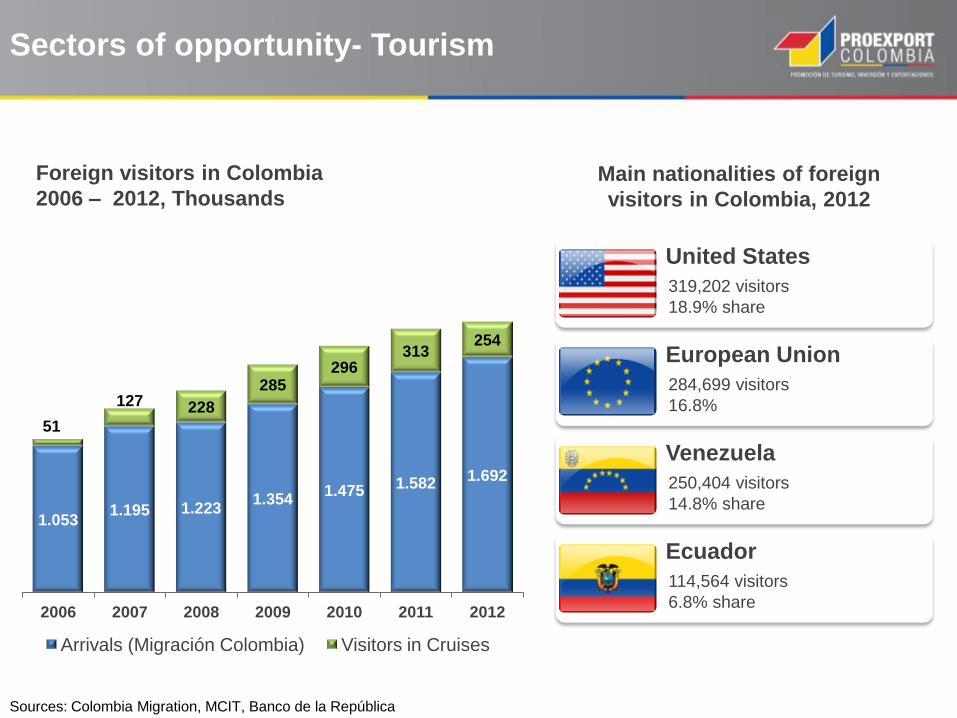
1.053 1.195 1.223
1.354 1.475 1.582
1.692
51
127 228
285 296
313 254
2006 2007 2008 2009 2010 2011 2012
Arrivals (Migración Colombia) Visitors in Cruises
Sectors of opportunity- Tourism
Foreign visitors in Colombia
2006 – 2012, Thousands Main nationalities of foreign
visitors in Colombia, 2012
United States
• 319,202 visitors
• 18.9% share
European Union
• 284,699 visitors
• 16.8%
Venezuela
• 250,404 visitors
• 14.8% share
Ecuador
• 114,564 visitors
• 6.8% share
Sources: Colombia Migration, MCIT, Banco de la República
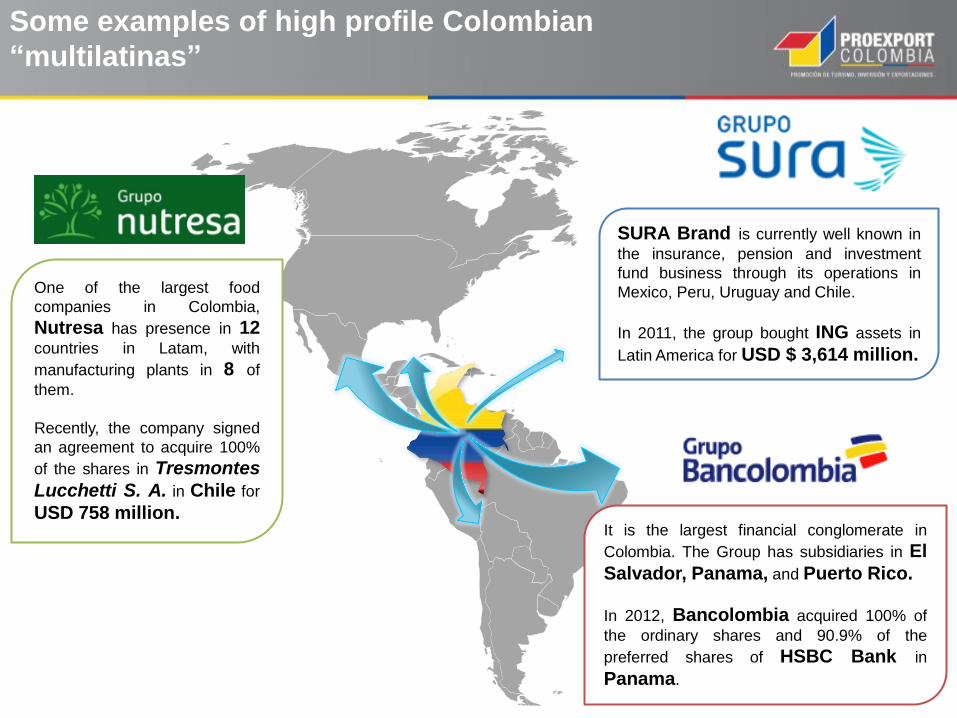
One of the largest food
companies in Colombia,
Nutresa has presence in 12
countries in Latam, with
manufacturing plants in 8 of
them.
Recently, the company signed
an agreement to acquire 100%
of the shares in Tresmontes
Lucchetti S. A. in Chile for
USD 758 million.
SURA Brand is currently well known in
the insurance, pension and investment
fund business through its operations in
Mexico, Peru, Uruguay and Chile.
In 2011, the group bought ING assets in
Latin America for USD $ 3,614 million.
It is the largest financial conglomerate in
Colombia. The Group has subsidiaries in El
Salvador, Panama, and Puerto Rico.
In 2012, Bancolombia acquired 100% of
the ordinary shares and 90.9% of the
preferred shares of HSBC Bank in
Panama.
Some examples of high profile Colombian
“multilatinas”

Colombia is ranked among the top 20 oil-producing countries in the world with over one
million barrels per day. International Energy Agency, 2013.
Sectors of opportunity- Energy
Colombia is Latin America´s second largest producer of biofuels
0.53 0.59 0.67
0.79 0.91 0.94 1.00 1.03 1.10
1.24
2007 2008 2009 2010 2011 2012 2Q 2013 E 2013 E 2014 E 2018
Oil Production in Colombia and Forecast Million Barrels per Day
Colombia was ranked first in Latin America and sixth in the world according to the “Energy
Architecture Performance Index 2013 Rankings” WEF, 2013.
Total expected hydroelectric capacity is expected to reach 18,653 MW in 2018

Sectors of Opportunity- Infrastructure & Logistics
Colombia’s largest public investment initiative
estimated at USD$ 24.4 billion and 8,170 Km of roads to be constructed or improved. ANI, 2013.
The Government aims
to increase port
capacity by 70% through the
expansion of the
existing ports, the
construction of
public service ports and
the dredging of the
access channels.
Source: National Infrastructure Agency (ANI), 2013
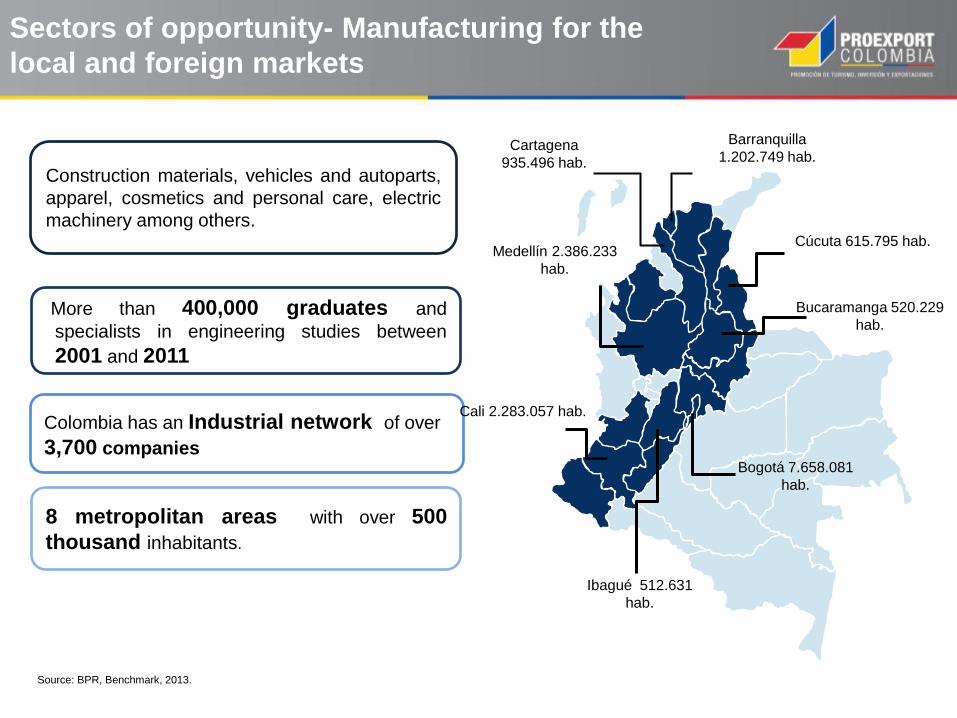
Construction materials, vehicles and autoparts,
apparel, cosmetics and personal care, electric
machinery among others.
Colombia has an Industrial network of over
3,700 companies
Sectors of opportunity- Manufacturing for the
local and foreign markets
Source: BPR, Benchmark, 2013.
More than 400,000 graduates and
specialists in engineering studies between
2001 and 2011
Medellín 2.386.233
hab.
Cali 2.283.057 hab.
Barranquilla
1.202.749 hab.
Bogotá 7.658.081
hab.
Cartagena
935.496 hab.
Cúcuta 615.795 hab.
Ibagué 512.631
hab.
Bucaramanga 520.229
hab.
8 metropolitan areas with over 500
thousand inhabitants.

Sectors of opportunity - Services
Colombia has become an exports platform to LATAM, USA and
Europe offering voice and back office BPO, ITO, KPO services in
Spanish, English and Portuguese.
5 submarine cables capable of generating
a band width of more than 550 Gbps.

Labor incentives
New employees under twenty eight (28) years old. Length of benefit by employee: 2 years.
1.
Discount in the income tax and supplementary contributions, and other contributions from payroll
(Do not include positions generated by mergers or replacements)
New employees certified in displacement situation, reintegration or disability. Length of benefit by employee: 3 years.
2.
New women employees above 40 years old with more than 1 year unemployed. Length of benefit by employee: 2 years.
3.
New employees with incomes lower than 1.5 Minimum Wages (US$ 476). Length of benefit by employee : 2 years
4.
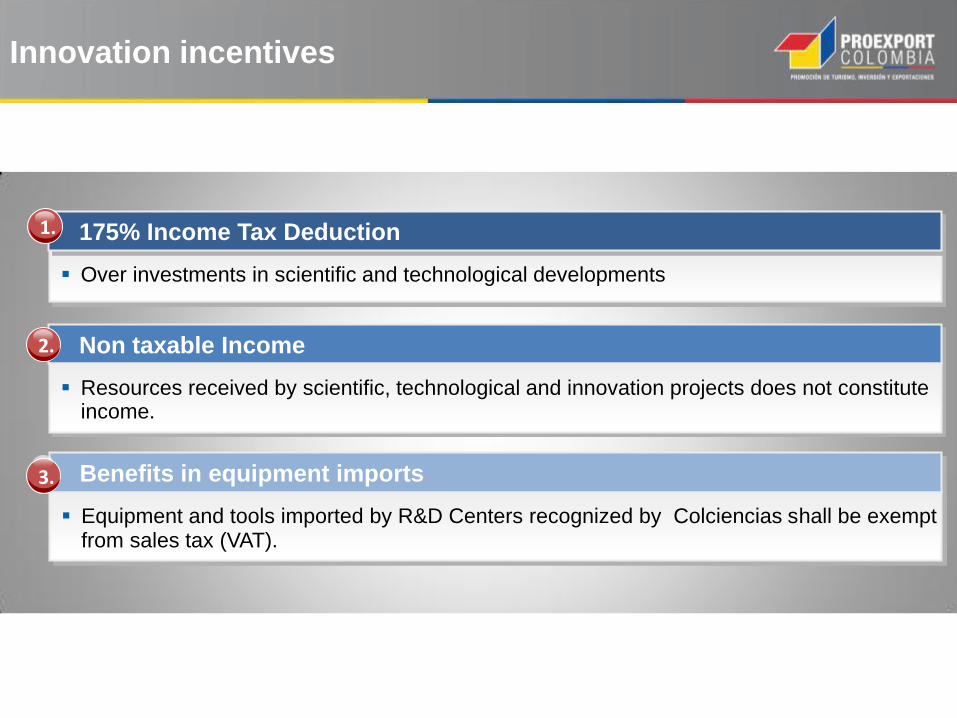
Innovation incentives
Non taxable Income
Benefits in equipment imports
Resources received by scientific, technological and innovation projects does not constitute income.
Equipment and tools imported by R&D Centers recognized by Colciencias shall be exempt from sales tax (VAT).
Over investments in scientific and technological developments
175% Income Tax Deduction 1.
2.
3.
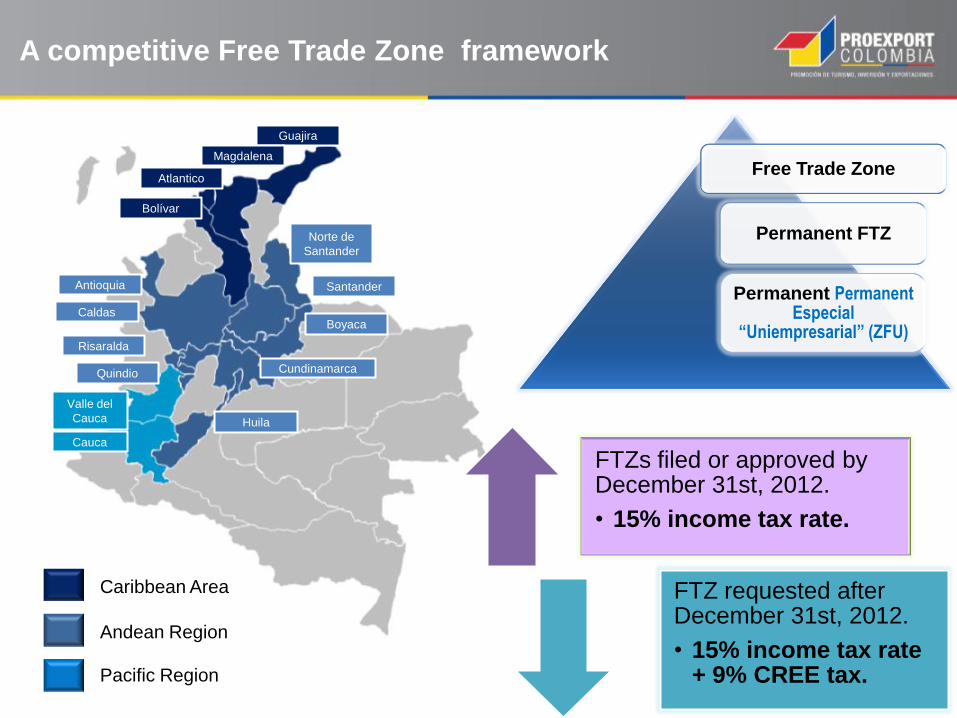
A competitive Free Trade Zone framework
Guajira
Magdalena
Atlantico
Bolívar
Valle del
Cauca
Cauca
Norte de
Santander
Santander
Boyaca
Cundinamarca
Huila
Antioquia
Caldas
Risaralda
Quindio
Caribbean Area
Andean Region
Pacific Region
Free Trade Zone
Permanent FTZ
Permanent Permanent Especial
“Uniempresarial” (ZFU)
FTZs filed or approved by December 31st, 2012.
• 15% income tax rate.
FTZ requested after December 31st, 2012.
• 15% income tax rate + 9% CREE tax.
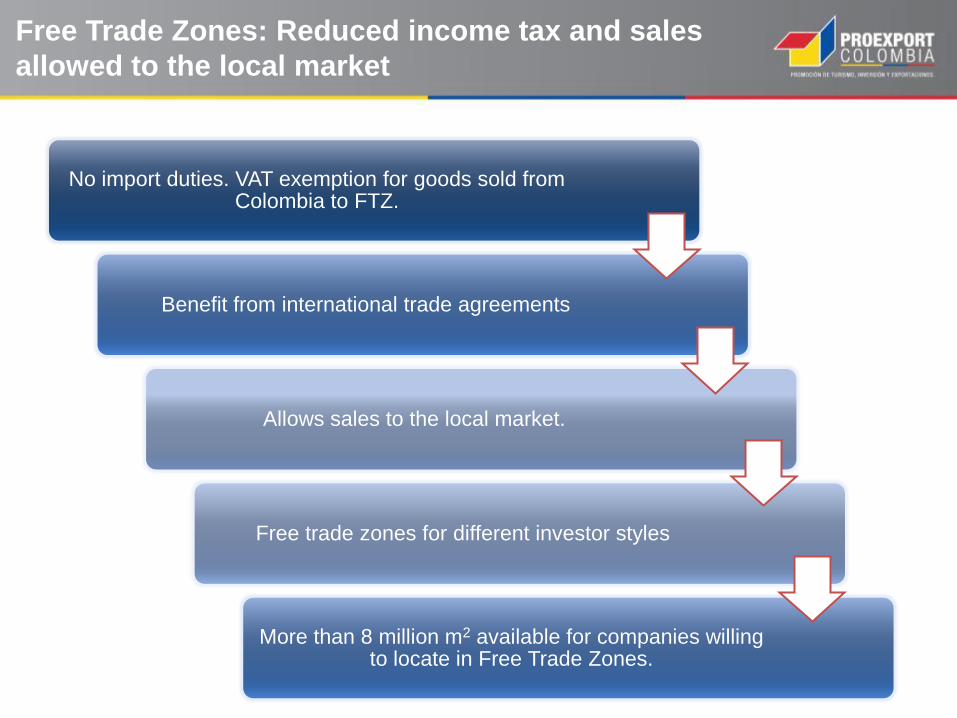
Free Trade Zones: Reduced income tax and sales
allowed to the local market
No import duties. VAT exemption for goods sold from Colombia to FTZ.
Benefit from international trade agreements
Allows sales to the local market.
Free trade zones for different investor styles
More than 8 million m2 available for companies willing to locate in Free Trade Zones.

Incentives by sector: up to 20 years of income tax
exemption
• Exemption for 30 years for those who invest in the construction or renovation of hotels between January 1st, 2003 and December 31, 2017.
Tourism
• Exemption for 20 years starting from 2003. Eco-tourism
• Exemption for 10 years after the beginning of production in crops planted between 2003 and 2014. Late yield crops
• Permanent exemption for investment in new forest plantations, sawmilling and timber plantations. Forestry
• Publishing of books, magazines, booklets or collections of scientific or cultural characteristics are exempt until 2013. Editorial
• Exemption for 5 years for software developed in Colombia with high scientific and technological research content. The exemption begins on January 1st, 2013.
Software
• Exemption for 15 years for sale (by the generators) of electricity based on wind resources, biomass or agricultural waste. Renewable energy
• Exemption for 15 years starting from 2003 to provide services in slabs and boats with net weight below 25 tons. River transport
• 175% income tax deduction over investments in scientific and technological developments.
Research and Technological Development
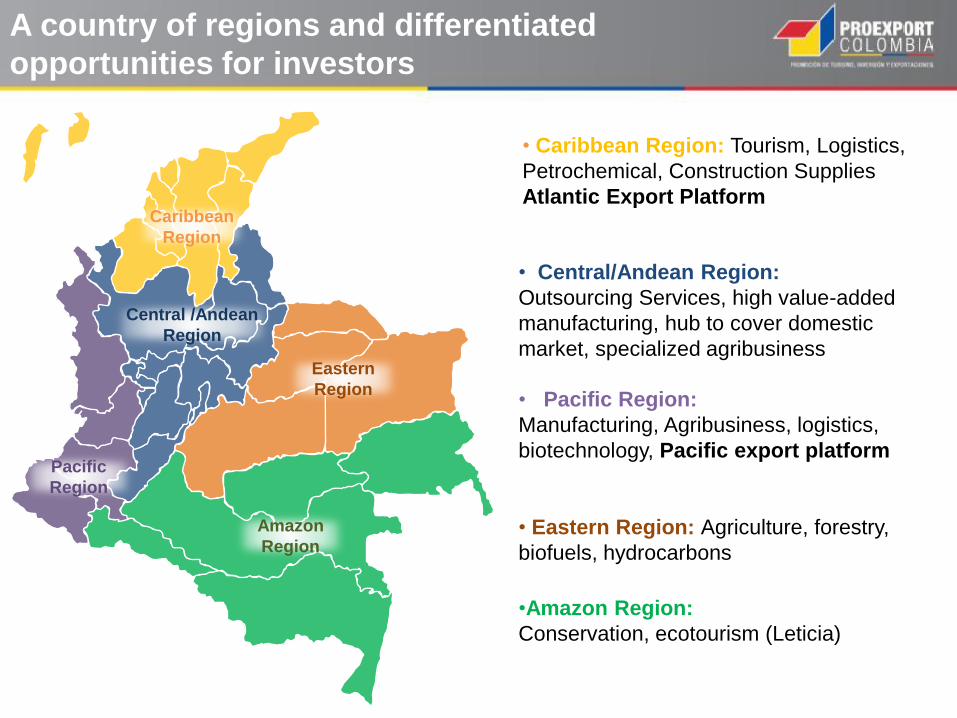
A country of regions and differentiated
opportunities for investors
• Caribbean Region: Tourism, Logistics,
Petrochemical, Construction Supplies
Atlantic Export Platform
• Central/Andean Region:
Outsourcing Services, high value-added
manufacturing, hub to cover domestic
market, specialized agribusiness
• Pacific Region:
Manufacturing, Agribusiness, logistics,
biotechnology, Pacific export platform
• Eastern Region: Agriculture, forestry,
biofuels, hydrocarbons
•Amazon Region:
Conservation, ecotourism (Leticia)
Eastern
Region
Pacific
Region
Caribbean
Region
Central /Andean
Region
Amazon
Region

Automotive
Cosmetics,
Toiletries and
Cleaning
Products
IT and
BPO&O Agribusiness
Oil Products
and
Services
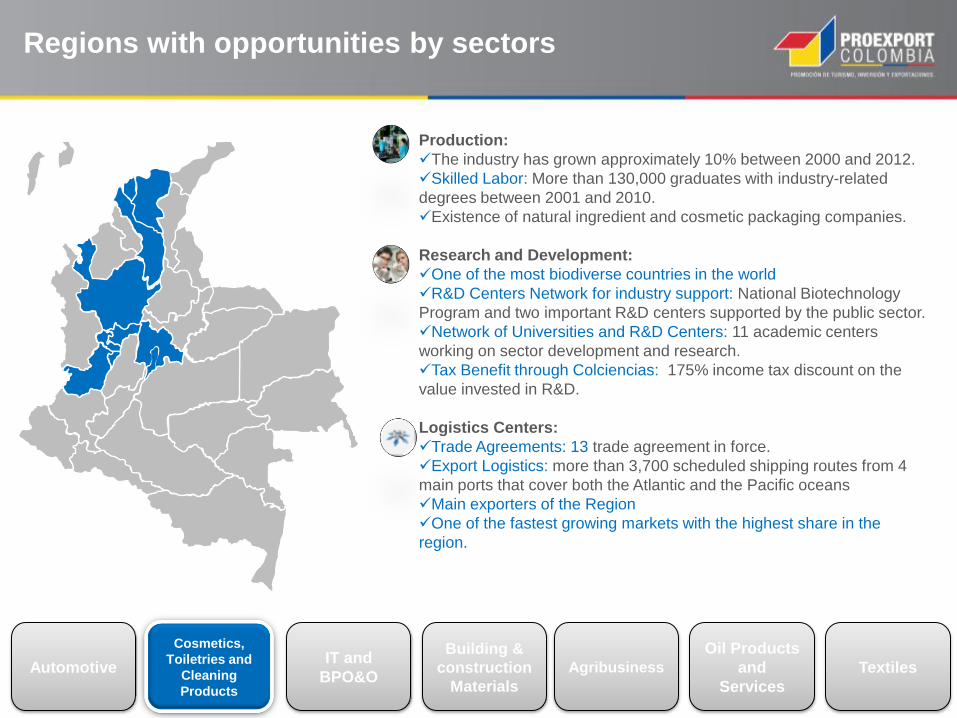
Regions with opportunities by sectors
Building &
construction
Materials
Textiles
Assembly:
Colombia ranks as fifth largest producer of the region
with a high growing potential. This sector employs 2.6%
of manufacturing labor force in Colombia.
Presence of international assembly plants: Renault,
General Motors, Mazda, Toyota – Hino, Busscar,
Superpolo and Daewoo Bus.
Auto parts
Will reach a car fleet of almost 4 million units.
Creation and construction of a technological
development center for industry strengthening.
Domestic and foreign companies certified according to
the highest international standards.
Automotive
Cosmetics,
Toiletries and
Cleaning
Products
IT and
BPO&O Agribusiness
Oil Products
and
Services
Regions with opportunities by sectors
Building &
construction
Materials
Textiles
Production:
The industry has grown approximately 10% between 2000 and 2012.
Skilled Labor: More than 130,000 graduates with industry-related
degrees between 2001 and 2010.
Existence of natural ingredient and cosmetic packaging companies.
Research and Development:
One of the most biodiverse countries in the world
R&D Centers Network for industry support: National Biotechnology
Program and two important R&D centers supported by the public sector.
Network of Universities and R&D Centers: 11 academic centers
working on sector development and research.
Tax Benefit through Colciencias: 175% income tax discount on the
value invested in R&D.
Logistics Centers:
Trade Agreements: 13 trade agreement in force.
Export Logistics: more than 3,700 scheduled shipping routes from 4
main ports that cover both the Atlantic and the Pacific oceans
Main exporters of the Region
One of the fastest growing markets with the highest share in the
region.

Automotive
Cosmetics,
Toiletries and
Cleaning
Products
IT and
BPO&O Agribusiness
Oil Products
and
Services
Regions with opportunities by sectors
Building &
construction
Materials
Textiles
BPO
Creation of Shared Services Centers for Latin America.
Opportunities for Outsourcing Companies that provide
Costumer Care, ESO, FAO, HRO, Telemedicine, and
R&D services
Software & IT Services
Development and integration of IT Services and
Applications.
M&A and Software Factories
Creation of Data Centers
Telecommunications
Provide Telecommunications Services for growing
markets and strengthen Telecommunications
Infrastructure.
Automotive
Cosmetics,
Toiletries and
Cleaning
Products
IT and
BPO&O Agribusiness
Oil Products
and
Services
Regions with opportunities by sectors
Building &
construction
Materials
Textiles
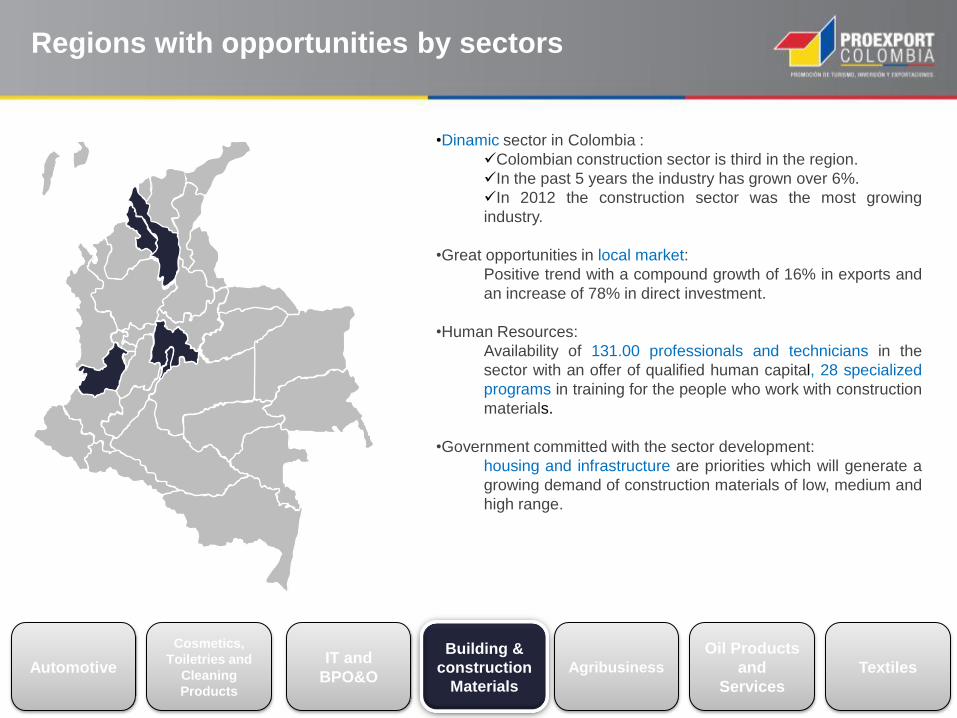
•Dinamic sector in Colombia :
Colombian construction sector is third in the region.
In the past 5 years the industry has grown over 6%.
In 2012 the construction sector was the most growing
industry.
•Great opportunities in local market:
Positive trend with a compound growth of 16% in exports and
an increase of 78% in direct investment.
•Human Resources:
Availability of 131.00 professionals and technicians in the
sector with an offer of qualified human capital, 28 specialized
programs in training for the people who work with construction
materials.
•Government committed with the sector development:
housing and infrastructure are priorities which will generate a
growing demand of construction materials of low, medium and
high range.
Automotive
Cosmetics,
Toiletries and
Cleaning
Products
IT and
BPO&O Agribusiness
Oil Products
and
Services
Regions with opportunities by sectors
Building &
construction
Materials
Textiles
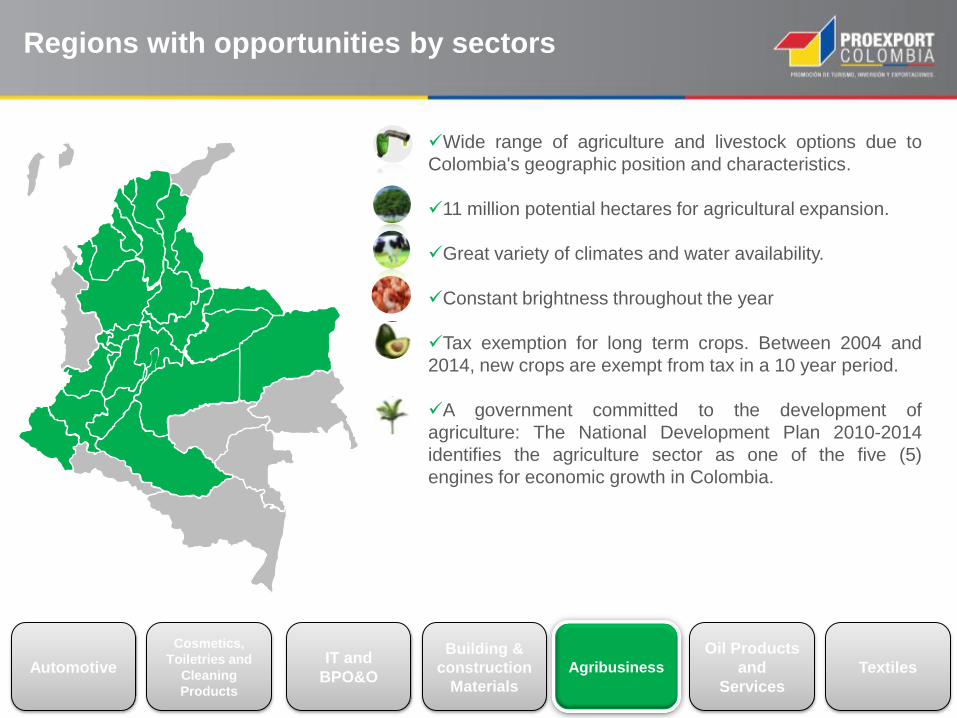
Wide range of agriculture and livestock options due to
Colombia's geographic position and characteristics.
11 million potential hectares for agricultural expansion.
Great variety of climates and water availability.
Constant brightness throughout the year
Tax exemption for long term crops. Between 2004 and
2014, new crops are exempt from tax in a 10 year period.
A government committed to the development of
agriculture: The National Development Plan 2010-2014
identifies the agriculture sector as one of the five (5)
engines for economic growth in Colombia.

Automotive
Cosmetics,
Toiletries and
Cleaning
Products
IT and
BPO&O Agribusiness
Oil Products
and
Services
Regions with opportunities by sectors
Building &
construction
Materials
Textiles
As a result of an important dynamic in Oil production, there are
plenty opportunities for growth and improvement in Products and
Services for this sector.
The Number of wells explored is expected to grow (570 by 2014)
and an annual average extraction over one million barrels of oil per
day, in 2013.
Cartagena’s Oil Refinery will begin operating its improvement plan
in 2013 with a capacity of 165,000 BDP. Together with
Barrancabermeja’s Refinery modernization, demand for refinery
related goods and services will increase .
Several investment opportunities are found over the production of
specialized, high-quality goods and over the development of high-
technological oil services.
A regional goods and services export platform can be established
to meet demands of the Venezuelan, Peruvian and Ecuadorean
markets.
In 2003, 4.8% of total wells were successfully explored. As of
today, this figure is higher than 30%.

Automotive
Cosmetics,
Toiletries and
Cleaning
Products
IT and
BPO&O Agribusiness
Oil Products
and
Services
Regions with opportunities by sectors
Building &
construction
Materials
Textiles
Research, Development and innovation
• Initiatives and incentives to promote R&D+I: COLCIENCIAS
• Public and private entities committed to innovation in the clothing
sector: INEXMODA, CIDETEXCO
Production and logistic centers
• Sector with over 100 years of tradition and experience:
Colombia has approximately 450 textile manufacturers and 10,000
apparel companies.
• Growing domestic demand of textile and apparel products.
•Government training programs for the sector:
SENA - Currently has 12 specialized programs for the sector
with national coverage.
• Export platform:
13 Free Trade Agreement with preferential access to over
1,500 consumers
• Excellent geographical location to supply the Americas.
• Air and maritime infrastructure:
Over 3.700 maritime frequencies, approximately 1.000 air
frequencies. Over 18 cargo airlines and more than 13
commercial airlines