Embed Size (px)
Citation preview
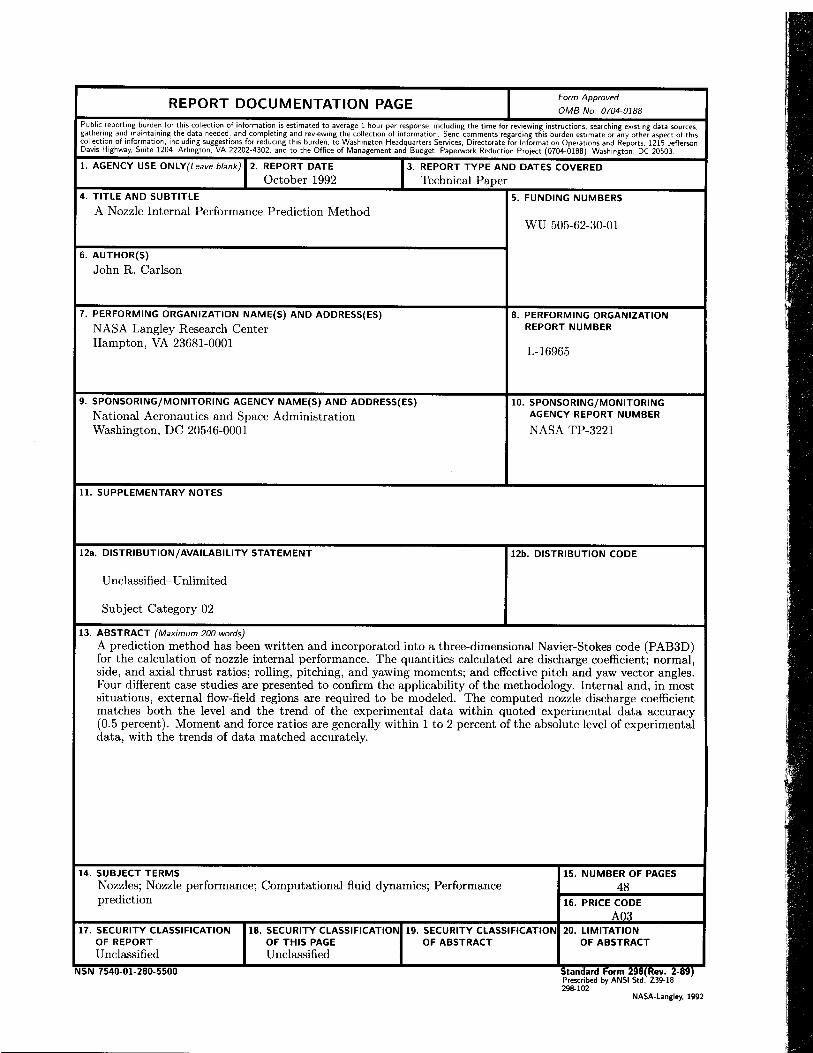
Abstract
A prediction method has been written and incorporated into a three-dimensional Navier-Stokes code (PAB3D) for the calculation of nozzleinternal performance. The quantities calculated are discharge coe�-cient; normal, side, and axial thrust ratios; rolling, pitching, and yawingmoments; and e�ective pitch and yaw vector angles. Four di�erent casestudies are presented to con�rm the applicability of the methodology. In-ternal and, in most situations, external ow-�eld regions are required tobe modeled. The computed nozzle discharge coe�cient matches both thelevel and the trend of the experimental data within quoted experimen-tal data accuracy (0.5 percent). Moment and force ratios are generallywithin 1 to 2 percent of the absolute level of experimental data, with thetrends of the data matched accurately.
Introduction
Highly maneuverable aircraft operate over powersettings and Mach numbers that require a propulsionsystem with variable geometry for obtaining e�cientperformance at di�erent throttle settings. Under-standing the e�ects of various nozzle geometries oninternal ow and on the surrounding boattail-nozzleregion is vital for designing e�cient afterbodies forthese aircraft. The development and utilization ofadvanced computational methods plays a vital rolein developing this understanding. Presently, thereare several ongoing research activities at the LangleyResearch Center directed at establishing an experi-mental data base for new nozzle concepts. Subse-quent improvements to the computational methodsare guided by these data.
A nozzle internal performance module has beenwritten, and the prediction capabilties of this mod-ule have been evaluated for a series of test cases.The module was incorporated into the Navier-Stokessolver PAB3D (ref. 1), which provides the ow-�eldsolution for the prediction subroutine. The controlvolume concept was used for the calculation of theresultant body forces due to the uid ow exitingthe nozzle (ref. 2). Forces and moments are calcu-lated from the integration of the momentum uxesthrough the volume faces. These integrations can beperformed at intermediate steps throughout the so-lution procedure to provide a ow convergence quan-tity and to monitor the ow code's computationalresiduals.
This paper presents four nozzle case studies forevaluation of the performance prediction method-olgy. Each nozzle geometry has characteristics thatrequire the calculation of di�erent ows and perfor-mance quantities for each case. Comparisons of com-puted discharge coe�cient, axial thrust ratio, resul-
tant vector angles, and pitching and yawing momentswith experimental data are presented as appropriatefor the following cases.
Case 1: The �rst case study is from the seriesof Stratford choke nozzles (ref. 3) that serves asthe calibration standard for many propulsion testingfacilities. These geometries are convergent nozzleswith a circular-arc internal closure contour throughthe throat. These nozzles have well-established mass- ow characteristics that provide a highly accuratestandard for comparisons of performance predictions.A grid convergence study of discharge coe�cient isshown for the nozzle with a throat area of 25.766 cm2
(3.992 in2) operating at a pressure ratio of 2.
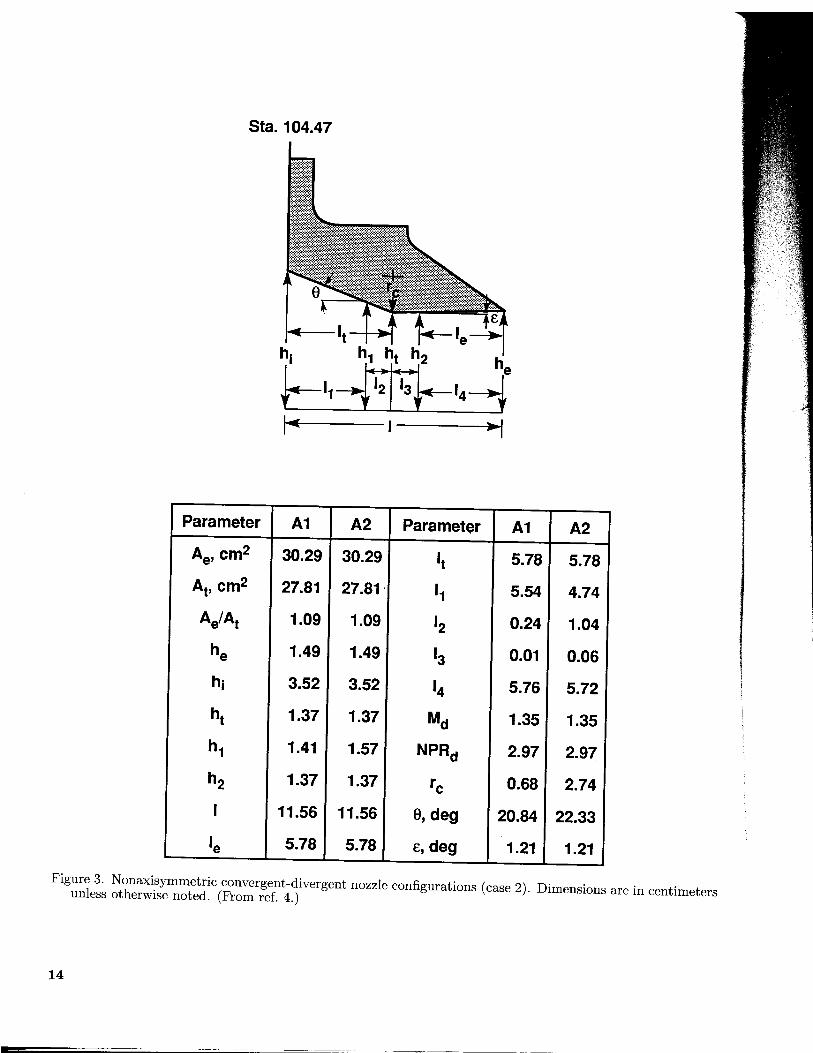
Case 2: The capability of predicting dischargecoe�cient and axial forces for a type of convergent-divergent (C-D) nozzle is veri�ed with the experi-mental data of Mason, Putnam, and Re (ref. 4).Their data were obtained on a model designed toaddress the performance characteristics due to para-metric changes of nozzle internal geometry. The noz-zle throat contour, that is, the radius of the circular-arc throat contour, was systematically changed in aseries of nonaxisymmetric C-D nozzles with parallelsidewalls. Internal static pressures, thrust ratio, anddischarge coe�cient data for various nozzle operat-ing pressure ratios were measured. Low- and high-expansion-ratio geometry nozzles were investigated.For this study, comparisons of prediction with ex-perimentally determined nozzle discharge coe�cient,thrust ratio, and centerline divergent ap static pres-sures are presented for the low-expansion-ratio noz-zles only.
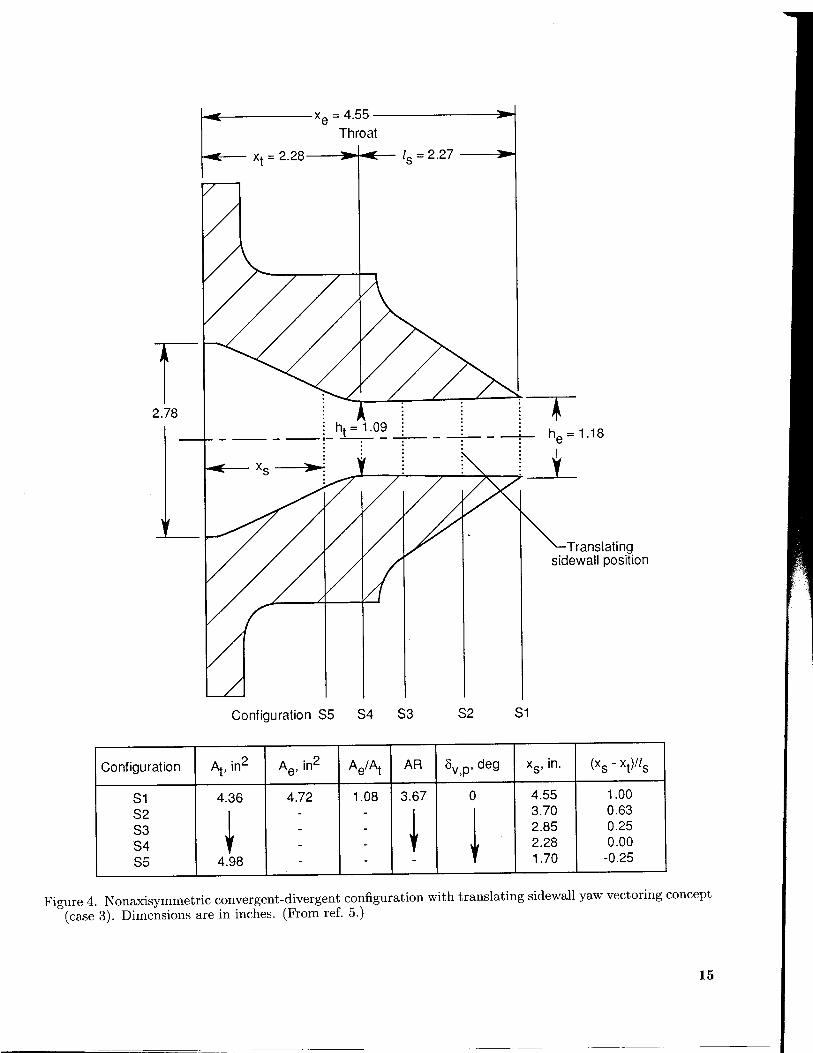
Case 3: The third geometry provided data toevaluate the prediction of side forces coupled withaxial forces. The translating sidewall yaw vectorconcept tested by Mason and Berrier (ref. 5) was one
of several yaw vector concepts on which dischargecoe�cient, thrust ratio, resultant thrust ratio, ande�ective pitch and yaw vector angles were measured.Comparisons of prediction with an experimentallydetermined e�ective yaw vector angle are presented.
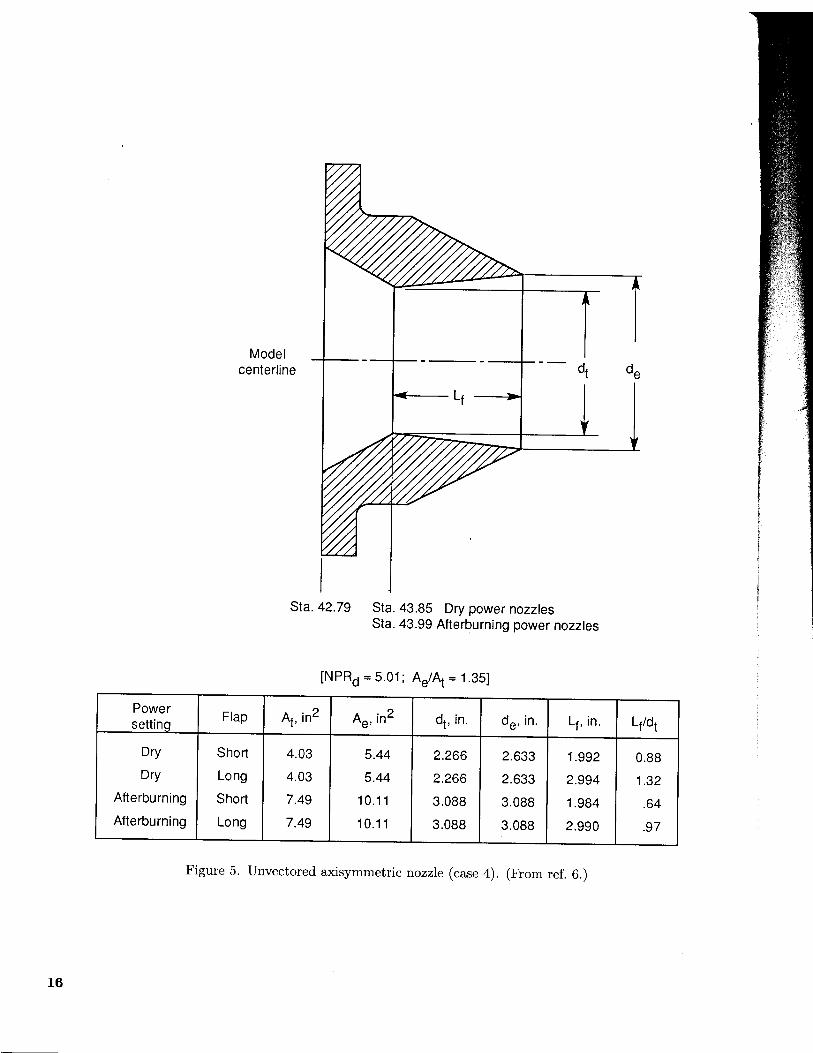
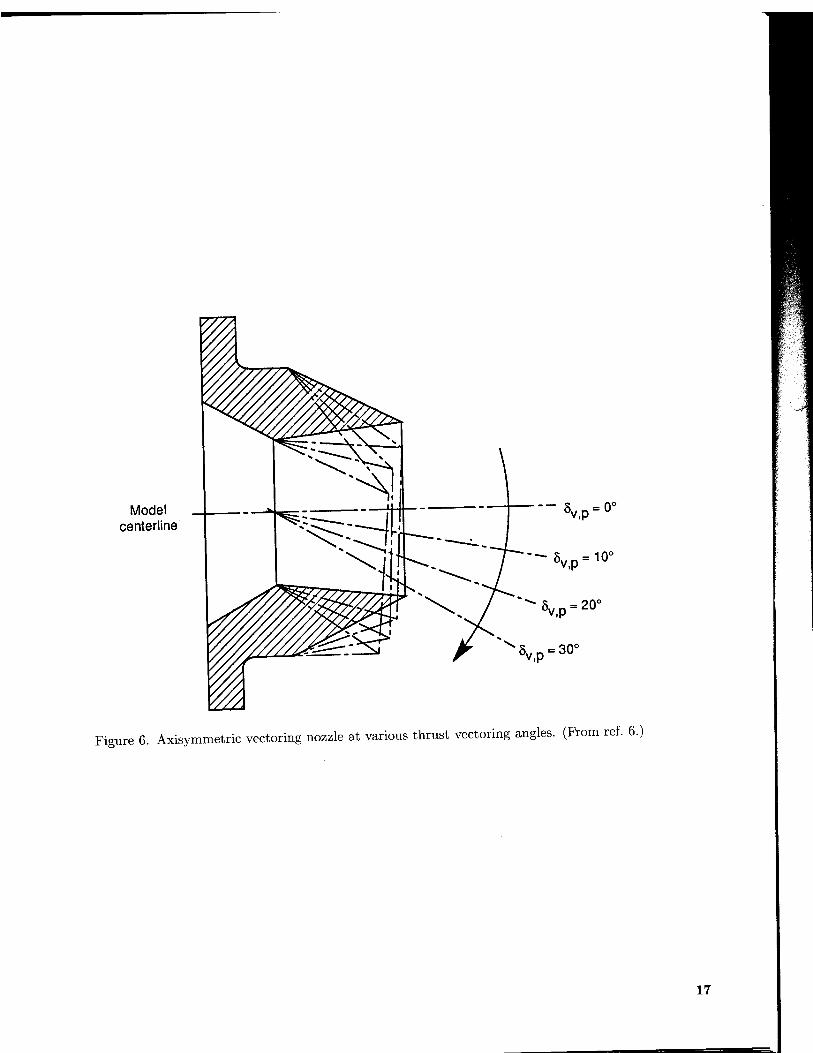
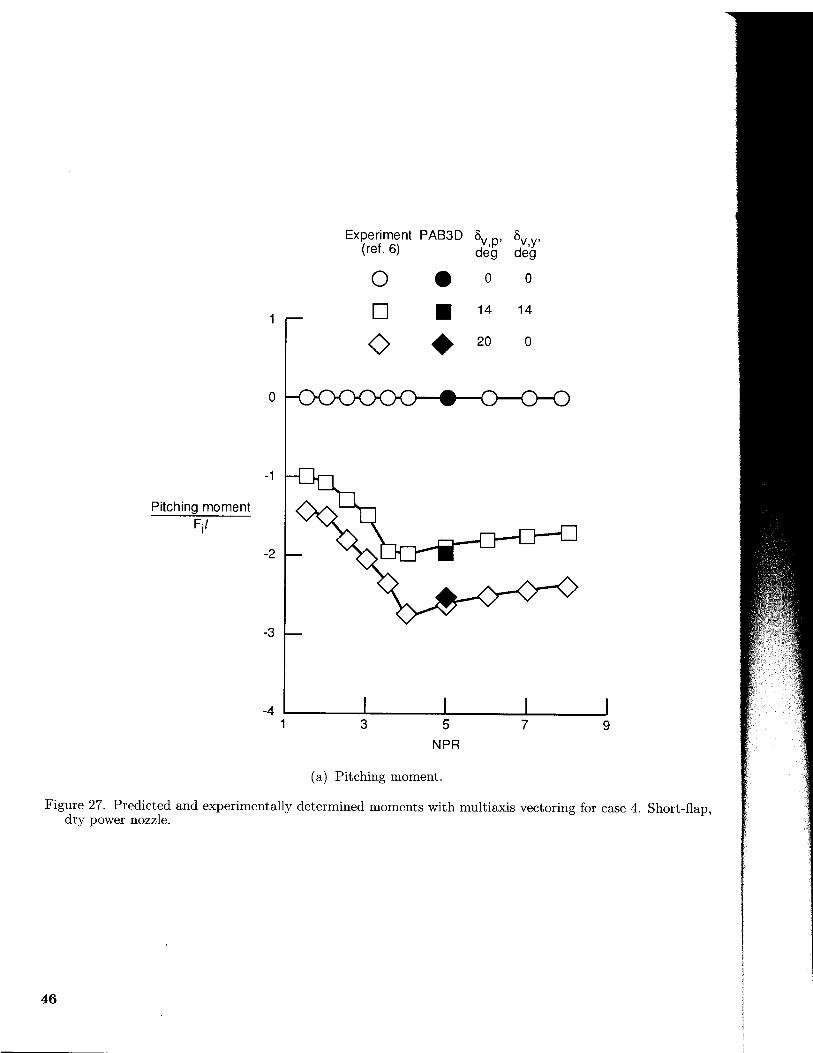
Case 4: The axisymmetric nozzle with multiaxisthrust vectoring that was tested experimentally byCarson and Capone (ref. 6) provided data for evalu-ation of the prediction of pitching moments coupledwith yawing moments. Five combinations of geomet-ric pitch and yaw vector angles were tested in drypower and afterburning power settings for two dif-ferent lengths of divergent aps. The nozzle expan-sion ratio was 1.35 for both settings, and thus thedesign nozzle pressure ratio was 5.01. A dry powersetting would be a throat area permitting a particu-lar mass ow indicative of aircraft cruise thrust lev-els. The data available include discharge coe�cientand forces, moments, and internal static pressures atseveral angular stations around the nozzle. Only per-formance data from the short- ap, dry power nozzleare presented.
Symbols and Abbreviations
A nozzle cross-sectional area, cm2
Ae nozzle exit area, cm2
At nozzle throat area, cm2
A? nozzle cross-sectional area at sonic
conditions, cm2
AR nozzle aspect ratio, ratio of width toheight at exit
a local speed of sound, m/sec
Cd discharge coe�cient,wp
wi
e energy, J
F gross thrust along body axis, N
F total force vector, N
Fi ideal isentropic gross thrust along bodyaxis, N
l length from nozzle connect station tonozzle exit station, cm
ls axial length from nozzle throat to nozzleexit, cm
M total moment vector, N
Md isentropic nozzle exit Mach number
Ml local jet Mach number
M1 free-stream Mach number
Npt number of grid points
NPR nozzle pressure ratio,pt;jp1
NPRd design nozzle pressure ratio
n surface normal vector
p static pressure, Pa
pt total pressure, Pa
pt;j jet total pressure, Pa
p1 free-stream static pressure, Pa
R gas constant ( = 1.4), 287.3 J/kg-K
R moment arm vector, cm
rc nozzle circular-arc throat radius, cm
T static temperature, K
Tt total temperature, K
Tt;j jet total temperature, K
U total velocity vector, m/sec
u velocity in streamwise direction, m/sec
ue velocity at edge of boundary layer, m/sec
wi ideal mass- ow rate, kg/sec
wp calculated mass- ow rate, kg/sec
x axial distance measured from nozzlethroat, positive downstream, cm
xs axial distance from nozzle connectstation to end of left sidewall, cm
xt axial distance from nozzle connectstation to nozzle throat station, cm
y+ nondimensional distance from wall in aturbulent shear layer
z vertical ordinate, cm
ratio of speci�c heats, 1.4 for air
�A incremental cross-sectional area, cm2
�v;p pitch vector angle, deg
�v;y yaw vector angle, deg
�y e�ective yaw vector angle, deg
� nozzle expansion ratio, Ae
At
� nozzle convergence ap angle, deg
� kinematic viscosity, m2/sec
� density, kg/m3
2
Experimental Data
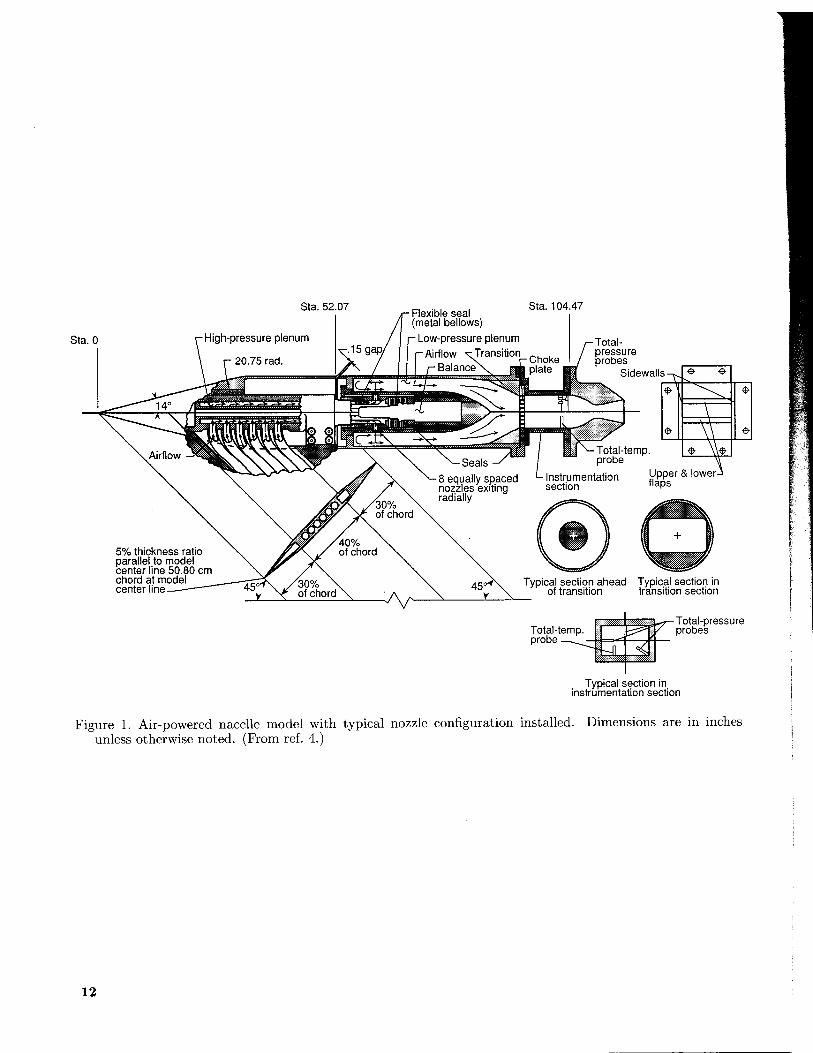
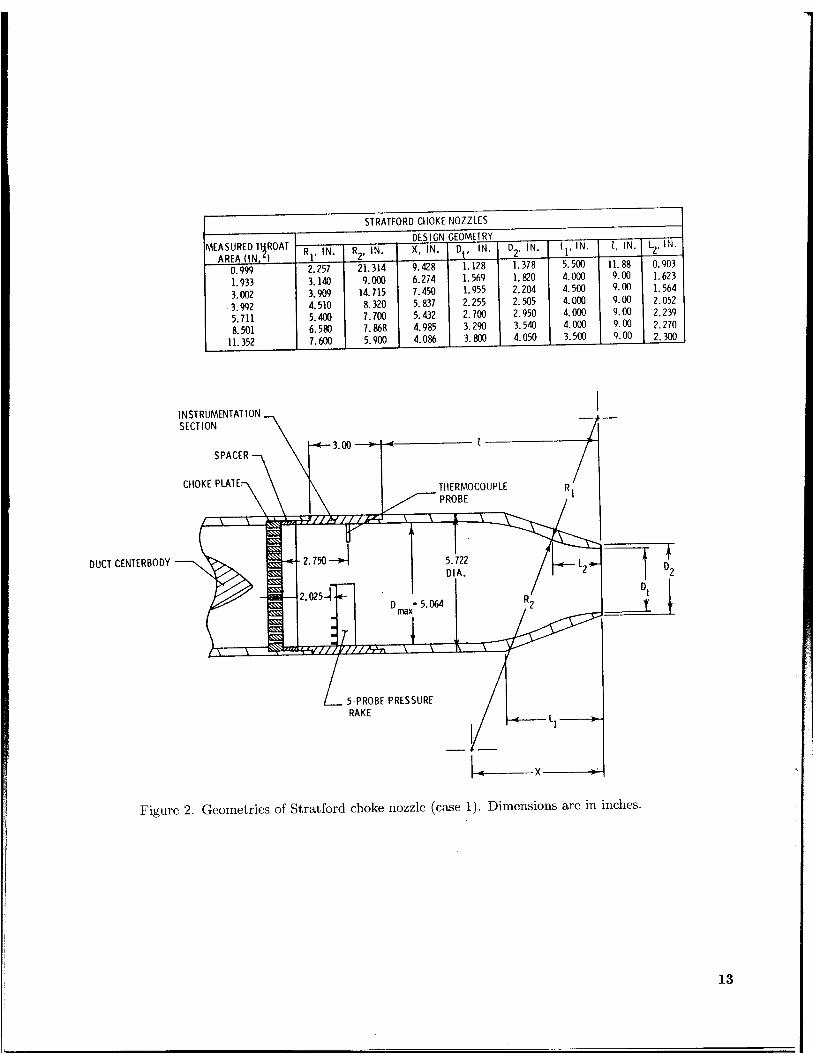
A sketch of a representative test model is pre-sented in �gure 1. The Stratford nozzle geometry isshown in �gure 2. Discharge coe�cient data for theStratford nozzle were obtained from the static thrusttables in the data reduction system used by the Lang-ley 16-Foot Transonic Tunnel. The other three nozzlegeometries chosen for this evaluation were tested inthe static test facility of the 16-Foot Tunnel. Thetwo nozzles reported in references 4 and 5 were non-axisymmetric C-D type designs with circular-arcthroat contours, straight divergent aps, and atnondiverging sidewalls; the relevant geometric pa-rameters are shown in �gures 3 and 4. The nozzlereported in reference 6 (case 4) was an axisymmetricC-D type with a sharp throat corner, as shown in �g-ure 5 for the unvectored geometry. Figure 6 presentssketches of this nozzle at several thrust-vectoring an-gles. For each nozzle, the jet was simulated by high-pressure air exhausting out the exit of the nozzle intostatic air. The nozzle discharge coe�cient was de-termined from the experimentally measured jet totaltemperature, jet total pressure, and mass- ow rate.Thrust ratio was determined from the measured bal-ance axial force that was nondimensionalized by theideal thrust (determined from the measured nozzlemass ow). Multiaxis force measurements were de-termined from a six-component force balance.
Computational Procedure
Flow-Field Calculation
A three-dimensional Navier-Stokes code PAB3Dhas been under development with speci�c applica-tions for predicting the e�ects of jet exhaust plumeon three-dimensional (3-D) nozzle-afterbody con�g-urations. The thin-layer Navier-Stokes formulation(ref. 7) was modi�ed to simulate jet mixing problems(ref. 1). The code allows for the partitioning of the ow-�eld domain into multiblock grids and is capa-ble of using several numerical schemes to solve thegoverning equations and di�erent turbulence models(ref. 8).
A computational domain can be divided intozones consisting of longitudinal planes that are ar-ranged linearly in the streamwise direction. Eachzone is subdivided into blocks that can have di�erentboundary conditions applied at each of their six faces.The four lateral block faces either communicate withadjacent block faces or serve as outer zone boundariesor symmetry planes. The upstream and downstreamfaces are zone interfaces that are handled similar tothe lateral faces. A user-written control �le deter-mines the communication between blocks and the
type of boundary condition to be used at each face.Blocks can be partitioned along the streamwise direc-tion to provide for a change in boundary conditionspart way along a lateral block face. Di�erent gridtopologies for neighboring blocks are permitted, withsome restrictions on grid matching at block bound-aries. This structure allows relatively complex con-�gurations and ow conditions to be modeled moree�ciently. Additionally, the code permits di�erentnumerical schemes to be applied selectively to eachblock, for example, the space-marching technique forsupersonic ows and time-dependent calculations forsubsonic and separated ows.
Boundary Conditions
The PAB3D code allows di�erent types of bound-ary conditions to be applied to any given block face.Solid walls are treated as no-slip adiabatic surfaces,and the block interfaces are C0 continuous. Theboundary conditions used for the internal nozzle owpath are the total pressure and the total temperatureat the block in ow face. In addition, this particularin ow boundary condition assumes a uid ow an-gle normal to the in ow face. The operating NPRof the nozzle and the free-stream static pressure p1determine the jet total pressure at the in ow facefrom pt;j = (NPR)(p1). The design NPR is calcu-lated from the series of equations shown in appen-dix A. A typical jet total temperature obtained fromthe experimental tests is used for all the calculations.
A characteristic boundary condition withRiemann invariants is applied to external in ow andouter lateral boundaries. An extrapolation bound-ary condition is applied on the downstream out owface where the nozzle plume exits the computationaldomain.
Performance Calculation
Nozzle performance is obtained through the ap-plication of the momentum theorem to a controlvolume surrounding the nozzle (ref. 2). Cheatham,Walker, and Gridley calculated both 2-D and 3-D in-viscid nozzle performance using this method (ref. 9).The surface over which the integration of the owquantities is performed is typically the nozzle exit.The method utilized herein integrates the mass andmomentum uxes and the pressure forces over eachincremental cell modeling the nozzle out ow facesthrough the use of equations (1) and (2):
wp =X
(�U � n) �A (1)
F =X
[�U (U � n) + (p � p1)n] �A (2a)
M = F�R (2b)
3
where �A is the out ow area attributed to theincremental cell face and R is the moment arm fromthe reference center to the incremental cell .
Ideal mass- ow rate and thrust are determinedfrom the isentropic ow equations (eqs. (3) and (4))and are used to normalize the calculated mass- owrate and thrust for comparisons with the experimen-tal data:
wi =
r
R
�2
+ 1
� +1
2( �1)At
pt;jpTt;j
(3)
Fi =
s2 R
� 1wp
vuuuutTt;j
2641�
p1
pt;j
! �1
375 (4)
The performance package is incorporated intoPAB3D to permit monitoring of various performanceparameters as the solution converges.
Results and Discussion
Solutions were obtained for four nozzle con�gu-rations from the ow method PAB3D. The solutionswere all computed with laminar viscous stress mod-eling due to biasing of the turbulent ow modelsto a single direction. This modeling obviates tur-bulence calculations when an H-type grid is used todescribe the nozzle geometry. Discharge coe�cient,thrust ratio, and o�-axis force and moment quanti-ties (where applicable) were calculated for di�erentoperating conditions.
Case 1: Stratford Choke Nozzle Study
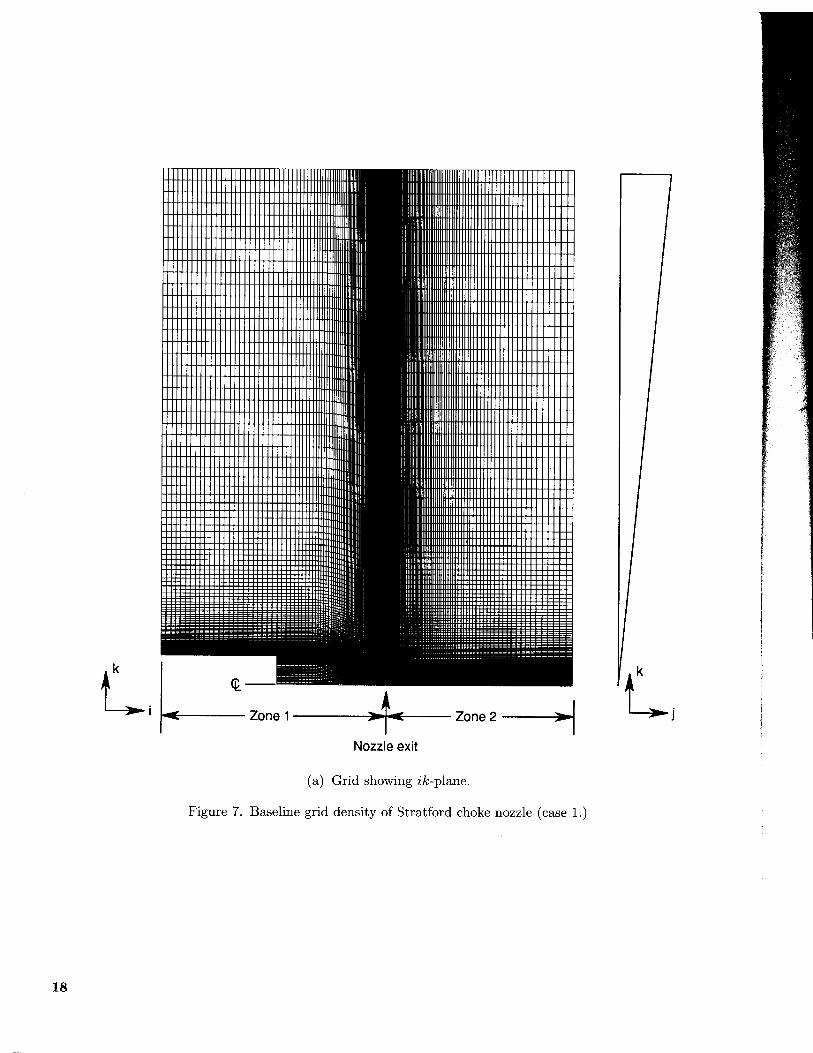
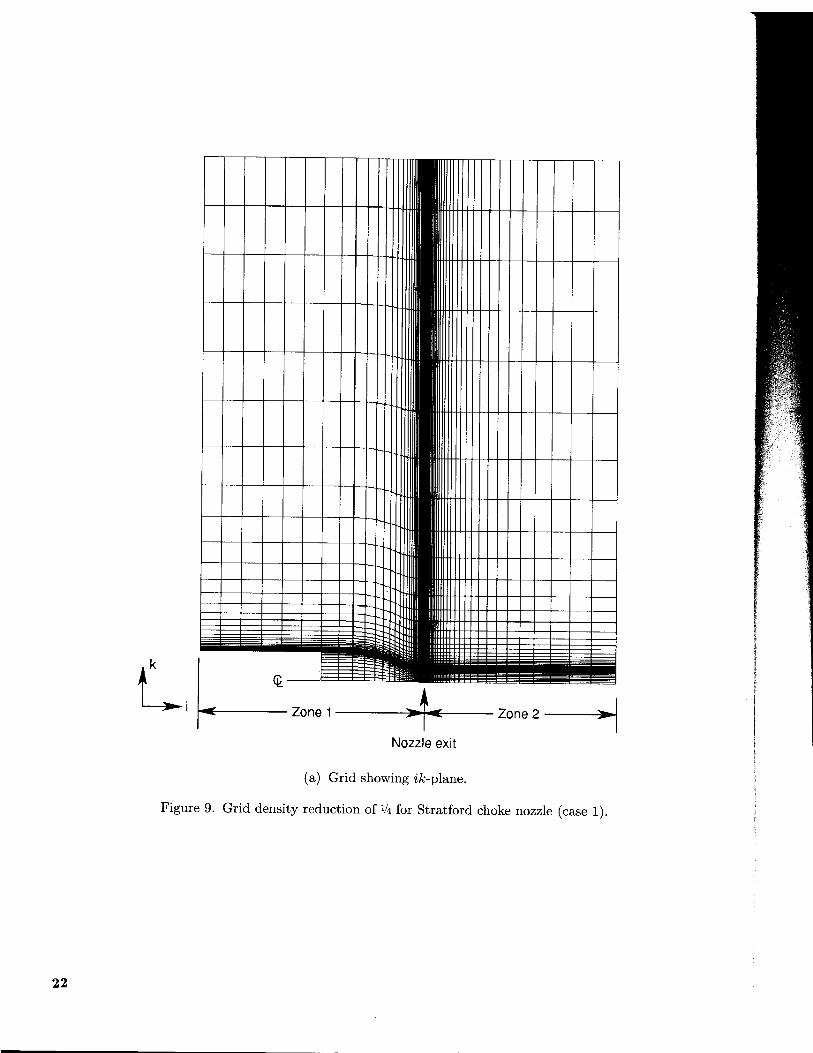
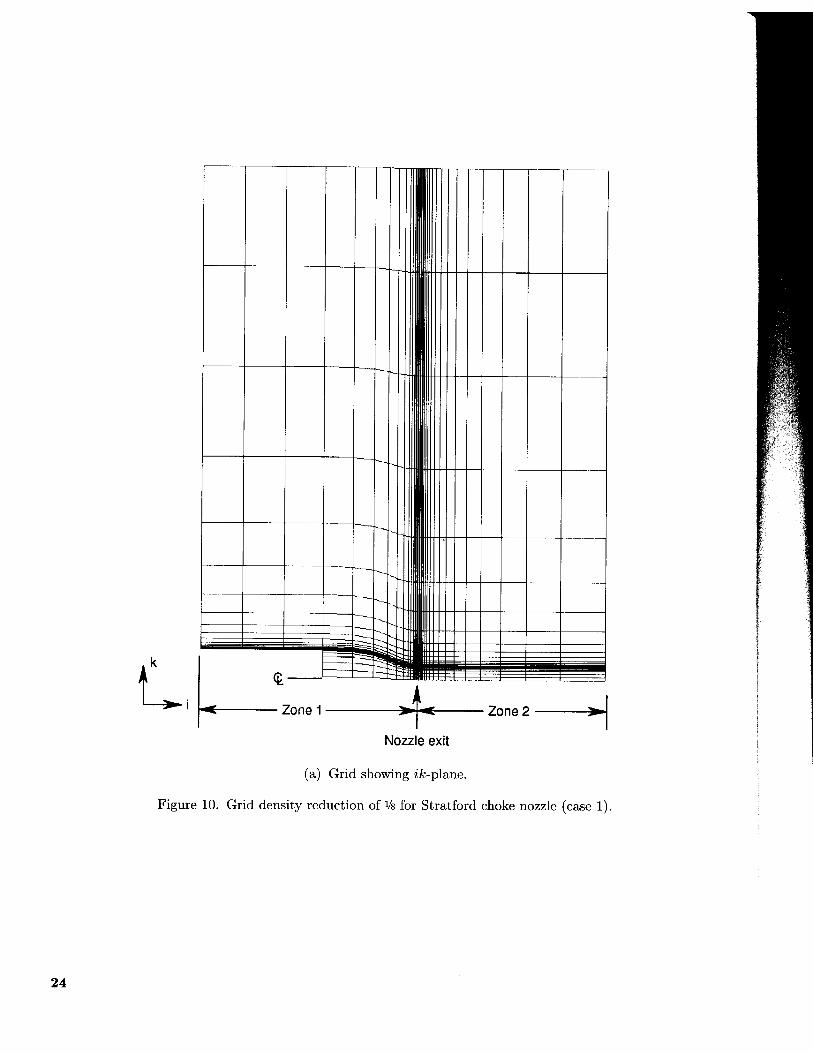
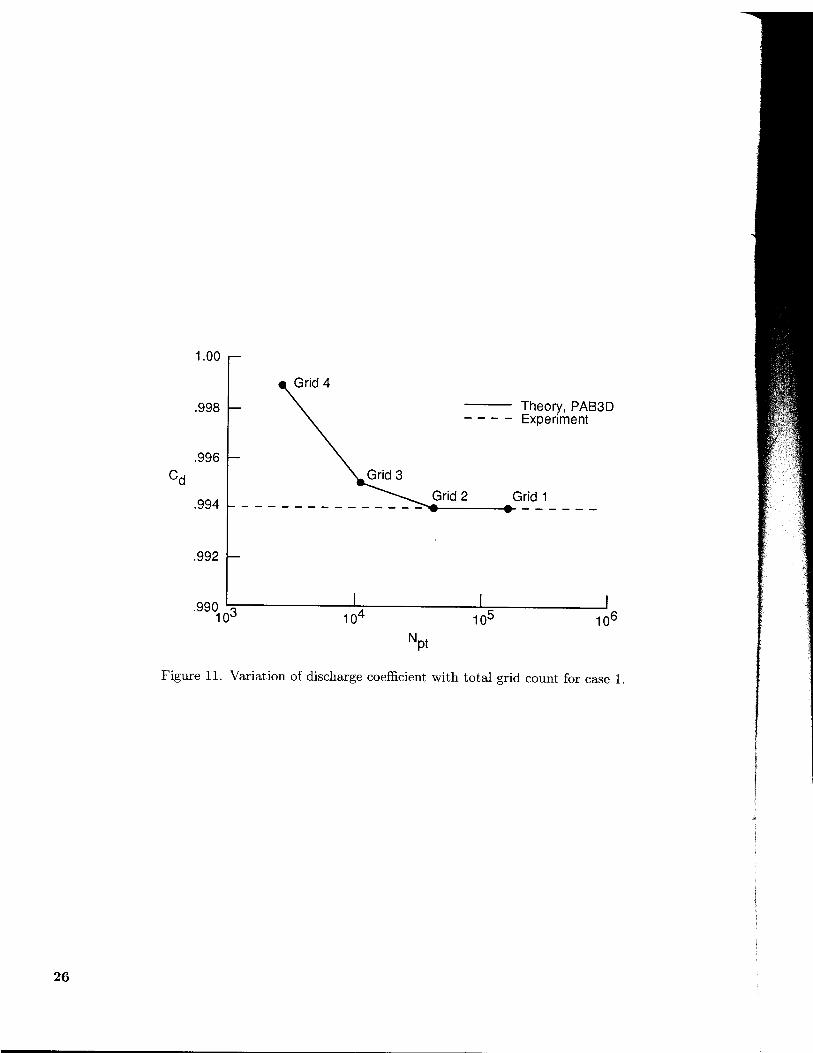
A sectional view of the Stratford choke nozzle isshown in �gure 2. Gridding arrangements and con-vergence data are shown in �gures 7 to 10. Four com-putational grids were run for this geometry. Residualtrends and discharge coe�cient convergence are plot-ted for each grid.
Grid de�nition. This case study was modeledwith two computational zones. The �rst zone con-tained the nozzle internal grid and an external gridregion surrounding the nozzle, and the second zonemodeled the external air downstream of the noz-zle exit. The dimensions of the nozzle block were129 � 2 � 105. The nozzle internal-boundary-layergrid region contained 34 points, with the �rst gridpoint speci�ed from y+ = 4. Grid expansion rateswere less than 5 percent in the axial and radial di-rections. The external region surrounding the noz-zle grid was dimensioned at 129 � 2 � 208. Total-pressure and total-temperature boundary conditions
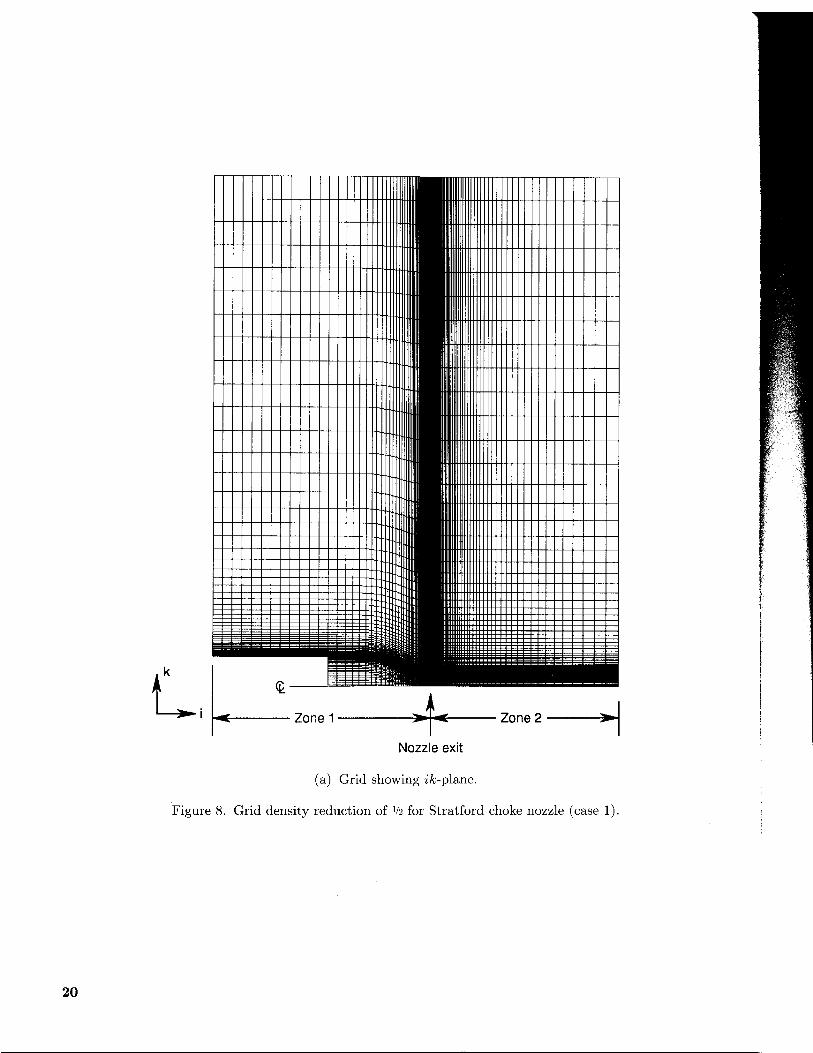
were applied to both in ow faces of these blocks.The external downstream region was dimensioned at145� 2� 313. The zone interface matched point forpoint between the two zones. The grid was stretchedtoward the outer boundary to a distance of 40 exitradii. Solid-wall boundary conditions were appliedto this surface. The out ow boundary was 15 exitradii downstream of the nozzle exit plane. Extrapo-lation boundary conditions were applied to the out- ow boundary. Each of the successively coarser gridsused grid points from this mesh. A sectional viewof the grid in the ik-plane is shown in �gure 7(a).This grid represented the most dense concentrationof points for this study. The grid density was reducedby two in both the i-direction (axial), and k-direction(radial) three successive times. Figures 8(a), 9(a),and 10(a) are sectional views of grids reduced by 1/2,1/4, and 1/8. Grid 1 is the baseline grid. Grids 2, 3,and 4 are the 1/2, 1/4, and 1/8 grids, respectively.
An axisymmetric ow symmetry is assumedthrough the use of a 2-D wedge-angle boundary con-dition. A single-cell-width polar grid was generatedwith a wedge angle of 5.625�, which represents 1/64 ofan axisymmetric geometry. The wedge-angle bound-ary condition calculates the angle of the wedge lateralfaces and determines the proper boundary values toapply to satisfy the symmetry assumptions.
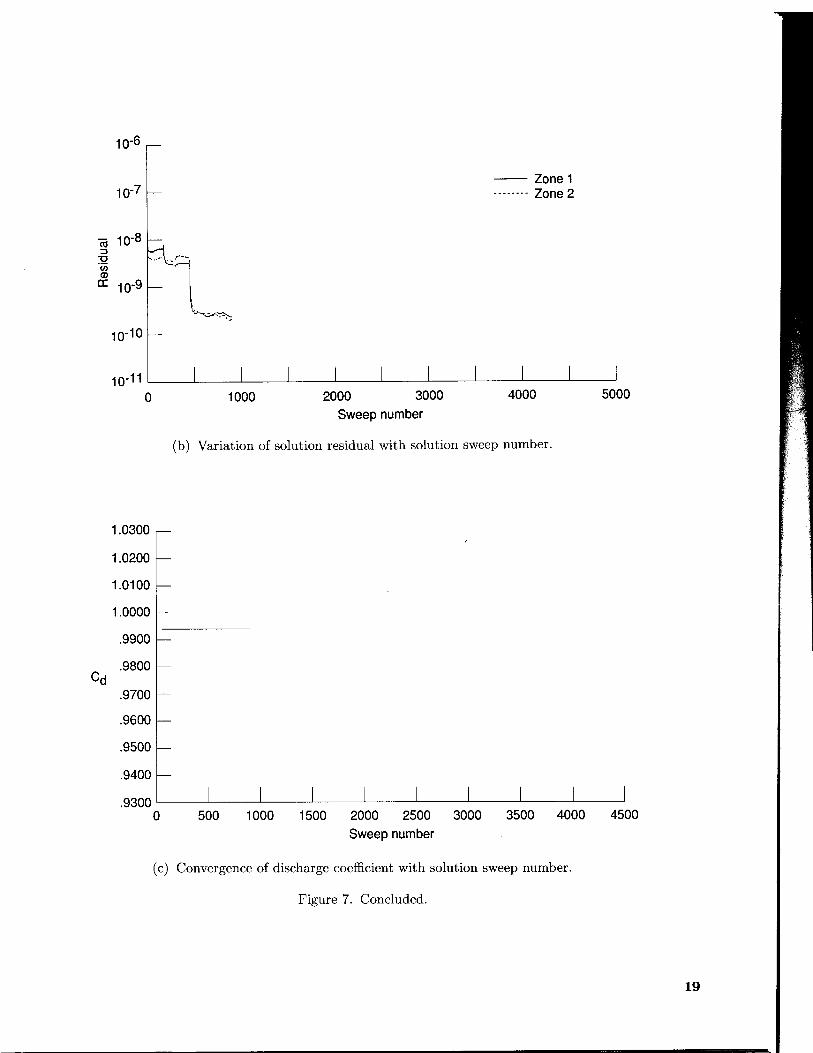
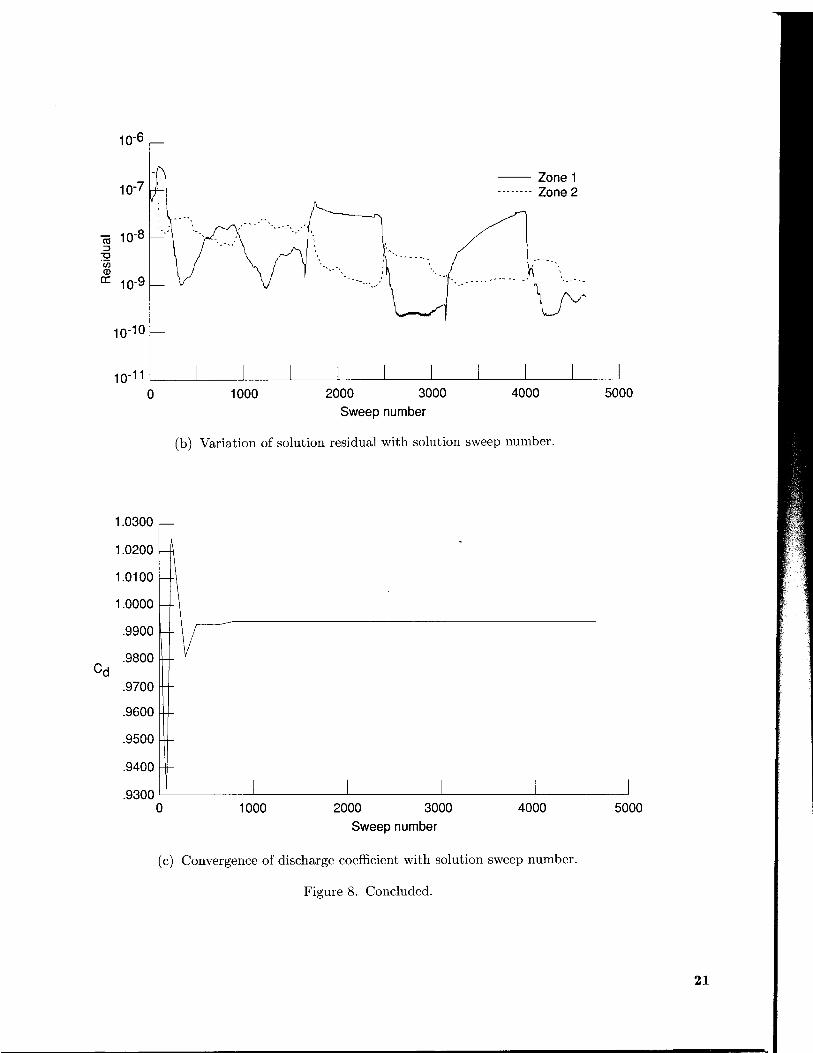
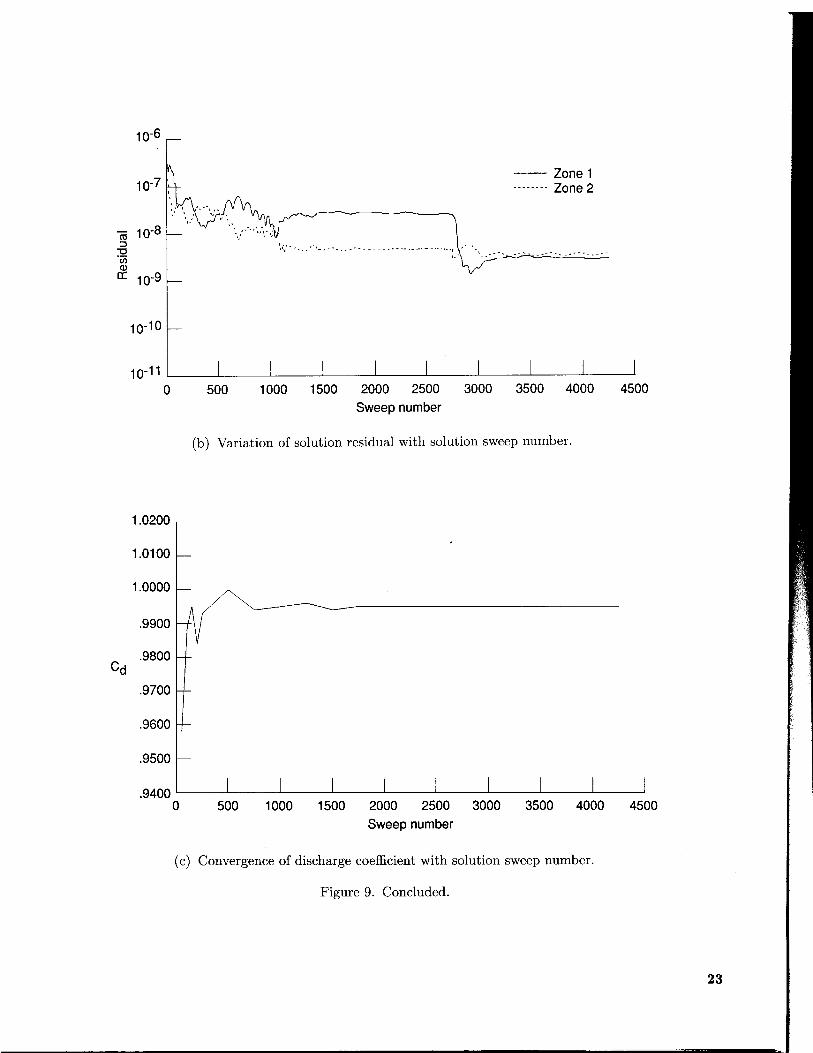
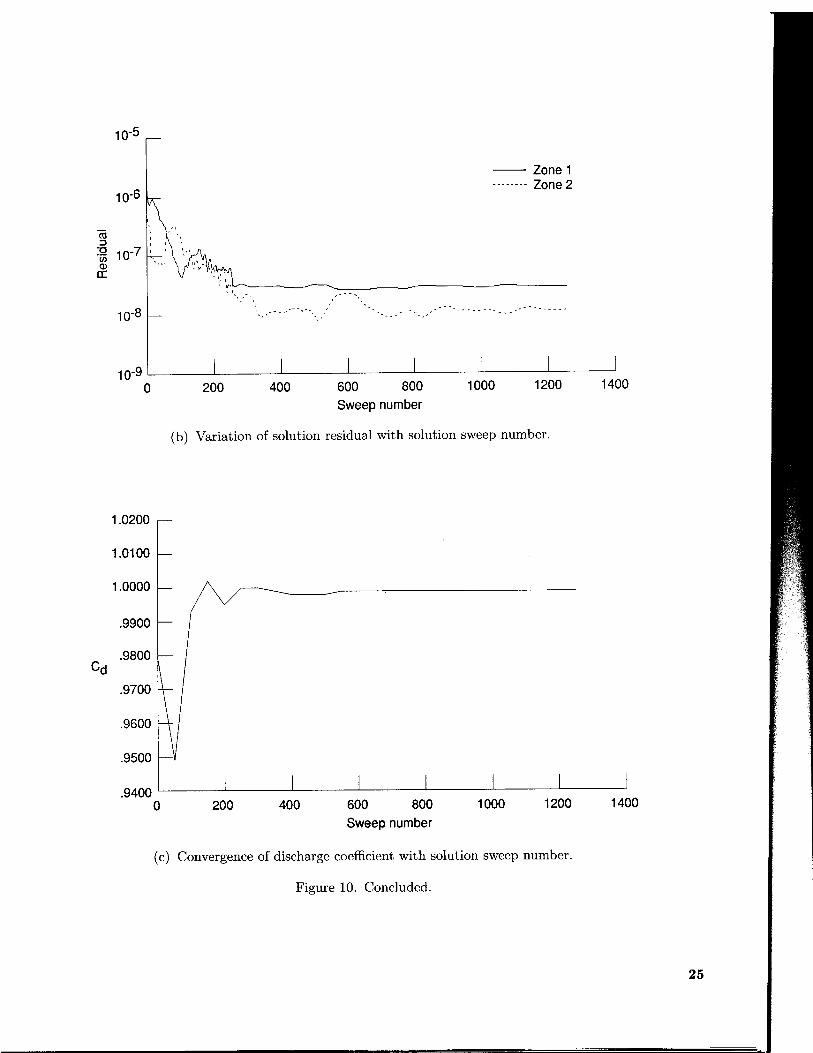
Discharge coe�cient correlation. The noz-zle pressure ratio for this study was set at 2. Theexternal free stream was initially set at M1 = 0:05.The initial solutions for the time-dependent calcula-tions for grids 2, 3, and 4 were produced through atwo-step procedure. A one-dimensional (1-D) isen-tropic solution was calculated for the nozzle internalgrid, as described in appendix B. This ow �eld wasthe starting point for a space-marching solution forthe jet exhaust downstream of the nozzle exit. Time-dependent calculations were continued on the result-ing ow �eld. The calculation for grid 1 utilized aconverged solution from grid 2 extrapolated to thegrid 1 computational domain for the starting solu-tion. Residual trends for the four grids are shown in�gures 7(b), 8(b), 9(b), and 10(b). Discharge coef-�cient convergences are shown in �gures 7(c), 8(c),9(c), and 10(c). The e�ect of grid count on dischargecoe�cient is shown �gure 11.
The discharge coe�cient stabilized for grids 2and 3 within 1000 solution iterations (1 sweep down-stream and 1 sweep back upstream by the solverwas counted as 1 iteration) and grid 4 stabilizedwithin 600 iterations. There appears to have beenno close correlation between the solution residualsand convergence of the calculated nozzle dischargecoe�cient after the �rst 1000 iterations. Excursions
4
of 2 orders of magnitude in the residual were ob-served, with no discernible change in the dischargecoe�cient after that point. The discharge coe�cientfor grid 1 remained stable as well, despite the resid-ual dropping over an order of magnitude over ap-proximately 1000 iterations. Solution residuals weretherefore used only as an initial indicator of solutionstability (i.e., that the solution is not diverging) anddischarge coe�cient was utilized as the indicator of�nal solution convergence.
The e�ect of grid count of discharge coe�cient isshown in �gure 11. The very coarse grid (grid 4) ofthis study converged to 0.5 percent of the level ofthe experimental data. Grid 3 converged to within0.1 percent, and grids 2 and 1 were less than 0.1 per-cent of the experimental discharge coe�cient. Dis-charge coe�cient was a stable and convergent quan-tity with grid count.
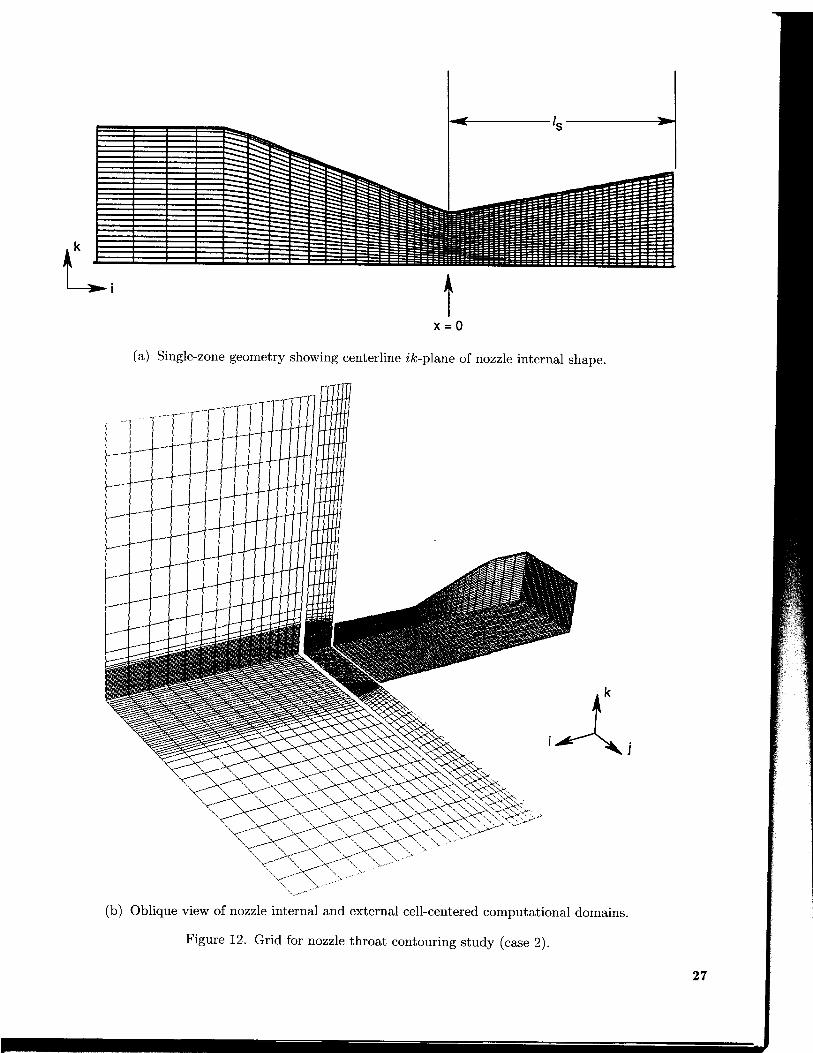
Case 2: Throat Contouring Study
Grid de�nition. Two nozzles (A1 and A2, see�g. 3) with di�erent throat radii were modeled. Arepresentative internal computational grid for a non-axisymmetric nozzle is shown in �gure 12(a). Theordinate of the plot was nondimensionalized by thelength of the divergent ap, with the origin at thenozzle throat. The computational grid for the nozzlewas an H-H grid consisting of 61 grid points in thei-direction (axial), 49 points in the j-direction (lat-eral), and 37 grid points in the k-direction (vertical).The grid spacing of the internal grid mesh was packedin the boundary layer near the walls and stretchedaway in the center region of the nozzle. Flow sym-metry was assumed about the horizontal and verticalplanes to reduce computational time. The number ofcells was identical for both nozzle con�gurations.
The nozzle internal-boundary-layer grid regioncontained 13 grid points, with the �rst grid pointspeci�ed as 0.00003 cm from the wall surface. Thisregion was roughly 0.115 cm deep in the k-directionalong the divergent aps and 0.251 cm deep in thej-direction along the sidewalls at the nozzle exit(exit half-height was roughly 1.5 cm). Constant-interval spacing from the boundary-layer edge to thecenterline was used for the remaining grid points.
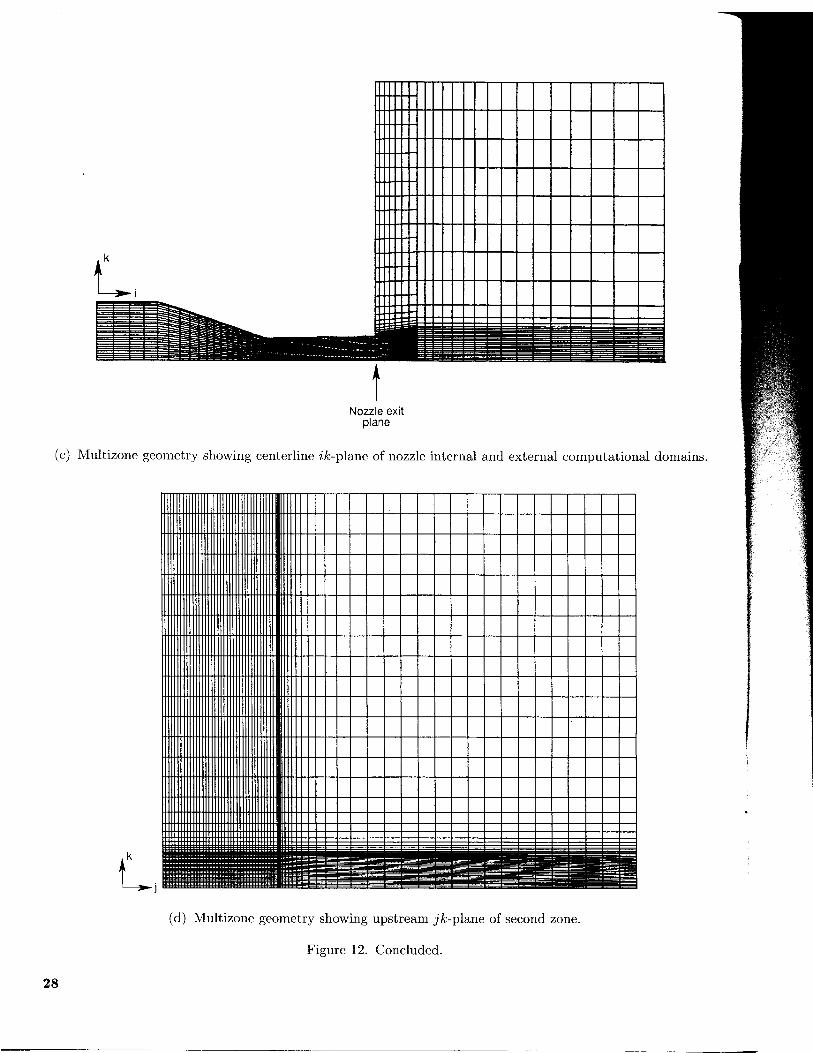
In the calculation of o�-design settings (i.e.,underexpanded nozzle ow), the static external airwas modeled to allow the jet plume to adjust tothe jump in static pressure that occurred near thenozzle exit face. The external and internal domainswere split into three zones, as shown in �gures 12(b)and 12(c). The �rst zone (61 � 49 � 37) containedthe nozzle internal geometry, which was the same as
in the single-zone case. The second (8 � 87 � 73)and third (17� 44� 37) zones were free-stream do-mains, with the second zone serving as a transitionbetween the denser nozzle geometry grid and the rel-atively sparse grid of the third zone. This transitionavoided radical grid changes, such as the 2:1 gridreduction at the boundary to the second and thirdzones, in areas of possibly high ow gradients suchas those expected to occur at the nozzle exit. A rep-resentative grid arrangement for the �rst i-plane ofthe second zone is shown in �gure 12(d). A cut inthis zone face matched point for point the nozzle exitgrid of the last i-plane in the �rst zone. The grid wasstretched toward the outer boundaries at a distanceof �ve equivalent nozzle radii away from the outerline of the matching cut. The code required about4 million words of memory for the execution of themultizone cases (approximately 190 000 grid points).
A 1-D isentropic solution described in appendix Bwas used for the starting ow �eld. Mass ow of thenozzle was observed to gauge solution convergence.
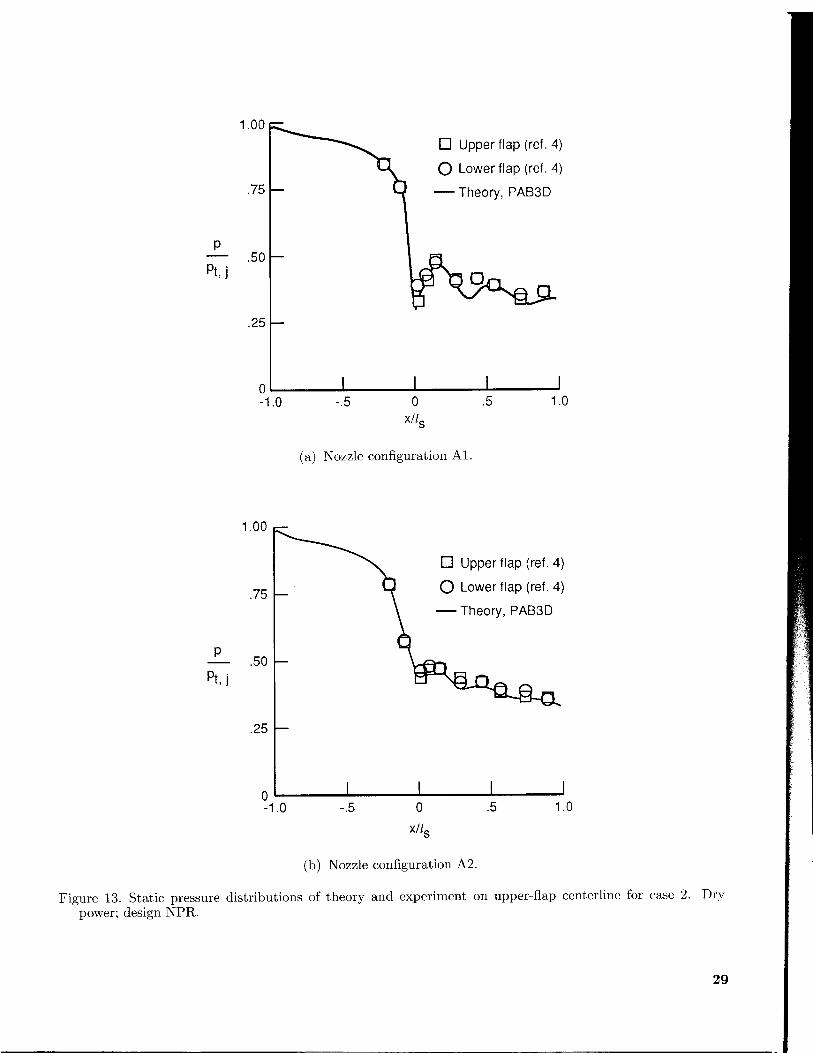
Pressure data correlation. The computednozzle internal pressures for nozzles A1 and A2,which are presented in �gure 13, compared well withexperimental data. These solutions converged withinabout 400 time steps that took roughly 3100 secon the Cray-2 computer with an initial Courant-Friedrichs-Lewy (CFL) stability number of 3. TheCFL numbers for subsequent iterations during arun are adjusted automatically within the code toaccelerate convergence.
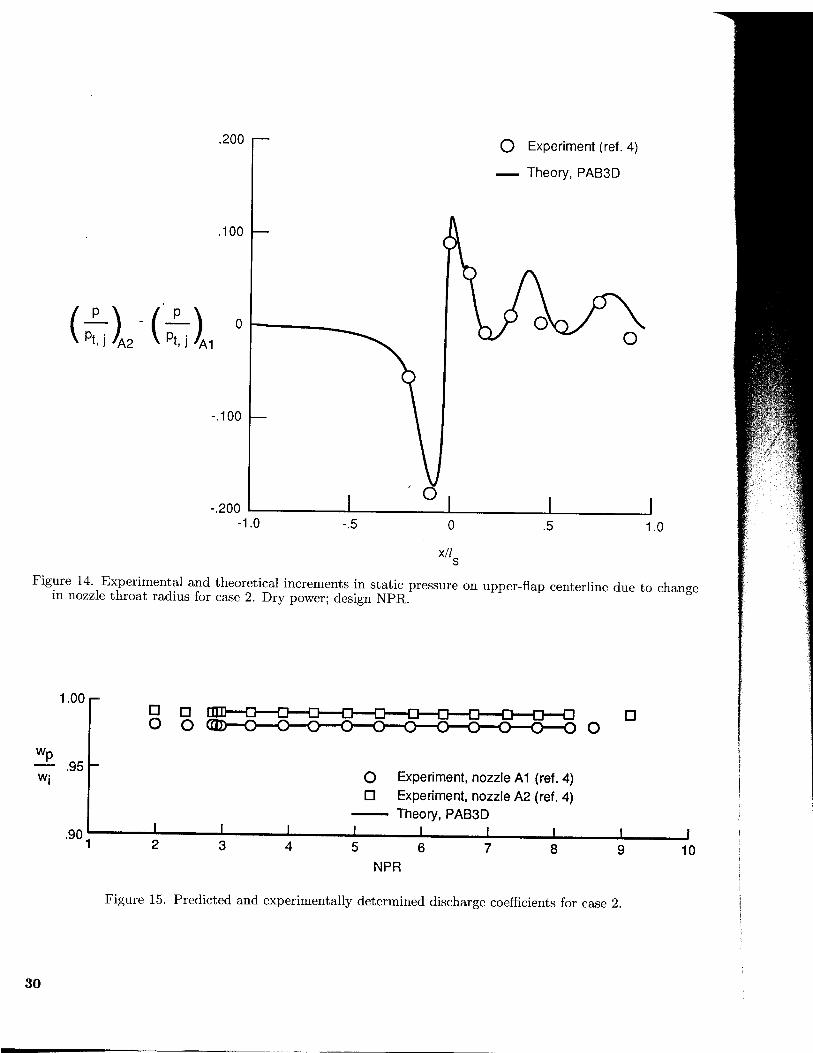
The ability to calculate the change in nozzle owdue to a di�erence in throat radius (static pressuredistribution of nozzle A1 subtracted from that ofnozzle A2) is shown in �gure 14. The magnitude andlocation of the incremental pressure di�erences dueto the change in nozzle throat radius were fairly wellmatched. This pressure di�erence integrated overthe length of the divergent aps (i.e., x=ls > 0) was1.58 N, or roughly an increment of 0.002 in thrustratio based on ideal thrust (from the ideal mass ow).The pressure gradients across the exit were lower fornozzle A2 than for nozzle A1, probably because of theweaker pressure gradients between the divergent apsof nozzle A2. The magnitude of the pressure forceat the exit (subtracted from the free-stream staticpressure) was much smaller for nozzle A2 than forA1 (�0.47 N compared with �11.12 N). It appearsthat nozzle A2 was operating closer to the theoreticaldesign conditions than nozzle A1 was operating forthe same input total-pressure conditions because ofthe smaller loss of thrust to pressure forces.
5
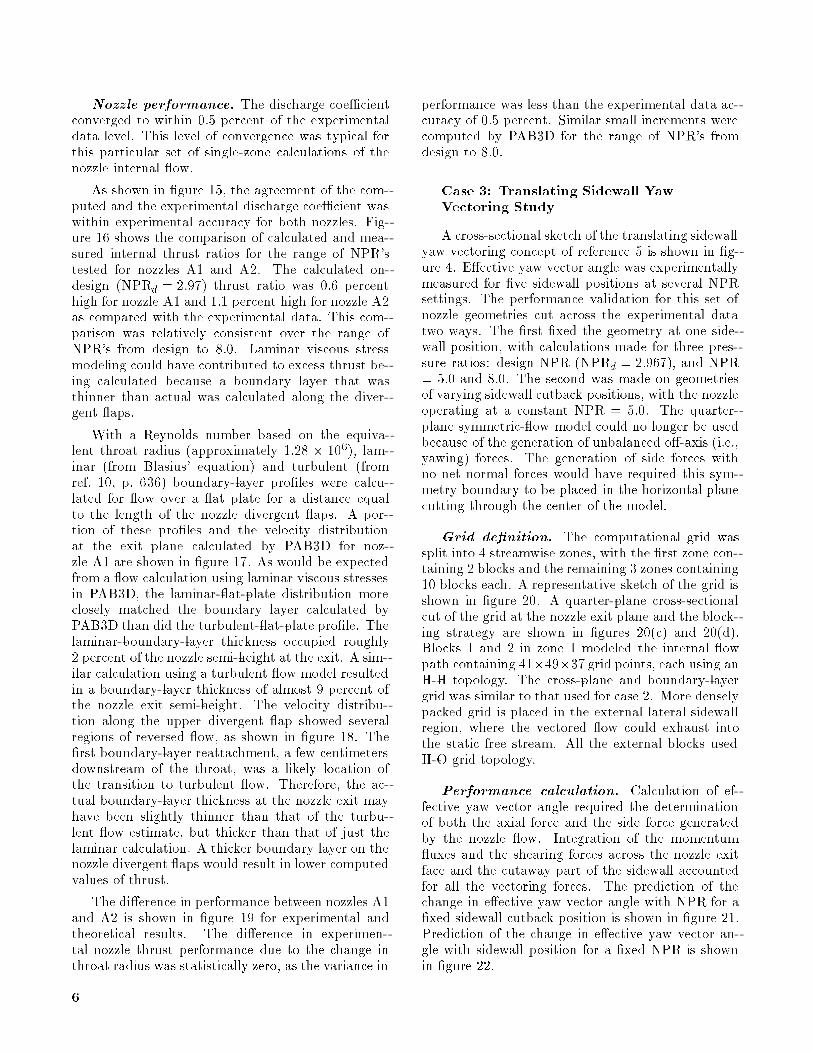
Nozzle performance. The discharge coe�cientconverged to within 0.5 percent of the experimentaldata level. This level of convergence was typical forthis particular set of single-zone calculations of thenozzle internal ow.
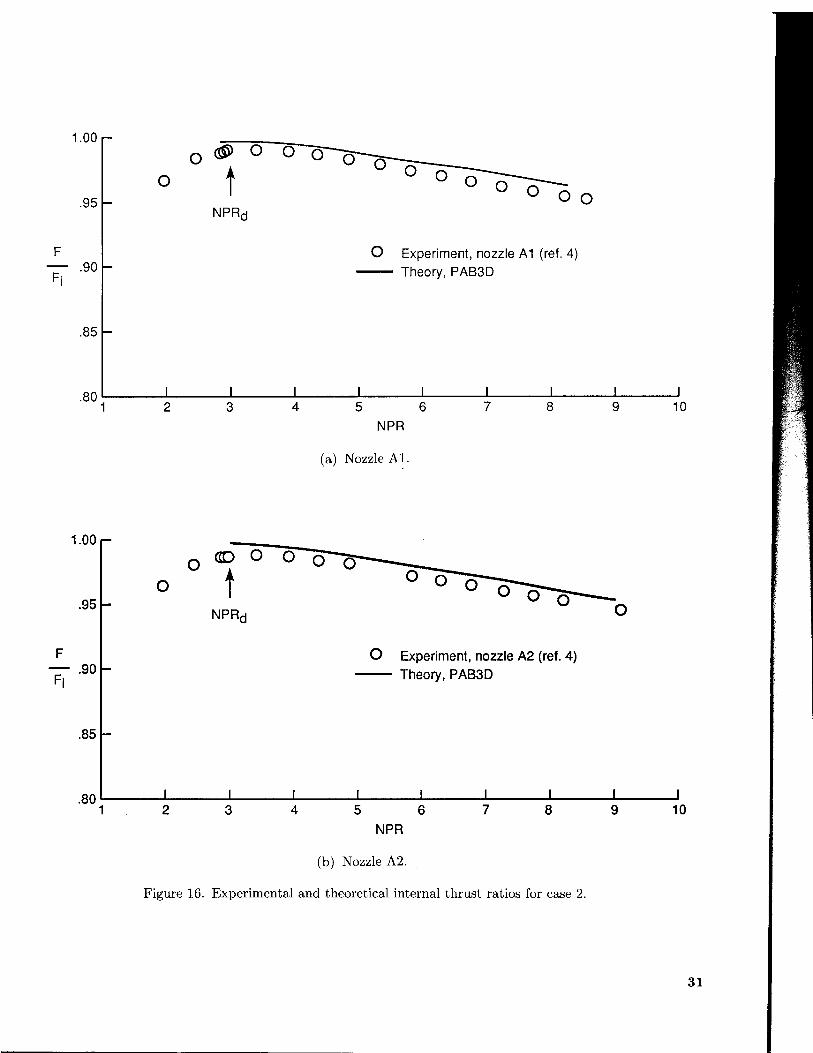
As shown in �gure 15, the agreement of the com-puted and the experimental discharge coe�cient waswithin experimental accuracy for both nozzles. Fig-ure 16 shows the comparison of calculated and mea-sured internal thrust ratios for the range of NPR'stested for nozzles A1 and A2. The calculated on-design (NPRd = 2:97) thrust ratio was 0.6 percenthigh for nozzle A1 and 1.1 percent high for nozzle A2as compared with the experimental data. This com-parison was relatively consistent over the range ofNPR's from design to 8.0. Laminar viscous stressmodeling could have contributed to excess thrust be-ing calculated because a boundary layer that wasthinner than actual was calculated along the diver-gent aps.
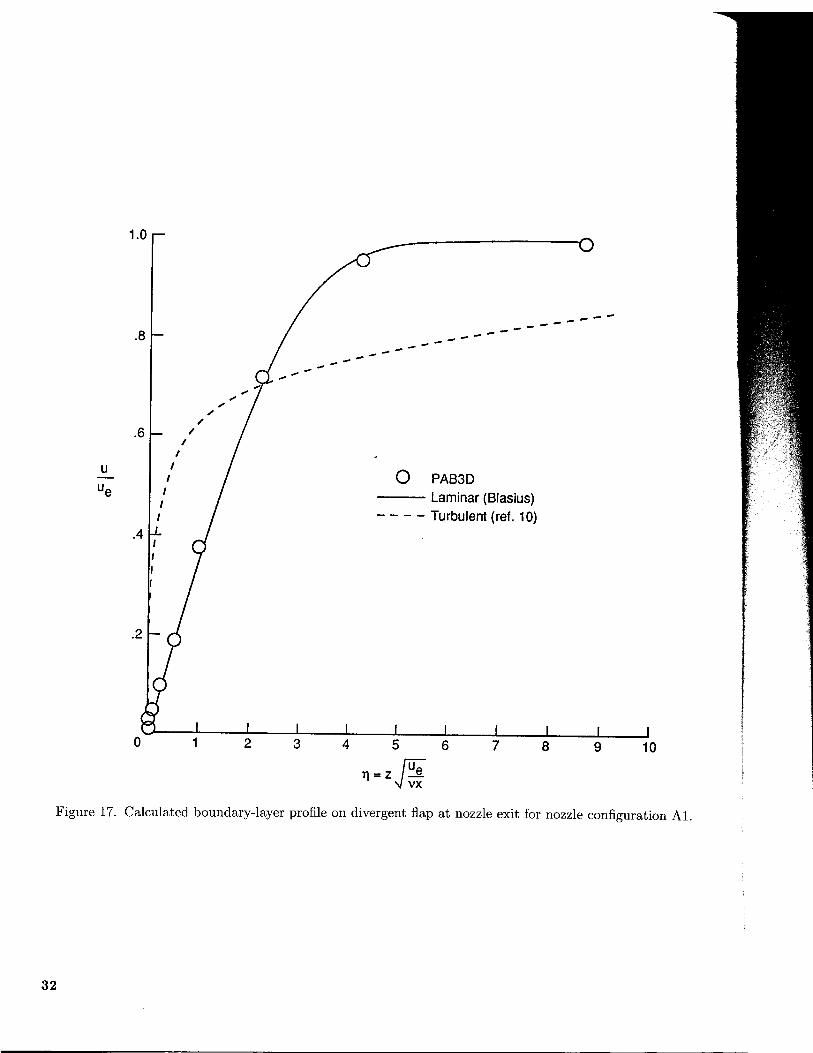
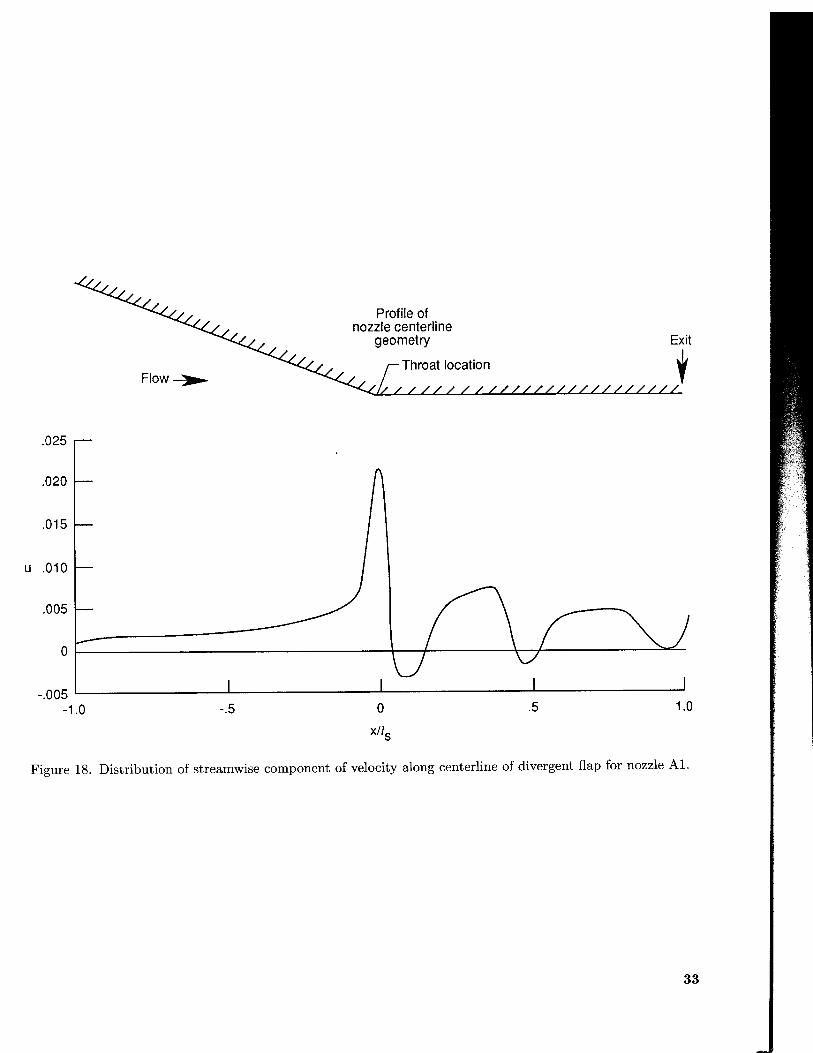
With a Reynolds number based on the equiva-lent throat radius (approximately 1:28 � 106), lam-inar (from Blasius' equation) and turbulent (fromref. 10, p. 636) boundary-layer pro�les were calcu-lated for ow over a at plate for a distance equalto the length of the nozzle divergent aps. A por-tion of these pro�les and the velocity distributionat the exit plane calculated by PAB3D for noz-zle A1 are shown in �gure 17. As would be expectedfrom a ow calculation using laminar viscous stressesin PAB3D, the laminar- at-plate distribution moreclosely matched the boundary layer calculated byPAB3D than did the turbulent- at-plate pro�le. Thelaminar-boundary-layer thickness occupied roughly2 percent of the nozzle semi-height at the exit. A sim-ilar calculation using a turbulent ow model resultedin a boundary-layer thickness of almost 9 percent ofthe nozzle exit semi-height. The velocity distribu-tion along the upper divergent ap showed severalregions of reversed ow, as shown in �gure 18. The�rst boundary-layer reattachment, a few centimetersdownstream of the throat, was a likely location ofthe transition to turbulent ow. Therefore, the ac-tual boundary-layer thickness at the nozzle exit mayhave been slightly thinner than that of the turbu-lent ow estimate, but thicker than that of just thelaminar calculation. A thicker boundary layer on thenozzle divergent aps would result in lower computedvalues of thrust.
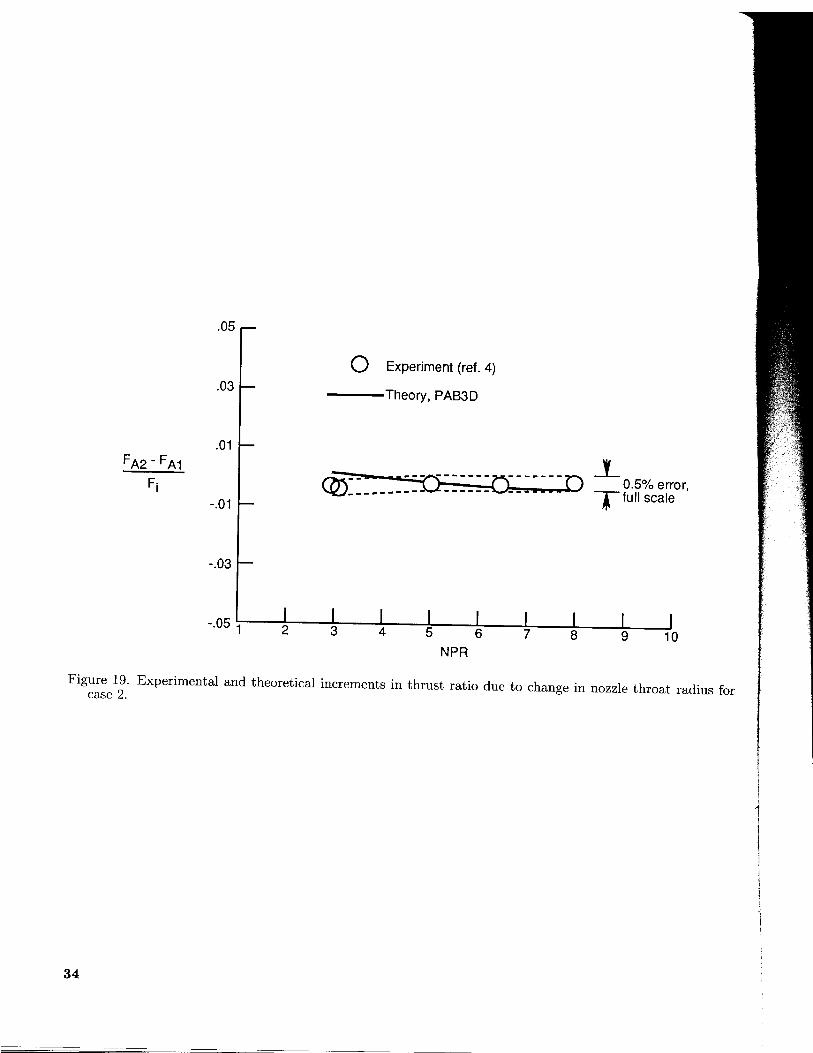
The di�erence in performance between nozzles A1and A2 is shown in �gure 19 for experimental andtheoretical results. The di�erence in experimen-tal nozzle thrust performance due to the change inthroat radius was statistically zero, as the variance in
performance was less than the experimental data ac-curacy of 0.5 percent. Similar small increments werecomputed by PAB3D for the range of NPR's fromdesign to 8.0.
Case 3: Translating Sidewall Yaw
Vectoring Study
A cross-sectional sketch of the translating sidewallyaw vectoring concept of reference 5 is shown in �g-ure 4. E�ective yaw vector angle was experimentallymeasured for �ve sidewall positions at several NPRsettings. The performance validation for this set ofnozzle geometries cut across the experimental datatwo ways. The �rst �xed the geometry at one side-wall position, with calculations made for three pres-sure ratios: design NPR (NPRd = 2:967), and NPR= 5.0 and 8.0. The second was made on geometriesof varying sidewall cutback positions, with the nozzleoperating at a constant NPR = 5.0. The quarter-plane symmetric- ow model could no longer be usedbecause of the generation of unbalanced o�-axis (i.e.,yawing) forces. The generation of side forces withno net normal forces would have required this sym-metry boundary to be placed in the horizontal planecutting through the center of the model.
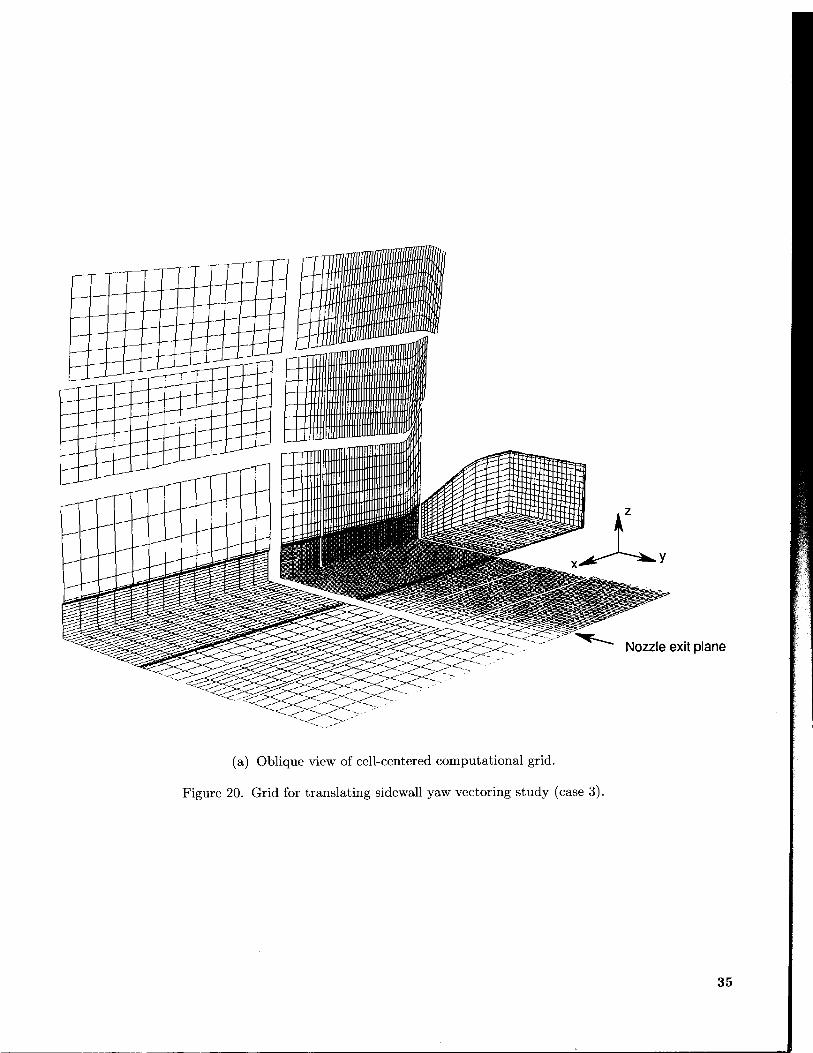
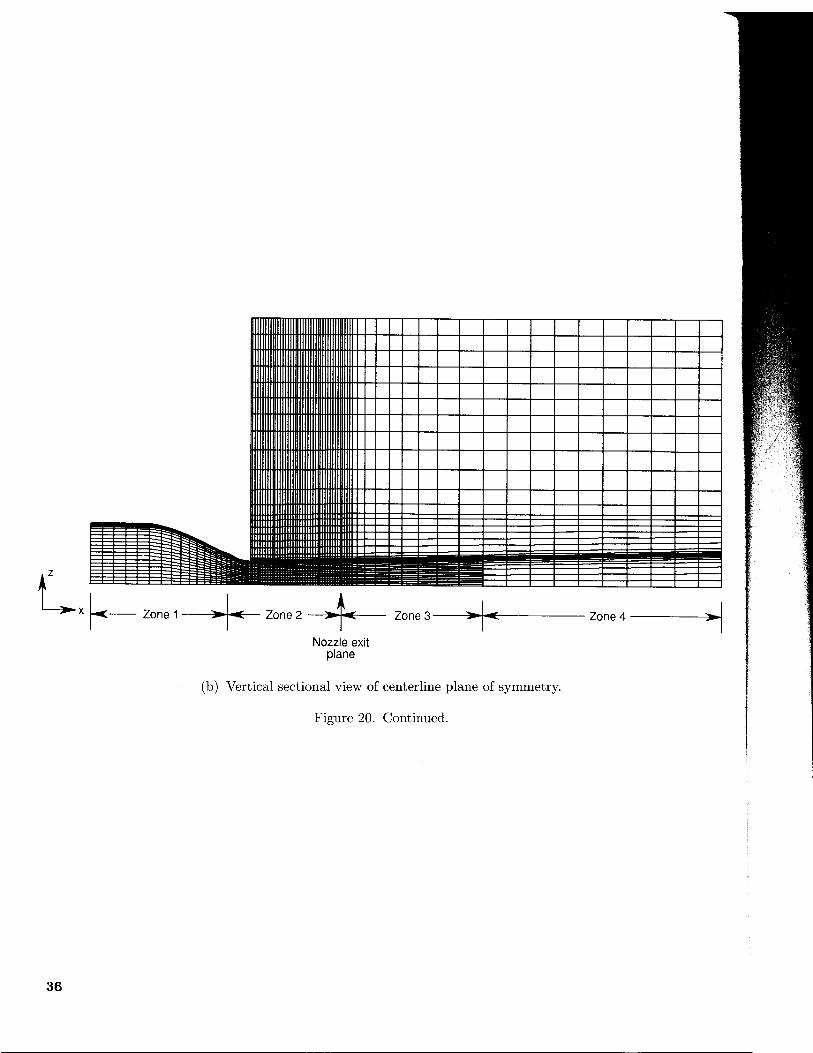
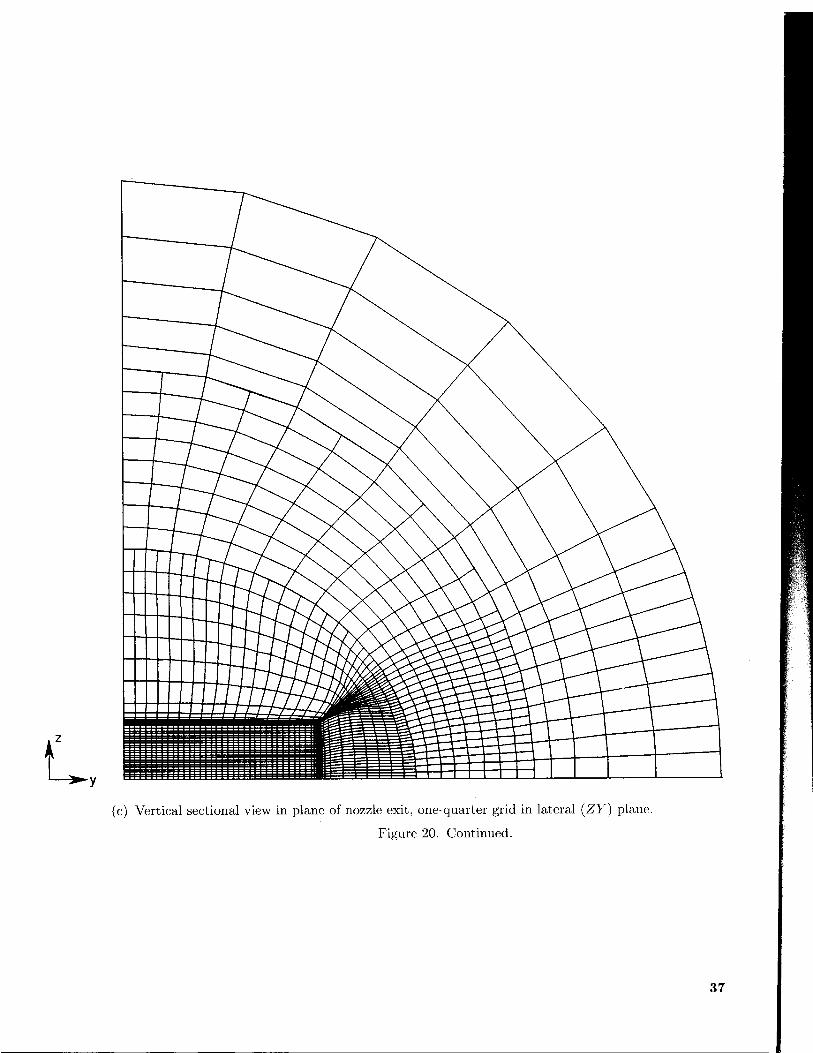
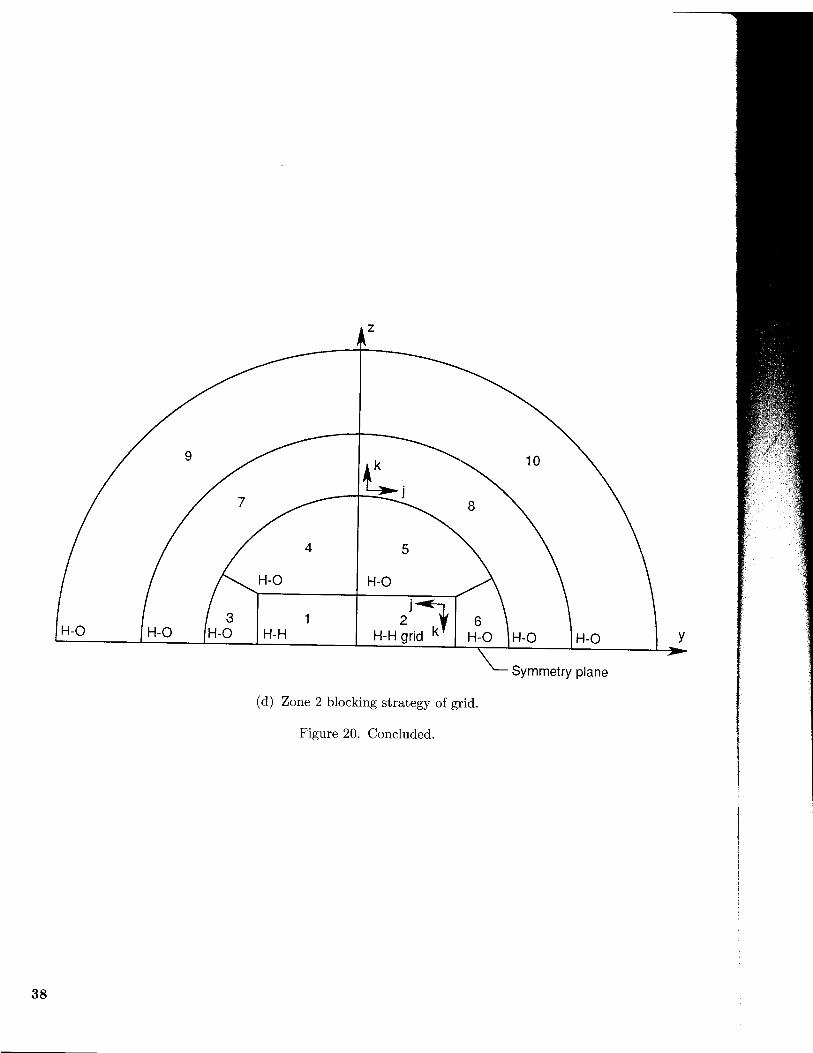
Grid de�nition. The computational grid wassplit into 4 streamwise zones, with the �rst zone con-taining 2 blocks and the remaining 3 zones containing10 blocks each. A representative sketch of the grid isshown in �gure 20. A quarter-plane cross-sectionalcut of the grid at the nozzle exit plane and the block-ing strategy are shown in �gures 20(c) and 20(d).Blocks 1 and 2 in zone 1 modeled the internal owpath containing 41�49�37 grid points, each using anH-H topology. The cross-plane and boundary-layergrid was similar to that used for case 2. More denselypacked grid is placed in the external lateral sidewallregion, where the vectored ow could exhaust intothe static free stream. All the external blocks usedH-O grid topology.
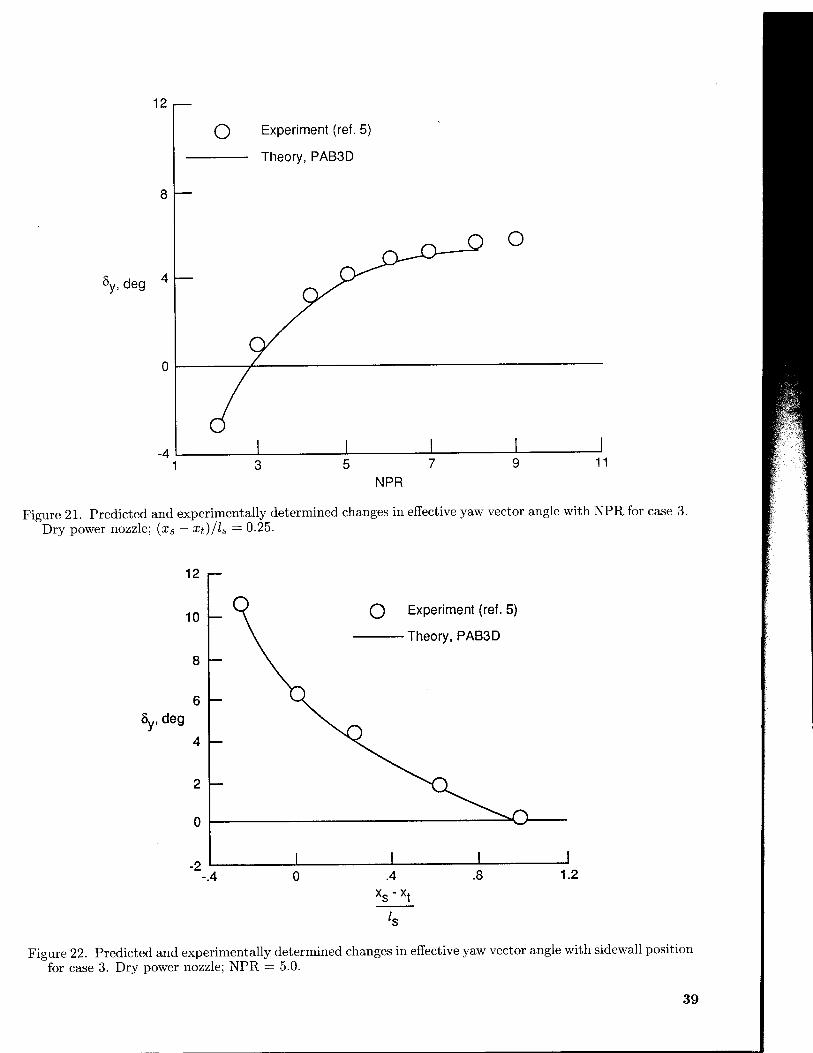
Performance calculation. Calculation of ef-fective yaw vector angle required the determinationof both the axial force and the side force generatedby the nozzle ow. Integration of the momentum uxes and the shearing forces across the nozzle exitface and the cutaway part of the sidewall accountedfor all the vectoring forces. The prediction of thechange in e�ective yaw vector angle with NPR for a�xed sidewall cutback position is shown in �gure 21.Prediction of the change in e�ective yaw vector an-gle with sidewall position for a �xed NPR is shownin �gure 22.
6
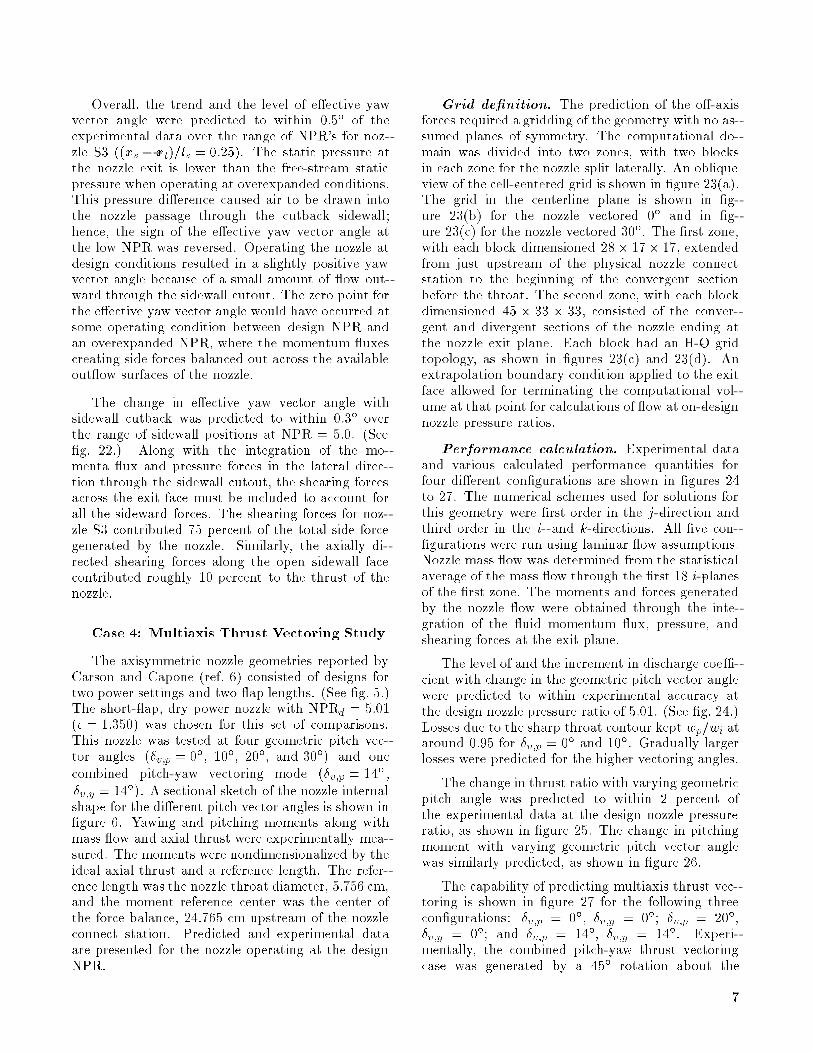
Overall, the trend and the level of e�ective yawvector angle were predicted to within 0.5� of theexperimental data over the range of NPR's for noz-zle S3 ((xs � xt)=ls = 0:25). The static pressure atthe nozzle exit is lower than the free-stream staticpressure when operating at overexpanded conditions.This pressure di�erence caused air to be drawn intothe nozzle passage through the cutback sidewall;hence, the sign of the e�ective yaw vector angle atthe low NPR was reversed. Operating the nozzle atdesign conditions resulted in a slightly positive yawvector angle because of a small amount of ow out-ward through the sidewall cutout. The zero point forthe e�ective yaw vector angle would have occurred atsome operating condition between design NPR andan overexpanded NPR, where the momentum uxescreating side forces balanced out across the availableout ow surfaces of the nozzle.
The change in e�ective yaw vector angle withsidewall cutback was predicted to within 0.3� overthe range of sidewall positions at NPR = 5.0. (See�g. 22.) Along with the integration of the mo-menta ux and pressure forces in the lateral direc-tion through the sidewall cutout, the shearing forcesacross the exit face must be included to account forall the sideward forces. The shearing forces for noz-zle S3 contributed 75 percent of the total side forcegenerated by the nozzle. Similarly, the axially di-rected shearing forces along the open sidewall facecontributed roughly 10 percent to the thrust of thenozzle.
Case 4: Multiaxis Thrust Vectoring Study
The axisymmetric nozzle geometries reported byCarson and Capone (ref. 6) consisted of designs fortwo power settings and two ap lengths. (See �g. 5.)The short- ap, dry power nozzle with NPRd = 5:01(� = 1:350) was chosen for this set of comparisons.This nozzle was tested at four geometric pitch vec-tor angles
��v;p = 0�; 10�; 20�; and 30�
�and one
combined pitch-yaw vectoring mode��v;p = 14� ,
�v;y = 14��. A sectional sketch of the nozzle internal
shape for the di�erent pitch vector angles is shown in�gure 6. Yawing and pitching moments along withmass ow and axial thrust were experimentally mea-sured. The moments were nondimensionalized by theideal axial thrust and a reference length. The refer-ence length was the nozzle throat diameter, 5.756 cm,and the moment reference center was the center ofthe force balance, 24.765 cm upstream of the nozzleconnect station. Predicted and experimental dataare presented for the nozzle operating at the designNPR.
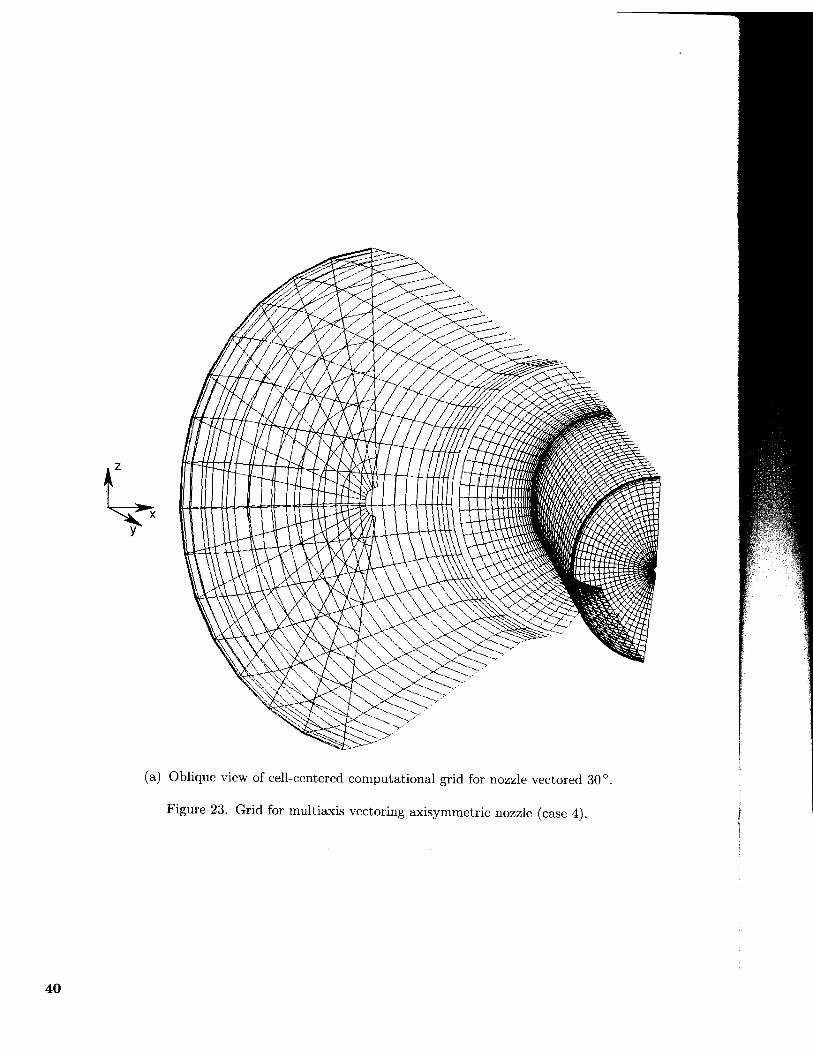
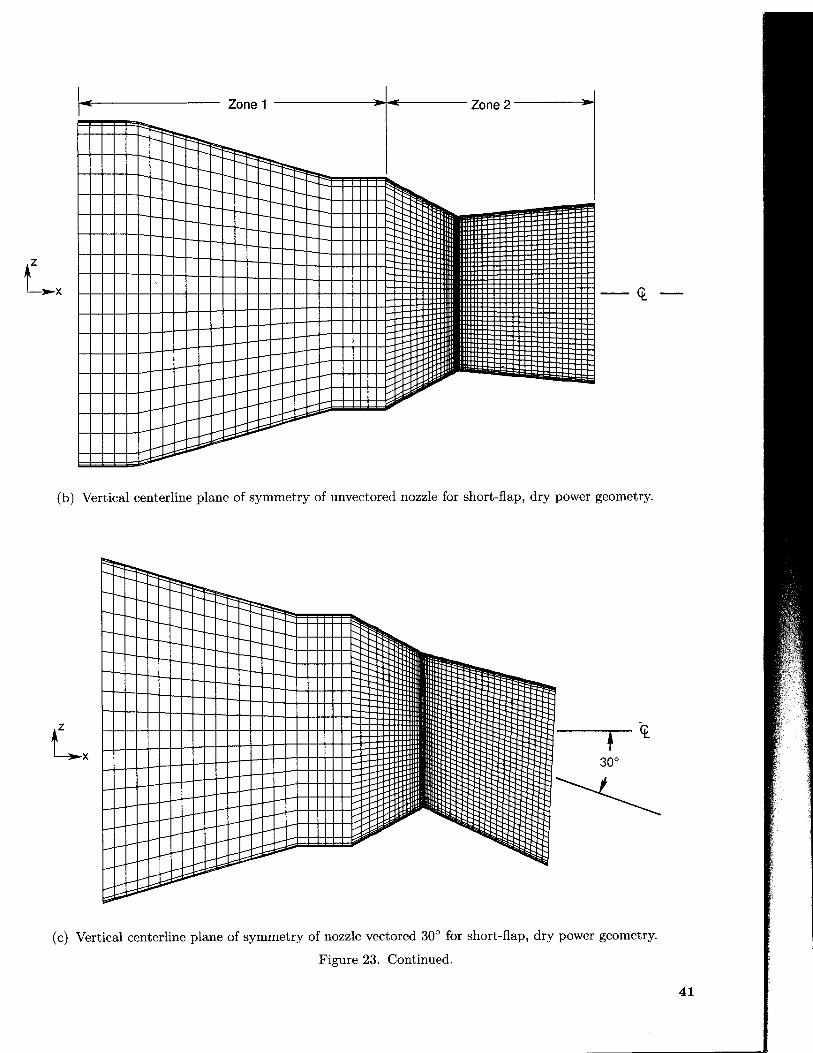
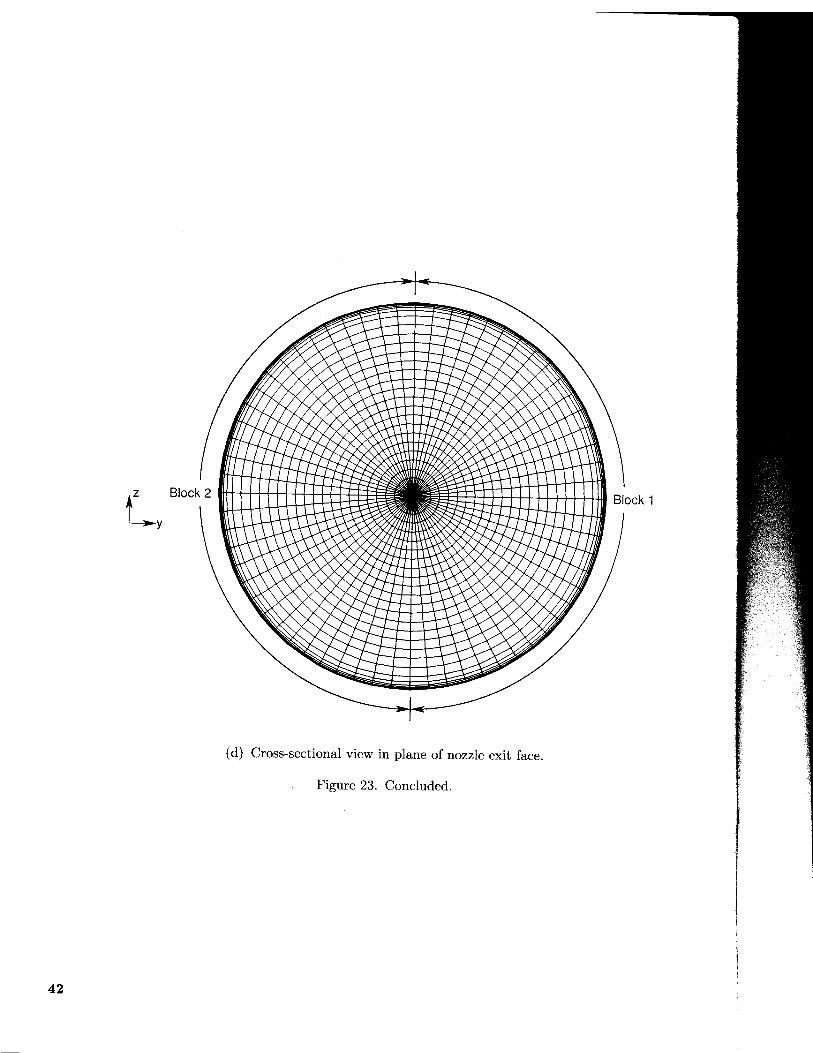
Grid de�nition. The prediction of the o�-axisforces required a gridding of the geometry with no as-sumed planes of symmetry. The computational do-main was divided into two zones, with two blocksin each zone for the nozzle split laterally. An obliqueview of the cell-centered grid is shown in �gure 23(a).The grid in the centerline plane is shown in �g-ure 23(b) for the nozzle vectored 0� and in �g-ure 23(c) for the nozzle vectored 30�. The �rst zone,with each block dimensioned 28� 17� 17, extendedfrom just upstream of the physical nozzle connectstation to the beginning of the convergent sectionbefore the throat. The second zone, with each blockdimensioned 45 � 33 � 33, consisted of the conver-gent and divergent sections of the nozzle ending atthe nozzle exit plane. Each block had an H-O gridtopology, as shown in �gures 23(c) and 23(d). Anextrapolation boundary condition applied to the exitface allowed for terminating the computational vol-ume at that point for calculations of ow at on-designnozzle pressure ratios.
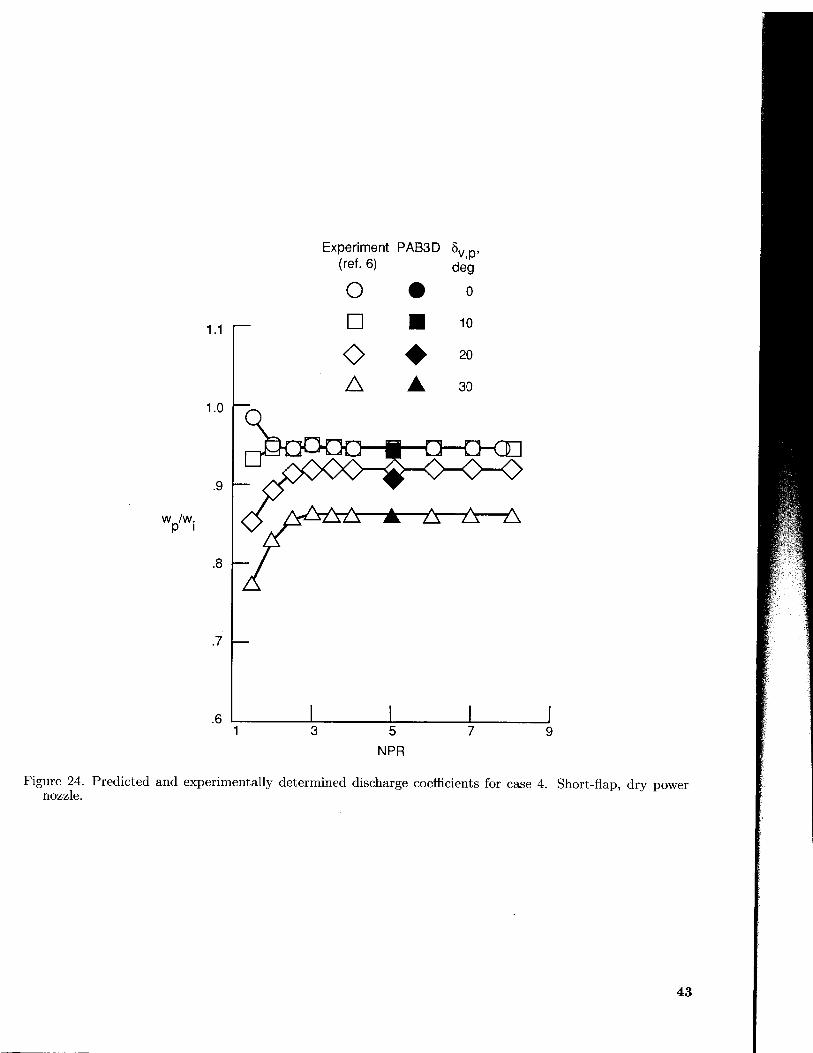
Performance calculation. Experimental dataand various calculated performance quantities forfour di�erent con�gurations are shown in �gures 24to 27. The numerical schemes used for solutions forthis geometry were �rst order in the j-direction andthird order in the i- and k-directions. All �ve con-�gurations were run using laminar ow assumptions.Nozzle mass ow was determined from the statisticalaverage of the mass ow through the �rst 18 i-planesof the �rst zone. The moments and forces generatedby the nozzle ow were obtained through the inte-gration of the uid momentum ux, pressure, andshearing forces at the exit plane.
The level of and the increment in discharge coe�-cient with change in the geometric pitch vector anglewere predicted to within experimental accuracy atthe design nozzle pressure ratio of 5.01. (See �g. 24.)Losses due to the sharp throat contour kept wp=wi ataround 0.95 for �v;p = 0� and 10�. Gradually largerlosses were predicted for the higher vectoring angles.
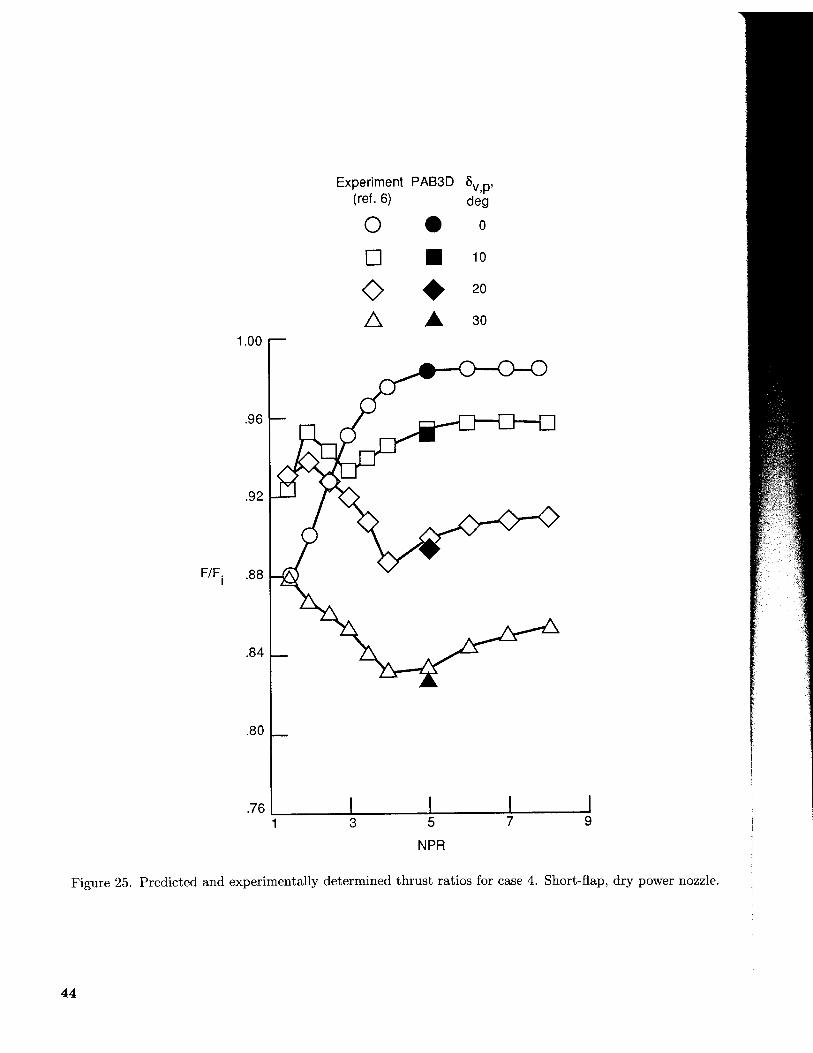
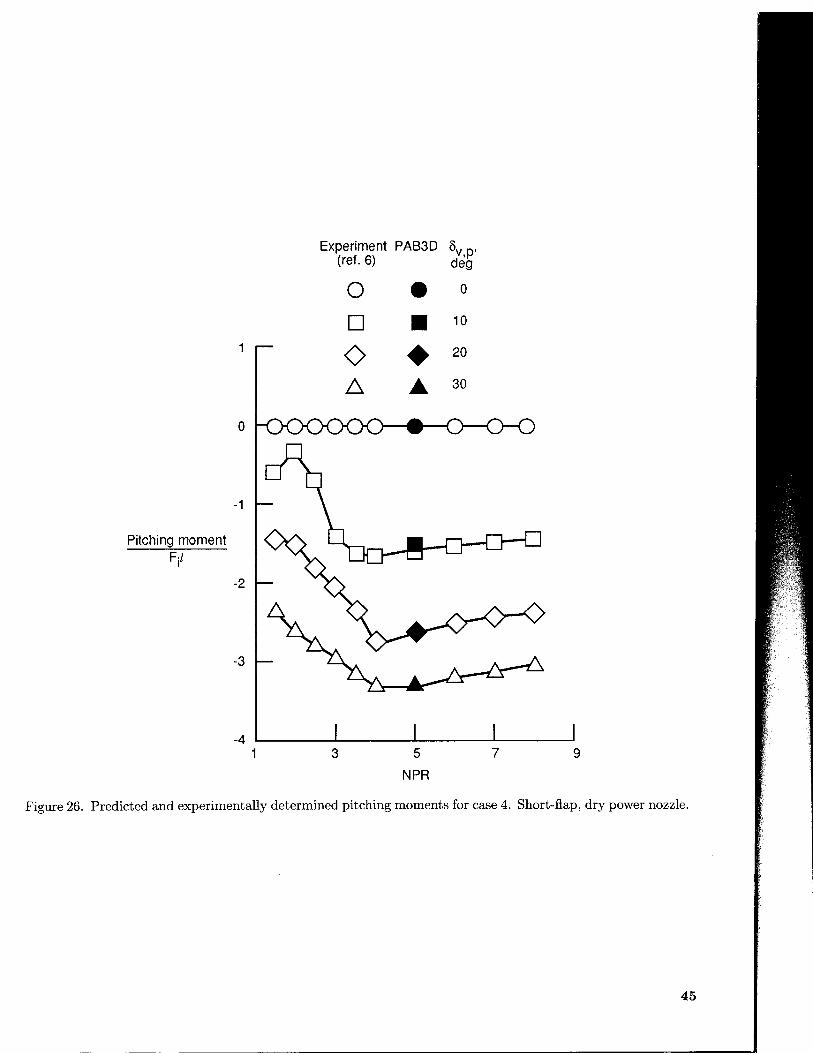
The change in thrust ratio with varying geometricpitch angle was predicted to within 2 percent ofthe experimental data at the design nozzle pressureratio, as shown in �gure 25. The change in pitchingmoment with varying geometric pitch vector anglewas similarly predicted, as shown in �gure 26.
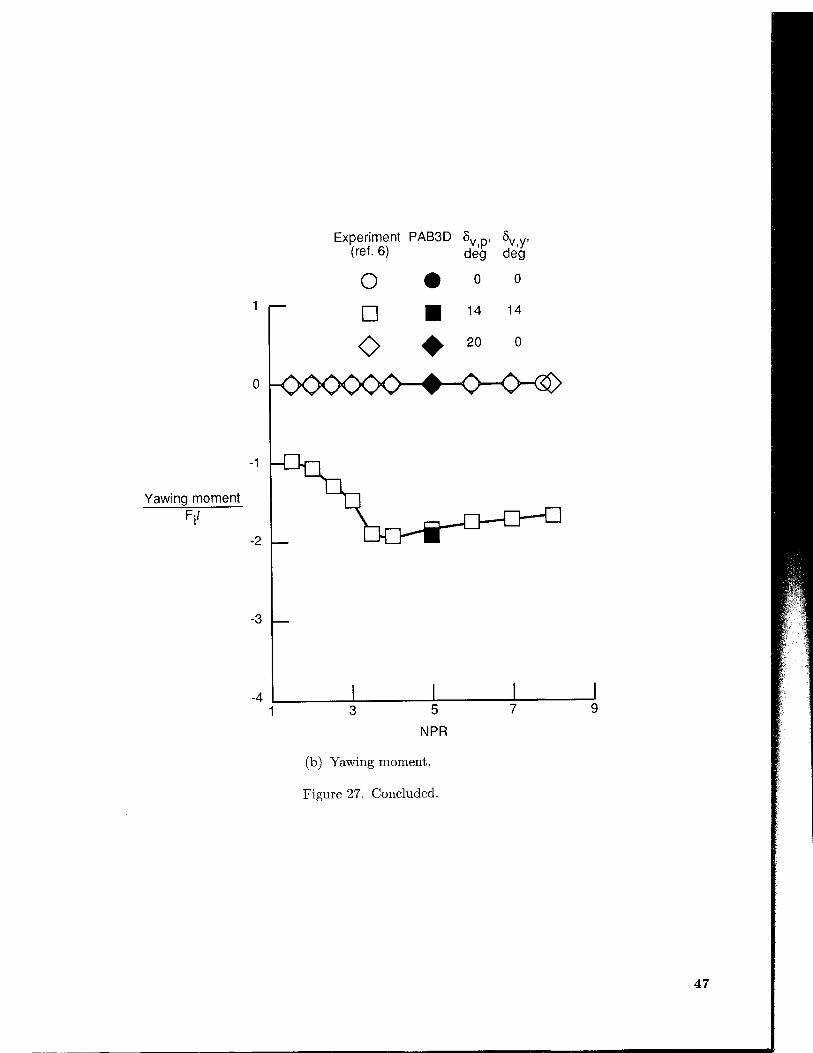
The capability of predicting multiaxis thrust vec-toring is shown in �gure 27 for the following threecon�gurations: �v;p = 0�, �v;y = 0�; �v;p = 20�,�v;y = 0�; and �v;p = 14�, �v;y = 14�. Experi-mentally, the combined pitch-yaw thrust vectoringcase was generated by a 45� rotation about the
7
centerline axis at the nozzle connect station of thenozzle with 20� of pitch vectoring. Exactly the samemethodology was numerically applied to the ana-lytical description of the 20� pitch vector geometryto produce the combined pitch-yaw computationalgrid. Numerically the yawing moments predictedfor the �v;y = 0� geometries were zero. The pre-dicted yawing moment for the combined pitch-yawgeometry was within 0.7 percent of the experimentaldata (�g. 27(b)). Similar agreement of experimen-tal data with predicted pitching moment is shown in�gure 27(a). The relative levels of pitching momentwere within 1 percent of experimental levels, and inparticular the loss of pitching moment due to rota-tion of the pitch axis by 45� was predicted.
Conclusions
A nozzle internal performance module has beenwritten and incorporated into a three-dimensionalNavier-Stokes solver PAB3D for the calculation ofnozzle internal performance. The ow quantitiescalculated are discharge coe�cient; normal, side,and axial thrust ratios; rolling, pitching, and yawingmoments; and e�ective pitch and yaw vector angles.The calculations were compared with experimentaldata from several investigations performed in thestatic test facility of the Langley 16-Foot TransonicTunnel. The results are summarized as follows:
1. Nozzle discharge coe�cient was predicted towithin experimental accuracy over a range of noz-zle pressure ratios from design to underexpandedpressure ratios.
2. The e�ect of throat contour geometry on noz-zle discharge coe�cient and thrust ratio was pre-dicted over a range of nozzle pressure ratios for atwo-dimensional convergent-divergent nozzle.
3. The e�ect of sidewall cutback on the e�ectiveyaw vector angle generated by a two-dimensionalconvergent-divergent nozzle operating at anunderexpanded pressure ratio was predicted typi-cally to within 0.5� of the experimental data. Thee�ect of varying nozzle pressure ratio from over-expanded to underexpanded conditions on e�ec-tive yaw vector angle for a �xed sidewall cutbackposition was also predicted typically to within0.5 percent of the experimental data.
4. Thrust vectoring forces and moments were pre-dicted typically within 2 percent of experimentaldata for an axisymmetric multiaxis thrust vector-ing nozzle operating at the design nozzle pressureratio.
NASA Langley Research Center
Hampton, VA 23681-0001
August 13, 1992
8
Appendix A
Calculation of Design Nozzle Pressure
Ratio
The physical geometry of a nozzle �xes the noz-
zle pressure ratio (NPR) at which the most e�cient
operation of the nozzle occurs. The following equa-
tions are used to determine the design NPR when the
nozzle expansion ratio � is known.
The inverse of the nozzle expansion ratio is the
ratio of the nozzle throat area to the nozzle exit area:
At
Ae=
1
�(A1)
The nozzle exit Mach number (isentropic) is solved
by using a Newton iterative method on the following
equation:
A?
A=
� + 1
2
� +12( �1)
Md
�1 +
� 1
2Md
2
� � +12( �1)
(A2)
whereAt
Aeis used for A?
A. The ratio
ppt
is calculated
from the Mach number:
p
pt=
�1 +
� 1
2Md
2
� �
�1
(A3a)
The inverse ofppt
is the design pressure ratio of the
nozzle:
NPRd =1
p=pt(A3b)
9
Appendix B
Calculation of Initial Flow-Field
Solutions
A starting Mach number distribution is deter-mined from the area distribution of the internal ge-
ometry�AtA
�using equation (A2) and assuming sonic
conditions at the throat. The dimensionless ratios oftemperature and pressure are then calculated fromthe Mach number distribution interpolated to cell-centered coordinates with the following 1-D isen-tropic relations:
T
Tt=
�1 +
� 1
2Ml
2
��1
(B1)
p
pt=
�1 +
� 1
2Ml
2
� � �1
(B2)
Typical scale-model operating jet total-pressureand total-temperature levels are chosen to calculate
the quantities �, u, and e with the following equa-tions:
T = Tt;jT
Tt(B3)
p = pt;jp
pt(B4)
� =p
RT(B5)
a =p RT (B6)
u = aMl (B7)
e =1
2�u2+
p
� 1(B8)
Each plane of cells (i= Constant ) is uniformly as-signed these quantities. The initial solution assumesthe cross-components of velocity (e.g., v and w) arezero. The ow variables �, �u, �v, �w, and e are thenwritten to the restart �le of the code and utilized asthe initial solution.
10
References
1. Abdol-Hamid, Khaled S.: The Application of 3D March-
ing Scheme for the Prediction of Supersonic Free Jets.
AIAA-89-2897, July 1989.
2. Kuchemann, Dietrich; and Weber, Johanna: Aerodynam-
ics of Propulsion, First ed. McGraw-Hill Book Co., Inc.,
1953.
3. Stratford, B. S.: The Calculation of the Discharge Coe�-
cient of Pro�led Choked Nozzles and the OptimumPro�le
for Absolute Air Flow Measurement. J. Royal Aeronaut.
Soc., vol. 68, no. 640, Apr. 1964, pp. 237{245.
4. Mason, Mary L.; Putnam, Lawrence E.; and Re,
Richard J.: The E�ect of Throat Contouring on Two-
DimensionalConverging-DivergingNozzles at Static Con-
ditions. NASA TP-1704, 1980.
5. Mason, Mary L.; and Berrier, Bobby L.: Static Investi-
gation of Several Yaw VectoringConcepts on Nonaxisym-
metric Nozzles. NASA TP-2432, 1985.
6. Carson, George T., Jr.; and Capone, Francis J.: Static
Internal Performance of an Axisymmetric Nozzle With
Multiaxis Thrust-VectoringCapability. NASA TM-4237,
1991.
7. Newsome,RichardW.; Walters,RobertW.; and Thomas,
James L.: An E�cient Iteration Strategy for Upwind/
Relaxation Solutions to the Thin-Layer Navier-Stokes
Equations. A Collection of Technical Papers|AIAA 8th
Computational Fluid Dynamics Conference, June 1987,
pp. 126{142. (Available as AIAA-87-1113.)
8. Abdol-Hamid, Khaled S.; and Compton, William B.,
III: Supersonic Navier-Stokes Simulations of Turbulent
Afterbody Flows. A Collection of Technical Papers|
AIAA 7th Applied Aerodynamics Conference, American
Inst. of Aeronautics and Astronautics, July{Aug. 1989,
pp. 268{277. (Available as AIAA-89-2194-CP.)
9. Cheatham, P. L.; Walker, S. H.; and Gridley, M. C.:
Computationof VectoringNozzlePerformance. AIAA-90-
2752, July 1990.
10. Schlichting, Hermann (J. Kestin, transl.): Boundary-
Layer Theory, Seventh ed. McGraw-HillBook Co., c.1979.
11


![Physics design of a high- quasi-axisymmetric stellaratorphoenix.ps.uci.edu/zlin/bib/reiman99.pdf · axisymmetric (QA) [1,2]. This paper discusses key physics issues that have been](https://img.pdfslide.tips/doc/110x75/5f707848fb9ed6719236c307/physics-design-of-a-high-quasi-axisymmetric-axisymmetric-qa-12-this-paper.jpg)