Embed Size (px)
Citation preview
ACCURACY OF FURAN ANALYSIS IN ESTIMATING
THE DEGREE OF POLYMERIZATION
IN POWER TRANSFORMERS
Nkosenye Sidwell Mtetwa
A research report submitted to the Faculty of Engineering and the Built
Environment, University of the Witwatersrand, in partial fulfillment of the
requirements for the degree of Master of Science in Engineering
2
TABLE OF CONTENTS
Abstract ………………………………………………………..…………………..…...…3
Abbreviations and Acronyms .………………………………..…………………..…...…..4
Acknowledgements ………………………………………..…….………………..…........5
Chapter 1 – Research Background …………………………………….……..……...…6
1.1 Introduction ………………………………………………………….……...……..….6
1.2 Overview of the Report ……………………………………………….…...……..…...6
Chapter 2 – Power Transformer Aspects ……….…………………….….…………….7
2.1 Transformer Design, Construction and Life Expectancy …...……..….….…....……...7
2.2 Ageing of Transformer Insulation .………………………………….….…....………..8
2.2.1 Effects of Oxygen …...…………………………………………….....…....………...9
2.2.2 Effects of Moisture ……………………………………………….....……....…....…9
2.3 Degree of Polymerization ……………………………………………..……....…......10
2.4 Furanic analysis……………….………………………………………..…….……....12
2.5 Correlation between Furanic analysis and Degree of Polymerization …………........12
Chapter 3 – Discussion and Analyses...………….……………………………….........16
Chapter 4 – Case Studies ...…………………………………………………….…..…..18
Chapter 5 – Research Conclusions and Recommendations …………………..……..21 5.1 Conclusions …………………………………………………...……………..…....…21
5.2 Recommendations …………………………………………………………..…….…22
Chapter 6 – References and Bibliography ………………………………….…….…..22 6.1 References ……………………………………………………………........…...........22
6.2 Bibliography ………………………………………………………….………….…..23
3
ABSTRACT
The life of a transformer is determined by the life of its paper insulation. The age of the
paper insulation is determined by the mechanical strength of the paper and is measured in
terms of its Degree of Polymerization (DP). The traditional method of determining the
DP, called the direct method, requires actual paper samples and is therefore intrusive and
costly. The method used more recently, called the indirect method, estimates the DP value
from the furan compounds dissolved in the oil. The aim of this research was to investigate
the accuracy of the indirect method in determining the remaining life of a transformer.
This was achieved by first considering the ageing processes, as covered in the literature,
and checking whether the existing mathematical models, relating the furan content to the
DP, have integrated all the factors of the ageing process. It was found that the indirect
method is not 100% accurate, and that the inaccuracy increases with age as more external
factors come into effect. It is recommended that results based on the indirect method be
treated as an approximation. To reduce the degree of inaccuracy it is recommended that a
good history of the transformer oil be kept, the DP be determined using the direct method
before a transformer is dispatched from the factory, and to not use the indirect method if
oil has been replaced within the past five years.
4
ABBREVIATIONS
DP Degree of Polymerization
DGA Dissolved Gas Analysis
PPB Parts per Billion
PPM Parts Per Million
TU Thermally Upgraded
2FAL 2-Furaldehyde
5
ACKNOWLEDGEMENTS
First and foremost thanks be to God Almighty, who is the only giver of life, for the
opportunity He has given me on earth. Thanks also to Dr. John van Coller who entrusted
me to research on this topic. Thanks to Eskom Enterprise Technical Support Service
Laboratory staff for assisting me with database extracts and to Elmon Skhosana from
Rotek Engineering for his help identifying transformer specimens.
My thanks also go to my colleagues Roger, Nkosinathi, Michael and Keri for their
support, and advice. Lastly but not least thanks to my wife, Thandazile and my sons
Ntokozo and Ntobeko for allowing me some time to concentrate on this research. To you
all Unwele Olude (Zulu idiom meaning ‘may you live longer’).
6
CHAPTER 1 BACKGROUND
1.1 Introduction
Transformer failures are costly. Utilities prefer to retire a transformer just before it
reaches the end of its useful life. This ‘end of useful life’ point is determined by the
remaining life of the paper insulation. A well established method of determining the
remaining life is to determine the degree of polymerization (DP) of the paper. New paper
has a DP of more than 910 and aged paper, that has reached the end of its useful life, has
a DP of about 200. To measure the DP, a paper sample from the hottest spot of the
winding should be removed. This method is, however, intrusive, which makes its
application limited.
An alternative method is to estimate the DP from the oil furan concentration - 2-
furaldehyde in particular. This method is non-intrusive and is therefore preferred by
utilities. Since this method determines the DP based on a byproduct of the ageing process,
it needs to be investigated in terms of accuracy.
This research project was aimed at investigating the accuracy of the indirect method by
critically analyzing the existing mathematical models used to determine the DP from the
furan concentration. Recommendations are included after discussing the findings.
1.2 Overview Of The Report
In Chapter 2, transformers and their associated ageing processes are discussed, followed
by reflecting on the work already done by various researchers in terms of ageing and the
relation of DP to the ageing process. Finally, the mathematical models that have been
developed for the correlation of DP to the furan concentration are discussed.
In Chapter 3, the models are compared using arbitrary data from a transformer over its
service life. This is done in an attempt to reflect how these models differ from each other
as they were developed based on particular considerations, and to identify if there is a
model that can best represent all these models irrespective of the different criteria
originally used.
Chapter 4 gives some case studies to demonstrate the findings of Chapters 2 and 3. In
Chapter 5 conclusions are drawn in terms of the findings of this research and
recommendations are given on how these models can be applied taking into consideration
their limitations.
7
CHAPTER 2 TRANSFORMER ASPECTS Oil-filled power transformers have been used for more than a century. Although the
principle of operation of power transformers has remained the same for all these years,
advancements have been made in transformer insulation systems. If compared with other
key assets, such as motors and generators, a power transformer has the advantage of being
stationary, which means that mechanical wear is minimal (limited to the tap changer
mechanism).
The power transformer also forms a significant percentage of the total investment in the
power system. Every transformer owner therefore requires implementation of the best
practices available to effectively manage transformer life and in turn get a good return on
investment and revenue from the asset, and to minimize costly failures.
2.1 Transformer Design, Construction and Life Expectancy
Although publications such as IEEE C57.91-1995 mention a life span of about 20 years
for a power transformer, today the common belief is that an oil-filled transformer is
designed for a life expectancy of 30 to 40 years. There are however transformers that
have gone beyond this age and are still in operation. Fundamentally, the major
components of a transformer are windings with associated solid insulation, and the steel
parts e.g. core, frame, and tank. The steel parts can last for many years. This is true also
for the copper, from which the windings are made. This is however not the case with the
insulation system.
The transformer insulation system, primarily consisting of mineral oil, paper and other
cellulosic materials, has a finite life, even under ideal operating conditions. The paper
insulation life is defined by a chemical process normally called ageing which depends
primarily on temperature and time. Moisture and the presence of oxygen are other factors
that accelerate the ageing process.
When the insulating oil degrades, it can either be regenerated by treatment or even
replaced if necessary. For the cellulosic materials, in contrast, there is no easy and cost
effective way of replacing the paper insulation and its lost life cannot be recovered. This
is the reason why transformer owners are concerned with estimating the remaining life of
their transformers and the reason why good management of transformer life is important
right from the start.
Through research it has been found that there is a relationship between the tensile strength
of the paper and the associated DP value. The DP value indicates the number of monomer
units in the polymer as the cellulose is a linear polymer composed of individual
anhydrous glucose units linked by glucosidic bonds [1]. The current practice is to
measure the quality of the cellulose (remaining life) in terms of the DP value. To
determine the DP value, paper samples are taken from various locations within the
transformer windings and sent to a laboratory where they are analyzed. This is called the
direct method.
The problem with this method is that it is invasive, and every utility wants to maximize
the time its assets are in service. An alternate method of determining the DP value,
without taking the transformer out of service, involves analyzing the insulating oil for
furanic compounds, which are produced during the ageing of the cellulose insulation.
8
This method is referred to as the indirect method. Studies have been done which correlate
the DP value with the furan content in the oil. Mathematical models showing this
correlation have also been developed [2-3].
Furanic compounds that are formed during cellulose ageing include 2-furaldehyde, 5-
methul-2-furaldehyde, 5-hydroxylemethyl-2-furaldehyde, 2-acetyl furan, and 2-furfuryl
alcohol. It has been found that the most stable by-product is 2-furaldehyde, and its
concentration is therefore used by the indirect method for estimating the DP value.
2.2 Ageing of Transformer Insulation
The insulation system of a power transformer consists of hydrocarbon oil and cellulose
paper. Both oil and paper have been used as insulating materials in oil-filled transformers
for more than a century. These are effective insulators more especially in their
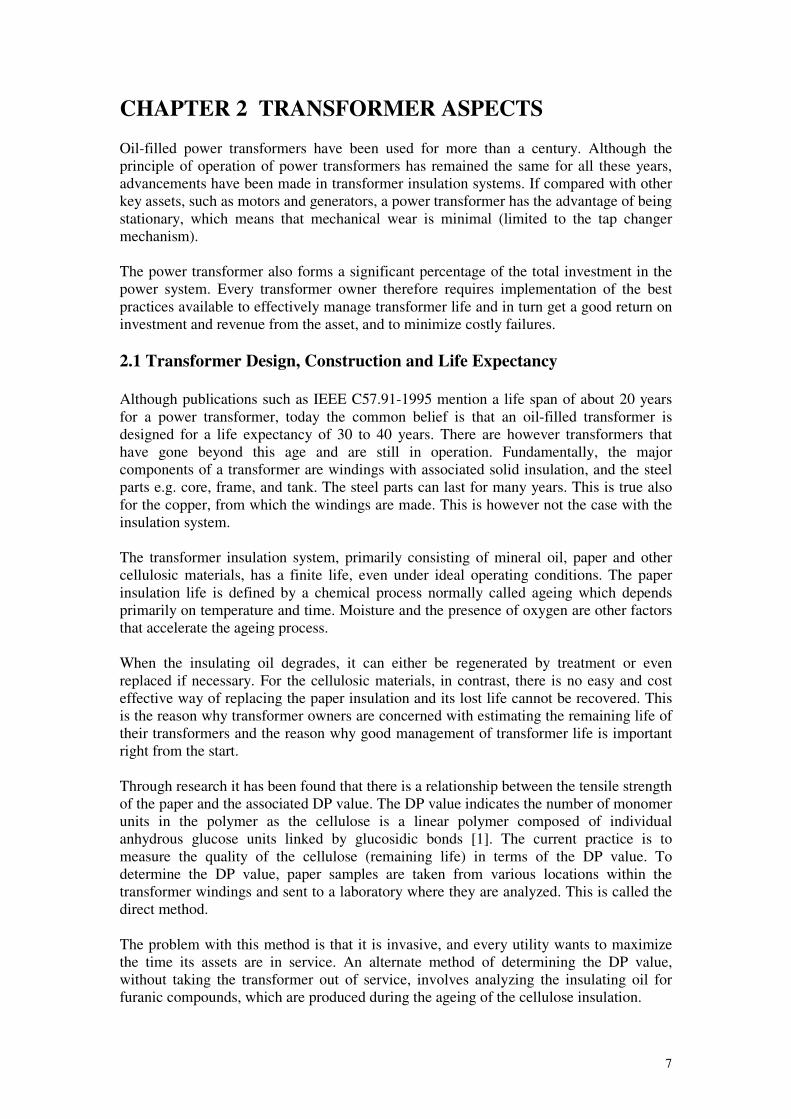
combination as it is revealed in their observed synergism [3].
Figure 1 : Transformer solid insulation system in a winding block.
Even under ideal conditions these two insulators age. Their ageing is a function of the
operating conditions, with thermal stresses being the fundamental and biggest contributor
to the rate of the ageing. Oil ageing can be easily detected from oil sample analyses and
oil can either be rejuvenated by some process or be replaced if the end of its useful life
has been reached.
With the paper insulation, this is not the case. The lost life cannot be recovered. In
addition, there is currently no cost-effective method of replacing the paper once it has
reached the end of its useful life. Once the paper has reached the end of its useful life, the
transformer is also declared as having reached the end of its useful life. According to
many publications the expected life of the paper under normal operating conditions is
approximately 20 years [4 - 5]. This life expectancy is based purely on the thermal
ageing, and does not consider other factors that accelerate the ageing process.
Cellulose, which is the major constituent of the Kraft paper, is a long straight chain of
glucose molecules. Kraft paper is used in preference to other paper types because of its
9
high purity. This paper is prepared for the electrical industry to a specific electrical
resistivity, and is a cheap source of insulation. The latter point is an important
consideration in the construction of the transformer taking into consideration the quantity
of paper that will be required. In this paper, the glucose rings are linked by glucosidic
bonds, and much of the mechanical strength of the paper comes from the long chain
cellulose polymer.
As the cellulose ages, the polymers are cleaved and become shorter, hence the mechanical
strength is reduced. The main factor causing degradation of paper insulation is thermal
stress. Degradation occurs even under normal operating temperatures, however this
process is accelerated at higher temperatures. Other factors that accelerate the ageing
process are the presence of moisture and the presence of oxygen.
Paper ageing in transformers is not uniform. The ageing will follow the thermal,
oxidation and moisture gradients. Transformer windings and leads are often wrapped with
a number of insulation paper layers, typically from seven layers up, depending on the
voltage stress levels. These paper layers constitute a great percentage of the entire
cellulose insulation. The purpose of the Kraft paper layers is to act as both electrical
insulation and to offer mechanical strength to the windings during faults and vibration
stresses. Like the rest of the insulation, this paper will age as the transformer continues in
service. It is normally in these layers that the weakest spot is developed during service
life. This is because the paper layers are greatly exposed to all factors of the ageing
process.
For a transformer that is running with inadequate cooling, overloading, and/or
localized hot spots, the paper layers that are the closest to the conductor will age faster
than those further away. The reason for this, is that the conductor is the source of heat.
The paper around the conductors/turns that are at the upper part of the winding age
faster than those at the bottom due to the heat gradient along the axial length of the
winding block. The paper of the hotter winding (HV or LV) will also age faster than
that on the other
2.2. 1 Effects of Oxygen
Paper ageing is influenced by the presence of oxygen. Thermally upgraded paper is less
sensitive to the presence of oxygen than the normal Kraft paper [5]. For a transformer that
is subjected to a high concentration of oxygen, the outer paper layers will have a lower
DP value than those inside, judged purely by the effect of oxygen. This is true for the
entire winding length because the oxygen gradient is along the radial axis of the
conductor or lead. Such a gradient pattern is because the paper provides a physical barrier
for the gas diffusion. This pattern is more visible on transformers that have free breathing
conservators as they have a high oxygen content.
2.2.2 Effects of Moisture
The effect of moisture (water) on the ageing of paper insulation is significant. The rate at
which the paper will degrade is directly proportional to the water content. Through
research it has been found that decreasing the water content from 1% to 0.5% doubles the
life of the paper insulation [6]. In a transformer, where there is a high water content, the
ageing will depend on the loading. For a transformer that is heavily loaded, the inner
layers are much warmer than the outer ones. This will make the water that has been
trapped in the inner paper layers move to the outer layer and to the surrounding oil
10
wherein it will get dissolved. The outer layers will, however, still be in contact with oil
and hence moisture. Therefore the outer layers will be more affected by moisture than the
inner ones.
For lightly loaded transformers, the temperature gradient is not significant since
temperature distribution is almost uniform. The water effect is therefore also relatively
uniform in all the layers.
These facts are to be considered when paper samples are taken from a transformer for DP
value determination. If these are not taken into account the wrong conclusion could be
drawn for a particular transformer.
As these cellulosic materials deteriorate, some by-products are formed, and these can
serve as indicators of the ageing process. The two most used by-products of the ageing
process are the furanic compounds and the carbon-oxide gasses. The advantage of using
these by-products is that the ageing process can be monitored while the transformer is in
service as opposed to taking a paper sample - which requires the unit to be taken out of
service. In most utilities the outage of the unit for analyses may not be favoured because
of production losses and other costs that are incurred during the analyses.
The paper deterioration leaves the transformer vulnerable to stresses generated by
thermal, mechanical and electrical transients.
2.3 Degree of Polymerization (DP)
The solid insulation used to insulate transformer winding conductors is a sheet of material
made from cellulose.
The main source of this cellulose fiber is wood, since wood contains up to 50% of
cellulose in a dry condition [3]. Cellulose is a linear polymer composed of individual
anhydrous glucose units linked at the first and fourth carbon atoms through a glucosidic
bond. The mechanical strength of cellulose is a function of the polymeric and fibrous
nature. The number of monomer units in the polymer chain is known as the DP value.
The quality of the cellulose material is measured in terms of this DP value [1].
The DP value is currently used by utilities as a diagnostic tool to determine the condition
of the solid material (particularly paper). New paper is estimated to have the DP value of
1000 to 1500. The DP value is first reduced by the drying processes that take place during
the assembling of the transformer. It is believed that after this process the DP value of the
paper is about 950 [3]. The paper will age in service as mentioned in the previous section
until a critical point is reached (see figure 2). This is when the paper is declared to have
reached the end of its useful life. This is also regarded as the end of the transformer
service life.
11
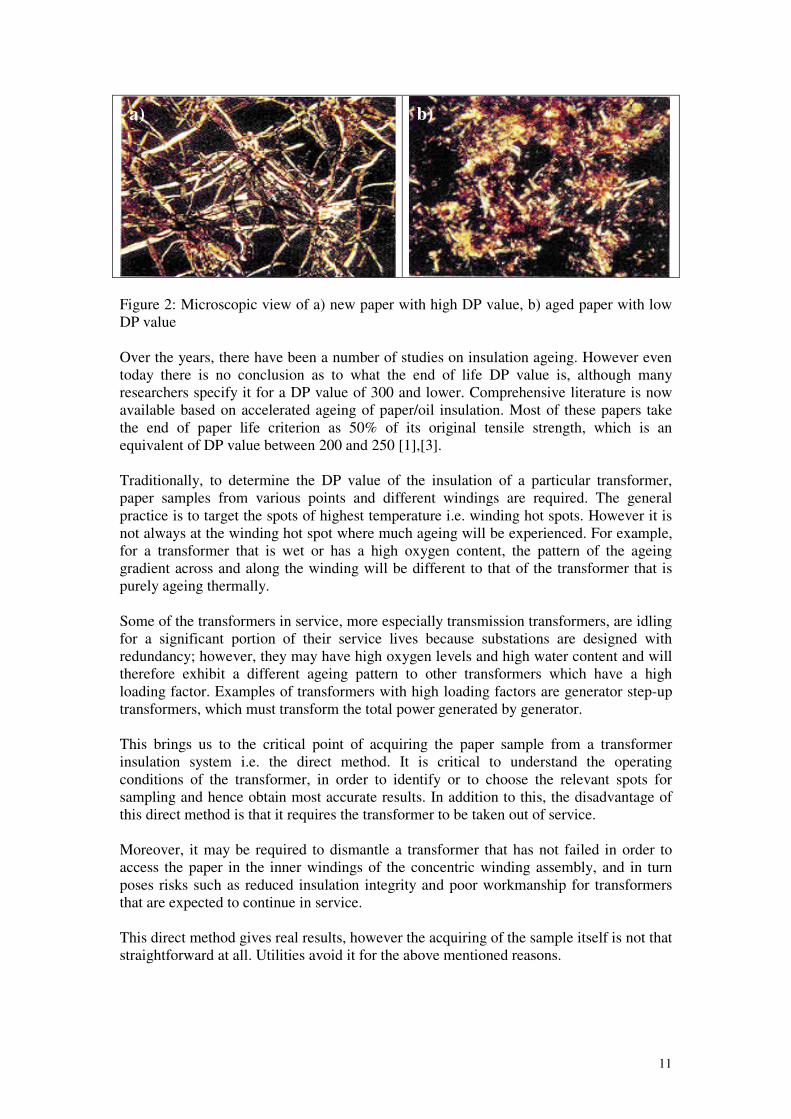
Figure 2: Microscopic view of a) new paper with high DP value, b) aged paper with low
DP value
Over the years, there have been a number of studies on insulation ageing. However even
today there is no conclusion as to what the end of life DP value is, although many
researchers specify it for a DP value of 300 and lower. Comprehensive literature is now
available based on accelerated ageing of paper/oil insulation. Most of these papers take
the end of paper life criterion as 50% of its original tensile strength, which is an
equivalent of DP value between 200 and 250 [1],[3].
Traditionally, to determine the DP value of the insulation of a particular transformer,
paper samples from various points and different windings are required. The general
practice is to target the spots of highest temperature i.e. winding hot spots. However it is
not always at the winding hot spot where much ageing will be experienced. For example,
for a transformer that is wet or has a high oxygen content, the pattern of the ageing
gradient across and along the winding will be different to that of the transformer that is
purely ageing thermally.
Some of the transformers in service, more especially transmission transformers, are idling
for a significant portion of their service lives because substations are designed with
redundancy; however, they may have high oxygen levels and high water content and will
therefore exhibit a different ageing pattern to other transformers which have a high
loading factor. Examples of transformers with high loading factors are generator step-up
transformers, which must transform the total power generated by generator.
This brings us to the critical point of acquiring the paper sample from a transformer
insulation system i.e. the direct method. It is critical to understand the operating
conditions of the transformer, in order to identify or to choose the relevant spots for
sampling and hence obtain most accurate results. In addition to this, the disadvantage of
this direct method is that it requires the transformer to be taken out of service.
Moreover, it may be required to dismantle a transformer that has not failed in order to
access the paper in the inner windings of the concentric winding assembly, and in turn
poses risks such as reduced insulation integrity and poor workmanship for transformers
that are expected to continue in service.
This direct method gives real results, however the acquiring of the sample itself is not that
straightforward at all. Utilities avoid it for the above mentioned reasons.
a) b)
12
2.4 Furanics
An alternative method for estimating the DP value of the paper insulation is non-
intrusive. Since some byproducts are formed during ageing and get dissolved in oil, the
oil can therefore be analyzed for furan content. The reason the furan content analysis is
preferred to carbon-oxide gas analyses, is that the carbon-oxide gasses are not only
formed during paper ageing. They are also formed from other activities such as partial
discharges and overheating. During an electrical discharge, carbon monoxide and carbon
dioxide are formed.
Carbon-oxide gasses can also be formed from materials other than those comprising
cellulose, such as oil, under some conditions. Recent studies [5] have shown that furanic
compounds are generated also if the cellulose is subjected to electrical discharges, but in
very small quantities. During thermal ageing, large quantities of furanic compounds can
be generated when cellulosic materials are exposed to very high temperatures (typically
above 120°C). The rate of accumulation will also be a function of other factors: oxygen
concentration and water content.
According to the findings of [5], once formed, the furanic compounds can then survive
for prolonged periods of time in bulk oil, which is at a much lower temperature than the
hottest spot in the insulation (winding). The types of furanic compounds that can be
formed are
• 2-furaldehyde
• 5-methul-2-furaldehyde
• 5-hydroxylemethyl-2-furaldehyde
• 2-acetyl furan
• 2-furfuryl alcohol.
The stability of the furanic compounds is of much interest in order to be able to draw
some conclusion from the analyses. Compounds which are not stable for a long period of
time will lead the analyst or the engineer to inaccurate conclusion. Some of the above-
mentioned furanic compounds are formed during ageing but are very unstable under a
number of conditions. These, therefore, cannot be used or are not useful for diagnostics.
The studies have revealed, through laboratory tests, that 2 furfural also referred to as the
2-furaldehyde (2FAL) is the most stable byproduct of cellulose ageing as it is stable for
years. It is therefore widely used as an indicator in order to predict the paper DP value
[5].
In the literature there is still debate on the issue of furanic compound accumulation from
thermally upgraded paper and from normal Kraft paper. Some literature [5] states that the
behaviour is different if using thermally upgraded paper while there are a few who state
that there is no difference in furanic compound behaviour between the thermally
upgraded paper and normal Kraft paper. This report assumes a different pattern for the
two types of insulating paper.
2.5 Correlation Between 2FAL and Degree of Polymerization
The removal of paper from a transformer is extremely difficult, especially if the
transformer is still expected to continue in service, and may lead to the failure of the unit
if not done with appropriate skill. The ability to estimate the condition of the paper
13
without exposing the transformer to such a risk is therefore desirable. It has been found
that indirect testing can be done by analyzing the oil for the concentration of the furanic
compounds, which are formed during the ageing process. After their formation during the
ageing process, the furanic compounds migrate from the paper into the oil and hence by
analyzing the oil the, DP value can be estimated.
Although the measurement of furanic compounds from an oil sample is relatively simple,
the interpretation is complex. As it has been mentioned before, more than one mechanism
is involved in the ageing process. At low temperatures, moisture and carbon-oxide gasses
are the more dominant products of the ageing process. The furanic compounds are
dominant at intermediate temperatures and are unstable at high temperatures [3]. Several
authors have studied paper ageing and have attempted to relate furanics to the DP value
[1- 7].
Such studies have been done based on data obtained from various specimens including
laboratory studies and transformers taken out of service for repair or investigation.
Mathematical models have been developed for the observed relationship between the DP
value and the furanic compound (2FAL) concentration.
The transformer loss of life model by Arrhenius is well known. It is based on the concept
that temperature is the only ageing parameter. According to this model, transformer
ageing is dictated by the ageing of the most thermally stressed location i.e. the hottest
spot usually referred to as just the hot spot. This model is given by equation 1 below [2].
+Θ+−
×∆×= 27310100%
BA
tLoL
where:
LoL% - loss of life
A,B – ANSI standard parameters
Θ - hot spot temperature in degrees Celcius
∆t – transformer operating time in hours, with hot spot temperature of Θ
The Arrhenius model assumes that the paper ageing is caused only by temperature. It is
therefore based on the prevailing hot spot temperature on the winding blocks and the
associated time duration of the thermal excursion. From these two main parameters
(temperature and time), the % lost life is estimated.
The challenge to get accurate estimation of remaining life from this model is due to
• The difficulty of accurately measuring the hot spot temperature and its duration as these
can only be estimated.
• The fact that ageing is not only due to thermal excursion but also from normal operating
temperatures and is aggravated by the presence of moisture and oxygen.
• The requirement to continually integrate all calculated lost life and deduct it from
original life (100%) to determine the residual life.
The Arrhenius model will tend to over estimate the remaining life.
Cheim and Dupont [6] built upon the Arrhenius model to come up with the expression
that will relate the universal parameter 2FAL to the DP value. In their model they
considered that ageing should be an indication of the average degradation of the winding.
They came up with the expression.
(1)
14
βα += )2ln(. FALLoL
where:
α,β - fitting parameters based on type of paper
2FAL – average value, in ppm, for a transformer operating t hours, having a
temperature gradient of the winding being ∆Θ.
This model, like Arrhenius’s, can be used determine the remaining life by deducting the
lost life from the original i.e. initial life.
In relation to the DP value, the Cheim-Dupont expression is:
dFALDP
ψ
λ
1
2
=
where,
λ - representing shortened expression [2]
d – parameter representing type of paper (thermally upgraded paper or normal Kraft)
The model by Cheim-Dupont is a better expression of the ageing process because it
relates paper ageing to both the hot spot gradient temperature and the paper type. Above
all, it gives a DP value that is based on the by-product of ageing (2FAL). The
shortcoming of this model is that when oil is either processed e.g. regenerated or
replaced, the 2FAL concentration will change and this will bring about more inaccuracy.
Further to this, the 2FAL concentration is an average value of different paper ageing rates
from various spots of the winding block, and is therefore not the accurate measurement of
the weakest spot.
Like the Arrhenius model, the Chem-Dupont model does not directly take into
consideration the effect of moisture and oxygen in accounting for the paper ageing. The
effect of these two parameters is indirectly accounted for by the fact that the 2FAL is
produced by ageing process and not only by thermal ageing.
The other most discussed models in literature are those of
• Chendong
• De Pablo and
• Burton
The Chendong model is expressed as shown in equation 4:
0035.0
51.1)2log(
−
−=
FALDP (4)
where the concentration of 2FAL is in ppm
This equation was developed based on the data collected from transformers that have
normal Kraft paper and free breathing conservators. Stebbins proposed a modified
Chendong equation to be used for thermally upgraded paper. Stebbins’s equation is given
by equation 5.
(2)
(3)
15
0035.0
51.4)88.0*2log(
−
−=
FALDP
For this equation the concentration of 2FAL is expressed in parts per billion (ppb).
Both the Chendong's and Stebbins's models are limited to only certain transformers, i.e.
according to the type of paper used for insulation. These models calculate the prevailing DP
value by purely considering the concentration of the furans in oil. The use of furans is better
than using purely hot spot gradient, because the former is based on the by-product of the
ageing process, which may be due to even the other factors.
The major setback with these models is in case where the oil has been replaced or
regenerated, which will vary the concentration of the furans as indicated in the case studies.
Like in the Cheim-Dupont model, the concentration of 2FAL is an average value and not the
real presentation of the weakest point.
De Pablo came with the model that is given by
FALDP
28.8
7100
+=
where 2FAL is in ppm, and the equation is linear.
The De Pablo model was also modified by Pahlavanpour et al.[3] in order to take into
consideration that paper ageing is not uniform and the assumption that 20% of the inner paper
layers in the winding degrade twice as fast as the rest of the insulation paper. The modified
De Pablo’s equation is
1]2*186.0[
800
+=
FALDP
and 2FAL is expressed in ppm.
The models wherein the DP value is calculated from 2FAL present a better estimation of the
DP value if compared to the earlier models where a hot spot gradient and its time duration are
used to calculate lost life. The use of 2FAL compound to calculate the DP value is a better
method because it indirectly takes into consideration the other factors of ageing because
2FAL is a by-product of ageing. Various models, using 2FAL concentration, as given above
(equations (3) – (7)) differ from each other either because of data samples they are based
upon or certain assumptions considered, but they do not present a total different new way of
determining the DP value i.e. they all use furans as a key parameter.
The common limitation with all these models [(3) – (7)] is that the concentration of 2FAL is
affected by oil replacement or by oil-reconditioning processes e.g. regeneration. In such
cases, when oil has been replaced or regenerated, the total picture in terms of 2FAL
concentration is distorted and very inaccurate results are the only outcome. This distortion of
2FAL is because oil processing that is done to treat the oil for better insulation properties will
discard or vary the furan concentration.
Such oil processes are [6]:
• Degassing by partial vacuum
• Mechanical filtration
• Oil reclamation
(5)
(6)
(7)
16
• Oil Change
Other sources of furan (2FAL) concentration distortion are
• The stability of the furanic compounds itself at various temperature levels
• Use of mixed paper i.e. normal Kraft and TU paper
• Electrical discharge and high temperatures which also yields 2FAL
• Transformer oil preservation systems
• Partial rewinds on a transformer
These models can therefore only be used in transformers where the oil has never been
replaced or reconditioned.
CHAPTER 3 DISCUSSION AND ANALYSES
Of much interest to the engineer or the transformer owner is knowledge of which model gives
more accurate estimation of the remaining life, determined as a DP value. The purpose of this
chapter is to bring together the models introduced in Chapter 2 so that they can be evaluated
from a common set of transformer history.
Such a comparison will assist in demonstrating if any of these models can be generally used
for any transformer, and not only limited to certain categories as was mentioned in the
previous chapter.
Chendong’s model, although based on the data from units containing normal Kraft paper and
free breathing conservators, has come to be used by some to evaluate the paper DP value for
all transformers. Is this application justified?
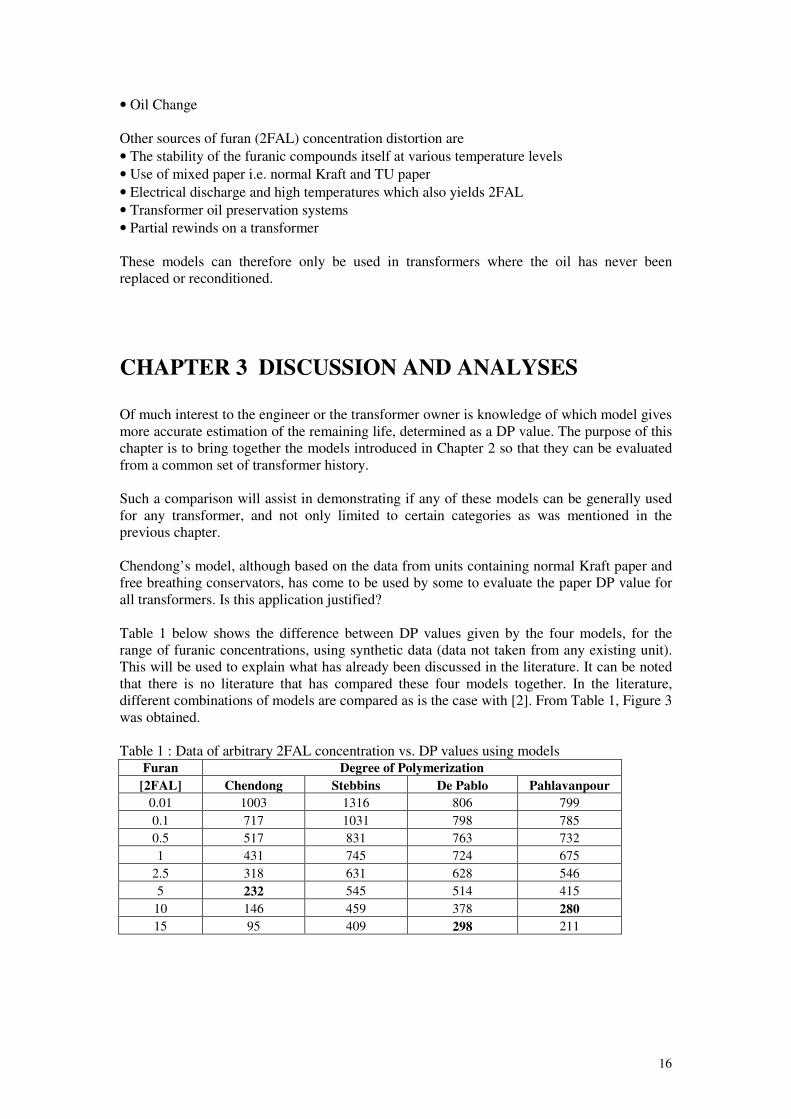
Table 1 below shows the difference between DP values given by the four models, for the
range of furanic concentrations, using synthetic data (data not taken from any existing unit).
This will be used to explain what has already been discussed in the literature. It can be noted
that there is no literature that has compared these four models together. In the literature,
different combinations of models are compared as is the case with [2]. From Table 1, Figure 3
was obtained.
Table 1 : Data of arbitrary 2FAL concentration vs. DP values using models Furan Degree of Polymerization
[2FAL] Chendong Stebbins De Pablo Pahlavanpour
0.01 1003 1316 806 799
0.1 717 1031 798 785
0.5 517 831 763 732
1 431 745 724 675
2.5 318 631 628 546
5 232 545 514 415
10 146 459 378 280
15 95 409 298 211
17
DP vs Furans
0
200
400
600
800
1000
1200
1400
0.01 1 2 3 4 5 6 7
Furans concentration in ppm
DP
Chendong
Stebbins
De Pablo
Pahlavanpour
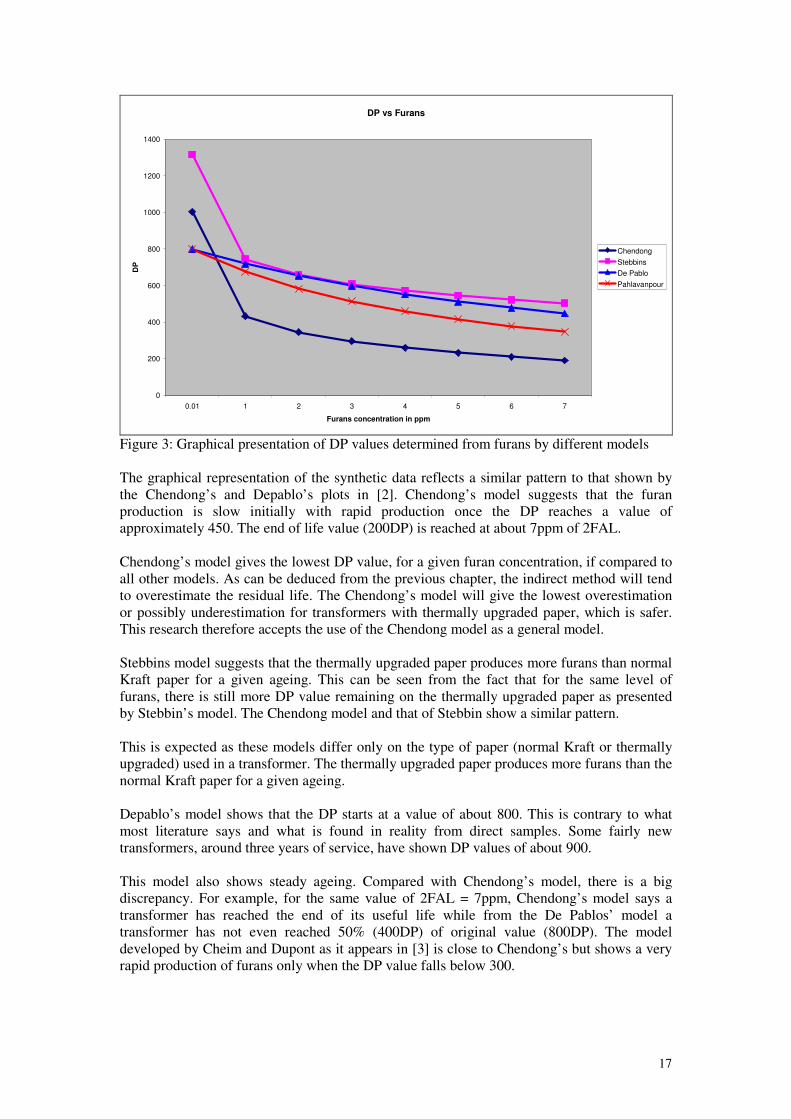
Figure 3: Graphical presentation of DP values determined from furans by different models
The graphical representation of the synthetic data reflects a similar pattern to that shown by
the Chendong’s and Depablo’s plots in [2]. Chendong’s model suggests that the furan
production is slow initially with rapid production once the DP reaches a value of
approximately 450. The end of life value (200DP) is reached at about 7ppm of 2FAL.
Chendong’s model gives the lowest DP value, for a given furan concentration, if compared to
all other models. As can be deduced from the previous chapter, the indirect method will tend
to overestimate the residual life. The Chendong’s model will give the lowest overestimation
or possibly underestimation for transformers with thermally upgraded paper, which is safer.
This research therefore accepts the use of the Chendong model as a general model.
Stebbins model suggests that the thermally upgraded paper produces more furans than normal
Kraft paper for a given ageing. This can be seen from the fact that for the same level of
furans, there is still more DP value remaining on the thermally upgraded paper as presented
by Stebbin’s model. The Chendong model and that of Stebbin show a similar pattern.
This is expected as these models differ only on the type of paper (normal Kraft or thermally
upgraded) used in a transformer. The thermally upgraded paper produces more furans than the
normal Kraft paper for a given ageing.
Depablo’s model shows that the DP starts at a value of about 800. This is contrary to what
most literature says and what is found in reality from direct samples. Some fairly new
transformers, around three years of service, have shown DP values of about 900.
This model also shows steady ageing. Compared with Chendong’s model, there is a big
discrepancy. For example, for the same value of 2FAL = 7ppm, Chendong’s model says a
transformer has reached the end of its useful life while from the De Pablos’ model a
transformer has not even reached 50% (400DP) of original value (800DP). The model
developed by Cheim and Dupont as it appears in [3] is close to Chendong’s but shows a very
rapid production of furans only when the DP value falls below 300.
18
The discrepancy among these models is an indication that more work is still required in
coming up with a more accurate method. Deviations from model to model are also due to
different ageing factors and ageing assumptions being considered by different models.
In order to identify which model is more accurate, case studies form part of this research. In
this way DP value determined using the direct method was compared to the DP value by the
indirect method, given by each of the discussed models. It was expected that no model would
be 100% accurate because of these facts:
• 2FAL, which is a commonly used parameter for the indirect method, is an average value
and is not an actual reflection of a most aged spot.
• 2FAL is not produced at all ageing temperatures [3].
There was difficulty in obtaining good specimens because:
• No specimen was available which contained oil that was put in from the beginning of the
transformer service life. Most of the failed units from which the physical paper samples were
taken had undergone oil replacement a few months (mostly 6-30 months) previously, and the
others had no available age assessment reports at all. The effect of oil replacement is shown in
the first case study given below.
• On the failed units, the oil is interfered with quickly. In most cases due to the nature of
failure, the 2FAL would not be from ageing in service alone.
Therefore, the analyses that could be done with these samples would not be an accurate
reflection of the ageing process.
CHAPTER 4 CASE STUDIES
Case Study No.1
A generator step up transformer with serial number 28042 was manufactured in 1984 by ABB
and was first commissioned in 1985. This was double-wound, with normal Kraft paper, and
free breathing conservator unit. The other name plate information is shown in table 2 below.
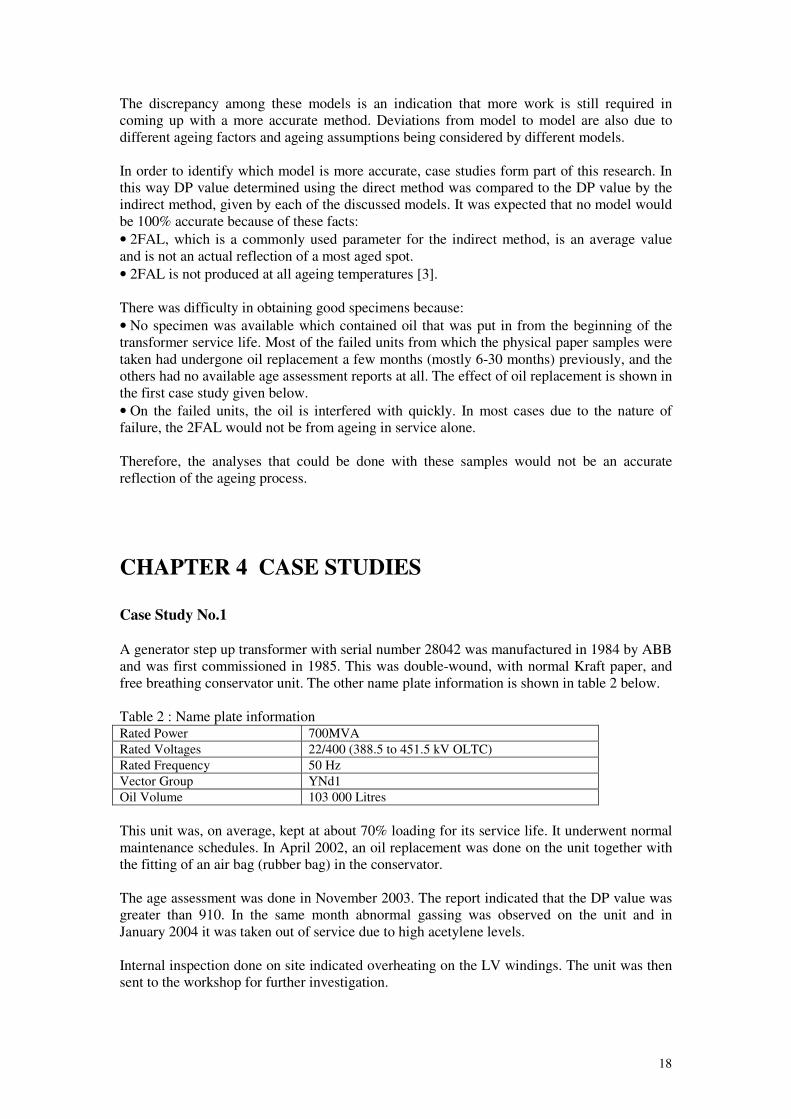
Table 2 : Name plate information Rated Power 700MVA
Rated Voltages 22/400 (388.5 to 451.5 kV OLTC)
Rated Frequency 50 Hz
Vector Group YNd1
Oil Volume 103 000 Litres
This unit was, on average, kept at about 70% loading for its service life. It underwent normal
maintenance schedules. In April 2002, an oil replacement was done on the unit together with
the fitting of an air bag (rubber bag) in the conservator.
The age assessment was done in November 2003. The report indicated that the DP value was
greater than 910. In the same month abnormal gassing was observed on the unit and in
January 2004 it was taken out of service due to high acetylene levels.
Internal inspection done on site indicated overheating on the LV windings. The unit was then
sent to the workshop for further investigation.
19
Direct samples were taken from various areas of the windings. The results indicated DP
values ranging from 250 to 570.
From this it can be seen that oil replacement has a large impact in the change in concentration
of furans (2FAL). Lots of information gets distorted and cannot be recovered in a short period
of time.
Case Study No.2 Two 80 MVA sister units installed at the same substation failed on 3 May 2007 after they
were subjected to a network fault. These two transformers were manufactured by GEC in
1977. The other name plate information is shown in Table 3 below.
Table 3: Name plate information Voltage 132/66/22kV autotransformer
Vector Group Yyn0d1
Frequency 50Hz
Oil Volume 30 000L
Age assessment that was done approximately 4.5 years prior to the failure indicated the
following:
Table 4: Extracts from the age assessment reports 7282/2 7282/1 Remarks
DP value
calculated from
furans
590
650
The Furanic content indicates significant
paper deterioration but still well away
from the critical point for 7282/2 and
mild to minimal paper ageing for 7282/1
Acid in oil 0.09 0.08 High acidity levels but not yet critical
for both units.
Tan delta 0.0507 0.027 This is still within the specification level
of less than 0.15
Colour
2.5
2
The colour grading indicates oxidation
on both units but just below the limit of
less than 2.5 for 7282/1
Estimated
remaining life
76% 80% Transformers have only lost less than
30% of original life in the past 25 years
20
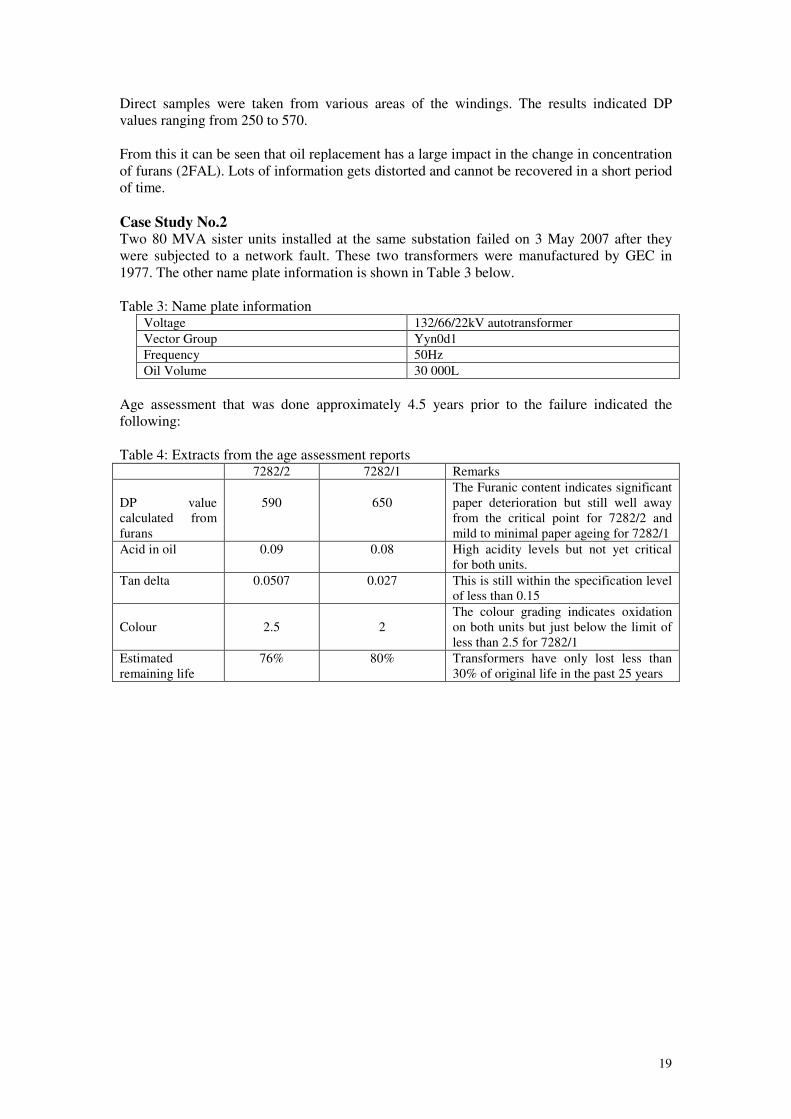
Ageing graph
0
100
200
300
400
500
600
700
800
900
1000
1977 1982 1987 1992 1997 2002 2007 2012 2017 2022 2027 2032
time in years
DP
Va
lue
7282/2 DP (furans)
7282/1DP (furans)
7282/2DP (direct)
7282/1DP (direct)
end of life
Figure 4: Trends of DP values based on furans and on direct method
For both these units the only available data, in terms of the age assessment reports, was for
the year 2002. After the units were sent to the workshop, following their failure, paper
samples were taken during the tear down in order to determine the DP value using the direct
method.
Assuming a linear ageing, the DP values based on the indirect method were calculated for
both units at the year of failure (2007). This was done to compare the results of these two
methods at the same age of the transformers. The initial DP value of 910 is based on the
Eskom laboratory reports that specify DP value up to 910, beyond that. The DP value is
indicated as > 910, which is also the accepted upper value in the available literature.
The calculated DP values for both 7282/1 and 7282/2 at the year of failure were 600 and 530
respectively. The results from the direct method showed that for 7282/1 the minimum DP
value was 328 and for 7282/2, the minimum DP value was 465. From these calculations and
measurements, it is observed that the indirect method gave an overestimation of about 83%
for 7282/1 and 14% for 7282/2.
The deviation between the two methods as observed in 7282/2 is within an acceptable range
in the view of the author of this report. Such a deviation is justified taking into consideration
that the indirect method gives an average value of ageing as opposed to the actual value of the
direct method. The deviation as seen in 7282/1 is very wide.
Such a wide deviation can be attributed to oil processing that might have taken place during
the life of this transformer, and no records could be found to justify this.
From this case study two observations are made. The first one is that the indirect method can
give results that are very close to the direct method i.e. within +20% (which the author
assumes to be the maximum deviation – no limit is specified in the literature) of the actual DP
value, given by the direct method, as in the case of 7282/2.
21
It is also possible that such good results were obtained because the weakest spot was missed
when the physical paper sample was taken for the direct method. The second observation is
that the results from the indirect method can also be very inaccurate as seen in 7282/1. Such a
wide deviation is concluded to be due to oil processing and/or oil change during service life,
or because the weakest spot was missed during the acquiring of the paper sample for the
direct method’s measurement.
CHAPTER 5 CONCLUSIONS AND
RECOMMENDATIONS
5.1 Conclusions
It is not possible to obtain an 100% accurate DP value from furan analysis as an indication of
the most aged spot of the insulation. The DP value obtained from the furan analysis (indirect
method) will tend to over estimate the remaining life of the transformer. This is because the
2FAL concentration that is obtained from the insulating oil is the average of all ageing rates,
at various winding block positions, and is not a value from the hot spot or from the most aged
spot. The degree of inaccuracy will also depend mostly on the external factors that have
influenced the concentration of the main furan component, 2FAL, e.g. oil replacement.
Therefore the use of 2FAL concentration in isolation of the history and design of a
transformer, i.e. to determine what processes did the oil undergo and what type of insulation
paper is in a transformer, will yield a very weak conclusion in terms of the remaining life.
These are not to be overlooked during a transformer life assessment.
Correlation exists between the 2FAL concentration in oil and the DP value of a paper
insulation. Mathematical models for this correlation have been successfully developed to a
certain degree of accuracy, and application of each model is limited by certain assumptions.
From the discussion in Chapter 3, the author concludes that the Chendong model can be used
for any transformer, irrespective of the type of insulation paper and whether a transformer is
free breathing or not, and results with least inaccuracy will be obtained. However oil history
must still be traced even when using this model.
The indirect method is used because of its non intrusiveness rather than because it gives a true
reflection of the residual life in the transformer. This can be seen from the case studies. The
indirect method has still many uncertainties and dynamics which must be researched.
These include, but are not limited to
• The stability of 2FAL in oil in terms of temperature and time
• The periods it takes after the oil processing to have a 2FAL concentration that is a true
representation of the ageing process
• What level of inaccuracy is accepted when using indirect method and why.
• The integrity of 2FAL, in terms of stability, taking into consideration the recent discoveries
e.g. chemical injection for the process of passivating the corrosive sulphur in oil. This has
proved to affect the DGA pattern
The advantage with the indirect method is that if it identifies a problem (very low DP value),
a problem definitely exists, however, problems can escape identification because it is an
average value and does not pinpoint the weakest spot. Use of furanic analysis to determine the
DP value is not an accurate method if this is done purely by mathematical models.
22
Knowledge of the transformer design (paper type), dominating ageing factor, and oil history
is required to reduce the degree of inaccuracy or to bring more understanding of the obtained
results.
These models (for the indirect method) can be applied, when integrated with understanding of
the transformer design and history of the transformer service life, to get reliable estimation of
the DP value. In order to use the indirect method and make as accurate as possible
conclusions, some recommendations are made in the next section.
5.2 Recommendations
• At the time of dispatching the transformer from the factory, the DP value, using the direct
method, must be determined - or the accepted 910 DP value must be used as the initial DP
value. Both the Arrhenius’s (equation 1) and Chem-Dupont’s (equation 2) models can then be
used to calculate the lost life when the unit is in service. The difference between the lost life
and original DP value is then the estimated remaining life.
• The other models can be used for the same exercise; however, the transformer must have
not undergone oil replacement/processing at least for the previous five years. There is no
strong conclusion in literature in terms of this 5 years period.
• The choice of mathematical model used must be based on the understanding of the
transformer design in terms of the paper used (TU or normal kraft), and on the dominating
ageing factor i.e. thermal or oxidation. The Chendong’s model is recommended.
• It must be taken into account when taking decisions, based on the DP value calculated from
the concentration of furans (indirect method), that the actual remaining life is less. The degree
of inaccuracy is expected to increase with the age of the unit as more external factors would
have crept in.
CHAPTER 6 REFERENCES AND BIBLIOGRAPHY
6.1 References
[1] TK, Review of Modern Diagnostic Techniques for Assessing Insulation Condition in Aged
Transformers. IEEE Transaction on Dielectrics and Electrical insulation, Vol. 10, No. 5;
October 2003
[2] Cheim L Dr. , Dupont C, On the Correlation Between 2-Furfural and DP A New
Transformer Ageing Model. Doble Engineering Company, 2004.
[3] Pahlavanpour B (Prof.), Eklund M (Dr.), Thermal Ageing of Mineral Insulating Oil and
Krafts Paper, Nynas Naphthenics AB, SE-14982 Nynashamn, Sweden
[4] Prevost TA, Gasser HP, Wicks R, Glenn B, DuPont RM, Estimation of Insulation Life
Based on a Dual Temperature Aging Model. Weidmann-ACTI Inc. Fifth Annual Technical
Conference Albuquerque, NM Nov. 13-15 2006.
[5] Griffin PI, Assessment of Paper and Other Cellulosic Materials in Service-Aged
Transformers. Doble Engineering Company, Presentation at Southeastern Electric Exchange,
June 24, 1999.
23
[6] Lewand LR. Practical Experience Gained from Furanic Compound Analysis. Doble
Engineering Company. 2006 - 73rd Annual International Doble Client Conference.
[7] McShane CP, Rapp KJ, Corkran JL, Gauger GA, Luksich J, Aging of Paper Insulation in
Natural Ester Dielectric Fluid. IEEE Transmission and Distribution Conference &
Exposition, Oct 28 – Nov. 02, 2001, Atlanta GA.
6.2 Bibliography
[A] Pradhan MK, Ramu TS, Diagnostic Testing of Oil Impregnated Paper Insulation in Pro-
rated Power Transformers under Accelerated Stress. Conference Record of the 2004 IEEE
International Symposium of Electrical Insulation, Indianapolis, IN USA, 19-22 September
2004.
[B] Hohlein I, Kachler AJ, Impact of Moisture on DP of Solid Insulation and Furan
Development in Oil at Transformer Service Temperatures. Cigre Session 2004, D1-309.
[C] Koch M, Prof Dr.-Ing. Dr.h.c. Feser K, Reliability and Influences on Dielectric
Diagnostic Methods to Evaluate the Ageing State of Oil-Paper Insulation.
[D] Weidmann Presentation, Furans.
[E] Sparling BD. Assessing the Life of the Transformer. GE Syprotec Inc. April 2004.
[F] De Pablo A, Mollmann A. New Guidelines for Furan Analysis As Well As Dissolved Gas
Analysis in Oil-Filled Transformers. Cigre’ 1996 : 15/21/33-19.
[G] Lombard AE, Degree of Polymerization, Eskom Generation Flyer
[H] Lombard AE, Furanics, Eskom Generation Flyer.
[I] Lapworth J, Wilson A. Transformer Life Management. A Doble presentation during the
IEEE conference at Wits University in Johannesburg. July 2007
[J] Loading Guide for Oil Immersed Power Transformers. IEC 60076-7 (2005)