Embed Size (px)
DESCRIPTION
Overview of VIC Meteorological Forcing Data Preparation. Alan F. Hamlet JISAO/CSES Climate Impacts Group Dept. of Civil and Environmental Engineering University of Washington. 2604 60km×60km grid cell. 黄河流域. 淮河流域. 长江流域. Distribution of meteorological station in China. Result: - PowerPoint PPT Presentation
Citation preview

Alan F. Hamlet
•JISAO/CSES Climate Impacts Group•Dept. of Civil and Environmental Engineering
University of Washington
Overview of VIC Meteorological Forcing Data Preparation

长江流域
黄河流域
淮河流域
2604 60km×60km grid cell

Distribution of meteorological station in China
------ Station
Preprocessing Regridding
Lapse Temperatures
Correction to RemoveTemporal
Inhomogeneities
HCN/HCCDMonthly Data
Topographic Correction forPrecipitation
Coop Daily Data
PRISM MonthlyPrecipitation
Maps
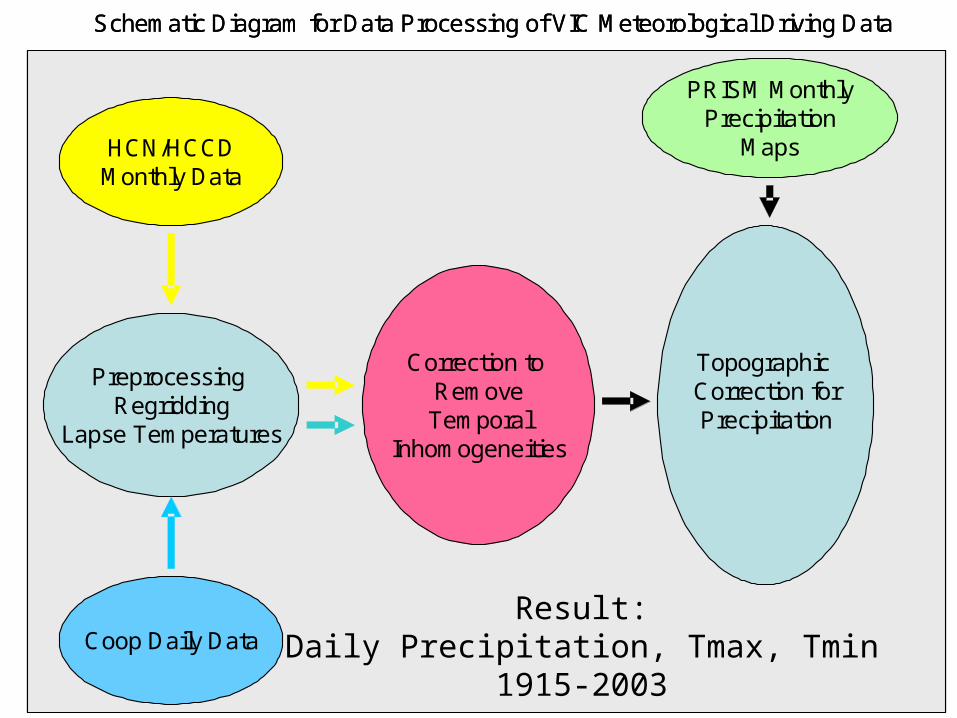
Schematic Diagram for Data Processing of VIC Meteorological Driving Data
Preprocessing Regridding
Lapse Temperatures
Correction to RemoveTemporal
Inhomogeneities
HCN/HCCDMonthly Data
Topographic Correction forPrecipitation
Coop Daily Data
PRISM MonthlyPrecipitation
Maps
Preprocessing Regridding
Lapse Temperatures
Correction to RemoveTemporal
Inhomogeneities
HCN/HCCDMonthly Data
Topographic Correction forPrecipitation
Coop Daily Data
PRISM MonthlyPrecipitation
Maps
Schematic Diagram for Data Processing of VIC Meteorological Driving Data
Result:Daily Precipitation, Tmax, Tmin
1915-2003

Overview of Data Processing Steps•Collect observed station data and preprocess wind data
•Reformat station data to an irregularly spaced gridded file.
•Regrid the raw station information to the VIC lat lon grid.
•Quality control to remove implausible values
•Adjust gridded raw station data to remove station inhomogeneities using HCN or HCDN data sets as a standard (optional)
•Topographic adjustment of precipitation data (using PRISM data as a standard).
•Reformatting to final file format needed by VIC.
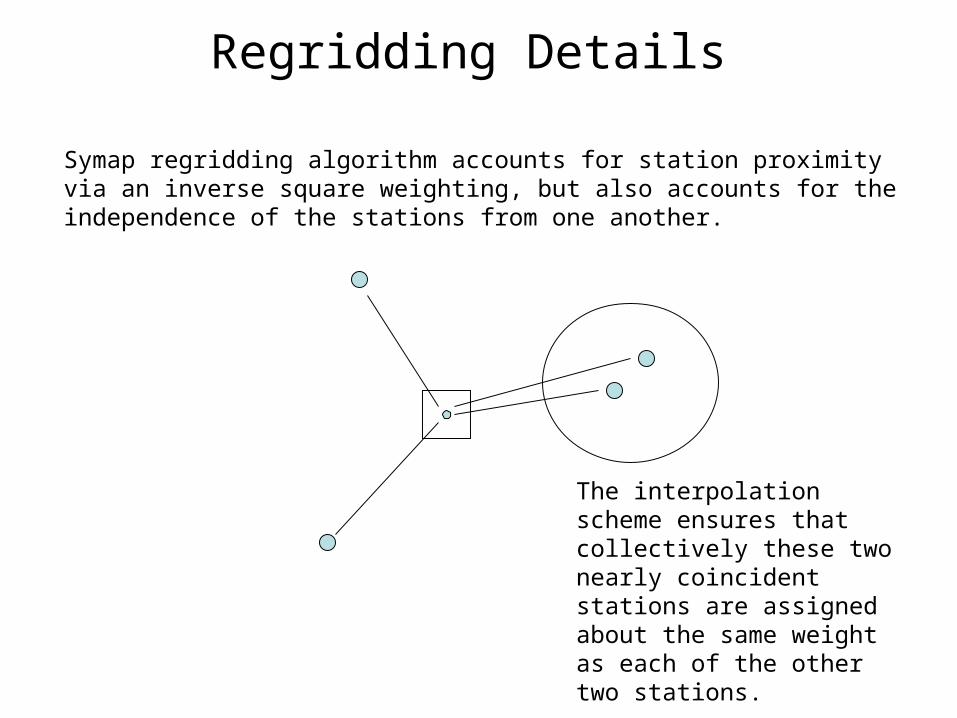
Regridding Details
Symap regridding algorithm accounts for station proximity via an inverse square weighting, but also accounts for the independence of the stations from one another.
The interpolation scheme ensures that collectively these two nearly coincident stations are assigned about the same weight as each of the other two stations.

Removing Temporal Inhomogeneities
Raw station data although containing important local information is likely to contain substantial inconsistencies through time, due to changing station locations and instruments, and especially due to different station groupings through time. Trends in the uncorrected data sets (and hydrologic simulations derived from them) are highly suspect and are likely to be dominated by these artifacts of the raw data.
By using long continuous records from the quality controlled HCN and HCCD data sets, we can correct the trends to remove these inhomogeneities through time.
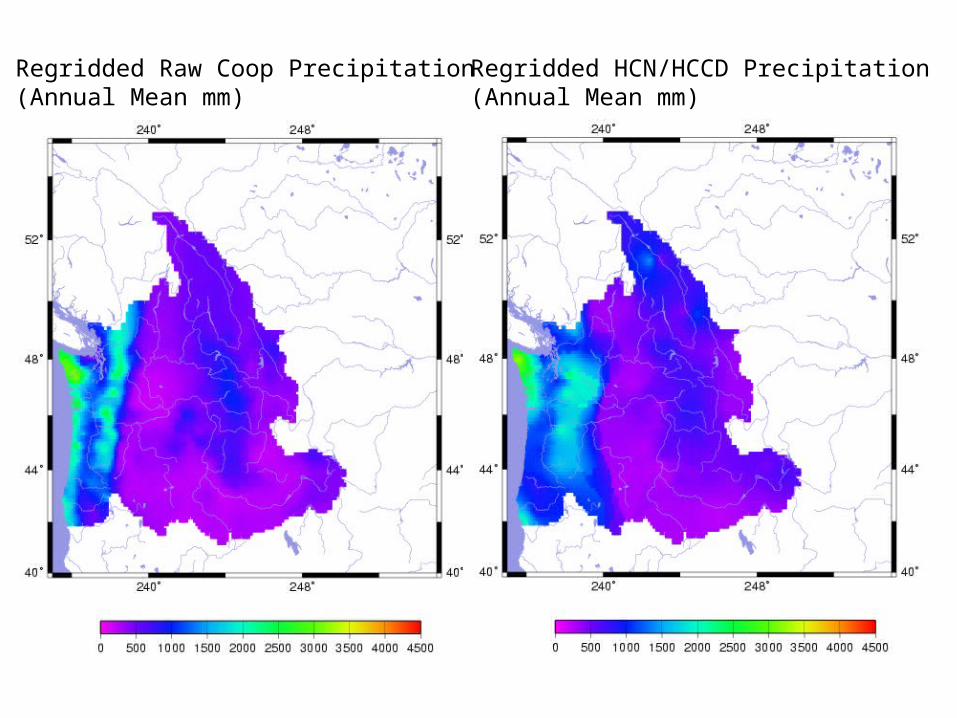
Regridded Raw Coop Precipitation (Annual Mean mm)
Regridded HCN/HCCD Precipitation (Annual Mean mm)
0
50
100
150
200
250
1 5 9 13 17 21 25 29 33 37 41 45 49 53 57 61 65 69 73 77 81 85
Series1
Series2
0
50
100
150
200
250
1 5 9 13 17 21 25 29 33 37 41 45 49 53 57 61 65 69 73 77 81 85
Series1
Series2
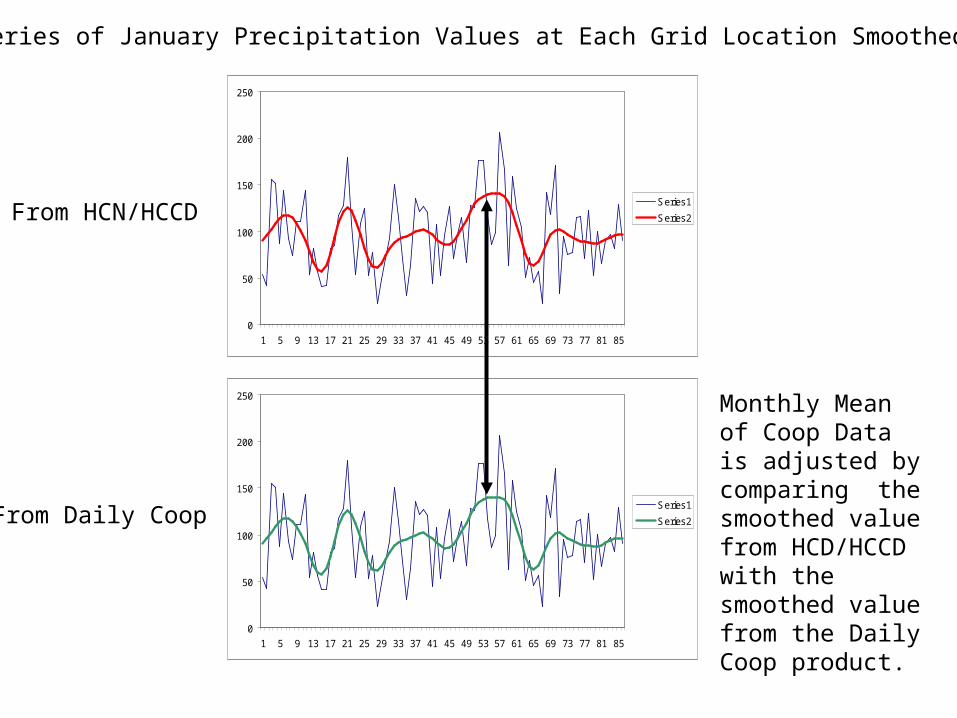
From HCN/HCCD
From Daily Coop
Monthly Mean of Coop Data is adjusted by comparing the smoothed value from HCD/HCCD with the smoothed value from the Daily Coop product.
Time Series of January Precipitation Values at Each Grid Location Smoothed in Time

0
50
100
150
200
250
300
35019
15
1920
1925
1930
1935
1940
1945
1950
1955
1960
1965
1970
1975
1980
1985
1990
1995
hcn
coop
adj_coop
Cell 100 in (British Columbia)
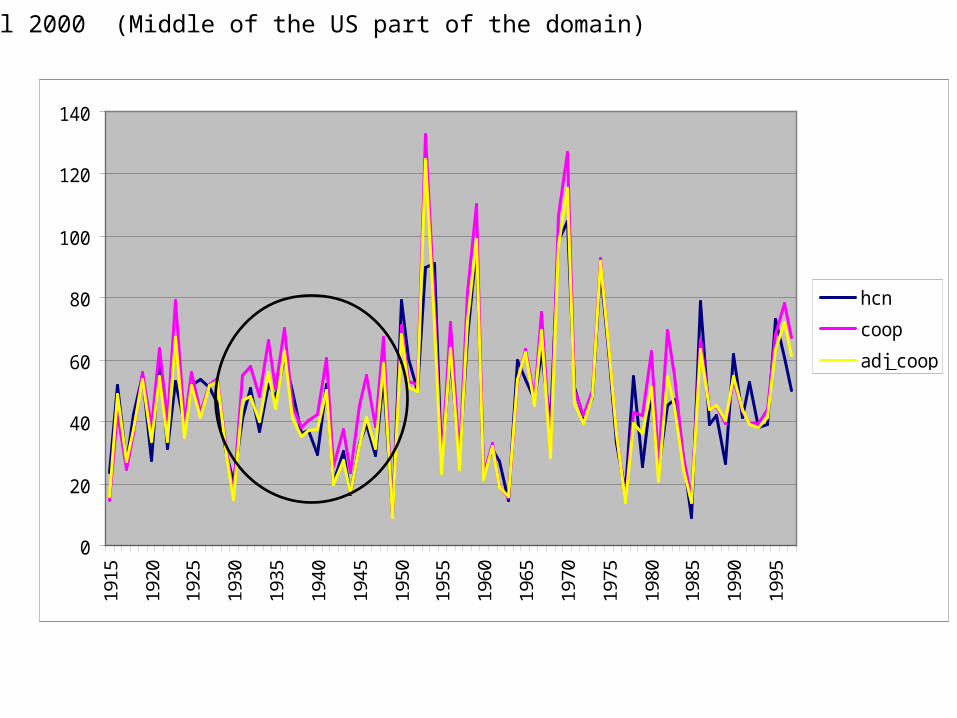
Cell 2000 (Middle of the US part of the domain)
0
20
40
60
80
100
120
14019
15
1920
1925
1930
1935
1940
1945
1950
1955
1960
1965
1970
1975
1980
1985
1990
1995
hcn
coop
adj_coop
0
20
40
60
80
100
120
140
160
180
200
hcn
adj_coop
Linear (hcn)
Linear (adj_coop)
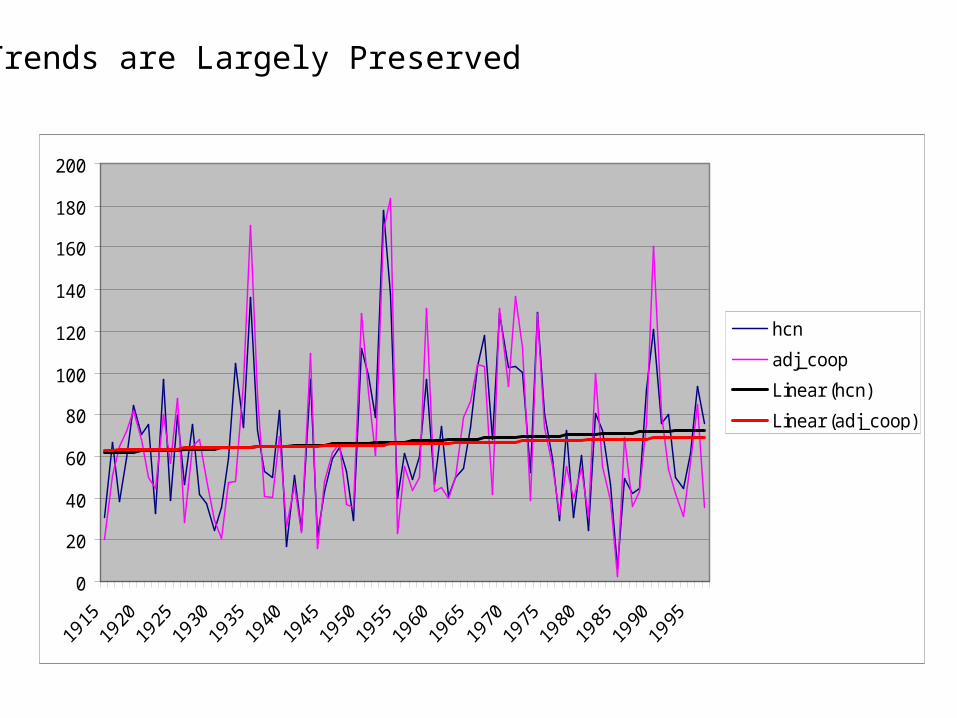
Trends are Largely Preserved
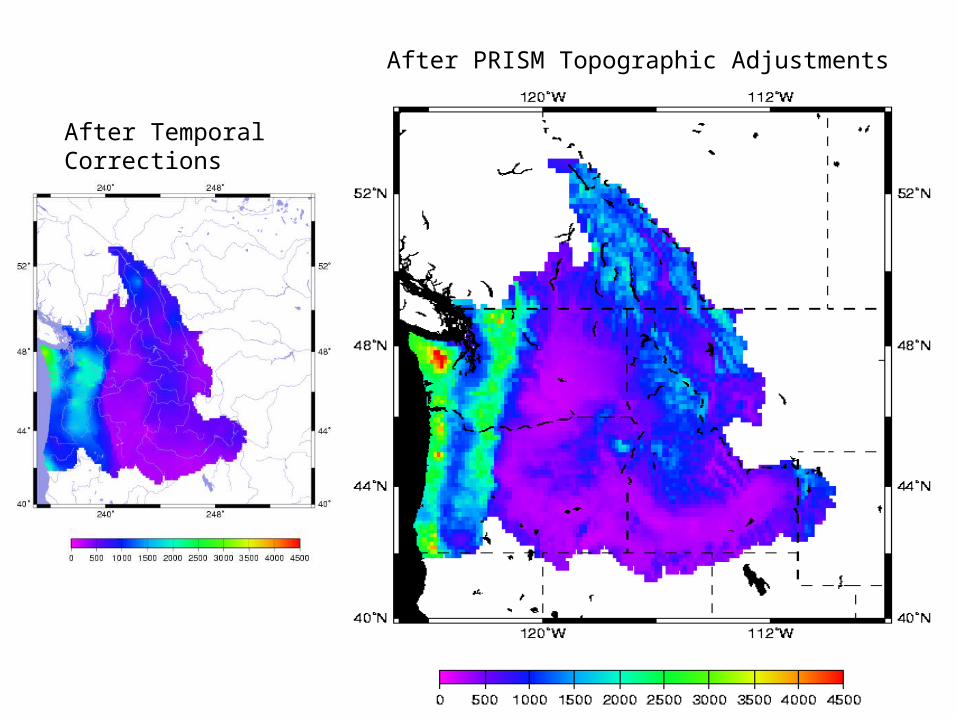
After PRISM Topographic Adjustments
After Temporal Corrections

0
2000
4000
6000
8000
10000
12000
1931
1935
1939
1943
1947
1951
1955
1959
1963
1967
1971
1975
1979
1983
1987
A-S
Str
ea
mfl
ow
(c
fs)
unadjusted
observed
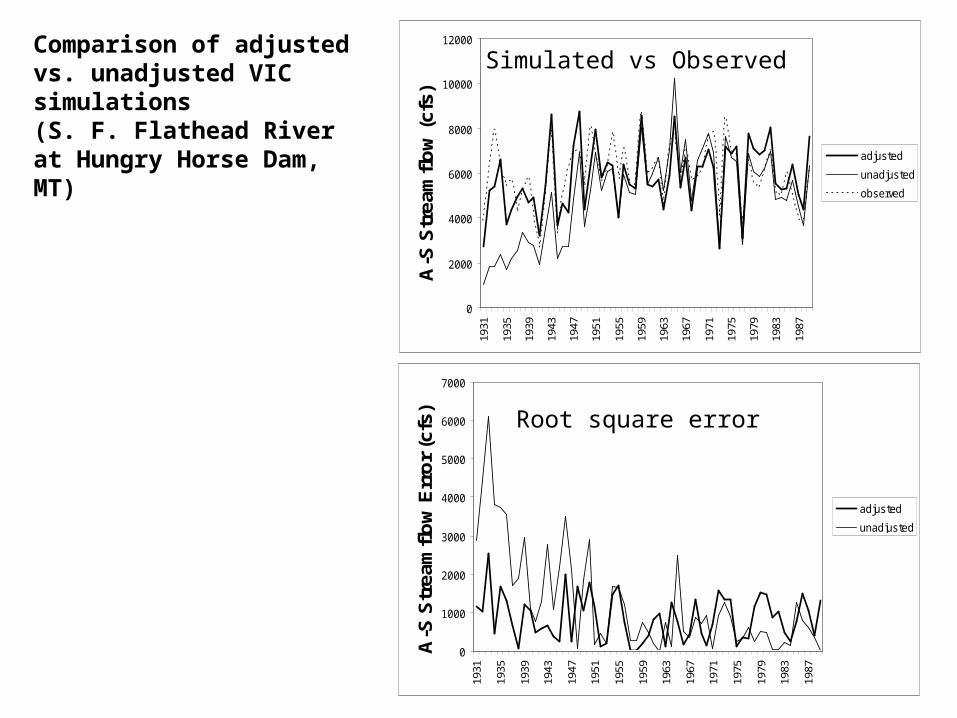
Problems with Temporal Inconsistencies in Meteorological Records(S. F. Flathead River at Hungry Horse Dam, MT)
0
1000
2000
3000
4000
5000
6000
7000
1931
1935
1939
1943
1947
1951
1955
1959
1963
1967
1971
1975
1979
1983
1987
A-S
Str
eam
flo
w E
rro
r (c
fs)
adjusted
unadjusted
0
2000
4000
6000
8000
10000
12000
1931
1935
1939
1943
1947
1951
1955
1959
1963
1967
1971
1975
1979
1983
1987
A-S
Str
eam
flo
w (
cfs)
adjusted
unadjusted
observed
Root square error
Comparison of adjusted vs. unadjusted VIC simulations(S. F. Flathead River at Hungry Horse Dam, MT)
Simulated vs Observed

Evaluation of Streamflow Simulations of the Colorado River at Lee’s Ferry, AZ
-0.6
-0.4
-0.2
0
0.2
0.4
0.6
0.8
1922
1925
1928
1931
1934
1937
1940
1943
1946
1949
1952
1955
1958
1961
1964
1967
1970
1973
1976
1979
1982
1985
1988
1991
1994
1997T
emp
ora
lly
Sm
oo
thed
Tm
ax A
no
mal
ies
for
the
Wes
t
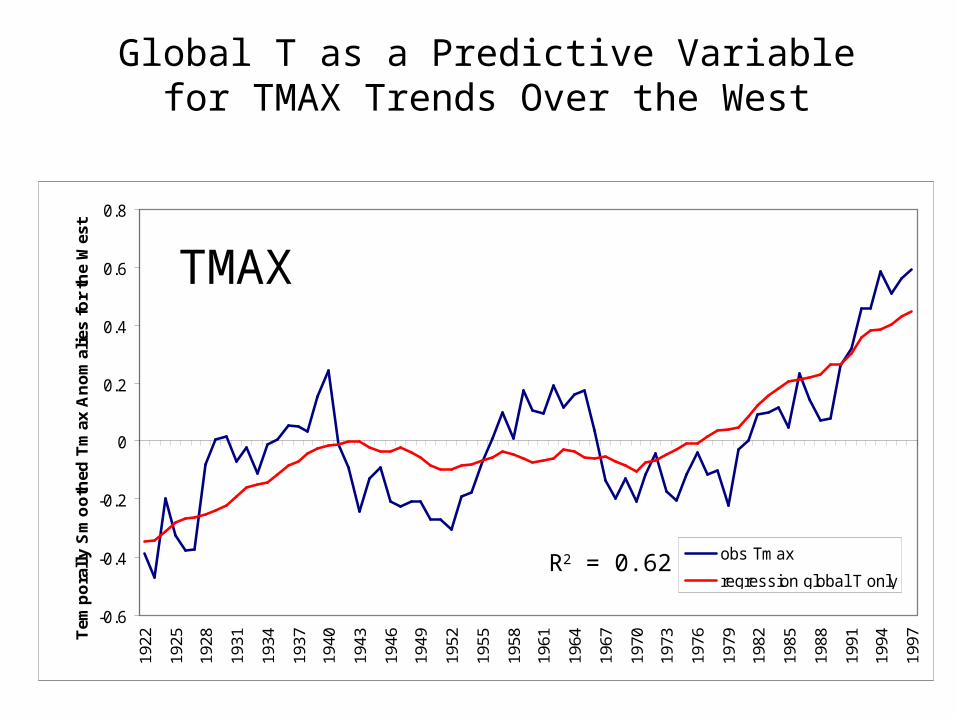
obs Tmax
regression global T only
TMAX
Global T as a Predictive Variable for TMAX Trends Over the West
R2 = 0.62
-1.2
-1
-0.8
-0.6
-0.4
-0.2
0
0.2
0.4
0.6
0.8
1922
1925
1928
1931
1934
1937
1940
1943
1946
1949
1952
1955
1958
1961
1964
1967
1970
1973
1976
1979
1982
1985
1988
1991
1994
1997T
emp
ora
lly
Sm
oo
thed
Tm
in A
no
mal
ies
for
the
Wes
t
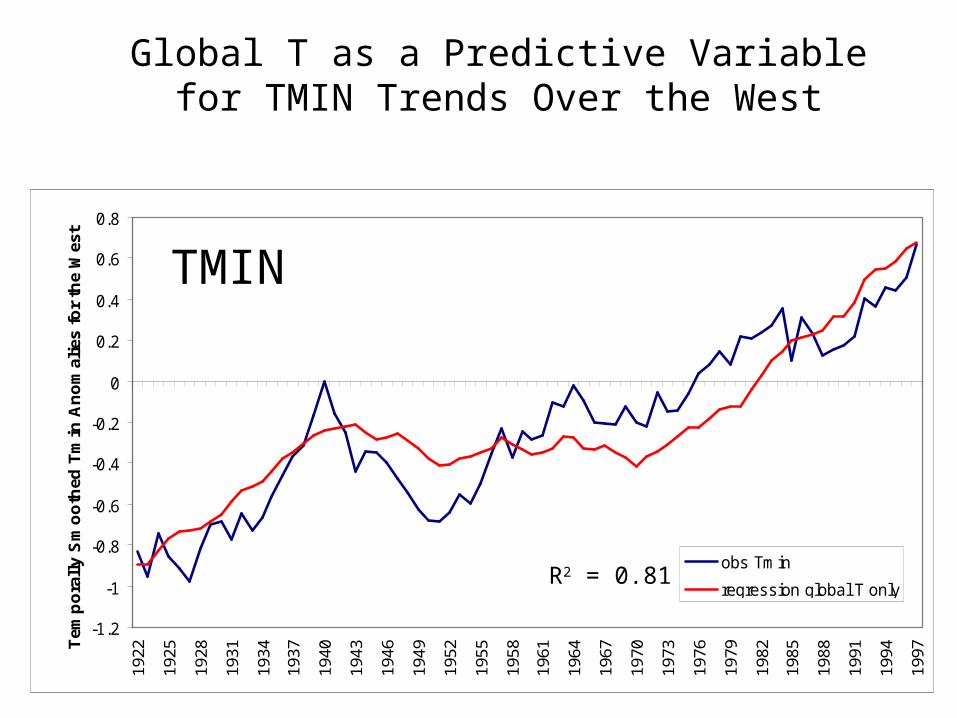
obs Tmin
regression global T onlyR2 = 0.81
TMIN
Global T as a Predictive Variable for TMIN Trends Over the West
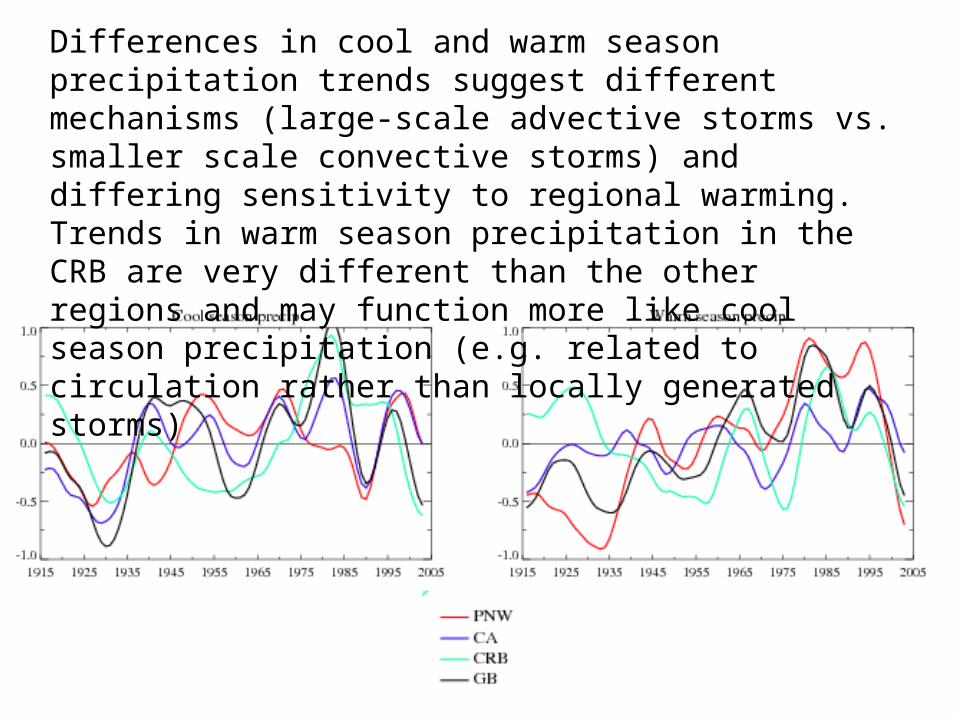
Differences in cool and warm season precipitation trends suggest different mechanisms (large-scale advective storms vs. smaller scale convective storms) and differing sensitivity to regional warming. Trends in warm season precipitation in the CRB are very different than the other regions and may function more like cool season precipitation (e.g. related to circulation rather than locally generated storms)

-3
-2
-1
0
1
2
3
419
16
1920
1924
1928
1932
1936
1940
1944
1948
1952
1956
1960
1964
1968
1972
1976
1980
1984
1988
1992
1996
2000
Std
An
om
alie
s R
elat
ive
to 1
961-
1990
PNW
CA
CRB
GB
Regionally Averaged Cool Season Precipitation Anomalies
PRECIP

http://www.hydro.washington.edu/Lettenmaier/gridded_data/index.html
Maurer E.P., Wood A.W., Adam J.C., Lettenmaier D.P., and Nijssen B, 2002: A long-term hydrologically-based data set of land surface fluxes and states for the conterminous United States, J. Climate, 15 (22): 3237-3251
Hamlet A.F., Lettenmaier D.P., 2005: Production of temporally consistent gridded precipitation and temperature fields for the continental U.S., J. of Hydrometeorology, 6 (3): 330-336
Access to Previously Prepared Driving Data Sets