Embed Size (px)
Citation preview

Health and Safety Executive
An examination of novel roughness parameters to be used in conjunction with the HSE slips assessment tool (SAT)
Prepared by the Health and Safety Laboratory for the Health and Safety Executive 2007
RR549 Research Report

Health and Safety Executive
An examination of novel roughness parameters to be used in conjunction with the HSE slips assessment tool (SAT)
Mr Rob Shaw Health and Safety Laboratory Harpur Hill Industrial Estate Harpur Hill Buxton SK17 9JN
Slips and trips are the most common cause of major injuries at work and they occur in all workplaces; 95% of reportable major slips result in broken bones. There are many separate factors which contribute to the slip potential of a particular workplace. These include the floor surface, footwear worn by pedestrians, contamination present, and cleaning, maintenance and management regimes.
The Health and Safety Executive (HSE) and Health and Safety Laboratory (HSL) use two primary techniques to assess the slip resistance of floor surfaces, coefficient of friction (CoF) using the pendulum skid resistance tester, and Rz surface microroughness. Microroughness meters are available which can easily measure the Rz parameter, and historically a good correlation has been found between Rz and wet pendulum values. This information was the basis of the HSE Slips Assessment Tool (SAT), a risk assessment tool which uses Rz as an important factor in determining the slip risk presented by a floor surface.
In recent times affordable and portable microroughness instruments have become available which can easily measure a much larger range of parameters on site. The purpose of this project has been to study the relationships between discrete roughness parameters and their agreement with wet pendulum values to look for close correlations which may support Rz and pendulum values in determining the slip resistance of a surface.
This report and the work it describes were funded by the Health and Safety Executive (HSE). Its contents, including any opinions and/or conclusions expressed, are those of the author alone and do not necessarily reflect HSE policy.
HSE Books

© Crown copyright 2007
First published 2007
All rights reserved. No part of this publication may bereproduced, stored in a retrieval system, or transmitted inany form or by any means (electronic, mechanical,photocopying, recording or otherwise) without the priorwritten permission of the copyright owner.
Applications for reproduction should be made in writing to:Licensing Division, Her Majesty’s Stationery Office,St Clements House, 216 Colegate, Norwich NR3 1BQor by email to hmsolicensing@cabinetoffice.x.gsi.gov.uk
2

CONTENTS
1. Introduction ............................................................................................................................... 5 2. Experimental procedures........................................................................................................... 6 3. Results ....................................................................................................................................... 7 4. Discussion ............................................................................................................................... 19 5. Conclusions and Recommendations........................................................................................ 20 Appendix A: Roughness Parameter definitions .......................................................................... 21 Appendix B: Excerpts from “The Measurement of Floor Slip Resistance - Guidelines Recommended by the UK Slip Resistance Group”, Issue 3, 2006.............................................. 23 Appendix C: HSE Information Sheet Slips01 ............................................................................. 25
3
EXECUTIVE SUMMARY
Slips & trips are the most common cause of major injuries at work and they occur in all workplaces; 95% of reportable major slips result in broken bones. There are many separate factors which contribute to the slip potential of a particular workplace. These include the floor surface, footwear worn by pedestrians, contamination present, and cleaning, maintenance and management regimes.
The Health and Safety Executive (HSE) and Health and Safety Laboratory (HSL) use two primary techniques to assess the slip resistance of floor surfaces, coefficient of friction (CoF) using the pendulum skid resistance tester, and Rz surface microroughness. Microroughness meters are available which can easily measure the Rz parameter, and historically a good correlation has been found between Rz and wet pendulum values. This information was the basis of the HSE Slips Assessment Tool (SAT), a risk assessment tool which uses Rz as an important factor in determining the slip risk presented by a floor surface.
In recent times affordable and portable microroughness instruments have become available which can easily measure a much larger range of parameters on site. The purpose of this project has been to study the relationships between discrete roughness parameters and their agreement with wet pendulum values to look for close correlations which may support Rz and pendulum values in determining the slip resistance of a surface.
A range of surfaces were measured using standard HSL/HSE techniques to determine their slip resistance characteristics. This included the recording of 11 different surface roughness parameters.
Conclusions and Recommendations
Several roughness parameters show moderate correlation with wet Pendulum Test Value (PTV) including Rp, Rt, Rq, Ra, Rz and Ry. More data is needed to confirm these relationships. A very strong correlation appears to exist between the ratio of Rp and RS and wet PTV. This relationship needs to be explored further for a range of surface types.
Further work is needed to reinforce the relationships seen so far. A range of surfaces should be investigated in laboratory conditions and on site. Two distinct areas should be examined:
i) The addition of more data points to the graphs in section 3 which will allow more robust relationships between roughness parameters and wet PTV to be made.
ii) The production of data for a range of flooring types. The current data does not discriminate between floor types and further work would allow the data to be generated for specific surfaces. This will allow comparisons between hard and soft surfaces, smooth vinyl and safety vinyl, profiled and unprofiled surfaces and include surfaces treated with acid etches. This data would feed into revisions of HSE guidance, including Slips01 (Appendix C), and allow the next version of the HSE Slips Assessment Tool to be more robust. It may be that different types of flooring require a different set of parameters to be obtained, or different weightings to be given to the parameters measured in order to fully characterise their slip resistance properties.
4

1. INTRODUCTION
Slips & trips are the most common cause of major injuries at work and they occur in all workplaces; 95% of reportable major slips result in broken bones. In a typical year, slips and trips account for 33% of all reported major injuries and 20% of over-3-day injuries to employees. Rarely is there a single cause of a slipping accident, and so a holistic approach to reducing the number of slip accidents is required. A major contributing factor in a slip accident is the interaction of the pedestrian’s heel and the floor surface. The potential for slip will depend on the footwear worn, the nature of the floor surface and the presence of any contamination.
The Health and Safety Executive (HSE) and Health and Safety Laboratory (HSL) use two primary measurements to help assess the slip resistance of floor surfaces, coefficient of friction (CoF) using the pendulum skid resistance tester, and Rz surface microroughness. Rz surface microroughness can be measured simply using a range of handheld roughness meters. It is a quick and easy process, provides a good indicator of slip resistance in most situations and can be used to monitor changes in surface properties. For these reasons Rz forms the basis of the HSE Slips Assessment Tool (SAT), a risk assessment tool which uses Rz as an important factor in determining the slip risk presented by floor surfaces.
The Rz measurement does not take account of surface contamination; it acts as an indicator of how a surface is likely to perform when contaminated. This is why it is always more accurate when used in conjunction with the SAT. The size of the stylus and relatively short traverse length result in a ‘snapshot’ measurement which may not be reflective of the majority of the surface under study. To combat this and minimise the effects of surface directionality a total of ten measurements are taken in three directions.
In recent times, affordable and portable microroughness instruments have become available which can easily measure a much larger range of parameters on site. The purpose of this project has been to study the relationships between different roughness parameters and wet pendulum test values to determine whether any of the roughness parameters which have traditionally been difficult to obtain on site have an important role to play in the determination of surface slip resistance.
5

2. EXPERIMENTAL PROCEDURES
A number of flooring samples were studied under laboratory conditions using standard HSL / HSE techniques in accordance with the Guidelines Recommended by the United Kingdom Slip Resistance Group (UKSRG), (Issue 2, 2000 and Issue 3, 2005) where applicable. Due regard was also given to the protocols outlined in BS 7976-2:2000. Data generated during the assessments is reproduced in section 3.
Measurements of floor surface “Pendulum Test Value” (PTV also known as SRV, closely related to Coefficient of Dynamic Friction) were made using a calibrated Pendulum slipperiness assessment instrument. Data was generated [i] in the as-found, dry condition, and [ii] after application of low volumes of potable water to the flooring by hand-spray. The test slider material used was Slider 96, also known as Four-S rubber (Standard Simulated Shoe Sole, developed by the UKSRG to represent a footwear material of moderate performance). Data was generated in three complementary test directions where appropriate in order to account for the presence of floor surface directionality. Further testing was undertaken using a calibrated Mitutoyo SJ201P surface microroughness transducer; the following 11 roughness parameters were recorded:
Ra, Ry, Rz, Rq, Rt, Rp, RPc, Rmr, R3z, RS and RSm
Definitions of these parameters can be found in Appendix A.
The UKSRG Guidelines have been used to interpret the surface microroughness and Pendulum data given (relevant tables and excerpts are reproduced in Appendix B). Due regard was also given to HSE’s Slips01 Information Sheet (Appendix C).
The test results presented relate only to the flooring samples under study at the time of testing. The performance of flooring materials may change significantly during installation and throughout their lifetime. Surface roughness is a quick and easy measurement to take and is therefore a very useful tool for monitoring changes in floor surface properties. In recent years affordable portable surface roughness meters have become more common and are able to measure a wider range of surface parameters.
6

3. RESULTS
The following graphs compare the 11 parameters obtained (measured in μm) against wet PTV values for a set of 29 readings. Graphs are displayed in descending order of correlation.
R2
0
10
20
30
40
50
60
70
0 5 10 15
Rp
PTV
Rp v PTV = 0.5967
20 25
Fig. 3.1 A graph of Rp against wet PTV
R2
0
10
20
30
40
50
60
70
0
Rt
PTV
Rt v PTV = 0.5158
10 20 30 40 50 60 70
Fig. 3.2 A graph of Rt against wet PTV
7

R2
0
10
20
30
40
50
60
70
0 2 4 6 8
Rq
PTV
Rq v PTV = 0.5102
10 12
Fig. 3.3 A graph of Rq against wet PTV
R2
0
10
20
30
40
50
60
70
0 2 4 6 8
Ra
PTV
Ra v PTV = 0.5082
10
Fig. 3.4 A graph of Ra against wet PTV
8

R2
0
10
20
30
40
50
60
70
0
Rz
PTV
Rz v PTV = 0.5012
10 20 30 40 50
Fig. 3.5 A graph of Rz against wet PTV
R2
0
10
20
30
40
50
60
70
0
Ry
PTV
Ry v PTV = 0.4942
10 20 30 40 50 60 70
Fig. 3.6 A graph of Ry against wet PTV
9

R2
0
10
20
30
40
50
60
70
0 50
PTV
RPc v PTV = 0.3629
100 150 200 250
RPc
Fig. 3.7 A graph of RPc against wet PTV
R2
0
10
20
30
40
50
60
70
0
PTV
RSm v PTV = 0.3269
50 100 150 200 250 300 350
RSm
Fig. 3.8 A graph of RSm against wet PTV
10
R2
0
10
20
30
40
50
60
70
0 50
RS
PTV
RS v PTV = 0.2973
100 150 200 250
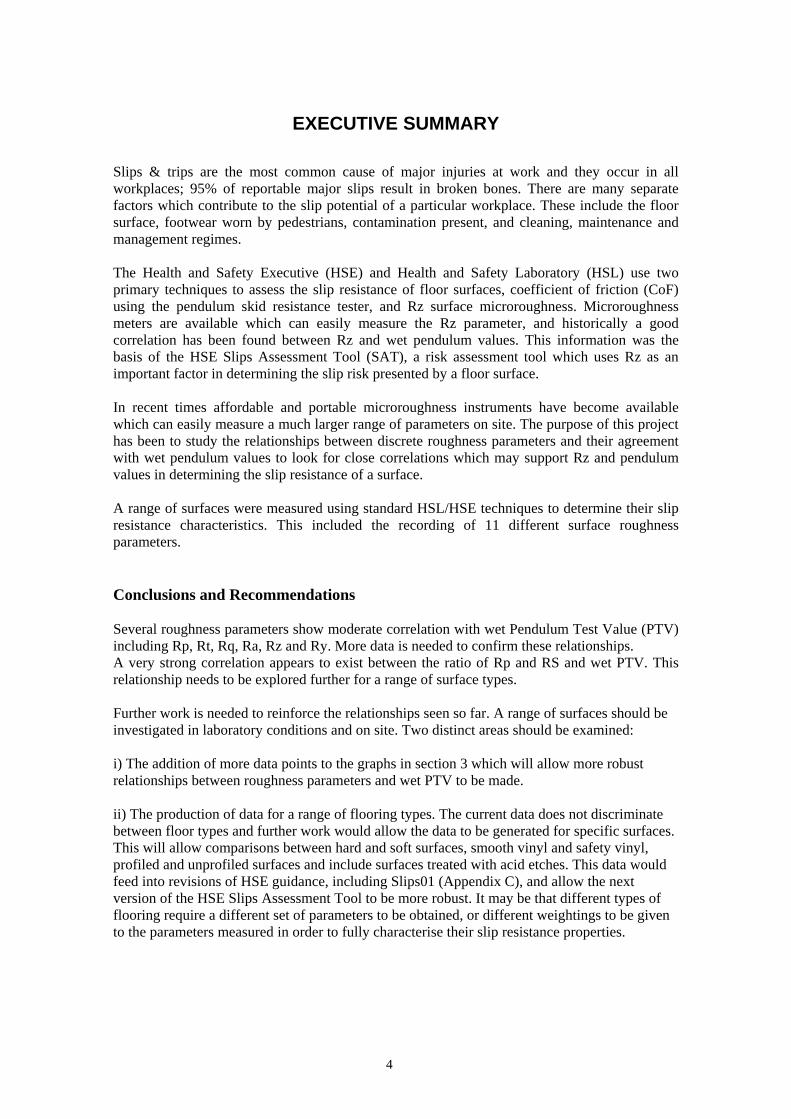
Fig. 3.9 A graph of RS against wet PTV
R2
0
10
20
30
40
50
60
70
0
PTV
Rmr v PTV = 0.233
20 40 60 80 100
Rmr
Fig. 3.10 A graph of Rmr against wet PTV
11

R2
0
10
20
30
40
50
60
70
0 2 4 6 8
PTV
R3z v PTV = 0.218
10
R3z
Fig. 3.11 A graph of R3z against wet PTV
12

Graphs were plotted comparing the ratio of Rz to the other parameters obtained with wet PTV. This was Undertaken in order to determine whether a combination of parameters would show stronger correlation with wet PTV than a single parameter.
It has been observed both in the laboratory and on site that, when surfaces have been treated with an acid etch, wet PTV increases are not usually accompanied by a corresponding increase in the value of Rz for that surface. It has also been noted that an increase in wet PTV on these surfaces is usually accompanied by a reduction in the value of RS. This theory was supported when the graph of Rz/RS v PTV produced a closer correlation with wet PTV than any single roughness parameter or combination of parameters. A graph was then plotted of Rp/RS v PTV as Rp was the parameter which showed closest correlation with wet PTV (Fig. 3.1). This plot (Fig. 3.12) gave the closest correlation ever seen by HSL between wet PTV and another surface test.
Graphs are displayed in descending order of correlation.
Rp/ R2
0
10
20
30
40
50
60
70
0
Rp/
PTV
RS v PTV = 0.8901
0.02 0.04 0.06 0.08 0.1 0.12 0.14
RS
Fig. 3.12 A graph of Rp/RS against wet PTV. This shows the best correlation with wet PTV seen by HSL to date.
Rz/R2
0 10 20 30 40 50 60 70
0
PTV
RS v PTV = 0.6311
0.05 0.1 0.15 0.2 0.25 0.3
Rz/RS
13

Fig. 3.13 A graph of Rz/RS against wet PTV
R2
0
10
20
30
40
50
60
70
0 1
Rz/
PTV
Rz/RPc v PTV = 0.5377
0.2 0.4 0.6 0.8
RPc
Fig. 3.14 A graph of Rz/RPc against wet PTV. Although the R2 value suggests a good correlation between this combination of parameters and wet PTV the line of best fit is based on a limited number of
scattered points. More data points would help determine whether this relationship is genuine or not.
Rz/R2
0 10 20 30 40 50 60 70
0 5 10 15 20
Rz/
PTV
Rmr v PTV = 0.5854
Rmr
Fig. 3.15 A graph of Rz/Rmr against wet PTV. This relationship appears to be logarithmic.
14

Rz/ R2
-10
0
10
20
30
40
50
60
70
0 2 4 6 8
Rz/Rq
PTV
Rq v PTV = 0.238
10 12
Fig. 3.16 A graph of Rz/Rq against wet PTV
Rz/ R2
-10
0
10
20
30
40
50
60
70
0 5 15 20
Rz/Ra
PTV
Ra v PTV = 0.2302
10
Fig. 3.17 A graph of Rz/Ra against wet PTV
15
Rz/ R2
0
10
20
30
40
50
60
70
0 1 2 3 4 5 6
Rz/Rp
PTV
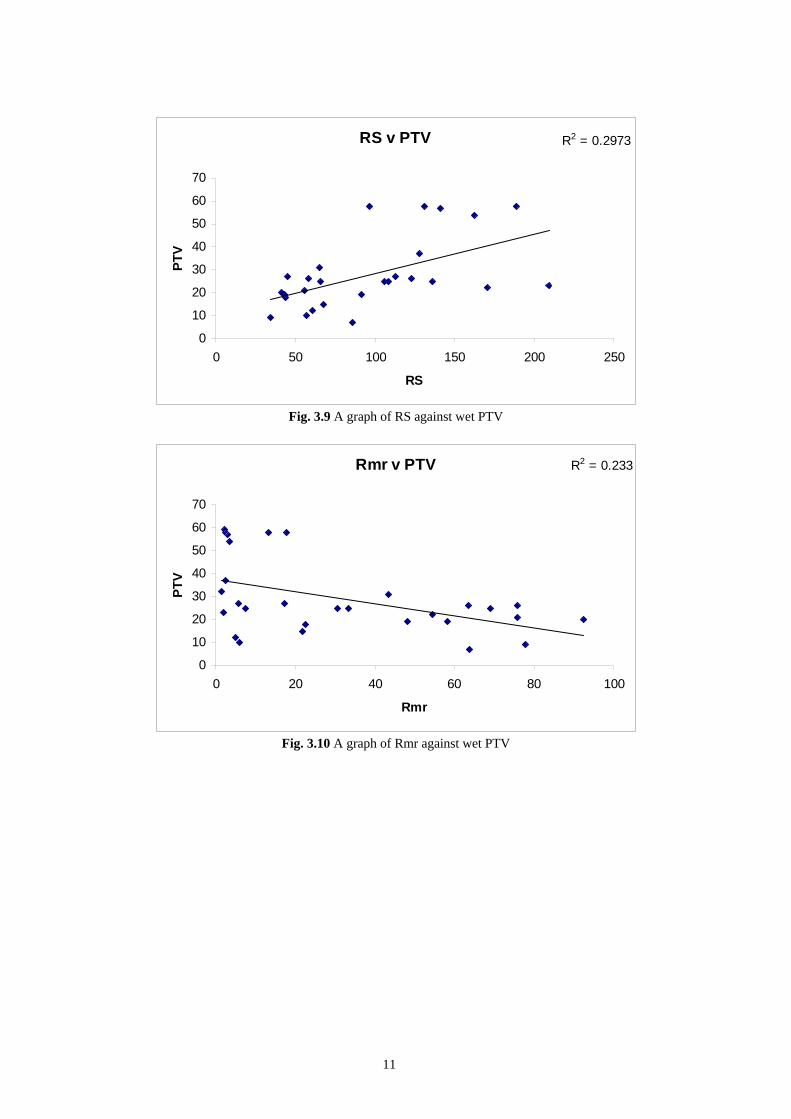
Rp v PTV = 0.1866
Fig. 3.18 A graph of Rz/Rp against wet PTV
/ R2
0
10
20
30
40
50
60
70
0
Rz/
PTV
Rz RSm v PTV = 0.0894
0.05 0.1 0.15 0.2 0.25
RSm
Fig. 3.19 A graph of Rz/RSm against wet PTV
16

Rz/ R2
0
10
20
30
40
50
60
70
0 1
Rz/Ry
PTV
Ry v PTV = 0.0591
0.2 0.4 0.6 0.8
Fig. 3.20 A graph of Rz/Ry against wet PTV
Rz/ R2
0
10
20
30
40
50
60
70
0
Rz/Rt
PTV
Rt v PTV = 0.0405
0.1 0.2 0.3 0.4 0.5 0.6 0.7 0.8
Fig. 3.21 A graph of Rz/Rt against wet PTV
17

/ R2
0
10
20
30
40
50
60
70
0 1 2 3
Rz/
PTV
Rz R3z v PTV = 0.0187
0.5 1.5 2.5 3.5
R3z
Fig. 3.22 A graph of Rz/R3z against wet PTV
18

4. DISCUSSION
The single roughness parameters Rp, Rt, Rq, Ra, Rz and Ry all show some correlation with wet PTV from a limited set of data. This may change with the addition of further sets of data. The graphs for RPc, RSm and R3z are based on very limited numbers of data points as these parameters are not always obtained from every surface.
The ratio of Rp to RS shows the best correlation with wet PTV seen by HSL to date.
Rp/ R2
0
10
20
30
40
50
60
70
0
Rp/
PTV
RS v PTV = 0.8901
0.02 0.04 0.06 0.08 0.1 0.12 0.14
RS
RS is the measure of the spacing between the peaks of the floor surface profile and it has been seen in laboratory conditions and on site that acid etched surfaces can show improved wet pendulum values without corresponding increases in Rz. Investigation has shown that these surfaces usually have lower values of RS than equivalent unetched surfaces.
It appears that the ratio of Rp and RS may prove to be an important indicator of the wet slip resistance offered by a surface. Further values should reinforce this theory.
Other combinations of parameters which show moderate correlation with wet PTV are Rz/RS, Rz/RPc and Rz/Rmr. The relationship with Rz/RPc may be due to the limited number of values of RPc obtained. The relationship between Rz/Rmr and wet PTV appears to be logarithmic. Further values would help establish whether these relationships are genuine.
19

5. CONCLUSIONS AND RECOMMENDATIONS
Rp/RS shows a very strong correlation with wet PTV. This combination of parameters can now be measured routinely both in the lab and on site using a simple, portable meter. It is very likely that this combination of parameters will be useful in determining the pedestrian slip potential of a range of surfaces. Rz/RS may also be a very useful combination to measure.
Further work would allow reinforcement of the relationships seen so far.
As the roughness values are simple and relatively quick to obtain, a range of surfaces could be investigated in laboratory conditions. Two distinct areas should be examined:
i) The addition of more data points to the graphs in section 3 which will allow the relationships between parameters and wet PTV to be made more robust.
ii) The production of data for a range of flooring materials. The current data does not discriminate between floor types and further work would allow the data to be generated for specific surfaces. This will allow comparisons between hard and soft surfaces, smooth vinyl and safety vinyl, profiled and unprofiled surfaces and include surfaces treated with acid etches.
It may be that different types of flooring require different parameters to be measured, or the application of different weightings to the parameters measured in order to fully characterise their slip resistance properties. Specific roughness studies on a wide range of different surfaces including a range of hard and soft floors, profiled surfaces, safety vinyls and acid etched floors will further the HSE/HSL knowledge base.
The correlation observed during this work strongly suggests that a measure of surface microroughness can be routinely used to give a good indication of wet PTV. The refinements outlined above may improve the correlation even further.
It is quick, simple and relatively cheap to make the surface microroughness measurements and therefore it is recommended that further work should be undertake to:
• Further develop surface microroughness as a useful complementary measurement to reliable coefficient of friction tests.
• Feed into revisions of HSE guidance. • Inform on possible refinement to future versions of the Slips Assessment Tool. • Enable surface microroughness measurement to be developed as a routine method for
monitoring floor surfaces in service. • Establish surface microroughness measurement as the preferred method of
demonstrating ‘durability of slip resistance’, a new CEN requirement in European standards.
• Improve the ability to make accurate assessments in situations where other tests have serious limitations, e.g. stairs.
20

APPENDIX A: ROUGHNESS PARAMETER DEFINITIONS
Ra
Ra is the arithmetic mean of the absolute departures of the roughness profile from the mean line.
Ry
Ry is the distance between the maximum peak height (Rp) and the maximum valley depth
Rz
Rz = Rp + Rv and is the mean value of the maximum peak to valley height of the profile within the sampling lengths.
Rq
Rq is the rms parameter corresponding to Ra.
Rt
Total height of the profile. Rt is the maximum peak to valley height of the profile in the assessment (evaluation) length.
Rp
Maximum profile peak height. Mathemaatically the largest peak deviation of the roughness profile from the mean line within a sampling length When more than one sampling length is analysed Rp is the mean value of the individual Rp values for each sample.
RPc
RPc is the peak count. It is the number of local peaks which project through a selectable band centred about the mean line.
Rmr
Rmr is the length of bearing surface (expressed as a percentage of the evaluation length) at a given depth below the highest peak.
R3z
R3z is the vertical mean from the third highest peak to the third lowest valley in a sample length over the assessment length.
21

RS
RS is the mean spacing between local peaks. (A local peak is an upward convex portion of an assessed profile which has concavities on both sides).
RSm
RSm is the mean spacing between profile peaks at the mean line, measured within the sampling length. (A profile peak is the highest point of the profile between an upwards and downwards crossing of the mean line).
22

APPENDIX B: EXCERPTS FROM “THE MEASUREMENT OF FLOOR SLIP RESISTANCE - GUIDELINES RECOMMENDED BY THE UK SLIP RESISTANCE GROUP”, ISSUE 3, 2006.
IMPORTANT NOTE: Research in the UK by the Health and Safety Executive (HSE) has identified that more than 90% of slipping accidents occur on wet floors, most usually on relatively smooth surfaces. Evaluation of the slip resistance of floors requires not simply obtaining a particular reading from an instrument, but also an assessment of other factors, for example the type of contaminants involved, the cleaning methods, etc. Expertise is required in such matters and while this document is designed to assist, it is not intended to be a substitute for that expertise.
These guidelines contain standard procedures for the assessment of the slip resistance of flooring materials. Although guidance is given in relation to the specification of flooring materials, this document should NOT be used in place of a properly worded specification
Pendulum Test Value Potential for Slip 24 and below High
25 to 35 Moderate 36 and above Low
Rz (Rtm) Surface Roughness* Potential for Slip Below 10 High
Between 10 and 20 Moderate Above 20 Low
23

24

APPENDIX C: HSE INFORMATION SHEET SLIPS01
25

26

Health and Safety ExecutiveHealth and Safety Executive
Assessing the slip resistance of flooringA technical information sheet
HSE information sheet
Introduction
This technical document considers a number of test methods for assessing floor slip resistance and describes those used by HSE/HSL in more detail. It is intended for organisations which need to perform accurate measurements of floor slipperiness, such as manufacturers and research and testing bodies. It will also help employers and other dutyholders with assessing slip risks in workplaces by helping them to interpret flooring manufacturers’ test data. This should allow them to make an informed decision in choosing new floors. In the light of this information, manufacturers and suppliers of flooring are recommended to review the floor slip resistance information they provide when producing flooring data sheets for customers.
Background
Slips and trips consistently account for around 1 in 3 nonfatal major injuries, and for over 1 in 5 over3day injuries in workplace areas throughout Great Britain, a total of at least 35 000 injuries per annum (one serious slip accident every 3 minutes). HSE statistics suggest that most of these accidents are slips, most of which occur when floor surfaces are contaminated (water, talc, grease, etc).
Slip potential
Floor material Contamination
Use
Behaviour
Footwear
Environment
Predictable
Controllable
Figure 1 Slip potential model
Slips and trips information sheet
Research by the Health and Safety Laboratory (HSL) on behalf of HSE has shown that a combination of factors can contribute to slip accidents. A slip potential model has been developed, in which the relative importance of the factors contributing to a slip are assessed and quantified (see Figure 1).
This document describes methods of assessing the slipperiness of floors, including profiled floors and stairs. It aims to give enough information to correctly select a method to test the slipperiness of the floor and interpret the results.
The assessment of slipperiness: The HSE approach
The law requires that floors must not be slippery so they put people’s safety at risk (The Workplace (Health, Safety and Welfare) Regulations 1992).1 It was thought that the characteristics of floor surface materials needed for satisfactory slip resistance were difficult to assess. However, research carried out by HSL, in conjunction with the UK Slip Resistance Group (UKSRG) and the British Standards Institution, has shown they are not. The slipperiness of flooring materials can be accurately assessed by using commercially available, portable scientific test instruments.
On behalf of HSE, HSL has developed a reliable and robust test method using these instruments to assess floor surface slipperiness in workplace and public areas. The method has been used as the basis of significant HSE and local authority action, from advice to improvement notices and prosecution.
The methodology is based on using two instruments:
■ a pendulum coefficient of friction (CoF) test (HSE’s preferred method of slipperiness assessment, see Figure 2);
■ a surface microroughness meter (see Figure 3).
This methodology is ideally suited to both laboratorybased assessment, and for use on installed floors.
1 of 6 pages

Health and Safety Executive
The data generated may be strengthened by considering additional test data where appropriate.
Pendulum
The pendulum CoF test (also known as the portable skid resistance tester, the British pendulum, and the TRRL pendulum, see Figure 2) is the subject of a British Standard, BS 7976: Parts 13, 2002.2
Research has confirmed the pendulum to be a reliable and accurate test, leading to its adoption as the standard HSE test method for the assessment of floor slipperiness in dry and contaminated conditions. However, to use it reliably needs a suitably trained and competent person to operate it and to interpret the results.
Interpretation of pendulum results
Pendulum results should be interpreted using the information reproduced in Table 1 (from UKSRG, 2005).
PTV
High slip potential 0–24
Moderate slip potential 25–35
Low slip potential 36 +
Figure 2 The pendulum CoF test
This instrument, although often used in its current form to assess the skid resistance of roads, was originally designed to simulate the action of a slipping foot. The method is based on a swinging, imitation heel (using a standardised rubber soling sample), which sweeps over a set area of flooring in a controlled manner. The slipperiness of the flooring has a direct and measurable effect on the pendulum test value (PTV) given (previously known as the Slip Resistance Value).
The preparation of the standard rubber sliders is detailed in BS 7976 and the UKSRG guidelines.3
There is a small difference between the two methods of slider preparation, and in certain limited situations the two methods may give slightly different results. HSE and the UKSRG believe the changes in the latest version of the UKSRG guidelines (2005) are best practice.
Table 1 Slip potential classification, based on pendulum test values (PTV)
Practical considerations
Information generated by the pendulum using Slider 96 rubber, also known as FourS rubber (Standard Simulated Shoe Sole) is sufficient for assessing slipperiness in most circumstances. However, for assessing barefoot areas, unusually rough or profiled floors, the use of Slider 55 rubber, also known as TRRL rubber (a similar but softer, more malleable compound) may be advantageous.
Although using the pendulum on heavily profiled flooring materials, stair treads and nosings is possible, doing so can be difficult, and should only be undertaken by experienced operators.
The pendulum test equipment is large and heavy, so consider the manual handing of the equipment carefully for testing in the field.
Figure 3 Surface microroughness meters (left to right: Mitutoyo Surftest SJ201P, Surtronic Duo, Surtronic 25)
2 of 6 pages

Health and Safety Executive
Surface microroughness
An indication of slipperiness in watercontaminated conditions may be simply obtained by measuring the surface roughness of flooring materials. Roughness measurements may also be used to monitor changes in floor surface characteristics, such as wear. Research has shown that measurement of the Rz parameter allows slipperiness to be predicted for a range of common materials. Rz is a measure of total surface roughness, calculated as the mean of several peaktovalley measurements.
Interpretation of surface roughness
When surface microroughness data is used to supplement pendulum test data, the roughness results should be interpreted using the information reproduced in Table 2 (from UKSRG, 2005). Where only roughness data is available, use it in conjunction with the Slips Assessment Tool (SAT) detailed below.
Rz surface roughness
Below 10 µm High slip potential
10–20 µm Moderate slip potential
20 + µm Low slip potential
Table 2 Slip potential classification, based on Rz microroughness values (applicable for waterwet pedestrian areas)
Practical considerations: Roughness meters
Research has shown that the Rz roughness parameter gives a good indication of floor slipperiness in watercontaminated conditions. The measurement of Rz using a handheld meter is simple and quick. It is possible to measure other roughness parameters that give a more complete picture of floor surface slipperiness (this is the subject of ongoing research). Although the use of portable, commercially available roughness meters (see Figure 3) for assessing floor surface slipperiness is increasing, they are unsuitable for use on carpet, undulating or very rough floors.
The figures quoted in Table 2 relate to floor surface slipperiness in watercontaminated conditions. If there are other contaminants, differing levels of roughness will be needed to lower slip potential. As a general rule, a higher level of surface roughness is needed to maintain slip resistance with a more viscous (thicker) contaminant. Note that the figures in Table 3 are typical Rz surface microroughness levels at which floors are likely to result in a low slip potential, as a
function of contaminant type and should not be used on their own for specifying floors.
Minimum roughness (Rz)
Contaminant
20 µm Clean water, coffee, soft drinks
45 µm Soap solution, milk
60 µm Cooking stock
70 µm Motor oil, olive oil
above 70 µm Gear oil, margarine
Table 3 Typical Rz surface microroughness levels for a low slip potential, as a function of contaminant type
Where the size of the pendulum tester limits its use, such as on stairs, surface microroughness can be used to compare the surface with an area of the same surface that can be tested using the pendulum.
Slips assessment tool (SAT)
HSE and HSL have produced a PCbased software package to assess the slip potential presented by level pedestrian walkway surfaces. The SAT prompts the user to collect surface microroughness data from the test area, using a handheld meter. The SAT supplements the surface microroughness data (Rz) with other relevant information from the pedestrian slip potential model. This includes the causes of floor surface contamination, the regimes used to clean the floor surface (both in terms of their effectiveness and frequency), the footwear types worn in the area, along with associated human factors and environmental factors. On completion, a slip risk classification is supplied to the user; this gives an indication of the potential for a slip. SAT is designed to assist in the decisionmaking process when considering the risk of slipping in a defined area, and can be used iteratively to show the influence of different control measures. However, it should not be relied upon when considering the performance of just the flooring; in this instance a suitable CoF test should be used. The SAT software can be downloaded free from www.hsesat.info.
The UKSRG ramp test
The UKSRG ramp test (Figure 4) is designed to simulate the conditions commonly encountered in typical workplace slip accidents. Clean water is used as the contaminant and footwear with a standardised soling material is used, although barefoot testing may also be undertaken. The test method involves using test subjects who walk forwards and backwards over
3 of 6 pages

Health and Safety Executive
a contaminated flooring sample. The inclination of the sample is increased gradually until the test subject slips. The average angle of inclination at which slip occurs is used to calculate the CoF of the flooring. The CoF measured relates to the flooring used on a level surface. It is possible to assess bespoke combinations of footwear, flooring and contamination relating to specific environments using this method; HSL also use the ramp to assess the slipperiness of footwear.
Figure 4 The UKSRG ramp CoF test
Other ramp tests
Many European flooring manufacturers use ramptype tests to classify the slipperiness of their products before sale. Such tests are generally carried out using German National Standard test methods (DIN 51097:19924 and DIN 51130:20045).
DIN 51097 involves the use of barefoot operators with a soap solution as the contaminant, and DIN 51130 uses heavilycleated EN:ISO 20345 safety boots with motor oil contamination. HSE has reservations about these test methods, as neither uses contaminants that are representative of those commonly found in workplaces and the way the results are sometimes interpreted and applied (see below) is a cause for concern.
Floor surface materials are often classified on the basis of the DIN standards. The classification schemes outlined in DIN 51130 (Table 4) and DIN 51097 (Table 5) have led to some confusion, resulting in the wrong floor surfaces sometimes being installed.
Classification R9 R10 R11 R12 R13
Slip angle (°) 610 1019 1927 2735 > 35
Table 4 DIN 51130 RValue slipperiness classification
Classification A B C
Slip angle (°) 1217 1823 > 24
Table 5 DIN 51097 slipperiness classification
A common problem stems from the misconception that the ‘R’ scale runs from R1 to R13, where R1 is the most slippery, and R13 the least slippery. HSE have been involved in cases where R9 floors have been specified as specialist antislip surfaces. In reality, the R scale runs from R9 to R13, where R9 is the most slippery, and R13 the least slippery. Floor surfaces that are classified by the DIN 51130 standard as R9 (or in some instances R10) are likely to be unacceptably slippery when used in wet or greasy conditions. Further problems may arise from the wide range of CoF within a given classification, for example R10 covers a CoF range from 0.18 to 0.34, which represents a very wide range of slip potential. The same limitations apply to DIN 51097 for barefoot areas.
The EN13845:20056 standard for slip resistance of safety floors addresses some of the shortcomings of the DIN tests above, but one area of concern is the different thresholds set for shod (20° = CoF 0.36) and barefoot (15° = CoF 0.27) conditions. The level of friction needed by a person to walk without slipping is thought to be the same whether the person is barefoot or wearing shoes. Flooring reported to ‘pass’ this standard for barefoot use may actually present a moderate slip potential.
Rollercoaster tests
HSL have evaluated two new instruments for the assessment of floor slip resistance on a wide range of installed floor surfaces, in dry, wet and contaminated conditions.7 The instruments have been dubbed ‘rollercoaster tests’ as both involve a trolley rolling down a ramp and skidding across the floor surface. The first was developed by SlipAlert LLP (and is commercially available), the second was a laboratory prototype. The results show good agreement with the pendulum, provided that Slider 96 is used as the test slider
4 of 6 pages

Health and Safety Executive
material. Rollercoaster tests are more portable than the pendulum and may be used by people with little or no experience of floor surface assessment. A large test area is required, however, which can limit their applicability in some situations. As the test slider can travel a significant distance over the floor surface, it measures the average slip resistance of the area tested. This may limit the ability of these tests to identify small areas of slippery flooring surrounded by more slipresistant flooring; it may be important to identify such small areas during an investigation. However, if visual inspection reveals areas with differing visual appearance (due to wear or inconsistency), microroughness measurements may be taken to highlight these differences. Furthermore, although it may be difficult to demonstrate the effect of a liquid spill on the slip resistance of the floor using these test methods, the effects of such spills can be accurately measured.
(a)
(b)
Figure 5 Rollercoaster slip tests (a) SlipAlert CoF test (b) The laboratory prototype
CoF test
Sledtype tests
The instruments that have been dubbed ‘sled tests’ involve a selfpowered trolley that drags itself across the floor surface, measuring the CoF as it moves. Laboratorybased assessments have strongly suggested that several tests currently available (particularly those based on ‘sledtype’ principles) can produce misleading data in wet conditions. Information from such tests shows that some smooth flooring appears to be less slippery in wet conditions than when dry; this is clearly at odds with everyday experience. Such tests may give credible results in dry conditions, though it should be stressed that the vast majority of slipping accidents occur in wet, contaminated conditions.
(b)
(a)
Figure 6 Sledtype tests (a) The FSC2000 (b) the Tortus test
Interpretation of manufacturers’ data
Most slip resistance information provided by flooring manufacturers is produced from assupplied products (ie exfactory). The slipperiness of flooring materials can change significantly due to the installation process (due to grouting, burnishing, polishing), after short periods of use, due to inappropriate maintenance or longerterm wear. Furthermore, data quoted simply as CoF should be viewed with uncertainty, as the type of CoF test used can have a critical affect on the validity of the data.
The test data needed to characterise a floor should relate to the floor as finished for the intended use and with any contamination present in normal use.
References and further reading
References
1 Workplace health, safety and welfare. Workplace (Health, Safety and Welfare) Regulations 1992. Approved Code of Practice L24 HSE Books 1992 ISBN 0 7176 0413 6
2 BS 79761:2002 Pendulum testers. Specification British Standards Institution 2002 ISBN 0 580 40144 8
BS 79762:2002 Pendulum testers. Method of operation British Standards Institution 2002 ISBN 0 580 40145 6
BS 79763:2002 Pendulum testers. Method of calibration British Standards Institution 2002 ISBN 0 580 40146 4
5 of 6 pages

Health and Safety Executive
3 The assessment of floor slip resistance Issue 3 United Kingdom Slip Resistance Group, 2005
4 DIN 51097: 1992 Testing of floor coverings; determination of the antislip properties; wetloaded barefoot areas; walking method; ramp test German National Standard 1992
5 DIN 51130: 2004 Testing of floor coverings; determination of the antislip properties; workrooms and fields of activities with slip danger; walking method; ramp test German National Standard 2004
6 EN13845:2005 Resilient floor coverings: Polyvinyl chloride floor coverings with particle based enhanced slip resistance. Specification British Standards Institution 2005 ISBN 0 580 46677 9
7 Evaluation of the Kirchberg Rolling Slider and SlipAlert Slip Resistance Meters Available at www.hse.gov.uk/research/hsl_pdf/2006/hsl0665.pdf
Further reading
Safer surfaces to walk on, reducing the risk of slipping CIRIA C652 2006
Slips and trips: Guidance for employers on identifying hazards and controlling risks HSG155 HSE Books 1996 ISBN 0 7176 1145 0
Slips and trips: Guidance for the food processing industry HSG156 HSE Books 1996 ISBN 0 7176 0832 8
More information about slips and trips can be found at www.hse.gov.uk/slips and at www.hsl.gov.uk/capabilities/pedestrian.htm.
Further information
HSE priced and free publications are available by mail order from HSE Books, PO Box 1999, Sudbury, Suffolk CO10 2WA Tel: 01787 881165 Fax: 01787 313995 Website: www.hsebooks.co.uk (HSE priced publications are also available from bookshops and free leaflets can be downloaded from HSE’s website: www.hse.gov.uk.)
For information about health and safety ring HSE’s Infoline Tel: 0845 345 0055 Fax: 0845 408 9566 Textphone: 0845 408 9577 email: [email protected] or write to HSE Information Services, Caerphilly Business Park, Caerphilly CF83 3GG.
British Standards are available from BSI Customer Services, 389 Chiswick High Road, London W4 4AL Tel: 020 8996 9001 Fax: 020 8996 7001 email: cservices@bsiglobal.com Website: www.bsiglobal.com
This document contains notes on good practice which are not compulsory but which you may find helpful in considering what you need to do.
This document is available web only at: www.hse.gov.uk/pubns/web/slips01.pdf.
© Crown copyright This publication may be freely reproduced, except for advertising, endorsement or commercial purposes. First published 03/07. Please acknowledge the source as HSE.
Published by the Health and Safety Executive 04/07
6 of 6 pages

Health and Safety Executive
An examination of novel roughness parameters to be used in conjunction with the HSE slips assessment tool (SAT)
Slips and trips are the most common cause of major injuries at work and they occur in all workplaces; 95% of reportable major slips result in broken bones. There are many separate factors which contribute to the slip potential of a particular workplace. These include the floor surface, footwear worn by pedestrians, contamination present, and cleaning, maintenance and management regimes.
The Health and Safety Executive (HSE) and Health and Safety Laboratory (HSL) use two primary techniques to assess the slip resistance of floor surfaces, coefficient of friction (CoF) using the pendulum skid resistance tester, and Rz surface microroughness. Microroughness meters are available which can easily measure the Rz parameter, and historically a good correlation has been found between Rz and wet pendulum values. This information was the basis of the HSE Slips Assessment Tool (SAT), a risk assessment tool which uses Rz as an important factor in determining the slip risk presented by a floor surface.
In recent times affordable and portable microroughness instruments have become available which can easily measure a much larger range of parameters on site. The purpose of this project has been to study the relationships between discrete roughness parameters and their agreement with wet pendulum values to look for close correlations which may support Rz and pendulum values in determining the slip resistance of a surface.
This report and the work it describes were funded by the Health and Safety Executive (HSE). Its contents, including any opinions and/or conclusions expressed, are those of the author alone and do not necessarily reflect HSE policy.
RR549
www.hse.gov.uk