Embed Size (px)
Citation preview

-Apparel Products and Materials-
- 1 -
Guidebook for Export to Japan 2011 Copyright (C) 2011 JETRO. All rights reserved.
アート , 工芸品 , インテリア雑貨
The major scope of this document includes apparel products such as articles of apparel, articles of leather, bags, and
footwear & shoes. The document may also discuss yarns, textiles, and other apparel materials.
Scope of coverage
Note: Articles of apparel do not include parts of garments, etc. containing embroidery or lace (HS code: 6117.90,
6217.90).
1. Points To Note in Exports to and Sales in Japan
(1) Import Regulation and Procedures
Importation of apparel products and materials may be subject to the regulations under the Customs Tariff Act,
Customs Act, Foreign Exchange and Foreign Trade Act, Wildlife Protection and Proper Hunting Act, and the Act on
Domestic Animal Infectious Diseases Control.
・Customs Tariff Act (tariff quota system)
The tariff quota system of the Act is partially applicable to leather shoes, articles of leather, etc. Low (primary)
tariff rates are applicable within the quantitative restriction on imports, while high (secondary) tariff rates are applied
to other imports. A tariff quota application must be submitted to the Minister of Economy, Trade and Industry to
obtain the tariff quota application certificate before enjoying primary tariff rates. No quantitative restriction is
imposed on imports to which secondary tariff rates are applicable.
・Customs Tariff Act / Customs Act
The Customs Tariff Act prohibits the importation of knock-off brands and other counterfeit goods, which are
confiscated or disposed by the customs according to the Customs Act. Penalties such as fines and imprisonment may
be imposed on offending importers. Following the revision of the Customs Tariff Act in April 2003, patent, design,
and utility model rights were included in the scope of the import injunction request system. Effective from April 2004,
information on manufacturers, exporters, and importers of counterfeit goods is allowed to be disclosed to the right
Item Definition HS Code
Articles of apparel Knitted articles
Clothing of textile materials
6101-6117 (excluding 6117.90)
6201-6217 (excluding 6217.90)
Articles of leather
(excluding raw hides,
tanned leather, etc.)
Articles of leather or composition leather
Articles of furskin
4203.10, 29, 30, 40
4303
Bags
(excluding small articles)
Bags
Handbags
4202.11, 12, 19, 91, 92, 99
4202.21, 22, 29
Footwear & shoes Leather shoes
6403.20
6403.51–022, 029
6403.59–044, 045, 104, 105
6403.91–012, 019
6403.99–012, 013, 015, 016, 022, 029
Sports shoes, campus shoes 6403.19–010, 090
6403.51–021
6403.59–020
6403.91–011, 021
6403.99–011, 021
6404.11–000, 6404.19–220
Apparel materials Leather
(raw hides, tanned leather, etc.)
Silk yarns/textiles
Wool yarns/textiles
Cotton yarns/textiles
Linen yarns/textiles
4101–4113
5001–5007
5101–5113
5201–5212
5301–5311
Apparel Products and Materials

-Apparel Products and Materials-
- 2 -
Guidebook for Export to Japan 2011 Copyright (C) 2011 JETRO. All rights reserved.
holders, who can look into the responsibilities of importers, for instance, by filing a suit. From March 2006,
confusingly similar articles and knock-off brands regulated by the Unfair Competition Prevention Act are controlled
by the customs unless they are not registered as a trademark or design right, suggesting enhanced anti-counterfeit
goods measures.
・Foreign Exchange and Foreign Trade Act
Under the terms of the Washington Convention (CITES), the Import Trade Control Order of the Foreign Exchange
and Foreign Trade Act regulates importing of species of wild fauna and flora listed in the Appendices to the
Convention, which may include leather shoes and other leather articles. The Washington Convention applies to the
three categories of species, as discussed below. Products made of animals raised for commercial purposes or those
that were obtained prior to the conclusion of the Convention are permitted so long as a certificate by the management
authority of the exporting country to that effect has been granted. For more information on the specific content and
applicability of these classifications, you can contact the Trade Licensing Division, Trade and Control Department,
Trade and Economic Cooperation Bureau, Ministry of Economy, Trade and Industry.
A: Appendix I (All species threatened with extinction)
International commercial traffic of these species or products made from these species is prohibited. Trade is
allowed in special cases such as for academic purposes, although an export permit issued by the exporting
government and an import approval by the Minister of Economy, Trade and Industry are required.
B: Appendix II (All species requiring strict international regulation to prevent danger of extinction)
The importer of any such species or product made from a member of such species must present to Japanese
customs authorities an export certificate or re-export certificate from the management authority of the exporting
country. Some species need prior confirmation by the Minister of Economy, Trade and Industry.
C: Appendix III
(All species that any party identifies as being subject to regulation and requiring the cooperation of other parties
in the control of trade)
The importer of any such species or product made from a member of such species for commercial purpose s must
present to Japanese customs an export certificate and a certificate of origin issued by the management authority of
the exporting country, or a certificate granted by the management authority of the country of re-export that the
specimen was processed in that country. Some species need prior confirmation by the Minister of Economy, Trade
and Industry.
If products made of animal skins are imported, the scientific name of the animals is recommended to be specified in
the invoices, because only a general name of imported goods is not enough to determine if the animal used as the
material of the product is included in the CITES list or commercially bred.
・Wildlife Protection and Proper Hunting Act
An export certificate or legal capture certificate issued by the government of exporting countries must be attached
to imported articles partially made of furskin or feathers of animals regulated by the Act.
・Act on Domestic Animal Infectious Diseases Control
Identifying as the “designated quarantine items” the bones, flesh, furskin, and hair of animals, particularly those
suspected of spreading bioagents of infectious diseases, the Act requires the export inspection certificate issued by the
government of exporting countries to allow such products to be accepted by Japan.
Only seaports and airports with a sufficient capability of animal quarantine are accepted as the ports of importation.
On arrival of goods, the import inspection application together with the attached export inspection certificate issued
by the government of exporting countries must be submitted to the animal quarantine station, which will issue the
certificates of import quarantine following document review and the inspection of actual goods. In case of failing to

-Apparel Products and Materials-
- 3 -
Guidebook for Export to Japan 2011 Copyright (C) 2011 JETRO. All rights reserved.
pass the inspection, incineration of reshipment will be directed. For more information, you can contact the Animal
Health Division, Food Safety and Consumer Affairs Bureau, Minis try of Agriculture, Forestry and Fisheries.
(2) Regulations and Procedural Requirements at the Time of Sale
The sale of apparel products and materials may be subject to the regulations of the Act Against Unjustifiable
Premiums and Misleading Representations, Act on Conservation of Endangered Species of Wild Fauna and Flora
(Species Conservation Act), Household Goods Quality Labeling Act, Act for the Control of Household Products
Containing Harmful Substances, and the Act on Specified Commercial Transactions. Furthermore, containers and
packaging materials may also be subject to labeling provisions of the Act on the Promotion of Effective Utilization of
Resources, and the Law for Promotion of Sorted Collection and Recycling of Containers and Packaging . Note that the
right holder may file a suit against improper acts such as the use of counterfeits and confusingly similar names and
unauthorized use of characters for advertisement according to the Trademark Act, Design Act, and the Unfair
Competition Prevention Act.
・Act Against Unjustifiable Premiums and Misleading Representations
The Act prohibits a form of improper labeling that exaggerates or falsifies labeling and misleads consumers about
the nature or quality of products. Importers or resellers are required to submit reasonable grounds to prove that the
labeling is not “improper.” If they are unable to do so, those claims are considered as a form of improper labeling.
Vague or confusing labeling that makes it difficult to discern the actual country of origin is a lso prohibited as a form
of improper labeling. The country of origin is defined as “a country in which a treatment or process effecting
substantial change to the substance of the goods made.” The country of origin refers to the nation where the weaving
was performed in the case of apparels. The most important thing is for the labeling to be readily comprehensible to
consumers, so if the manufacturing process encompasses multiple nations, then the labeling should state so.
・Act on Conservation of Endangered Species of Wild Fauna and Flora
The Act established a legal framework for the protection of species considered to be in danger of extinction. Organs
such as furskin and hides, and their finished goods of animals may not be sold or transferred in Japan if such animals
are designated as species specially identified for protection,. However, species that are being raised for commercial
purposes may be distributed in Japan, provided that proper registration procedures with the Minister of the
Environment are completed. Registration procedures take place with the Japan Wildlife Research Center, a
registration organization officially designated by the Ministry of the Environment.
・Household Goods Quality Labeling Act
The Act stipulates the format and content of quality labeling for products designed for everyday household use. The
purpose is to protect consumer benefits by providing information that helps them choose products and informs them
about how to use the products correctly. Most products of this category such as articles of apparel, bags, and footwear
must display in their labeling specific items of information stipulated by the Act. This is not always applicable,
however, to all apparel products. Importers or resellers must confirm if the items to be imp orted are included in the
list of regulated commodities. For more information, contact Product Safety Division, Commerce and Information
Policy Bureau, Ministry of Economy, Trade and Industry.
・Act for the Control of Household Products Containing Harmful Substances
The Act prohibits the content of harmful substances (e.g., formalin, dieldrin) from being detected higher than at the
upper limits in household products such as articles of apparel and bags. Designated textile products with
formaldehyde content of 75 ppm or greater may not be sold in Japan. Furthermore, formaldehyde must not be detected
in any measurable concentration when used in garments for infants aged two years or less. This requirement also
applies to imported products.

-Apparel Products and Materials-
- 4 -
Guidebook for Export to Japan 2011 Copyright (C) 2011 JETRO. All rights reserved.
・Act on Specified Commercial Transactions
Selling “specified products, rights, or services” to general consumers through “specified commercial transactions”
such as mail order sales or door-to-door sales are subject to provisions of the Act on Specified Commercial
Transactions. Specified commercial transactions applicable include 1) door-to-door sales; 2) mail order sales; 3)
telemarketing sales, 4) multilevel marketing transactions [network marketing by word of mouth/referral]; 5) specified
continuous service offers; and 6) business opportunity related sales transactions. Mail order sales include internet
sales and advertisements through e-mail. In order to provide consumers with accurate information, in mail order sales,
operators are required to list the following information in their advertisements: (1) sales price, (2) payment period and
method, (3) delivery date, (4) clauses related to the return system, (5) name, address and telephone number of operator.
The Act also prohibits advertising containing false or exaggerated statements.
(3) Contacts of Competent Authorities
Fig. 1 Contacts of competent authorities
Related regulations and control Competent agencies Contact/Website
Customs Tariff Act / Customs Act Compensation and Operation Division, Customs and Tariff Bureau, Ministry of Finance
TEL: +81-3-3581-4111 http://www.mof.co.jp
Foreign Exchange and Foreign Trade Act
Trade Licensing Division, Trade Control Department, Trade and Economic Cooperation Bureau, Ministry of Economy, Trade and Industry
TEL: +81-3-3501-1511 http://www.meti.go.jp
Wildlife Protection and Proper Hunting Act
Nature Conservation Bureau, Ministry of the Environment
TEL:+81-3-3581-3351 http://www.env.go.jp
Act on Domestic Animal Infectious Diseases Control
Animal Health Division, Food Safety and Consumer Affairs Bureau, Ministry of Agriculture, Forestry and Fisheries
TEL:+81-3-3502-8111 http://www.maff.go.jp
Act against Unjustifiable Premiums and Misleading Representations
Representation Division, Consumer Affairs Agency TEL:+81-3-3507-8800 http://www.caa.go.jp
Act on Conservation of Endangered Species of Wild Fauna and Flora
Wildlife Division, Nature Conservation Bureau, Ministry of the Environment
TEL:+81-3-3581-3351 http://www.env.go.jp
Household Goods Quality Labeling Act
Office responsible for household goods quality labeling, Consumer Related Trade Division, Trade Practices Department, Fair Trade Commission of Japan
TEL:+81-3-3507-8800 http://www.caa.go.jp
Act for the Control of Household Products Containing Harmful Substances
Chemical Hazards Control Office, Evaluation and Licensing Division, Pharmaceutical and Food Safety Bureau, Ministry of Health, Labour and Welfare
TEL:+81-3-5253-1111 http://www.mhlw.go.jp
Act on Specified Commercial Transactions
Consumer Economic Policy Division, Commerce and Information Policy Bureau, Ministry of Economy, Trade and Industry
TEL:+81-3-3501-1511 http://www.meti.go.jp
Act on the Promotion of Effective Utilization of Resources /Law for Promotion of Sorted Collection and Recycling of Containers and Packaging
Recycling Promotion Division, Industrial Science and Technology Policy and Environment Bureau, Ministry of Economy, Trade and Industry
TEL: +81-3-3501-1511 http://www.meti.go.jp
Office of Recycling Promotion, Policy Planning Division, Waste Management and Recycling Department, Ministry of the Environment
TEL:+81-3-3581-3351 http://www.env.go.jp

-Apparel Products and Materials-
- 5 -
Guidebook for Export to Japan 2011 Copyright (C) 2011 JETRO. All rights reserved.
2. Labeling
(1) Labeling under Legal Regulations
Household Goods Quality Labeling Act
The labeling requirements for the sale of apparel products and materials are specified, as listed in Figure 2, according
to the provisions of textile product labeling and miscellaneous manufactured goods labeling of the Household Goods
Quality Labeling Act.
Fig. 2 Required labeling items under Household Goods Quality Labeling Act
Item Labeling requirements
Articles of apparel
1) Composition of fabric, 2) Instructions on the use of home clothes washers, etc. 3) Repellency, 4) Type of leather (limited to products partially made of leather material), 5) Name of the labeler and information contact (address or telephone number)
Articles of leather 1) Type of material, 2) Dimensions (gloves), 3) Precautions on handing, 3) Name of the labeler and information contact (address or telephone number)
Bag 1) Type of material, 2) Method of care and storing, 3) Name of the labeler and information contact (address or telephone number)
Footwear & shoes 1) Material of uppers (synthetic leather), 2) Material of sole (rubber, synthetic material, etc.), 3) precautions on handing, 4) Name of the labeler and information contact (address or telephone number)
Apparel materials (yarns, textiles, etc.)
1) Composition of fabric, 2) Name of the labeler and information contact (address or telephone number)
Act on the Promotion of Effective Utilization of Resources
Under the Act, specific containers and packaging are subject to
identifier labeling provisions, in order to promote sorted collection.
When paper or plastic is used as a packaging material for wrapping
individual product items, or for labels, external packaging or
elsewhere, a material identifier mark must be displayed in at least
one spot on the side of the container with information where the
material is used.
Labeling under Industrial Standardization Act (JIS Mark)
The dimensions of articles of apparel, footwear & shoes, and other related items are optional but the standards for
dimensions and labeling method are stipulated according to the Industrial Standardization Act. O f all industrial
products included in the Japanese Industrial Standards (JIS) list of applicable products, those certified by a private third
party authorized by the Japanese government (registered certification body) are allowed to carry the JIS Mark on them.
The mark can be labeled on products and/or packages, demonstrating that the products meet the strict quality
requirements provided by the Act or JIS.
To be allowed to carry the labeling, certification must be granted by a body authorized by the compet ent minister.
External
packaging
Individual
packaging
[Representation example]

-Apparel Products and Materials-
- 6 -
Guidebook for Export to Japan 2011 Copyright (C) 2011 JETRO. All rights reserved.
Fig. 3 Process to obtain JIS Mark certification
Contact: Conformity Assessment Division, Industrial Science and Technology Policy and Environment Bureau,
Ministry of Economy, Trade and Industry
TEL: +81-3-3501-1511
(2) Labeling under Industry-level Voluntary Restraint
The voluntary labeling programs (Fig. 4) are available for articles of apparel, articles of leather, bags, footwear &
shoes, and other apparel products, as well as apparel materials.
“Woolmark” is a quality assurance mark which certifies quality standards are met for wool products. “Silk Mark” and
“Japanese Silk Mark” certify that quality standards are met for silk products (“Japanese Silk Mark” is limited to silk
produced in Japan).
“JES labeling” is a label validating that chemicals such as formaldehyde included in articles of leather fall within the
guidelines displayed to ensure safety.
Voluntary JFA (Japan Fur Association) labeling aims to ensure quality of arti cles of furskin by obligating the labeling
of 1) product name (including place of origin); 2) processing treatment; 3) part used. If there are any violations, JFA will
supervise guidance to manufacturers/distributors.
The Japan Luggage Association prepares labeling for luggage of which 60% or more of its surface area uses leather
from bulls, horses, swine, sheep, or goats, according to the Household Goods Quality Labeling Act. The front side of the
label shows a standardized leather mark for articles of leather, and the back shows type of leather with care instructions.
The same can be stated for the Japan Handbag Association, where labels are applied displaying the type of leather, care
instructions, and country of origin on handbags and fashion bags.
The Association of Japan Sporting Goods Industries (JASPO) makes it a rule that information such as the name of the
manufacturer, material used, and the country of origin be displayed voluntarily on sporting goods being sold. This is
based on the Act against Unjustifiable Premiums and Misleading Representations.
The Japan Organic Cotton Association (JOCA) has established its own authentication mark to ensure quality of
organic cotton products.
Selection of a registered certification body
Application for certification
[Examples]
JIS Mark (new) JIS Mark (previous) Inspection of quality management system
and product testing
Certification decision by
the registered certification body
認証の可否の判定
Conclusion of agreement (on JIS Mark use)
between the body and applicant
Labeling of JIS Mark on products
Review of the sustention of certification

-Apparel Products and Materials-
- 7 -
Guidebook for Export to Japan 2011 Copyright (C) 2011 JETRO. All rights reserved.
Fig. 4 Industry’s voluntary labeling programs for apparel products and materials
Labeling Organizer Contact Items
Woolmark Australian Wool Innovation Ltd. (AWI) Tokyo office
TEL: +81-3-3238-7151 http://www.wool.co.jp
Articles of apparel, apparel materials
Silk Mark, Japanese Silk Mark Japan Silk Center TEL: +81-3-3214-1691 http://www.silk-center.or.jp
Articles of apparel, apparel materials
JES labeling (Japan Eco Leather standards certification)
Japan Leather and Leather Goods Industries Association (JLIA)
TEL: +81-3-3847-1451 http://www.jlia.or.jp
Articles of apparel, articles of leather, bags, footwear & shoes
Voluntary JFA labeling Japan Fur Association (JFA) TEL: +81-3-3663-1120 http://www.fur.or.jp
Articles of apparel, articles of leather
Voluntary JLA labeling Japan Luggage Association (JLA)
TEL: +81-3-3862-3516 http://www.kaban.or.jp
Bags
Voluntary JHA labeling Japan Handbag Association (JHA)
TEL: +81-3-3851-5278 http://www.handbag.or.jp
Bags
Voluntary labeling of sporting goods
Association of Japan Sporting Goods Industries (JASPO)
TEL: +81-3-3219-2531
Articles of apparel, footwear & shoes
Voluntary JOCA labeling Japan Organic Cotton Association (JOCA)
TEL: +81-3-3341-7200 http://www.joca.gr.jp
Articles of apparel, apparel materials
[Representation example]
3. Taxation System
(1) Tariff Duties
Tariff rates for apparel products such as articles of apparel, articles of leather, bags, and footwear & shoes, as well as
apparel materials such as yarns and textiles are omitted herein since there are numerous HS codes (refer to “Customs
Tariff Schedules of Apparel Products” and “Customs Tariff Schedules of Apparel Materials” at the end of this
document).
In order to be eligible for benefits of preferential tariffs from one of the countri es with which Japan has a preferential
trading agreement, one is required to submit a Generalized System of Preferences Form A issued by the customs or other
competent authorities from the country involved (except where the total value of imports is 200,00 0 yen or lower).
Details may be checked with the Customs and Tariff Bureau of the Ministry of Finance. If one wishes to check the tariff
classifications or tariff rates in advance, it may be convenient to use the prior instruction system in which one can m ake
inquiries and receive replies in person, in writing, or via e-mail.
(Japan Customs:http://www.customs.go.jp/english/index.htm)
If textiles or articles of leather made or finished abroad out of apparel materials such as cloth imported from Japan are
imported within one year from the permission date of such material exports, the duties equivalent to such exports will be
reduced (the tariff reduction program for re-import of the processed goods) under the provisions of the Act on Temporary
Measures concerning Customs. The reduction is calculated as the price of exported materials multiplied by the tariff rate
on the product. To obtain approval of the preferential treatment, a notification for the confirmation of finished/assembled
products importation must be submitted to the customs to obtain the authorities confirmation. The preferential tariff
program is effective for a limited period of three years, which has been repeatedly extended. The current term will be
terminated in March 2011.
(2) Consumption Tax
(CIF + Tariff duties) 5%
Woolmark
Silk Mark
Japanese Silk Mark JES label Organic cotton
certification mark

-Apparel Products and Materials-
- 8 -
Guidebook for Export to Japan 2011 Copyright (C) 2011 JETRO. All rights reserved.
4. Trade Trends
(1) Changes in Imports
<Import trends of apparel products>
Imports of articles of apparel, bags, and footwear & shoes excluding articles of leather increased in value until 2007,
but started to decrease from 2008. One major influence is the decline in consumer spending due to the recession brought
on by the Lehman‟s fall in 2008. Despite the decline in imports for articles of apparel by value, decrease s by volume
have been small, or have stayed flat. This may be attributed to the fact that there have been no major changes in the
number of clothing items bought by a consumer amidst decreasing consumer budget s for fashion goods, owing to the
increasing popularity of “fast fashion” as represented by Uniqlo and Forever 21, SPA specialty stores (vertical sales
method which integrates all processes from manufacturing to retail) applying overseas production cases in China, etc.,
which has led to a sharp drop in product prices.
Into 2010, even though the economy has not fully recovered, there are hopeful signs of future improvement, and
imports of these items should start increasing in terms of both volume and value (except imports of articles of apparel).
Fig. 5 Changes in apparel imports
[Articles of apparel] [Articles of leather]
[Bags] [Footwear & shoes]
0
500,000
1,000,000
1,500,000
2,000,000
2,500,000
3,000,000
2006 2007 2008 2009 2010 (year)
(¥million)
0
1,000,000
2,000,000
3,000,000
4,000,000
5,000,000
6,000,000
7,000,000
(1,000articles )(value)(volume)
0
20,000
40,000
60,000
80,000
100,000
2006 2007 2008 2009 2010 (year)
(¥million)
0
5,000
10,000
15,000
20,000
(tons)
(value)
(volume)
0
100,000
200,000
300,000
400,000
500,000
2006 2007 2008 2009 2010 (year)
(¥million)
0
50,000
100,000
150,000
200,000
(tons)
(value)
(volume)
0
50,000
100,000
150,000
200,000
2006 2007 2008 2009 2010 (year)
(¥million)
0
10,000
20,000
30,000
40,000
50,000
60,000
70,000
(1,000pairs)(value)(volume)

-Apparel Products and Materials-
- 9 -
Guidebook for Export to Japan 2011 Copyright (C) 2011 JETRO. All rights reserved.
Item 2006 2007 2008 2009 2010
Volume Value Volume Value Volume Value Volume Value Volume Value Knitted articles
4,855,568 1,206,943 4,950,632 1,264,138 5,050,464 1,215,919 4,822,413 1,117,205 5,015,826 1,106,931
Clothing of textile materials
1,689,704 1,401,450 1,633,510 1,391,885 1,574,132 1,291,504 1,555,963 1,128,475 1,530,204 1,104,779
Articles of apparel total
6,545,272 2,608,393 6,584,142 2,656,023 6,624,596 2,507,423 6,378,376 2,245,680 6,546,029 2,211,711
Articles of leather or composition leather
14,903 52,100 14,713 54,831 15,066 48,800 10,563 35,623 11,564 34,735
Articles of furskin
1,675 28,450 953 17,428 956 14,550 1,002 11,586 1,254 14,674
Articles of leather total
16,578 80,551 15,667 72,259 16,022 63,349 11,566 47,209 12,818 49,410
Bags 154,213 312,329 159,486 343,852 154,953 328,712 141,403 265,782 153,072 263,294
Handbags 7,527 66,767 6,653 62,619 5,902 56,056 6,954 55,293 7,969 59,869
Bags total 161,741 379,096 166,139 406,471 160,856 384,768 148,357 321,075 161,041 323,162 Leather shoes
19,535 83,915 20,422 92,144 19,728 85,612 19,847 71,169 24,582 77,054
Other shoes 40,225 59,726 34,268 54,898 31,555 47,697 28,783 38,129 31,203 38,459 Footwear & shoes total
59,760 143,641 54,690 147,041 51,283 133,309 48,630 109,297 55,785 115,513
Units: volume = 1,000 articles (apparel), 1,000 pairs (footwear & shoes), tons (articles of leather, bags), value = ¥ million Source: Trade Statistics (MOF) Note 1: Total is not always the simple sum for each column due to rounding. Note 2: Other shoes include sports and campus shoes.
<Import trends of apparel materials>
Japanese clothing manufacturers and spinning companies have shifted their production bases to overseas sites where
the manufacturing costs are lower, and the percentage of overseas production is increasing year by year. Consequently,
the domestic production volume of apparel materials such as leather, yarns, and textiles has been declining for the past
several years, leading to a downward trend in the volume of imports. Especially in 2009, contrary to the import volume
of articles of apparel, which was relatively buoyant, apparel material imports dropped dramatically in all items of leather,
silk, wool, cotton, and linen. Due to the economic downturn, consumers ‟ budgets on fashion have diminished. Therefore,
low-priced apparel products manufactured overseas such as in the case of Uniqlo gained consumer popularity, while
domestic articles of apparel, which are comparatively higher in unit price, were cold-shouldered. This is one of the
factors for the fall in the apparel material import volume.
Fig. 6 Changes in apparel material imports
Item 2006 2007 2008 2009 2010
Volume Value Volume Value Volume Value Volume Value Volume Value
Leather 63,001 38,666 62,180 41,480 48,580 31,352 37,467 18,738 37,850 22,715
Silk yarns/textiles 5,845 26,085 4,217 18,480 4,361 17,163 3,184 11,155 3,243 13,072
Wool yarns/textiles 48,587 69,199 44,937 68,840 35,573 55,722 24,318 30,863 27,134 34,507
Cotton yarns/textiles 283,050 93,386 270,792 90,414 257,799 82,600 168,812 48,428 182,054 59,654
Linen yarns/textiles 35,240 9,064 34,888 8,661 38,924 9,209 23,882 5,610 29,786 6,216
Total 435,722 236,400 417,014 227,876 385,238 196,046 257,663 114,793 280,068 136,165 Units: volume = tons, value = ¥ million Source: Trade Statistics (MOF) Note: Total is not always the simple sum for each column due to rounding.
0
50,000
100,000
150,000
200,000
250,000
2006 2007 2008 2009 2010 (year)
(¥million)
0
100,000
200,000
300,000
400,000
500,000
(tons)(value)
(volume)
-Apparel Products and Materials-
- 10 -
Guidebook for Export to Japan 2011 Copyright (C) 2011 JETRO. All rights reserved.
<Import trends by country/region>
[Articles of apparel]
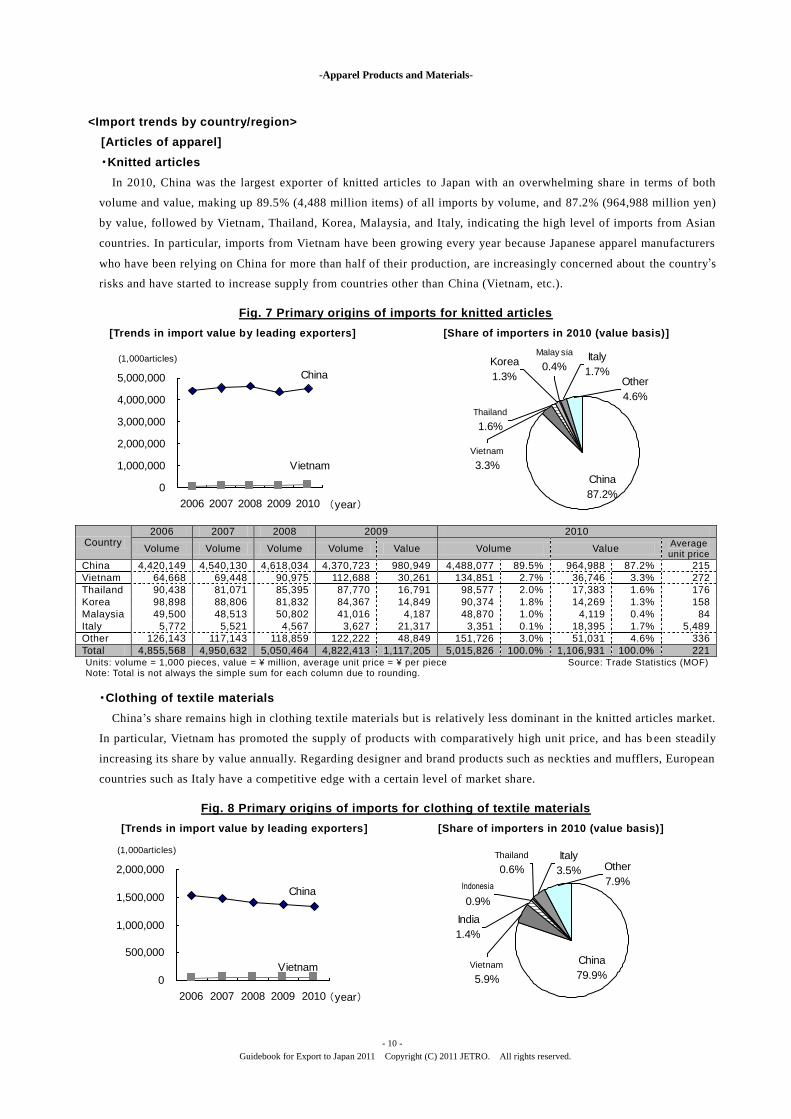
・Knitted articles
In 2010, China was the largest exporter of knitted articles to Japan with an overwhelming share in terms of both
volume and value, making up 89.5% (4,488 million items) of all imports by volume, and 87.2% (964,988 million yen)
by value, followed by Vietnam, Thailand, Korea, Malaysia, and Italy, indicating the high level of imports from Asian
countries. In particular, imports from Vietnam have been growing every year because Japanese apparel manufacturers
who have been relying on China for more than half of their production, are increasingly concerned about the country’s
risks and have started to increase supply from countries other than China (Vietnam, etc.).
Fig. 7 Primary origins of imports for knitted articles
[Trends in import value by leading exporters] [Share of importers in 2010 (value basis)]
Country 2006 2007 2008 2009 2010
Volume Volume Volume Volume Value Volume Value Average unit price
China 4,420,149 4,540,130 4,618,034 4,370,723 980,949 4,488,077 89.5% 964,988 87.2% 215
Vietnam 64,668 69,448 90,975 112,688 30,261 134,851 2.7% 36,746 3.3% 272
Thailand 90,438 81,071 85,395 87,770 16,791 98,577 2.0% 17,383 1.6% 176
Korea 98,898 88,806 81,832 84,367 14,849 90,374 1.8% 14,269 1.3% 158
Malaysia 49,500 48,513 50,802 41,016 4,187 48,870 1.0% 4,119 0.4% 84
Italy 5,772 5,521 4,567 3,627 21,317 3,351 0.1% 18,395 1.7% 5,489
Other 126,143 117,143 118,859 122,222 48,849 151,726 3.0% 51,031 4.6% 336
Total 4,855,568 4,950,632 5,050,464 4,822,413 1,117,205 5,015,826 100.0% 1,106,931 100.0% 221 Units: volume = 1,000 pieces, value = ¥ million, average unit price = ¥ per piece Source: Trade Statistics (MOF) Note: Total is not always the simple sum for each column due to rounding.
・Clothing of textile materials
China‟s share remains high in clothing textile materials but is relatively less dominant in the knitted articles market.
In particular, Vietnam has promoted the supply of products with comparatively high unit price, and has b een steadily
increasing its share by value annually. Regarding designer and brand products such as neckties and mufflers, European
countries such as Italy have a competitive edge with a certain level of market share.
Fig. 8 Primary origins of imports for clothing of textile materials
[Trends in import value by leading exporters] [Share of importers in 2010 (value basis)]
0
1,000,000
2,000,000
3,000,000
4,000,000
5,000,000
2006 2007 2008 2009 2010 (year)
China
Vietnam
(1,000articles)
Other
4.6%
Thailand
1.6%
Vietnam
3.3%
Korea
1.3%
Italy
1.7%
China
87.2%
Malay sia
0.4%
0
500,000
1,000,000
1,500,000
2,000,000
2006 2007 2008 2009 2010 (year)
China
Vietnam
(1,000articles)
Other
7.9%
India
1.4%
Vietnam
5.9%
Indonesia
0.9%
Italy
3.5%
China
79.9%
Thailand
0.6%

-Apparel Products and Materials-
- 11 -
Guidebook for Export to Japan 2011 Copyright (C) 2011 JETRO. All rights reserved.
Country 2006 2007 2008 2009 2010
Volume Volume Volume Volume Value Volume Value Average unit price
China 1,534,144 1,480,014 1,407,879 1,377,241 909,440 1,330,231 86.9% 882,587 79.9% 663
Vietnam 41,852 45,265 48,265 52,015 63,730 53,743 3.5% 65,030 5.9% 1,210
India 25,550 23,115 26,863 28,183 15,833 27,130 1.8% 15,517 1.4% 572
Indonesia 18,640 18,858 21,208 22,377 8,515 23,629 1.5% 9,687 0.9% 410
Thailand 11,791 8,191 9,479 9,530 6,389 12,375 0.8% 6,165 0.6% 498
Italy 7,714 6,826 6,043 4,908 44,555 4,753 0.3% 38,823 3.5% 8,168
Other 50,012 51,241 54,395 61,709 80,012 78,342 5.1% 86,969 7.9% 1,110
Total 1,689,704 1,633,510 1,574,132 1,555,963 1,128,475 1,530,204 100.0% 1,104,779 100.0% 722 Units: volume = 1,000 pieces, value = ¥ million, average unit price = ¥ per piece Source: Trade Statistics (MOF) Note: Total is not always the simple sum for each column due to rounding.
[Articles of leather]
For the leather market in Japan, China has a dominant share by volume, supplying numerous low-end products. On
the other hand, European countries, such as Italy, France, and Switzerland, that supply mainly high-end products, have
a certain level of market share by value, making up a polarized structure with China.
Fig. 9 Primary origins of imports for articles of leather
[Trends in import value by leading exporters] [Share of importers in 2010 (value basis)]
Country
2006 2007 2008 2009 2010
Volume Volume Volume Volume Value Volume Value Average unit price
China 15,257 14,538 15,029 10,696 30,550 12,012 93.7% 33,290 67.4% 2,771
Italy 437 393 313 220 8,114 212 1.7% 7,792 15.8% 36,756
Korea 160 90 80 88 783 73 0.6% 778 1.6% 10,662
U.S.A 119 94 60 56 694 55 0.4% 786 1.6% 14,291
India 34 33 45 54 494 55 0.4% 526 1.1% 9,564
France 51 40 37 27 1,754 46 0.4% 1,515 3.1% 32,943
Spain 22 23 23 15 1,040 15 0.1% 1,133 2.3% 75,522
Other 498 455 436 411 3,780 350 2.7% 3,589 7.3% 10,254
Total 16,578 15,667 16,022 11,566 47,209 12,818 100.0% 49,410 100.0% 3,855 Units: volume = tons, value = ¥ million, average unit price = ¥ per kg Source: Trade Statistics (MOF) Note: Total is not always the simple sum for each column due to rounding.
[Bags]
China is the largest exporter of bags with an overwhelming share in terms of volume, supplying numerous low -end
products. On the other hand, in terms of value, imports from Italy and France that supply high-end products such as
Gucci and Louis Vuitton have presence. The import bag market is divided into China ‟s low-end products and
Italy‟s/France‟s high-end products. However, since 2008, demand for high-end bags in Japan has been dramatically
decreasing due to the recession. As a result, Italy‟s/France‟s share of all imports has been declining, while China has
been becoming increasingly competitive.
0
5,000
10,000
15,000
20,000
2006 2007 2008 2009 2010 (year)
(tons)
China
Italy
Other
7.3%Spain
2.3%
Korea
1.6%Italy
15.8%
U.S.A
1.6%
France
3.1%
China
67.4%
India
1.1%

-Apparel Products and Materials-
- 12 -
Guidebook for Export to Japan 2011 Copyright (C) 2011 JETRO. All rights reserved.
Fig. 10 Primary origins of imports for bags
[Trends in import value by leading exporters] [Share of importers in 2010 (value basis)]
Country
2006 2007 2008 2009 2010
Volume Volume Volume Volume Value Volume Value Average unit price
China 148,488 152,838 147,551 136,125 207,405 147,237 91.4% 212,123 65.6% 1,441
Vietnam 2,778 2,914 3,323 3,624 6,671 4,504 2.8% 8,802 2.7% 1,954
Taiwan 1,996 2,306 2,449 2,045 2,311 2,660 1.7% 2,732 0.8% 1,027
Italy 2,063 1,963 1,730 1,321 43,793 1,397 0.9% 42,408 13.1% 30,350
Thailand 1,055 875 898 786 2,107 718 0.4% 2,090 0.6% 2,911
France 915 872 719 516 36,277 507 0.3% 32,455 10.0% 63,995
Other 4,445 4,371 4,185 3,940 22,511 4,017 2.5% 22,551 7.0% 5,613
Total 161,741 166,139 160,856 148,357 321,075 161,041 100.0% 323,162 100.0% 2,007 Units: volume = tons, value = ¥ million, average unit price = ¥ per kg Source: Trade Statistics (MOF) Note: Total is not always the simple sum for each column due to rounding.
[Footwear & shoes]
・Leather shoes
In terms of volume, most leather shoes are imported from China, Cambodia, Myanmar, and Bangladesh. In 2010,
imports from these countries made up 72.7% of all imports. In the past, Japanese leather shoe manufacturers were
dependent on China for low-cost production. However, an increasing number of Japanese manufacturers started to
relocate their production sites to other low-cost manufacturing countries such as Cambodia or Myanmar, and currently
there is a large volume of leather shoe imports from other Asian countries besides China. By value, Italy had a high
share (24.4%), followed by China (21.6%), and Cambodia (12.4%). The import leather shoes market is divided into
the low-end products of Asian countries and high-end products of Italy. However, with low-end products, price
competition is intensifying between countries. In recent years, China ‟s predominance has been conspicuous, but other
countries are also gradually showing competitive edge.
Fig. 11 Primary origins of imports for leather shoes
[Trends in import value by leading exporters] [Share of importers in 2010 (value basis)]
0
50,000
100,000
150,000
200,000
2006 2007 2008 2009 2010 (year)
(tons)
China
Vietnam
Thailand
0.6%
China
65.6%
France
10.0%
Italy
13.1%
Vietnam
2.7%
Taiw an
0.8%
Other
7.0%
0
1,000
2,000
3,000
4,000
5,000
6,000
7,000
2006 2007 2008 2009 2010 (year)
(1,000pairs)
China
Bangladesh
Myanmar
Cambodia
My anmar
7.8%
Cambodia
12.4%
Bangladesh
6.1%
Other
27.7%
China
21.6%
Italy
24.4%

-Apparel Products and Materials-
- 13 -
Guidebook for Export to Japan 2011 Copyright (C) 2011 JETRO. All rights reserved.
Country
2006 2007 2008 2009 2010
Volume Volume Volume Volume Value Volume Value Average unit price
China 5,713 5,917 6,016 5,398 14,874 6,520 26.5% 16,632 21.6% 2,551
Cambodia 5,319 5,360 4,136 4,074 8,607 4,679 19.0% 9,532 12.4% 2,037
Myanmar 1,485 1,930 2,190 2,967 5,781 3,643 14.8% 6,025 7.8% 1,654
Bangladesh 1,395 1,696 2,010 1,972 3,064 3,040 12.4% 4,724 6.1% 1,554
Italy 2,596 2,404 1,919 1,600 20,087 1,619 6.6% 18,766 24.4% 11,593
Other 3,027 3,115 3,457 3,837 18,755 5,082 20.7% 21,375 27.7% 4,206
Total 19,535 20,422 19,728 19,847 71,169 24,582 100.0% 77,054 100.0% 3,135 Unit: Volume = 1,000 pairs, Value = ¥ million, average unit price = ¥ per 1 pair Source: Trade Statistics (MOF)
Note: Total is not always the simple sum for each column due to rounding.
・Sports shoes, campus shoes
In 2010, China significantly outperformed all other countries for imports of sports and campus shoes both by
volume at 59.5% (18,570 shoes) and by value at 56.0% (21,552 billion yen), followed by Indonesia and Vietnam,
which have constantly competed against each other with their market shares varying year by year. The two countries
have been increasing exports of sports shoes and campus shoes to Japan since 2000, and the competition between them
has continued for several years.
Fig. 12 Primary origins of imports for sports shoes, campus shoes
[Trends in import value by leading exporters] [Share of importers in 2010 (value basis)]
Country
2006 2007 2008 2009 2010
Volume Volume Volume Volume Value Volume Value Average
unit price
China 25,810 22,906 20,631 18,405 22,822 18,570 59.5% 21,552 56.0% 1,161
Indonesia 5,312 3,770 3,517 3,847 4,079 5,105 16.4% 5,087 13.2% 996
Vietnam 4,924 4,689 4,956 3,940 5,841 4,731 15.2% 6,845 17.8% 1,447
Bangladesh 704 950 1,015 1,086 1,335 1,099 3.5% 1,335 3.5% 1,215
Myanmar 522 464 385 458 765 465 1.5% 653 1.7% 1,404
Other 2,954 1,488 1,051 1,046 3,287 1,233 4.0% 2,987 7.8% 2,423
Total 40,225 34,268 31,555 28,783 38,129 31,203 100.0% 38,459 100.0% 1,233 Unit: Volume = 1,000 pairs, Value = ¥ million, average unit price = ¥ per 1 pair Source: Trade Statistics (MOF)
Note: Total is not always the simple sum for each column due to rounding.
[Apparel materials]
・Leather
Among apparel materials, leather is imported the most from the United States, wh ich accounted for 40.5% (15,346
tons) in terms of volume and 22.2% (¥5.042 billion) in terms of value in 2010. Leather includes raw hides, tanned
leather etc., but raw hides make up most of the imports in both volume and value. Since raw hides are by -products in
the slaughtering and processing of beef cattle etc., the largest imports come from the U.S., the top meat producer in
the world. Furthermore, although recent imports of leather from China have been on the decline in terms of volume,
they have been on the rise in terms of value, and trading prices have remained high. Most imports of leather from
China used to be raw hides, but imports of value-added tanned leather are increasing due to an improvement in the
tanning techniques under technical guidance from Japanese corporations.
0
5,000
10,000
15,000
20,000
25,000
30,000
2006 2007 2008 2009 2010 (year)
(1,000pairs)
China
Indonesia
Vietnam
Vietnam
17.8%
Indonesia
13.2%
Bangladesh
3.5%
Other
7.8%
China
56.0%
My anmar
1.7%

-Apparel Products and Materials-
- 14 -
Guidebook for Export to Japan 2011 Copyright (C) 2011 JETRO. All rights reserved.
Fig. 13 Primary origins of imports for leather
[Trends in import value by leading exporters] [Share of importers in 2010 (value basis)]
Country
2006 2007 2008 2009 2010
Volume Volume Volume Volume Value Volume Value Average unit price
U.S.A. 31,889 28,801 18,598 16,069 3,620 15,346 40.5% 5,042 22.2% 329
Canada 2,739 3,824 3,724 3,875 548 6,075 16.1% 1,275 5.6% 210
Australia 7,464 8,167 7,754 4,386 954 3,152 8.3% 1,221 5.4% 387
Korea 521 2,499 2,973 3,122 1,362 2,453 6.5% 1,434 6.3% 584
Netherlands 3,482 3,142 2,018 1,805 625 1,637 4.3% 700 3.1% 428
China 2,987 1,012 775 665 2,951 635 1.7% 3,413 15.0% 5,378
Bangladesh 713 724 596 541 1,314 657 1.7% 1,543 6.8% 2,348
Other 13,206 14,011 12,142 7,004 7,364 7,896 20.9% 8,087 35.6% 1,024
Total 63,001 62,180 48,580 37,467 18,738 37,850 100.0% 22,715 100.0% 600
Units: volume = tons, value = ¥ million, average unit price = ¥ per kg Source: Trade Statistics (MOF) Note: Total is not always the simple sum for each column due to rounding.
・Silk yarns/textiles
China was a major origin of imports for silk yarns/textiles with a large share of 70.1% (2,273 tons) in volume, and
67.7% (¥8.849 billion) in value in 2010. China was followed by Vietnam and Brazil, the three countries accounting for
90% of the total volume imported.
Fig. 14 Primary origins of imports for silk yarns/textiles
[Trends in import value by leading exporters] [Share of importers in 2010 (value basis)]
Country
2006 2007 2008 2009 2010
Volume Volume Volume Volume Value Volume Value Average unit price
China 3,929 2,900 2,879 2,131 6,848 2,273 70.1% 8,849 67.7% 3,893
Vietnam 628 402 518 394 1,226 372 11.5% 1,321 10.1% 3,555
Brazil 754 447 471 346 1,098 347 10.7% 1,293 9.9% 3,724
Thailand 256 269 346 204 302 82 2.5% 174 1.3% 2,133
India 67 38 45 36 149 64 2.0% 174 1.3% 2,698
Italy 97 84 63 54 1,260 46 1.4% 995 7.6% 21,718
Other 114 77 40 18 272 60 1.9% 268 2.1% 4,467
Total 5,845 4,217 4,361 3,184 11,155 3,243 100.0% 13,072 100.0% 4,031 Units: volume = tons, value = ¥ million, average unit price = ¥ per kg Source: Trade Statistics (MOF) Note: Total is not always the simple sum for each column due to rounding.
0
5,000
10,000
15,000
20,000
25,000
30,000
35,000
2006 2007 2008 2009 2010 (year)
(tons)
U.S.A.
Canada
Australia
Netherlands
3.1%
U.S.A.
22.2%
China
15.0%Korea
6.3%
Canada
5.6%
Australia
5.4%Bangladesh
6.8%
Other
35.6%
0
1,000
2,000
3,000
4,000
5,000
2006 2007 2008 2009 2010 (year)
(tons)
China
Vietnam
Other
2.1%
Brazil
9.9%
Vietnam
10.1%
Thailand
1.3%
Italy
7.6%
China
67.7%
India
1.3%

-Apparel Products and Materials-
- 15 -
Guidebook for Export to Japan 2011 Copyright (C) 2011 JETRO. All rights reserved.
・Wool yarns/textiles
The primary importing partners for wool yarns/textiles in terms of volume were China, followed by New Zealand,
Australia, and Taiwan in 2010. In terms of value on the other hand, China still remain ed the leader but Italy showed a
strong presence by placing second, in spite of its total volume of imports accounting for only around one -tenth of
China. Japan imports high-end wool textiles from Italy, which boosts Italian import records due to its steep transaction
prices.
Fig. 15 Primary origins of imports for wool yarns/textiles
[Trends in import value by leading exporters] [Share of importers in 2010 (value basis)]
Country
2006 2007 2008 2009 2010
Volume Volume Volume Volume Value Volume Value Average
unit price
China 17,910 16,108 12,673 8,658 12,818 9,846 36.3% 14,873 43.1% 1,511
New Zealand 5,529 5,896 4,495 3,499 843 3,745 13.8% 969 2.8% 259
Australia 4,952 5,438 4,091 2,394 1,491 3,024 11.1% 2,301 6.7% 761
Taiwan 5,852 5,034 3,568 2,287 1,455 2,903 10.7% 2,316 6.7% 798
Malaysia 4,025 3,923 3,078 2,292 2,200 2,216 8.2% 2,533 7.3% 1,143
Italy 2,143 1,845 1,290 948 7,245 905 3.3% 6,329 18.3% 6,992
Other 8,176 6,693 6,378 4,240 4,811 4,495 16.6% 5,186 15.0% 1,154
Total 48,587 44,937 35,573 24,318 30,863 27,134 100.0% 34,507 100.0% 1,272 Units: volume = tons, value = ¥ million, average unit price = ¥ per kg Source: Trade Statistics (MOF) Note: Total is not always the simple sum for each column due to rounding.
・Cotton yarns/textiles
In 2010, China was the leading exporter of cotton yarns/textiles to Japan in both volume and value, accounting for
21.6% (39,256 tons) in volume and 32.5% (¥19.36 billion) in value. Major exporters of cotton such as the U.S.,
Indonesia, and other countries followed with a considerable amount, and the three countries rivaled for market share.
The U.S. and Australia export a great deal of cotton or cotton yarns into Japan, whereas China and Indonesia export
more cotton textiles in which the cotton has been processed in several ways, leading to a gap in the average unit
prices. China has been especially keen on exporting value-added processed products in various segments of the
market, and the trend has become more prominent in recent years.
Fig. 16 Primary origins of imports for cotton yarns/textiles
[Trends in import value by leading exporters] [Share of importers in 2010 (value basis)]
0
5,000
10,000
15,000
20,000
2006 2007 2008 2009 2010 (year)
(tons)
China
New Zealand
Australia
Malay sia
7.3%
China
43.1%Italy
18.3%
Taiw an
6.7% New
Zealand
2.8%
Australia
6.7%
Other
15.0%
0
10,000
20,000
30,000
40,000
50,000
60,000
70,000
2006 2007 2008 2009 2010 (year)
(tons)
China
IndonesiaAustralia
U.S.A.
Other
19.5%
Indonesia
15.8%
U.S.A.
10.4%
Australia
5.3%
India
9.7%
China
32.5%
Pakistan
6.8%

-Apparel Products and Materials-
- 16 -
Guidebook for Export to Japan 2011 Copyright (C) 2011 JETRO. All rights reserved.
Country
2006 2007 2008 2009 2010
Volume Volume Volume Volume Value Volume Value Average unit price
China 63,570 60,180 53,714 37,348 15,976 39,256 21.6% 19,360 32.5% 493
U.S.A. 56,130 50,540 50,338 25,694 3,813 33,695 18.5% 6,175 10.4% 183
Indonesia 27,415 23,231 24,472 22,482 6,795 28,718 15.8% 9,433 15.8% 328
Australia 33,958 33,236 27,143 15,150 1,926 19,352 10.6% 3,183 5.3% 164
Pakistan 26,904 23,443 24,870 21,006 4,627 14,927 8.2% 4,081 6.8% 273
India 19,313 18,728 18,642 11,881 4,588 12,321 6.8% 5,811 9.7% 472
Other 55,760 61,433 58,621 35,251 10,704 33,784 18.6% 11,611 19.5% 344
Total 283,050 270,792 257,799 168,812 48,428 182,054 100.0% 59,654 100.0% 328 Units: volume = tons, value = ¥ million, average unit price = ¥ per kg Source: Trade Statistics (MOF) Note: Total is not always the simple sum for each column due to rounding.
・Linen yarns/textiles
A large portion of 2010 imports of linen yarns/textiles was accounted for by China, with 29.2% (8,683 tons) in
volume and 46.8% (¥2.912 billion) in value. China also excels in textiles in this domain, and the average trading price
marks a higher level than other Asian states. During the economic slump in 2009, domestic demand for apparel
materials dwindled leading to a substantial decrease of imports especially from countries such as the Philippines.
During this period, contrary to the downward trend, imports from China actually increased. One reason for this was as
business for Japanese apparel manufacturer stagnated and demand for material such as linen/linen yarns declined,
Chinese textiles remained on a strong note.
Fig. 17 Primary origins of imports for linen yarns/textiles
[Trends in import value by leading exporters] [Share of importers in 2010 (value basis)]
Country
2006 2007 2008 2009 2010
Volume Volume Volume Volume Value Volume Value Average unit price
China 7,503 7,469 8,411 8,834 2,929 8,683 29.2% 2,912 46.8% 335
Philippines 6,763 6,804 7,703 2,150 247 5,221 17.5% 517 8.3% 99
Sri Lanka 4,377 4,595 3,556 3,064 146 3,412 11.5% 182 2.9% 53
India 3,593 3,882 4,463 2,737 388 3,308 11.1% 514 8.3% 155
Bangladesh 4,619 3,896 4,552 3,173 360 3,242 10.9% 442 7.1% 136
Italy 258 157 164 101 551 107 0.4% 584 9.4% 5,453
Other 8,126 8,085 10,075 3,825 990 5,812 19.5% 1,065 17.1% 183
Total 35,240 34,888 38,924 23,882 5,610 29,786 100.0% 6,216 100.0% 209 Units: volume = tons, value = ¥ million, average unit price = ¥ per kg Source: Trade Statistics (MOF) Note: Total is not always the simple sum for each column due to rounding.
(2) Import Market Share in Japan
In the apparel market, domestic production has been decreasing in terms of value and volume since 1992 due to the
relocation of production sites overseas and the growth of specialty store retailers of private label apparel (SPAs) whose
production bases have gathered in China. On the other hand, import market share has been growing. Japanese apparel
related companies have adopted the process of manufacturing low-end, high quality casual articles of apparel in China.
These have become indispensable in meeting demand for articles of apparel manufactured in bulk among Japanese
consumers.
As for articles of leather, imports make up a large part at over 90% of the Japanese market. Since 2000, low-end
0
2,000
4,000
6,000
8,000
10,000
2006 2007 2008 2009 2010(year)
(tons)
China
Sri Lanka
India
Philippines
Other
17.1%
Sri Lanka
2.9%
Philippines
8.3%
India
8.3%
Italy
9.4%
China
46.8%
Bangladesh
7.1%

-Apparel Products and Materials-
- 17 -
Guidebook for Export to Japan 2011 Copyright (C) 2011 JETRO. All rights reserved.
import products from China have been rapidly growing, resulting in a sharp drop in domestic production. As for articles
of fur, some farmed mink and fox are domestically produced, but most other products are imported. Japan relies on
imports for over 90% of total consumption.
In the bag market, inexpensive products from China and high-end products from Europe are doing very well, while
domestic products are struggling. Related Japanese manufacturers have been shifting production and finishing bases to
China and South-East Asia, resulting in the decreasing the rate of domestic manufacturing. Currently, imports make up
more than 70% of the Japanese bag market.
The same applies to footwear & shoes. Share of imports is growing annually, and this trend is especially strong for
sports shoes. Popular brands such as Nike and Adidas are manufactured in Asian countries like China, after which they
are imported to Japan. Japanese brands are also able to cut costs as a result of overseas production. Except for a few
products, most Japanese brands are imports. Imports make up over 80% of the footwear and shoes market.
Since most of the apparel material such as cotton or leather is not acquired in Japan and there is an increasing number
of spinning companies shifting their production bases to overseas locations, the import share is quite large and growing
every year. China accounts for the bulk of the imports, becoming an essential trading partner for Japan in apparel
manufacturing. Apparel material production in Japan has been on the decline s ince its peak in the 1970s. Domestic
spinning companies have been establishing manufacturing sites in low-cost Asian countries, mainly in China, leading to
overseas production volume surpassing domestic production volume.
(3) Changes in Volume of Imports and Backgrounds
The total import volume of apparel products decreased annually in 2008 and 2009 after peaking in 2007 with the
results varying among items: articles of apparel, articles of leather, bags, and footwear & shoes, apparel materials.
Reasons for this downward trend may be due to reduced consumption in Japan triggered by the Lehman ‟s fall in the
latter half of 2008. In fact, the overall imports of most apparel products and materials were on the increase by volume
and value in 2010 when the recession is said to have bottomed out.
Looking at import trends by type of apparel product and importer, imports from China were highest, by volume, for all
products. This demonstrates China‟s extremely important role in the Japanese apparel industry. On the other hand, in
terms of value, high-end brand products imported from Italy and France have a strong presence over China, and these
countries enjoy a certain share centering around women in their 20s and 30s. However, since the Lehman ‟s fall in 2008,
demand for high-end products made in Italy and France has been decreasing due to reluctant spending spurred by the
recession, while products manufactured in China have seen a growth in market presence.
The same can be said for apparel materials, with imports from China dominating the market. The recent trend for
apparel material imports from China is an increase in processed products such as textiles and tanned leather etc., rather
than in the materials themselves or yarns. The background to this trend is China ‟s aim to shift from exporting upstream
products such as material or yarns etc., to exporting high-value-added downstream products. Japan is looking to cut down
on transport/domestic production costs. The import ratio of processed products is on the rise bec ause their intentions
have been met in this regard.
5. Domestic Distribution
(1) Trade Practice
In the Japanese apparel industry, trade practices such as “contract purchasing,” “consignment purchasing,”
“dispatched store staff system,” and “invoice pricing system” are common.
In contract purchasing, the ownership of products does not lie with the retail stores. Instead retail stores tentatively
receive products from apparel companies based on the contract sales agreement and are paid commission according to
their sales performance. In consignment purchasing, the ownership of products also does not lie with the retail stores as
in contract purchasing, however, whenever a retail store sells a product, they are able to appropriate that sales as

-Apparel Products and Materials-
- 18 -
Guidebook for Export to Japan 2011 Copyright (C) 2011 JETRO. All rights reserved.
purchase. In the apparel industry, buyback transactions are also observed. Consequently, these three purchasing methods
are generally carried out in this industry.
In the dispatched store staff system, wholesalers and apparel manufacturers dispatch personnel to retail stores for
products purchased by contract or consignment to support the sales activities of the retail stores. This is generally carried
out in retail stores practicing contract or consignment purchasing.
Invoice pricing is a system where manufacturers preset the margin (sales commission) to wholesalers and retails stores,
and propose prices to the store as a suggested retail price. The maintenance of resale prices is prohibited by the Act on
Prohibition of Private Monopolization and Maintenance of Fair Trade. This right of manufacturers to set the retail price
is unique to the apparel industry.
Other than the above, trade practices unique to this industry include “rebate” where remuneration is paid to the
wholesalers and retail stores if they sell a product at a certain volume, and business based on verbal promise instead of
written contracts is carried out frequently.
(2) Domestic Market Situations
<Articles of apparel, footwear & shoes>
In the apparel market in Japan, product prices are dropping and the consumer market scale continues to shrink due to
sluggish individual spending, increases in low-end import products from Asian countries like China, as well as the
increase in popularity of fast fashion as represented by Uniqlo in recent years. Furthermore, since the Lehman‟s fall in
2008, willingness to buy amongst consumer has been declining, causing the market scale to shrink even more. According
to the changes in the household consumption scale of apparel surveyed by the Japan Apparel Technology and Research
Association, the size of the apparel market in 2010 was 7,251,900 million yen, 86.5% versus last year. Compared to its
peak in 1996 (15,218,500 million yen), the size has decreased to less than half.
As the apparel market continues to shrink, keywords of the recent apparel industry are “functional,” “real clothes,”
and PB (private brand).Various functional articles of apparel are appearing on the market and gaining popularity such as
thermal underwear developed by Uniqlo called “Heat Tech,” and machine-washable suit. These functional products are
popular not only in Japan but overseas as well.
Until now, brand name has been important to consumers when purchasing articles of apparel, but as proven by the
recent success of Tokyo Girls Collection, “real clothes” which are fashionable and affordable for the general public, are
gaining popularity.
PB (Private Brand) products are unique in that the retailer has the initiative in selecting price, specifications, and
design. The retailer can also place orders directly to manufacturers and basically sell the products themselves. Although
profitability is high, they are characteristically accompanied by stock risks. To apparel retailers normally with low
profitability, PB products are important strategic products that allow them to break away from the low gross profit
system. In recent years, more and more retail stores are increasing PB sales rates made up by articles of apparel while
aware of the stock risks involved.
Fig. 18 Changes in the market size of articles of apparel and footwear
0
20,000
40,000
60,000
80,000
100,000
2006 2007 2008 2009 2010 (year)
Articles of
apparel
Footw ear
(¥100 million)

-Apparel Products and Materials-
- 19 -
Guidebook for Export to Japan 2011 Copyright (C) 2011 JETRO. All rights reserved.
Item 2006 2007 2008 2009 2010
Yearly change Share
Clothing 40,940 40,740 39,314 36,399 35,249 96.8% 42.1%
(Men’s clothing) 12,834 13,181 12,090 10,787 10,927 101.3% 13.0%
(Women‟s clothing) 22,431 22,183 21,782 20,549 19,489 94.8% 23.3%
(Children‟s clothing) 5,674 5,376 5,442 5,063 4,833 95.5% 5.8%
Shirts and sweaters 21,836 21,696 20,751 19,228 18,369 95.5% 21.9%
(Men‟s shirts and sweaters) 6,735 6,631 6,334 5,883 5,614 95.4% 6.7%
(Women‟s shirts and sweaters) 13,079 13,259 12,535 11,658 11,206 96.1% 13.4%
(Children‟s shirts and sweaters) 2,021 1,806 1,882 1,686 1,550 91.9% 1.8%
Underwear 9,555 9,245 9,072 8,616 8,373 97.2% 10.0%
Hosiery 3,411 3,388 3,375 3,288 3,085 93.8% 3.7%
Other 8,715 8,835 8,562 8,258 7,443 90.1% 8.9%
Articles of apparel total 84,456 83,904 81,074 75,789 72,519 95.7% 86.5%
Footwear 11,590 11,840 11,911 11,810 11,289 95.6% 13.5%
Total 96,047 95,744 92,985 87,600 83,808 95.7% 100.0% Unit: ¥100 million Source: Changes in household expenditures for apparel (Japan Apparel Technology and Research Association) Note 1: Total is not always the simple sum for each column due to rounding. Note 2: Other includes Japanese dresses, gloves, other clothing, and textiles & yarns.
<Articles of leather>
The leather market has mostly been dominated by Italian and French luxury items, and has tended to be more for
middle-aged and elderly persons. But since 2000, low-end casual products made in China have been flowing into Japan
in large volume. More affordable to consumers, they are used extensively by young girls, etc. Articles of leather (fur and
leather) are now regaining popularity as daily fashion items, not as symbols of “status,” as was common in the past,
where owning these items meant a high social status.
Reasons why articles of leather are more accessible to consumers today include diversification of materials, and
technical innovations such as tanning. For instance, it is said that there are more than 200 types of lamb skin according
to skin length and texture. Improvements in manufacturing technology have enabled fur items to be made very light.
Also many affordable and attractive products made by joining scraps of different typ es of leather together are appearing
on the market.
<Bags>
The bag market in Japan consists of different price categories; popular items priced around 1,000 to 5,000 yen,
domestic brands in the 10,000 to 30,000 yen range, overseas brands that range from 20,000 to 70,000 yen, and overseas
luxury brands that exceed 70,000 yen. With popular items, imports from Asian countries like China have been
dominating the market in recent years due to their inexpensive price and practicality. Expensive luxury brands ar e
growing in sales as well, and between these two product groups are the mid-price range products made in Japan, which
are declining in popularity, resulting in a clear-cut polarized structure. However, since 2008 when the economy started to
worsen, demands for expensive overseas luxury brands have plummeted, replaced by popular items made in China and
low-end Japanese brands, resulting in a change in the current polarized structure.
Into 2010, the high yen and depreciating Euro has allowed Japanese consumers to purchase overseas luxury brands at
lower prices, leading to a shift in demand for high-end products again. However, demand for popular items made in
China remains strong.
<Footwear & shoes>
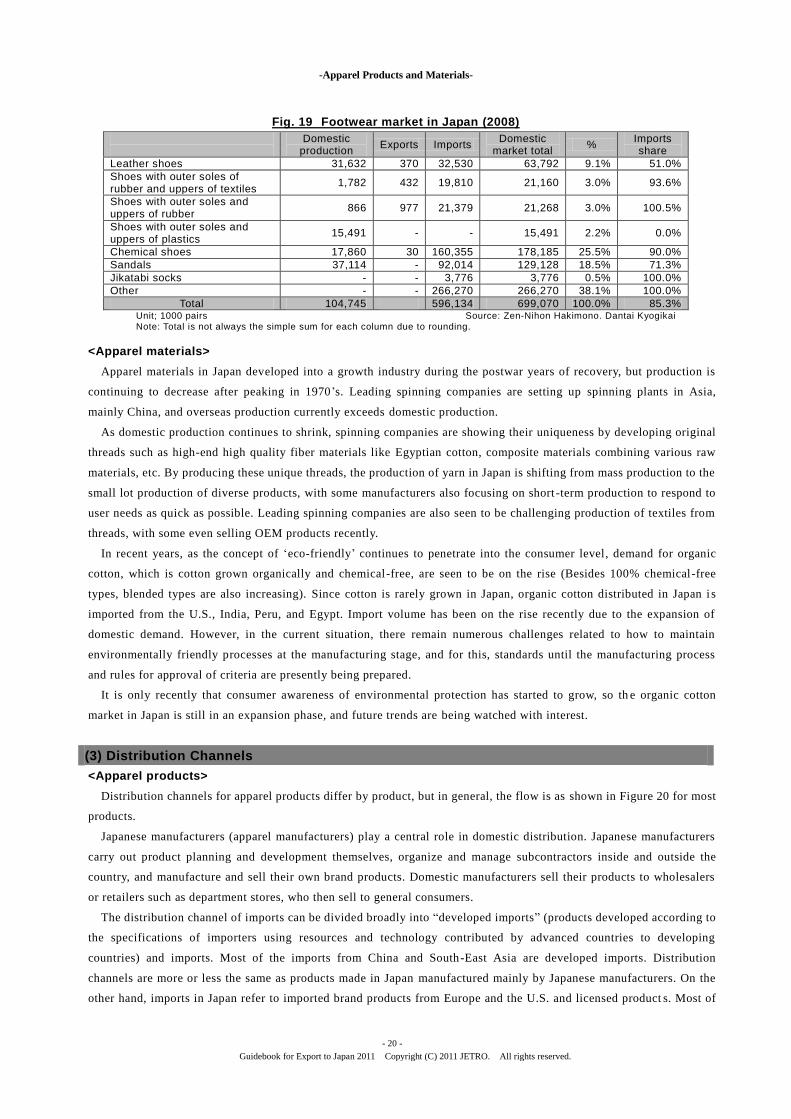
According to the statistics of Zen-Nihon Hakimono and Dantai Kyogikai, the domestic market for shoes such as
leather shoes, rubber shoes, sports shoes, chemical shoes, and sandals saw annual sales of 699,070,000 pairs in 2008.
Figure 13 shows categories based on domestic standards. Most imports are made of compos ite materials, and 85.3% of
the Japanese shoes market is made up of imports (including overseas productions of Japanese manufacturers). To cut
production costs, Japanese manufacturers are mass producing footwear in Asian countries such as China and
concentrating productions of small lot products in Japan. Regarding small lot production, supply chain networks in Asia
are gradually being built, and a shift of production to overseas is accelerating while the import share is growing year by
year.
-Apparel Products and Materials-
- 20 -
Guidebook for Export to Japan 2011 Copyright (C) 2011 JETRO. All rights reserved.
Fig. 19 Footwear market in Japan (2008)
Domestic production
Exports Imports Domestic
market total %
Imports share
Leather shoes 31,632 370 32,530 63,792 9.1% 51.0%
Shoes with outer soles of rubber and uppers of textiles
1,782 432 19,810 21,160 3.0% 93.6%
Shoes with outer soles and uppers of rubber
866 977 21,379 21,268 3.0% 100.5%
Shoes with outer soles and uppers of plastics
15,491 - - 15,491 2.2% 0.0%
Chemical shoes 17,860 30 160,355 178,185 25.5% 90.0%
Sandals 37,114 - 92,014 129,128 18.5% 71.3%
Jikatabi socks - - 3,776 3,776 0.5% 100.0%
Other - - 266,270 266,270 38.1% 100.0%
Total 104,745 596,134 699,070 100.0% 85.3% Unit; 1000 pairs Source: Zen-Nihon Hakimono. Dantai Kyogikai Note: Total is not always the simple sum for each column due to rounding.
<Apparel materials>
Apparel materials in Japan developed into a growth industry during the postwar years of recovery, but production is
continuing to decrease after peaking in 1970‟s. Leading spinning companies are setting up spinning plants in Asia,
mainly China, and overseas production currently exceeds domestic production.
As domestic production continues to shrink, spinning companies are showing their uniqueness by developing original
threads such as high-end high quality fiber materials like Egyptian cotton, composite materials combining various raw
materials, etc. By producing these unique threads, the production of yarn in Japan is shifting from mass production to the
small lot production of diverse products, with some manufacturers also focusing on short -term production to respond to
user needs as quick as possible. Leading spinning companies are also seen to be challenging production of textiles from
threads, with some even selling OEM products recently.
In recent years, as the concept of „eco-friendly‟ continues to penetrate into the consumer level, demand for organic
cotton, which is cotton grown organically and chemical-free, are seen to be on the rise (Besides 100% chemical-free
types, blended types are also increasing). Since cotton is rarely grown in Japan, organic cotton distributed in Japan i s
imported from the U.S., India, Peru, and Egypt. Import volume has been on the rise recently due to the expansion of
domestic demand. However, in the current situation, there remain numerous challenges related to how to maintain
environmentally friendly processes at the manufacturing stage, and for this, standards until the manufacturing process
and rules for approval of criteria are presently being prepared.
It is only recently that consumer awareness of environmental protection has started to grow, so th e organic cotton
market in Japan is still in an expansion phase, and future trends are being watched with interest.
(3) Distribution Channels
<Apparel products>
Distribution channels for apparel products differ by product, but in general, the flow is as shown in Figure 20 for most
products.
Japanese manufacturers (apparel manufacturers) play a central role in domestic distribution. Japanese manufacturers
carry out product planning and development themselves, organize and manage subcontractors inside and outside the
country, and manufacture and sell their own brand products. Domestic manufacturers sell their products to wholesalers
or retailers such as department stores, who then sell to general consumers.
The distribution channel of imports can be divided broadly into “developed imports” (products developed according to
the specifications of importers using resources and technology contributed by advanced countries to developing
countries) and imports. Most of the imports from China and South-East Asia are developed imports. Distribution
channels are more or less the same as products made in Japan manufactured mainly by Japanese manufacturers. On the
other hand, imports in Japan refer to imported brand products from Europe and the U.S. and licensed product s. Most of

-Apparel Products and Materials-
- 21 -
Guidebook for Export to Japan 2011 Copyright (C) 2011 JETRO. All rights reserved.
these products are imported from overseas manufacturers through their Japanese subsidiaries and import agents, or
Japanese trading companies and sold to consumers by retailers through domestic wholesalers.
In recent years, an increasing number of leading retailers are trading directly with importers, and coupled with the
extensive popularity of Internet business, wholesalers are starting to lose presence, and distribution channels are
short-circuiting.
Fig. 20 Distribution channels for apparel products
<Apparel materials>
The general distribution channels for apparel materials such as yarns and textiles are as shown in Figure 21for most
products with slight differences among products.
Apparel product materials imported are first distributed to apparel manufacturers via trading companies and domestic
material manufacturers (yarn manufacturers, textile manufacturers, etc.), and commercialized articles of apparel and bags,
etc. are sold to general consumers through wholesalers and retail stores. On the other hand, textile products such as yarn
are distributed by the four leading distributing centers Tokyo, Osaka, Nagoya, and Kyoto, and they are generally
distributed through these markets.
Fig. 21 Distribution channels for apparel materials (yarns & textiles)
Overseas manufacturers, overseas plants of domestic manufacturers
Trading firms, importers
Japanese subsidiary of overseas manufacturer, import agents
Consumers
Trading firms, importers
Domestic material suppliers (yarns, textiles, etc.)
Local manufacturers and wholesalers
Apparel manufacturer
Local wholesalers
Department stores, GMS, specialty stores, draper’s shops, select shops, exhibits, apparel makers’ direct shops, internet retailers, etc.
Consumers
Overseas manufacturers, overseas plants of domestic manufacturers
Wholesalers at distributing centers (Kyoto, Tokyo, Osaka, Nagoya)
Department stores, GMS, apparel specialty stores, select shops, foreign brands’ direct shops, apparel makers’ direct shops, internet retailers, etc.
Domestic manufacturers
(apparel)
Domestic wholesalers

-Apparel Products and Materials-
- 22 -
Guidebook for Export to Japan 2011 Copyright (C) 2011 JETRO. All rights reserved.
(4) Issues and Considerations for Entering the Japanese Market and Marketing Method
The apparel market in Japan is an already mature one, so it is important to clearly focus on brand characteristics, and
differentiate from other brands. The recession is also resulting in an increase in consumers who make no comprises when
selecting products, emphasizing product price and quality. When entering the Japanese market, there is a need to
carefully consider consumer needs, and determine characteristics which can differentiate one ‟s products from that of
other manufacturers.
Other precautions required when entering a new market include;
1) Seasonality
Japan enjoys four seasons throughout the year: spring, summer, autumn, and winter. Since the climate and
temperatures vary substantially between the four seasons, products in demand vary according to season. Demand for
heavy coats etc. heightens in winter. Products such as T-shirts that breathe are well sold during the summer months.
That is why precautions must be taken especially when importing seasonal and fashion products from remote places
without seasons. Furthermore, demand tends to increase during the Christmas season, in April for entrance
ceremonies, and on other occasions. Therefore, it is important to set sales strategies that take into account these
seasonal events when selling apparel products in Japan.
2) Production lot
The production lot of overseas articles of apparel is large because they are mainly exported to Europe and the U.S.,
so sometimes these articles may not be suitable for Japanese markets seeking small -lot production of diverse
products in a short period of time. Consequently, it is essential to closely monitor the consumption trends in Japan,
be aware of consumer needs and appropriate quantity demanded, and to develop a production/sales system that can
release products into the market on a moment‟s notice.
3) Quality standards
Even if local inspections are passed, those in Japan may prove difficult. Quality standards sought in Japan are
usually stricter than other countries, and this must be taken into consideration.
With regards to quality criteria, Japan has a Product Liability Law which prescribes that the manufacturer (importer
in the case of imports) is liable for damages if their product proves to be harmful to human life, body, or assets due
to defects. It should be noted that some apparel products (bags, etc.) are included in this law.
(5) Examples of Developing Countries' Products in Japan
Apparel products and materials imported from developing countries include articles of apparel (T-shirt, polo shirt,
etc.) made of organic cotton from Egypt, Tanzania, Uganda, etc., towel, linen, etc., and awareness of such products in
Japan is growing yearly with the increase in concern towards environmental protection and health. In addition, products
with strong ethnic colors from Africa such as basket bags using sisal hemp made in East Africa, sheep leather slippe rs
made in Morocco (baboosh), etc. are becoming increasingly popular amongst the younger generation in Japan who like
ethnic clothing in recent years. In the past, such ethnic products from developing countries were mainly sold in variety
stores, however lately, they are increasingly being sold in leading department stores and select shops.
(6) Import Promotion Activities
Regarding apparel products and materials, the following exhibits and fashion events are held. In each of these exhibits
and events, overseas products are exhibited separately from domestic products, serving as effective opportunities for
advertising and promoting overseas brands and products to the Japanese market.
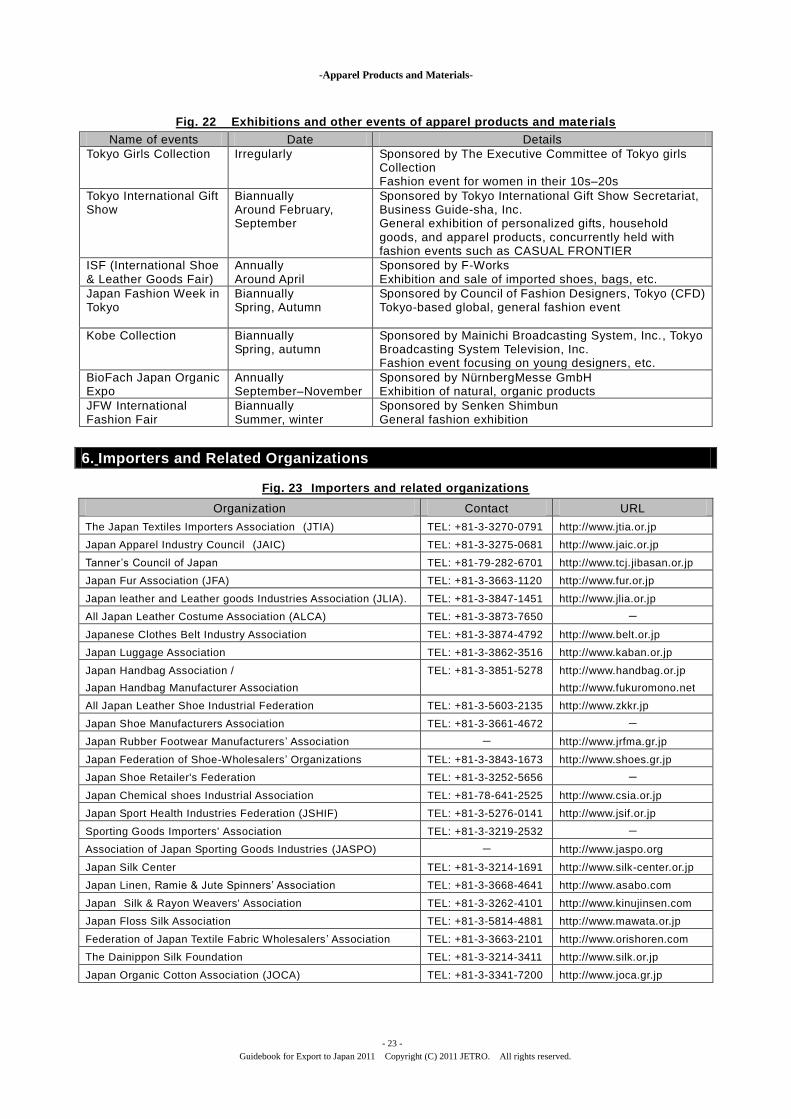
-Apparel Products and Materials-
- 23 -
Guidebook for Export to Japan 2011 Copyright (C) 2011 JETRO. All rights reserved.
Fig. 22 Exhibitions and other events of apparel products and materials
Name of events Date Details
Tokyo Girls Collection Irregularly Sponsored by The Executive Committee of Tokyo girls Collection Fashion event for women in their 10s–20s
Tokyo International Gift Show
Biannually Around February, September
Sponsored by Tokyo International Gift Show Secretariat, Business Guide-sha, Inc. General exhibition of personalized gifts, household goods, and apparel products, concurrently held with fashion events such as CASUAL FRONTIER
ISF (International Shoe & Leather Goods Fair)
Annually Around April
Sponsored by F-Works Exhibition and sale of imported shoes, bags, etc.
Japan Fashion Week in Tokyo
Biannually Spring, Autumn
Sponsored by Council of Fashion Designers, Tokyo (CFD) Tokyo-based global, general fashion event
Kobe Collection Biannually Spring, autumn
Sponsored by Mainichi Broadcasting System, Inc., Tokyo Broadcasting System Television, Inc. Fashion event focusing on young designers, etc.
BioFach Japan Organic Expo
Annually September–November
Sponsored by NürnbergMesse GmbH Exhibition of natural, organic products
JFW International Fashion Fair
Biannually Summer, winter
Sponsored by Senken Shimbun General fashion exhibition
6. Importers and Related Organizations
Fig. 23 Importers and related organizations
Organization Contact URL
The Japan Textiles Importers Association (JTIA) TEL: +81-3-3270-0791 http://www.jtia.or.jp
Japan Apparel Industry Council (JAIC) TEL: +81-3-3275-0681 http://www.jaic.or.jp
Tanner’s Council of Japan TEL: +81-79-282-6701 http://www.tcj.jibasan.or.jp
Japan Fur Association (JFA) TEL: +81-3-3663-1120 http://www.fur.or.jp
Japan leather and Leather goods Industries Association (JLIA). TEL: +81-3-3847-1451 http://www.jlia.or.jp
All Japan Leather Costume Association (ALCA) TEL: +81-3-3873-7650 -
Japanese Clothes Belt Industry Association TEL: +81-3-3874-4792 http://www.belt.or.jp
Japan Luggage Association TEL: +81-3-3862-3516 http://www.kaban.or.jp
Japan Handbag Association /
Japan Handbag Manufacturer Association
TEL: +81-3-3851-5278 http://www.handbag.or.jp
http://www.fukuromono.net
All Japan Leather Shoe Industrial Federation TEL: +81-3-5603-2135 http://www.zkkr.jp
Japan Shoe Manufacturers Association TEL: +81-3-3661-4672 -
Japan Rubber Footwear Manufacturers ’ Association - http://www.jrfma.gr.jp
Japan Federation of Shoe-Wholesalers’ Organizations TEL: +81-3-3843-1673 http://www.shoes.gr.jp
Japan Shoe Retailer's Federation TEL: +81-3-3252-5656 -
Japan Chemical shoes Industrial Association TEL: +81-78-641-2525 http://www.csia.or.jp
Japan Sport Health Industries Federation (JSHIF) TEL: +81-3-5276-0141 http://www.jsif.or.jp
Sporting Goods Importers' Association TEL: +81-3-3219-2532 -
Association of Japan Sporting Goods Industries (JASPO) - http://www.jaspo.org
Japan Silk Center TEL: +81-3-3214-1691 http://www.silk-center.or.jp
Japan Linen, Ramie & Jute Spinners’ Association TEL: +81-3-3668-4641 http://www.asabo.com
Japan Silk & Rayon Weavers' Association TEL: +81-3-3262-4101 http://www.kinujinsen.com
Japan Floss Silk Association TEL: +81-3-5814-4881 http://www.mawata.or.jp
Federation of Japan Textile Fabric Wholesalers ’ Association TEL: +81-3-3663-2101 http://www.orishoren.com
The Dainippon Silk Foundation TEL: +81-3-3214-3411 http://www.silk.or.jp
Japan Organic Cotton Association (JOCA) TEL: +81-3-3341-7200 http://www.joca.gr.jp