Embed Size (px)
Citation preview
2016 Hurricane Field Program Plan Part II: Appendices
Table of Contents
APPENDIX A…………………………………………………………………………………………. 4
Decision and Notification Process………………………………………………………………. 4
APPENDIX B: CALIBRATION………….……….……….………….……….……….……….….. 8
B.1 En-route Calibration of Aircraft Systems…………………………………………………... 8
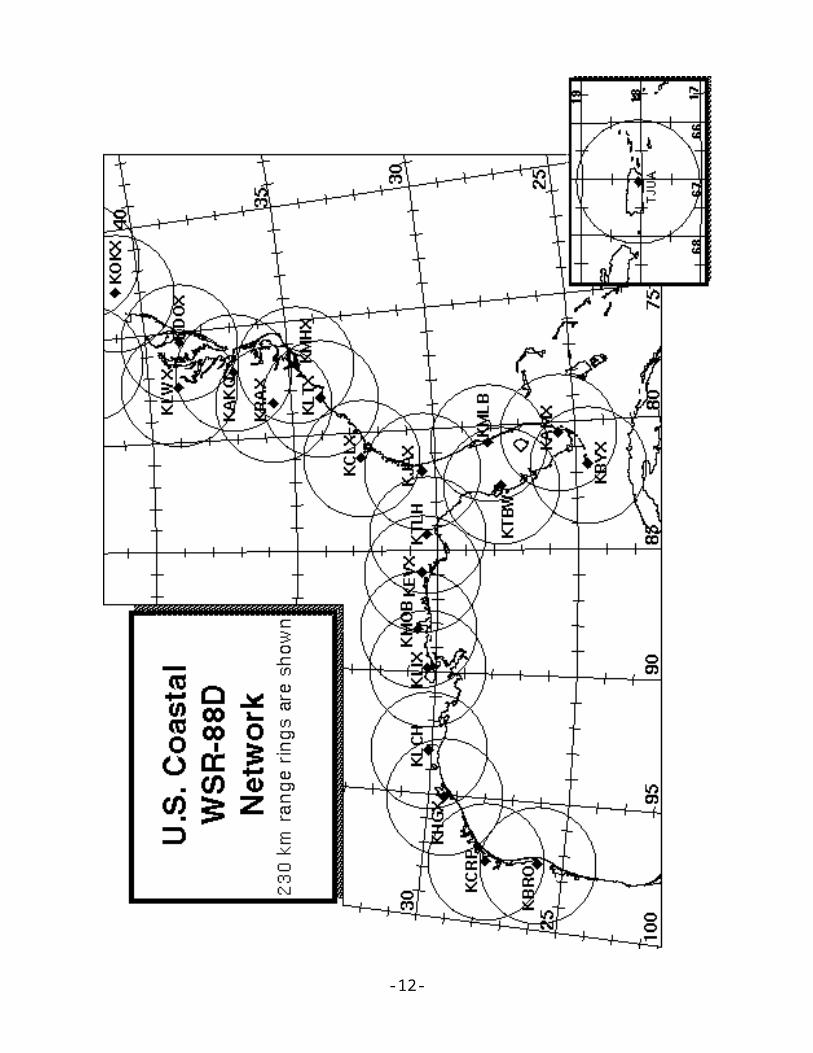
APPENDIX C: DOD/NWS RAWIN/RAOB AND NWS COASTAL LAND-BASED RADARS... 9
APPENDIX D: PRINCIPAL DUTIES OF THE NOAA SCIENTIFIC PERSONNEL………….. 11
APPENDIX E: NOAA RESEARCH OPERATIONAL PROCEDURES AND CHECK LISTS... 15
E.1 “Conditions-of-Flight” Commands…………………………………………………………. 16
E.2 Lead Project Scientist………………………………………………………………………. 17
E.3 Cloud Physics Scientist……………………………………………………………………... 24
E.4 Boundary Layer Scientist…………………………………………………………………… 26
E.5 Radar Scientist……………………………………………………………………………… 29
E.6 Dropsonde Scientist………………………………………………………………………… 32
APPENDIX F: SYSTEMS OF MEASURE AND UNIT CONVERSION FACTORS…………… 35
APPENDIX G: AIRCRAFT SCIENTIFIC INSTRUMENTATION……………………………… 36
APPENDIX H: NOAA EXPENDABLES ..................................................…………………………. 38
APPENDIX I: OPERATIONAL MAPS …………………………………………………………….. 39
Map 1: Primary Atlantic and East Paci f ic operating bases and operating ranges (P-3)……… 39
Map 2: Primary Atlantic and East Paci f ic operating bases and operating ranges (G-IV) …… 40
Map 3: Primary Atlantic and East Paci f ic operating bases and operating ranges (GH) …….. 41
APPENDIX J: FLIGHT PATTERNS……………………………………………………………….. 42
J.1 Patterns from Experiments…………………………………………………………………… 42
P-3 Lawnmower pattern…………………………………………………………………. 42
P-3 Box spiral patterns…………………………………………………………………. 43
P-3 Box spiral patterns………………………………………………………………… 44
P-3 Rotating Figure-4 patterns………………………………………………………… 45
P-3 Rotating Figure-4 patterns………………………………………………………. 46
i
P-3 Butterfly patterns…………………………………………………………………….. 47
P-3 Figure-4 patterns ……………………………………………………………….. 48
G-IV Square spiral (outward) pattern…………………………………………………. 49
G-IV Square spiral (inward) pattern …………………………………………………. 50
G-IV Rotating figure-4 pattern………………………………………………………….. 51
G-IV Butterfly pattern ………………………………………………………………… 52
G-IV Figure-4 pattern ………………………………………………………………… 53
G-IV Surveillance/TDR combination pattern…………………………………………… 54
G-IV Easterly Wave Genesis Experiment – Environmental Survey ………………….. 55
G-IV Easterly Wave Genesis Experiment – AEW Survey …………………………….. 56
G-IV East Pacific Easterly Wave Genesis Experiment–Panama Bight convection ..…. 57
G-IV East Pacific Easterly Wave Genesis Experiment – East Pacific Development ..… 58
East Pacific Easterly Wave Genesis Experiment – Easterly Wave Transition …………. 59
G-IV RAPX pattern (optimal dropsonde)……………………………………………….. 60
G-IV RAPX pattern (optimal radar)……………………………………………………. 61
G-IV TC in Shear “pre-shear” and “large-tilt” outer-core survey………………….. 62
P-3 TC in Shear “pre-shear” core-region survey ………………………………….. 63
P-3 TC in Shear “threshold shear”,“large tilt”,and “realignment/recovery” core region. 64
P-3/G-IV TC in Shear – Extratropical Transition …………………………………….. 65
G-IV Diurnal cycle star pattern………………………………………………………… 66
P-3 Pre- or post-storm Ocean survey patterns………………………………………….. 67
P-3 Pre- or post-storm Ocean survey patterns………………………………………….. 68
P-3 In-storm Ocean survey pattern (over existing drifter array)………………………. 69
Global Hawk Survey Patterns…………………………………………………………. 70
J.2 Patterns from Modules………………………………………………………………………. 71
P-3 DWL SAL module…………………………………………………………………. 71
P-3/Coyote SUAVE eye/eyewall module………………………………………………. 72
P-3/Coyote SUAVE eye/eyewall module (continued)…………………………………. 73
P-3 SUAVE “short-leg” figure-4 ……………………………………………………… 74
P-3/Coyote SUAVE PBL entrainment flux module………………………………. 75
P-3/Coyote SUAVE Boundary Layer inflow module …………………………….. 76
Coyote SUAVE RMW mapping module ………………………………………….. 77
Coyote Eddy dissipation module …………………………………………………… 78
P-3 SFMR-HI module…………………………………………………………………. 79
P-3 Landfall Offshore Wind module ……………………………………………… 80
P-3 Landfall Offshore intense convection module………………………………… 81
P-3 Landfall Coastal survey module…………………………………………………. 82
ii
P-3 Landfall Real-time module………………………………………………………. 83
P-3 Convective burst module…………………………………………………………. 84
P-3 Eye-eyewall mixing module ………………………………………………….. 85
P-3/G-IV SEF/ERC “pre-SEF” module ……………………………………………. 86
P-3/G-IV SEF/ERC “post-SEF” module ………………………………………….. 87
G-IV Warm core (weak system) module ………………………………………… 88
P-3 Hurricane Boundary Layer Stepped Descent module …………………………… 89
P-3/G-IV Arc Cloud Module ……………………………………………………….. 90
P-3 Arc Cloud Module (Multi-level option) ……………………………………….. 91
ACRONYMS AND ABBREVIATIONS……………………………………………………………. 92
iii
2016
Hurricane Field Program Plan
Part II
Appendix ADECISION AND NOTIFICATION PROCESS
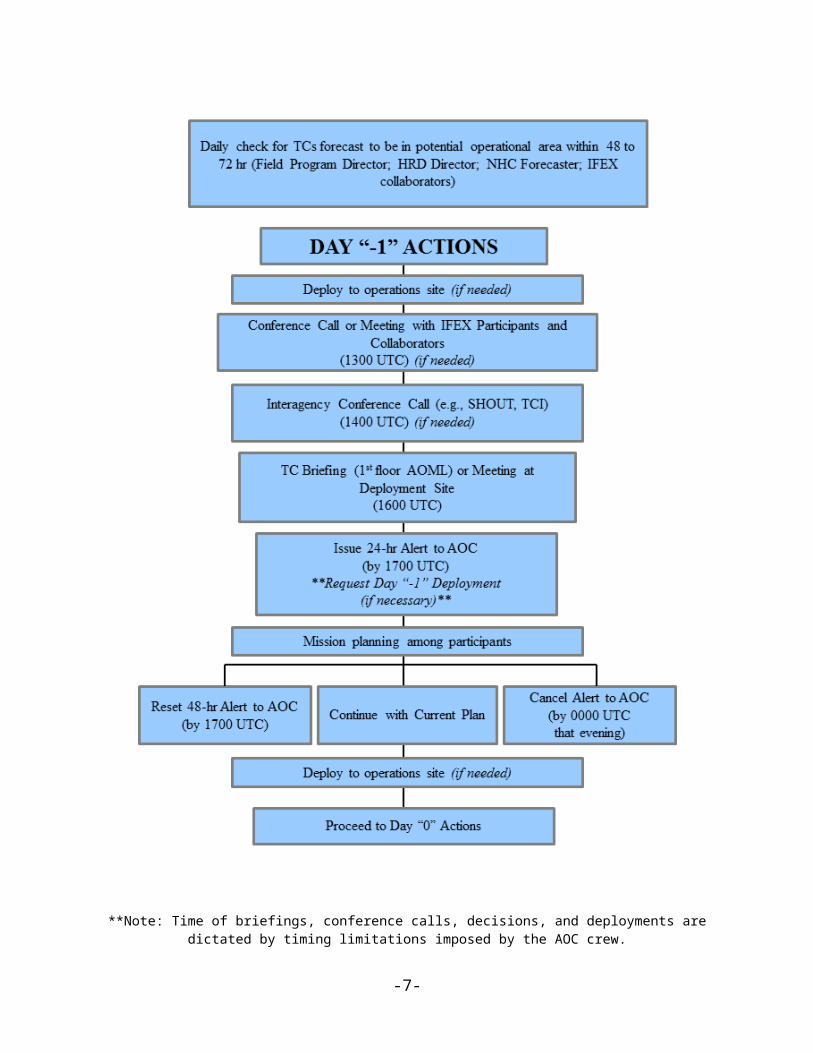
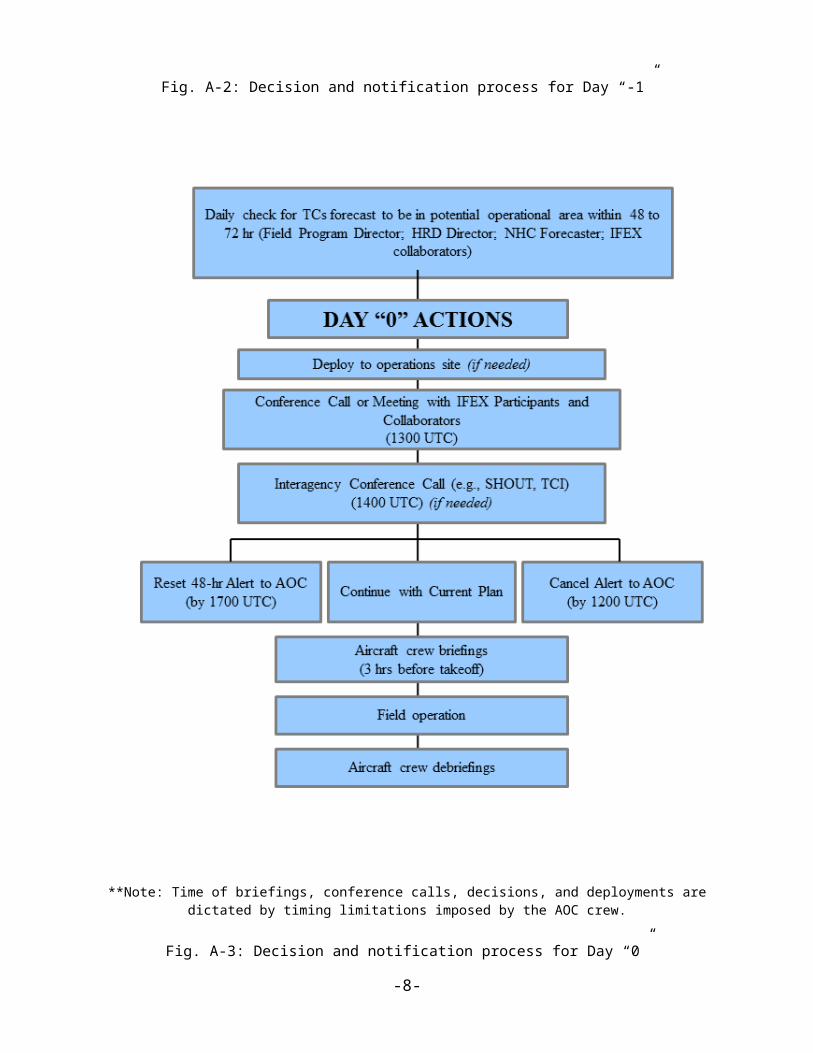
The decision and notification process is illustrated in Figs. A-1, A-2, and A-3. This process occurs in four steps:
1) A research mission is determined to be probable within 72 h [field program director]. Consultation with the director of HRD, and the AOC Project Manager determines: flight platform availability, crew and equipment status, and the type of mission(s) likely to be requested.
2) The Field Program Advisory Panel [F. Marks (Director, HRD), R. Rogers (Director, Hurricane Field Program), J. Dunion, M. Black, J. Cione, J. Gamache, J. Kaplan, P. Reasor, S. Murillo, J. Zhang and J. McFadden (or AOC designee) meets to discuss possible missions and operational modes. Probable mission determination and approval to proceed is given by the HRD director (or designee).
3) Primary personnel are notified by the Hurricane Field Program Director [R. Rogers].
4) Secondary personnel are notified by their primary affiliate (Table A-2).
-4-
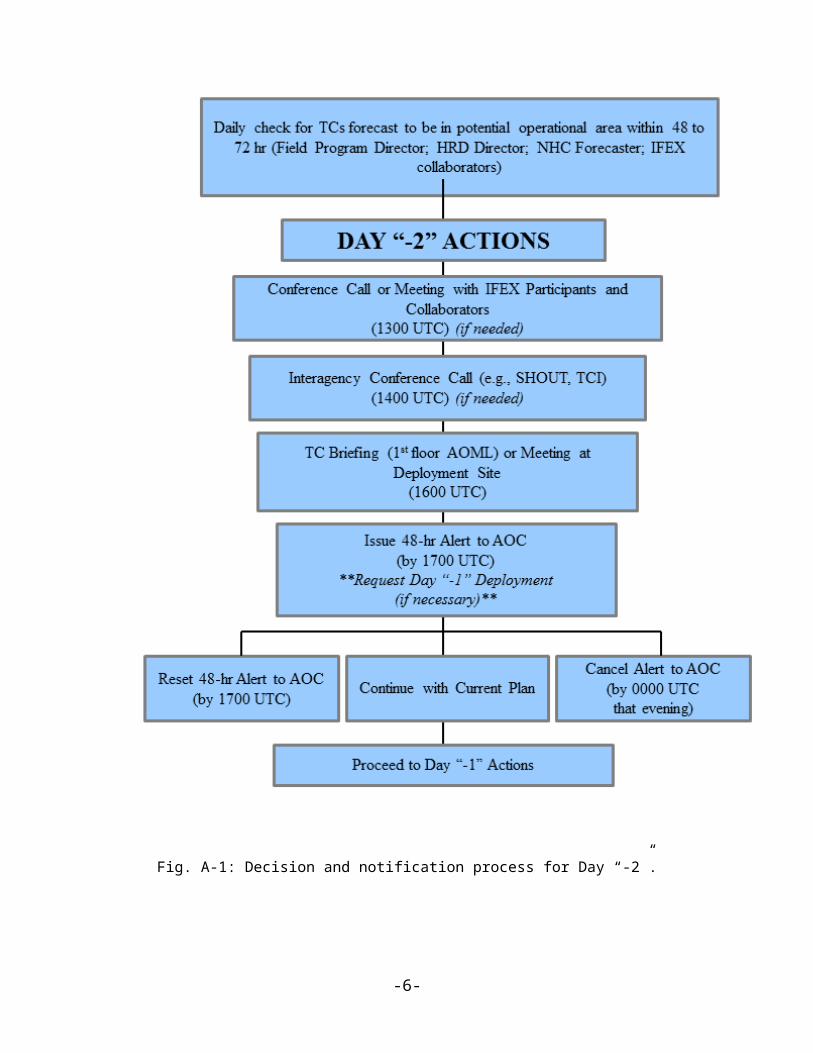
Fig. A-1: Decision and notification process for Day “-2”.
-5-
**Note: Time of briefings, conference calls, decisions, and deployments are dictated by timing limitations imposed by the AOC crew.
Fig. A-2: Decision and notification process for Day “-1”
-6-
**Note: Time of briefings, conference calls, decisions, and deployments are dictated by timing limitations imposed by the AOC crew.
Fig. A-3: Decision and notification process for Day “0”
-7-
Appendix B: Calibration
B.1 En-Route Calibration of Aircraft Systems
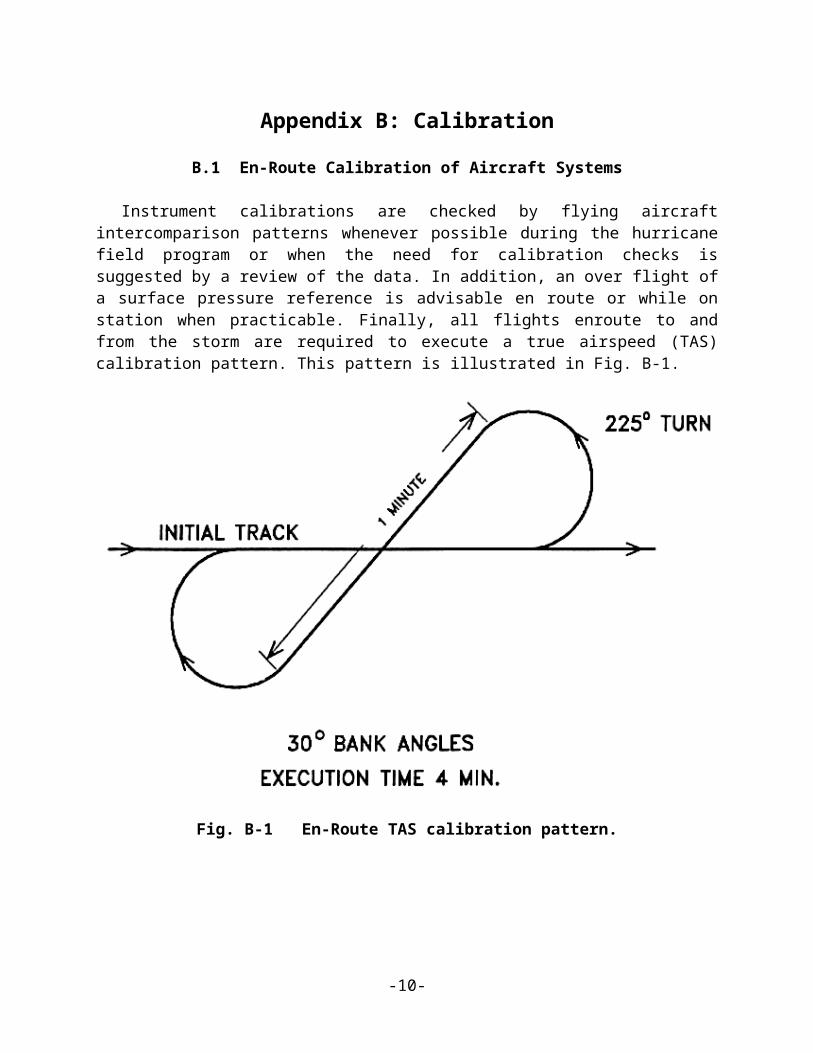
Instrument calibrations are checked by flying aircraft intercomparison patterns whenever possible during the hurricane field program or when the need for calibration checks is suggested by a review of the data. In addition, an over flight of a surface pressure reference is advisable en route or while on station when practicable. Finally, all flights enroute to and from the storm are required to execute a true airspeed (TAS) calibration pattern. This pattern is illustrated in Fig. B-1.
Fig. B-1 En-Route TAS calibration pattern.
-8-

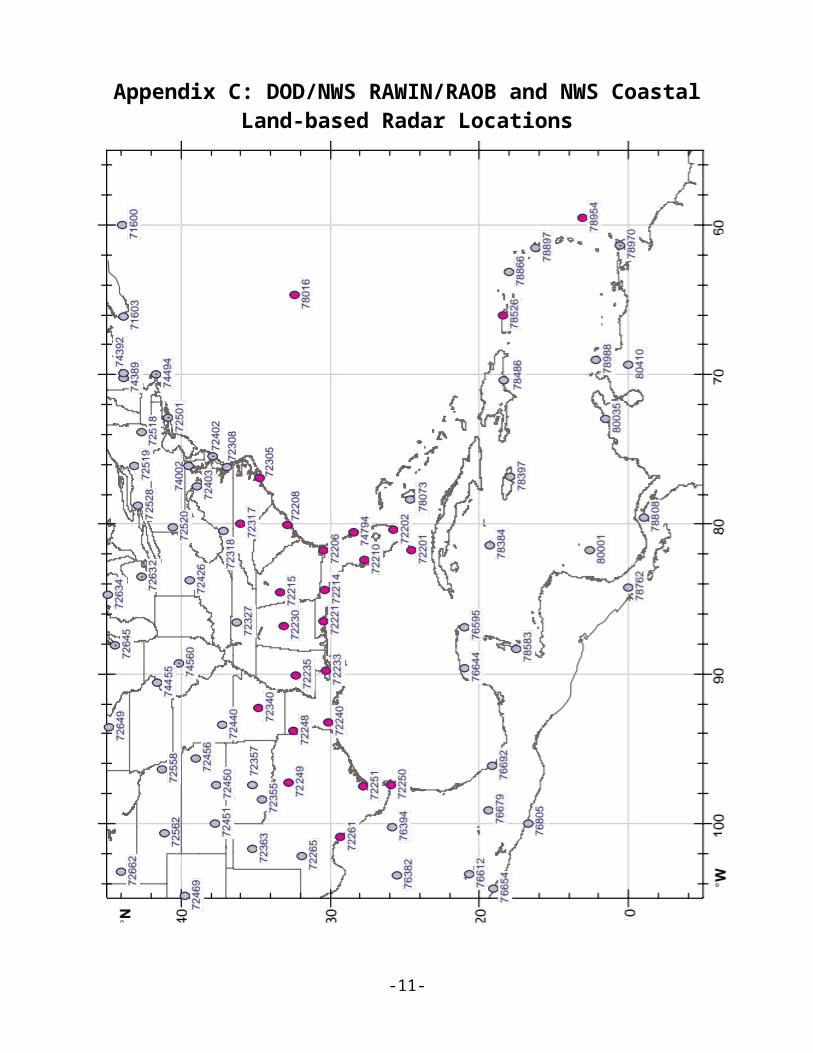
Appendix C: DOD/NWS RAWIN/RAOB and NWS Coastal Land-based Radar Locations
-9-
-10-
APPENDIX D: PRINCIPAL DUTIES OF THE NOAA SCIENTIFIC PERSONNEL
CAUTION
Flight operations are routinely conducted in turbulent conditions. Shock-mounted electronic and experimental racks surround most seat positions. Therefore, for safety onboard the aircraft all personnel should wear a flight suit and closed toed shoes. For comfort, personnel should bring a jacket or sweater, as the cabin gets cold during flight.
Smoking is prohibited within 50 ft of the aircraft while they are on the ground. No smoking is permitted on the aircraft at any time.
Section 4-401, of the NOAA Safety Rules Manual state that: “Don’t let your attention wander, either through constant conversation, use of cell phone or sightseeing while operating vehicles. Drivers must use caution and common sense under all conditions. Operators and passengers are not permitted to smoke or eat in the government vehicles. Cell phone use is permitted while car is parked.”
GENERAL INFORMATION FOR ALL SCIENTIFIC MISSION PARTICIPANTS
Mission participants are advised to carry the proper personal identification [i.e., travel orders, "shot" records (when appropriate), and passports (when required)]. Passports will be checked by AOC personnel prior to deployment to countries requiring it. All participants must provide their own meals for in-flight consumption. AOC provides a refrigerator, microwave, coffee, utensils, condiments, ice, water, and soft drinks for a nominal fee per flight.
D.1 Field Program Director/ IFEX Chief Scientist;
(1) Responsible to the HRD director for the implementation of the Hurricane Field Program Plan.
(2) Only official communication link to AOC. Communicates flight requirements and changes in mission to AOC.
(3) Only formal communication link between AOML and CARCAH during operations. Coordinates scheduling of each day's operations with AOC only after all (POD) reconnaissance requirements are completed between CARCAH and AOC.
(4) Convenes the Hurricane Field Program Operations Advisory Panel. This panel selects missions to be flown.
(5) Provides for pre-mission briefing of flight crews, scientists, and others (as required).
(6) Assigns duties of field project scientific personnel. Ensures safety during the field program.
-11-
(7) Coordinates press statements with NOAA/Public Affairs.
D.2 Assistant Field Program Director
(1) Assumes the duties of the field program director in their absence.
D.3 Named Experiment Lead Project Scientist
(1) Has overall responsibility for the experiment.
(2) Coordinates the project and sub-project requirements.
(3) Determines the primary modes of operation for appropriate instrumentation.
(4) Assists in the selection of the mission.
(5) Provides a written summary of the mission to the field program director (or his designee) at the experiment's debriefing.
D.4 Lead Project Scientist
(1) Has overall scientific responsibility for his/her aircraft.
(2) Makes in-flight decisions concerning alterations of: (a) specified flight patterns; (b) instrumentation operation; and (c) assignment of duties to on-board scientific project personnel.
(3) Acts as project supervisor on the aircraft and is the focal point for all interactions of project personnel with operational or visiting personnel.
(4) Conducts preflight and post flight briefings of the entire crew. Completes formal checklists of safety, instrument operations - noting malfunctions, problems, etc.
(5) Provides a written report of each mission day's operations to the field program director at the mission debriefing.
D.5 Cloud Physics Scientist
(1) Has overall responsibility for the cloud physics project on the aircraft.
(2) Briefs the on-board lead project scientist on equipment status before takeoff.
(3) Determines the operational mode of the cloud physics sensors (i.e., where, when, and at what rate to sample).
(4) Operates and monitors the cloud physics sensors and data systems.
(5) Provides a written preflight and post flight status report and flight summary of each mission day's operations to the on-board lead project scientist at the post flight debriefing.
-12-
D.6 Boundary-Layer Scientist
(1) Insures that the required number of AXCPs, AXBTs, and AXCTDs are on the aircraft for each mission.
(2) Operates the AXCP, AXBT, and AXCTD equipment (as required) on the aircraft.
(3) Briefs the on-board lead project scientist on equipment status before takeoff.
(4) Determines where and when to release the AXCPs, AXBTs, and AXCTDs (as appropriate) subject to clearance by flight crew.
(5) Performs preflight, inflight, and post flight checks and calibrations.
(6) Provides a written preflight and post flight status report and a flight summary of each mission day's operations to the on-board lead project scientist at the post flight debriefing.
D.7 Radar Scientist
(1) Determines optimum meteorological target displays. Continuously monitors displays for performance and optimum mode of operations. Thoroughly documents modes and characteristics of the operations.
(2) Provides a summary of the radar display characteristics to the on-board lead project scientist at the post flight debriefing.
(3) Maintains tape logs.
(4) During the ferry to the storm, the radar scientist should record a tape of the sea return on either side of the aircraft at elevation angles varying from -20° through +20°. This tape will allow correction of any antenna mounting biases or elevation angle corrections.
D.8 Dropsonde Scientist
(1) Processes dropsondes observations on HRD workstation for accuracy.
(2) Provides TEMP drop message for ASDL, transmission or insures correct code in case of automatic data transmission.
D.9 Workstation Scientist
(1) Operates HRD's workstation.
(2) Runs programs that determine wind center and radar center as a function of time, composite flight-level and radar reflectivity relative to storm center and then process and code dropwindsonde observations.
-13-
(3) Checks data for accuracy and sends appropriate data to ASDL computer.
(4) Maintains records of the performance of the workstation and possible software improvements.
-14-
APPENDIX E: NOAA RESEARCH OPERATIONAL PROCEDURES AND CHECK LISTS
Hurricane Field Program Deployment Safety Checklist
The Field Program Director is responsible for making sure safety is enforced and ensuring necessary materials are in place and/or any actions have been completed before the start of the HFP. Field program participants are responsible for reviewing this checklist.
Scientist_______________________________ Date ______________
Before leaving AOML
_____ 1. Contact the HRD Field Program Director personnel to notify departure time._____ 2. Things to take
a. Flight bag (s)b. Cell phonec. List of HFP important numbersd. HRD Field program plane. Flight suit
Ground transportation
_____ 1. Arrange for ground transportation
_____ 2. Visual inspection of government vehiclea. Make sure tires do not appear to be flatb. Check for any cracked/broken lights, windshield and mirrorsc. Check for any major dents around the vehicle
_____ 3. Inspection inside the government vehiclea. Check all lights work properly (head and tail lights, dome lights, dashboard and
turn signal lights)b. Make sure the engine, oil, or temperature indicator light does not flash. If so,
contact facilities management.c. Note the gas and mileage
_____ 4. Contents inside the government vehiclea. Make sure there is first aid kit and fire extinguisherb. Proper jack and lug wrenchc. Spare tired. Basic auto repair kit (i.e. road hazard reflector or flares)e. Consider carrying a flashlight
_____ 5. If possible, return vehicle with full tank (regular unleaded gasoline)
_____ 6. Contact the HRD Field Program Director personnel upon returning
-15-
E.1 "Conditions-of-Flight" Commands
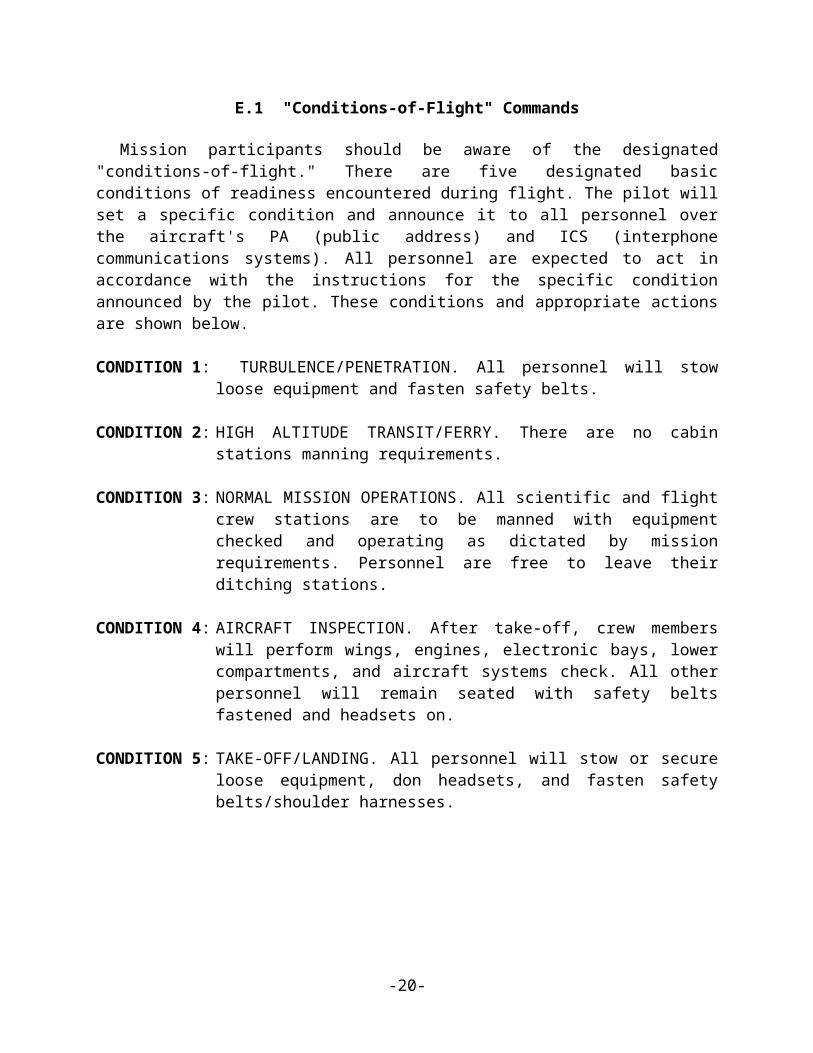
Mission participants should be aware of the designated "conditions-of-flight." There are five designated basic conditions of readiness encountered during flight. The pilot will set a specific condition and announce it to all personnel over the aircraft's PA (public address) and ICS (interphone communications systems). All personnel are expected to act in accordance with the instructions for the specific condition announced by the pilot. These conditions and appropriate actions are shown below.
CONDITION 1: TURBULENCE/PENETRATION. All personnel will stow loose equipment and fasten safety belts.
CONDITION 2: HIGH ALTITUDE TRANSIT/FERRY. There are no cabin stations manning requirements.
CONDITION 3: NORMAL MISSION OPERATIONS. All scientific and flight crew stations are to be manned with equipment checked and operating as dictated by mission requirements. Personnel are free to leave their ditching stations.
CONDITION 4: AIRCRAFT INSPECTION. After take-off, crew members will perform wings, engines, electronic bays, lower compartments, and aircraft systems check. All other personnel will remain seated with safety belts fastened and headsets on.
CONDITION 5: TAKE-OFF/LANDING. All personnel will stow or secure loose equipment, don headsets, and fasten safety belts/shoulder harnesses.
-16-
E.2 Lead Project Scientist
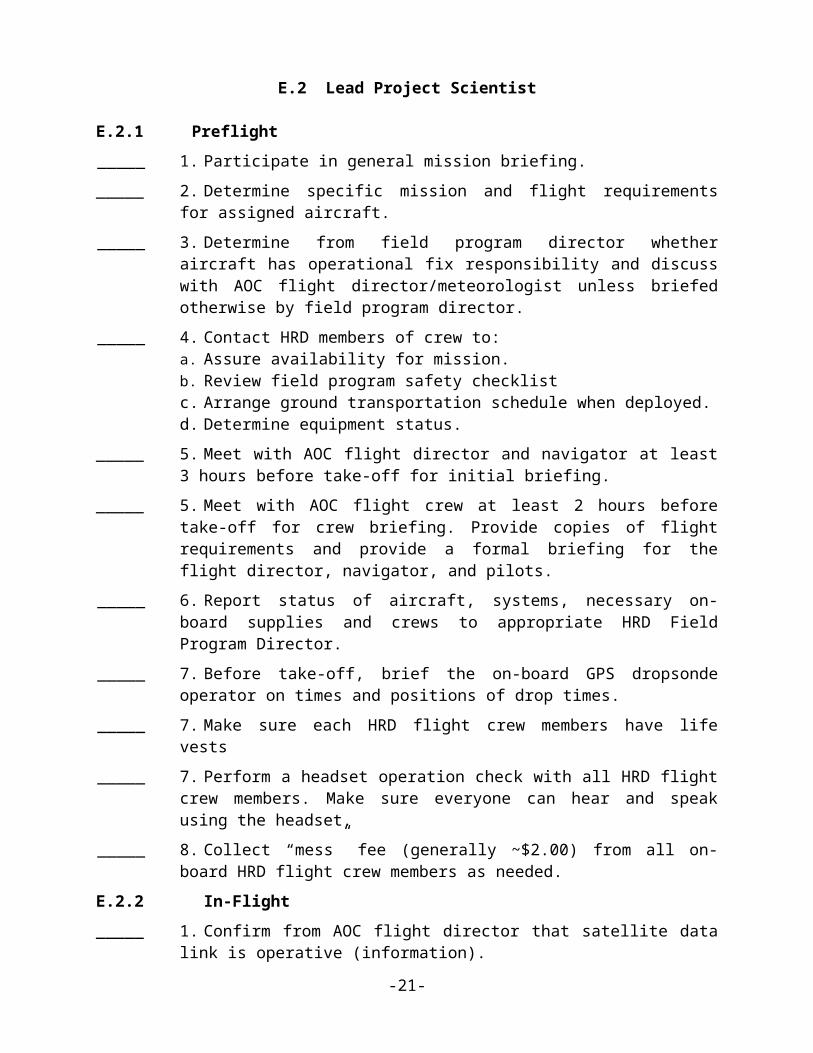
E.2.1 Preflight
_____ 1. Participate in general mission briefing.
_____ 2. Determine specific mission and flight requirements for assigned aircraft.
_____ 3. Determine from field program director whether aircraft has operational fix responsibility and discuss with AOC flight director/meteorologist unless briefed otherwise by field program director.
_____ 4. Contact HRD members of crew to:a. Assure availability for mission.b. Review field program safety checklistc. Arrange ground transportation schedule when deployed.d. Determine equipment status.
_____ 5. Meet with AOC flight director and navigator at least 3 hours before take-off for initial briefing.
_____ 5. Meet with AOC flight crew at least 2 hours before take-off for crew briefing. Provide copies of flight requirements and provide a formal briefing for the flight director, navigator, and pilots.
_____ 6. Report status of aircraft, systems, necessary on-board supplies and crews to appropriate HRD Field Program Director.
_____ 7. Before take-off, brief the on-board GPS dropsonde operator on times and positions of drop times.
_____ 7. Make sure each HRD flight crew members have life vests
_____ 7. Perform a headset operation check with all HRD flight crew members. Make sure everyone can hear and speak using the headset.
_____ 8. Collect “mess” fee (generally ~$2.00) from all on-board HRD flight crew members as needed.
E.2.2 In-Flight
_____ 1. Confirm from AOC flight director that satellite data link is operative (information).
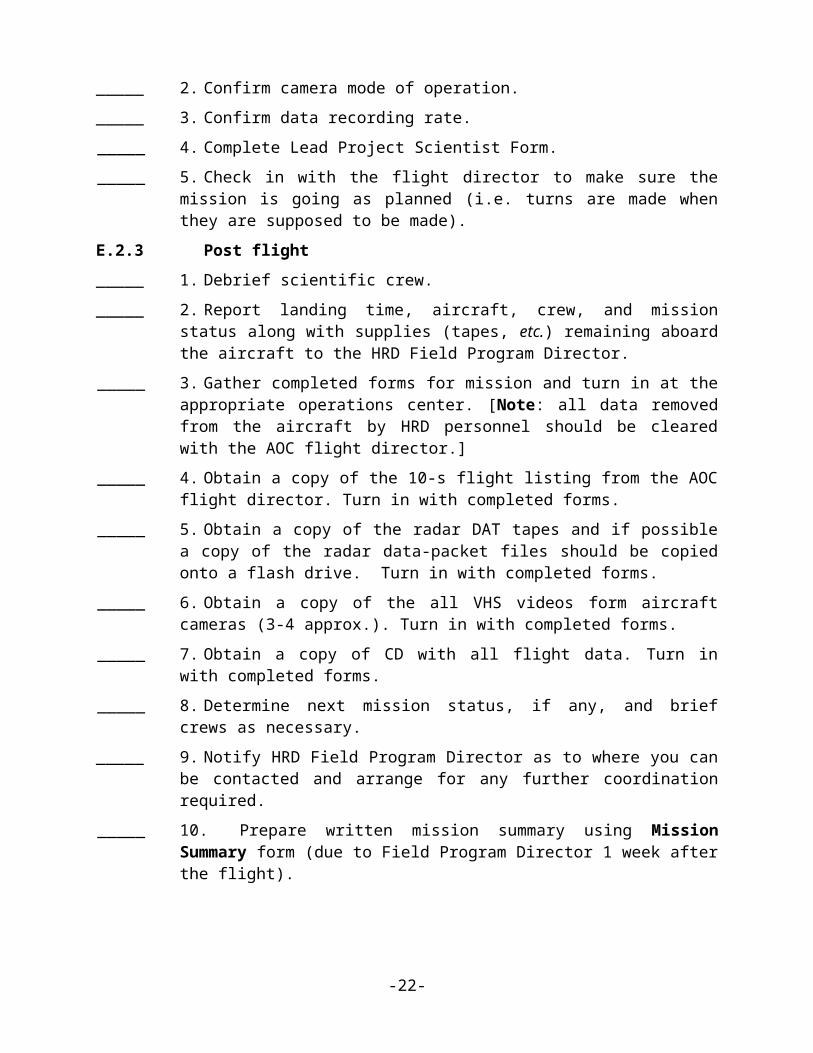
_____ 2. Confirm camera mode of operation.
_____ 3. Confirm data recording rate.
_____ 4. Complete Lead Project Scientist Form.
_____ 5. Check in with the flight director to make sure the mission is going as planned (i.e. turns are made when they are supposed to be made).
E.2.3 Post flight
_____ 1. Debrief scientific crew.
_____ 2. Report landing time, aircraft, crew, and mission status along with supplies (tapes, etc.) remaining aboard the aircraft to the HRD Field Program Director.
-17-
_____ 3. Gather completed forms for mission and turn in at the appropriate operations center. [Note: all data removed from the aircraft by HRD personnel should be cleared with the AOC flight director.]
_____ 4. Obtain a copy of the 10-s flight listing from the AOC flight director. Turn in with completed forms.
_____ 5. Obtain a copy of the radar DAT tapes and if possible a copy of the radar data-packet files should be copied onto a flash drive. Turn in with completed forms.
_____ 6. Obtain a copy of the all VHS videos form aircraft cameras (3-4 approx.). Turn in with completed forms.
_____ 7. Obtain a copy of CD with all flight data. Turn in with completed forms.
_____ 8. Determine next mission status, if any, and brief crews as necessary.
_____ 9. Notify HRD Field Program Director as to where you can be contacted and arrange for any further coordination required.
_____ 10. Prepare written mission summary using Mission Summary form (due to Field Program Director 1 week after the flight).
-18-
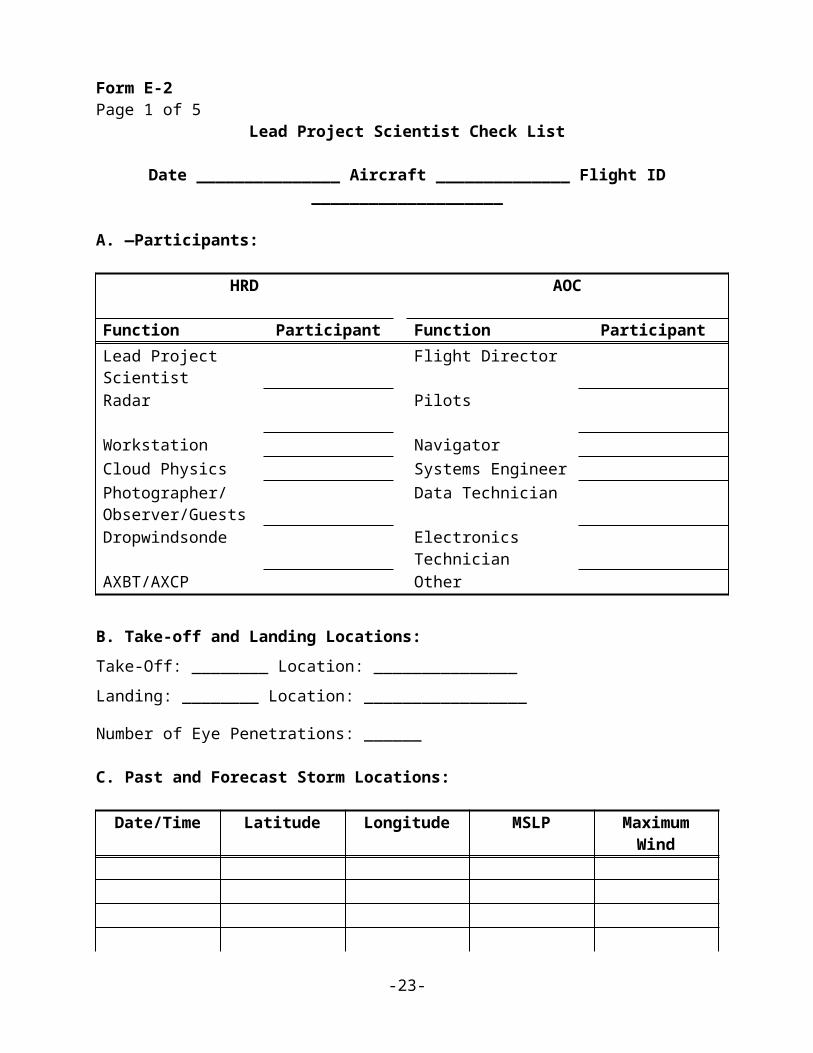
Form E-2Page 1 of 5
Lead Project Scientist Check List
Date _______________ Aircraft ______________ Flight ID ____________________
A. —Participants:
HRD AOC
Function Participant Function ParticipantLead Project Scientist Flight DirectorRadar Pilots
Workstation NavigatorCloud Physics Systems EngineerPhotographer/Observer/Guests
Data Technician
Dropwindsonde Electronics TechnicianAXBT/AXCP Other
B. Take-off and Landing Locations:
Take-Off: ________ Location: _______________
Landing: ________ Location: _________________
Number of Eye Penetrations: ______
C. Past and Forecast Storm Locations:
Date/Time Latitude Longitude MSLP Maximum Wind
D. Mission Briefing:
-19-
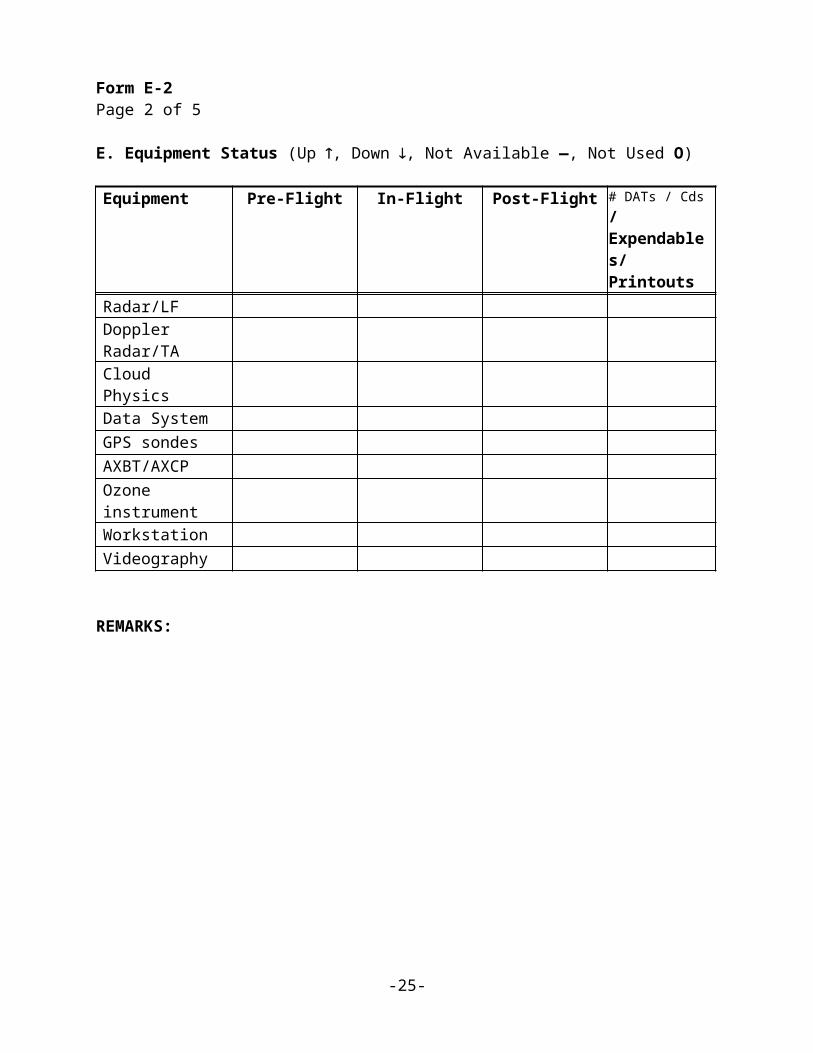
Form E-2Page 2 of 5
E. Equipment Status (Up , Down , Not Available —, Not Used O)
Equipment Pre-Flight In-Flight Post-Flight # DATs / Cds/Expendables/Printouts
Radar/LFDoppler Radar/TACloud PhysicsData SystemGPS sondesAXBT/AXCPOzone instrumentWorkstationVideography
REMARKS:
-20-
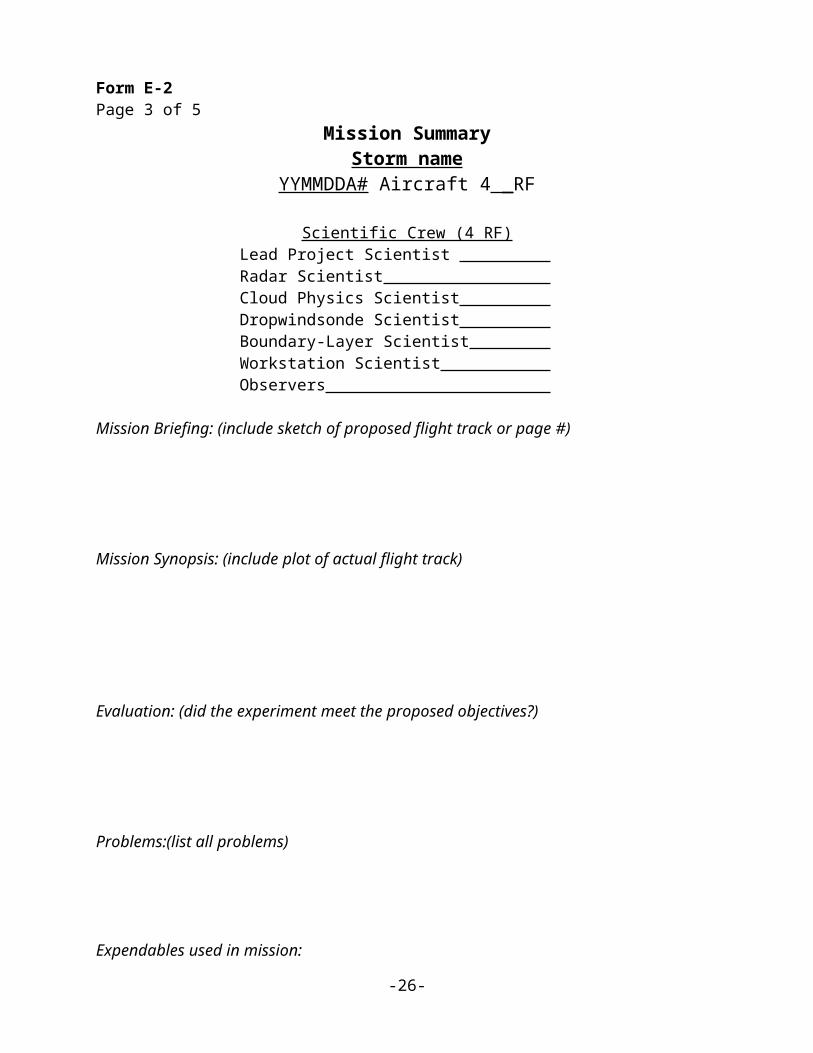
Form E-2Page 3 of 5
Mission SummaryStorm name
YYMMDDA# Aircraft 4 _RF
Scientific Crew (4 RF)Lead Project Scientist Radar Scientist Cloud Physics Scientist Dropwindsonde Scientist Boundary-Layer Scientist Workstation Scientist Observers
Mission Briefing: (include sketch of proposed flight track or page #)
Mission Synopsis: (include plot of actual flight track)
Evaluation: (did the experiment meet the proposed objectives?)
Problems:(list all problems)
Expendables used in mission:GPS sondes : ________________AXBTs :__________________
-21-
Sonobuoys: _________________
-22-
Form E-2Page 5 of 5
Lead Project Scientist Event Log
Date ________________ Flight ________________ LPS _____________________
Time Event Position Comments
-23-

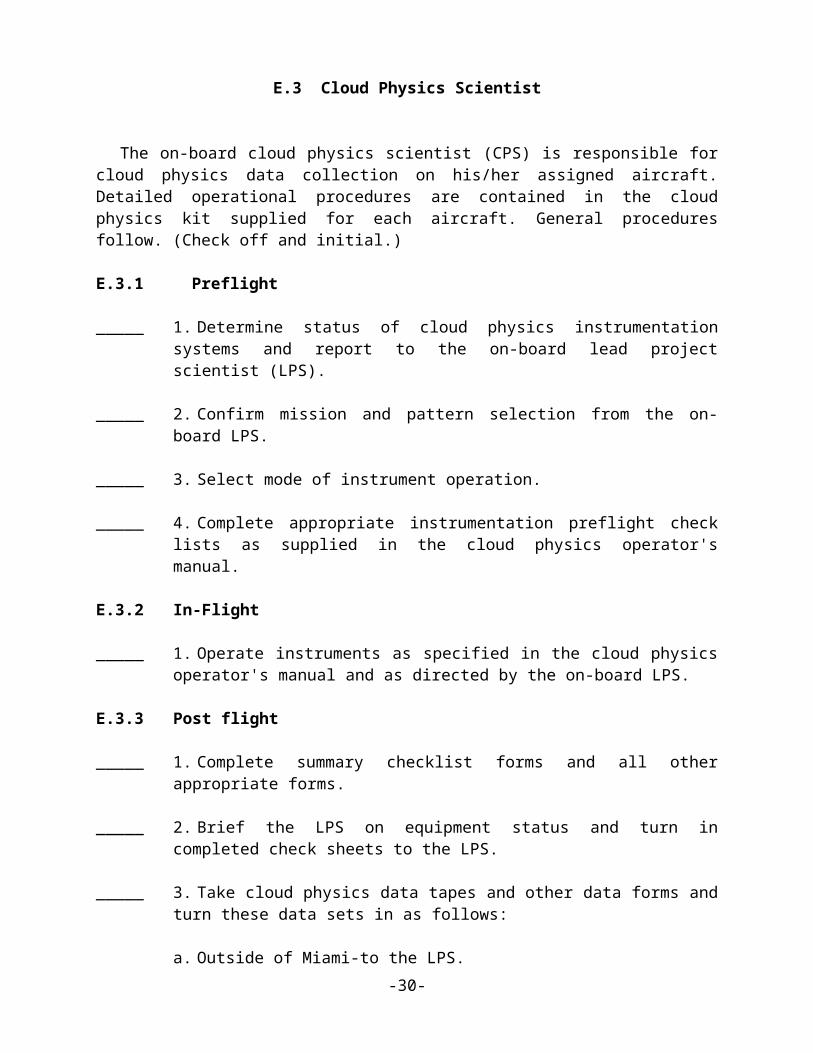
E.3Cloud Physics Scientist
The on-board cloud physics scientist (CPS) is responsible for cloud physics data collection on his/her assigned aircraft. Detailed operational procedures are contained in the cloud physics kit supplied for each aircraft. General procedures follow. (Check off and initial.)
E.3.1 Preflight
_____ 1. Determine status of cloud physics instrumentation systems and report to the on-board lead project scientist (LPS).
_____ 2. Confirm mission and pattern selection from the on-board LPS.
_____ 3. Select mode of instrument operation.
_____ 4. Complete appropriate instrumentation preflight check lists as supplied in the cloud physics operator's manual.
E.3.2 In-Flight
_____ 1. Operate instruments as specified in the cloud physics operator's manual and as directed by the on-board LPS.
E.3.3 Post flight
_____ 1. Complete summary checklist forms and all other appropriate forms.
_____ 2. Brief the LPS on equipment status and turn in completed check sheets to the LPS.
_____ 3. Take cloud physics data tapes and other data forms and turn these data sets in as follows:
a. Outside of Miami-to the LPS.b. In Miami-to AOML/HRD. [Note: all data removed from the aircraft by HRD personnel should be cleared with the AOC flight director.]
_____ 4. Debrief as necessary at HRD Field Program Director or the hotel during a deployment.
_____ 5. Determine the status of future missions and notify HRD Field Program Director as to where you can be contacted.
-24-
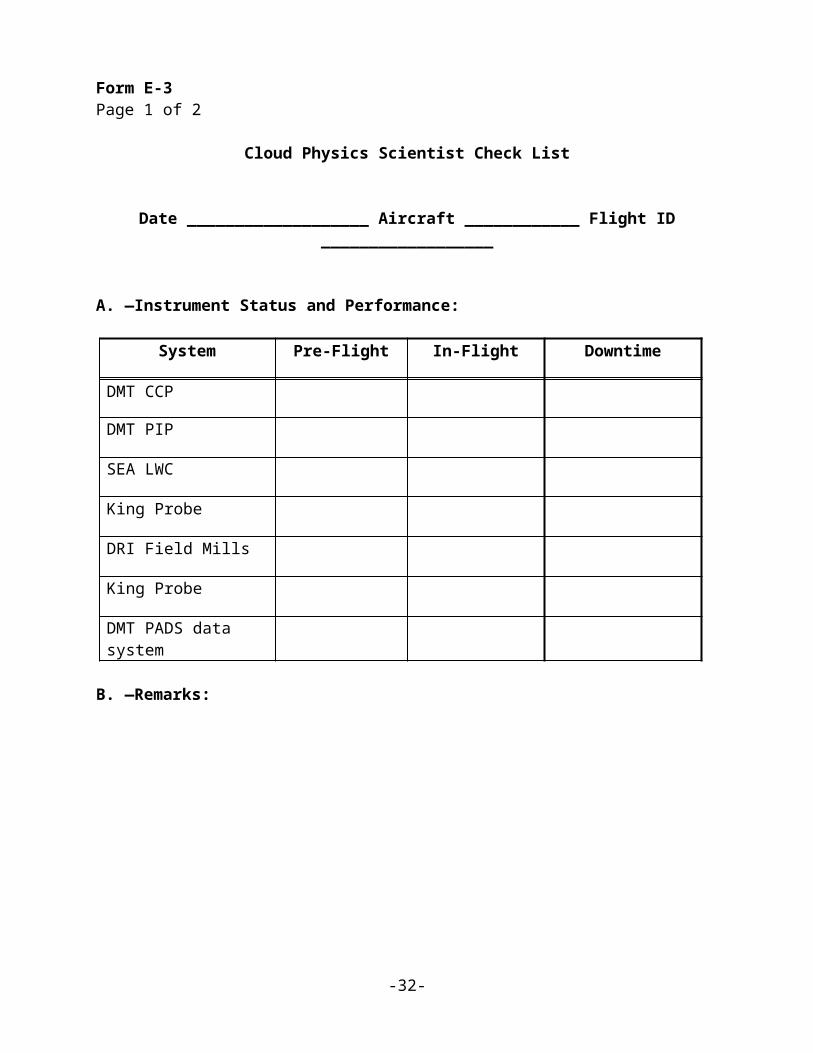
Form E-3Page 1 of 2
Cloud Physics Scientist Check List
Date ___________________ Aircraft ____________ Flight ID __________________
A. —Instrument Status and Performance:
System Pre-Flight In-Flight Downtime
DMT CCP
DMT PIP
SEA LWC
King Probe
DRI Field Mills
King Probe
DMT PADS data system
B. —Remarks:
-25-
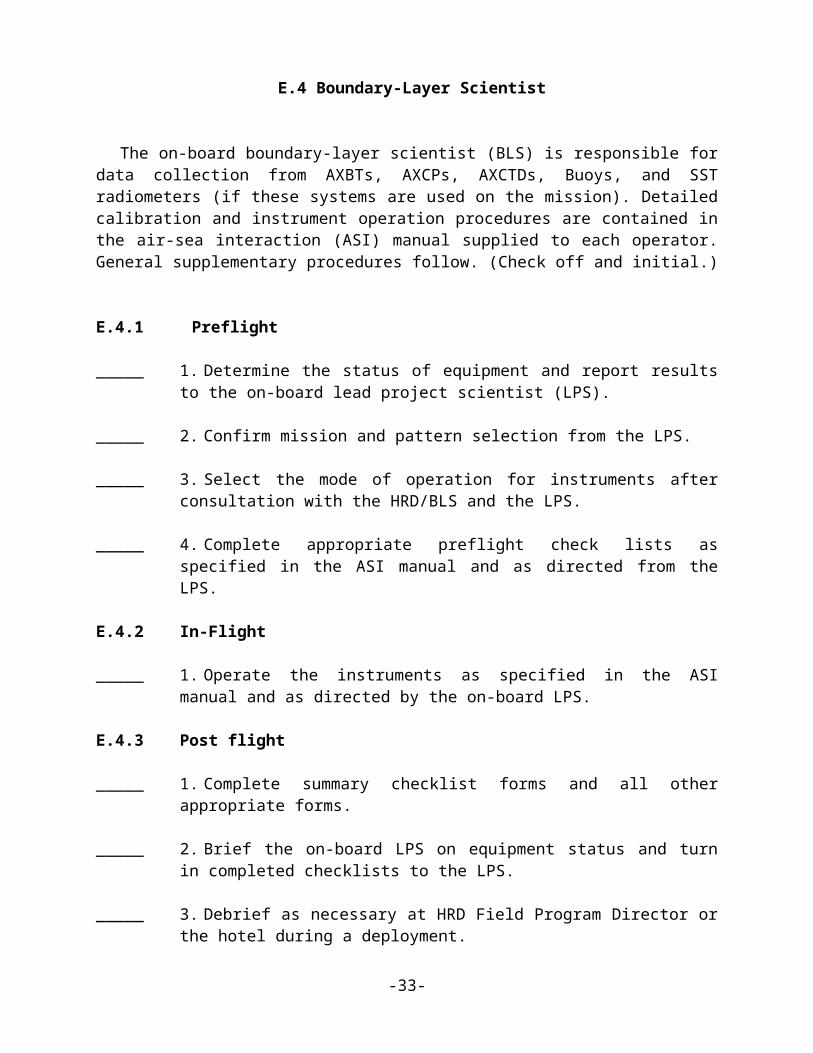
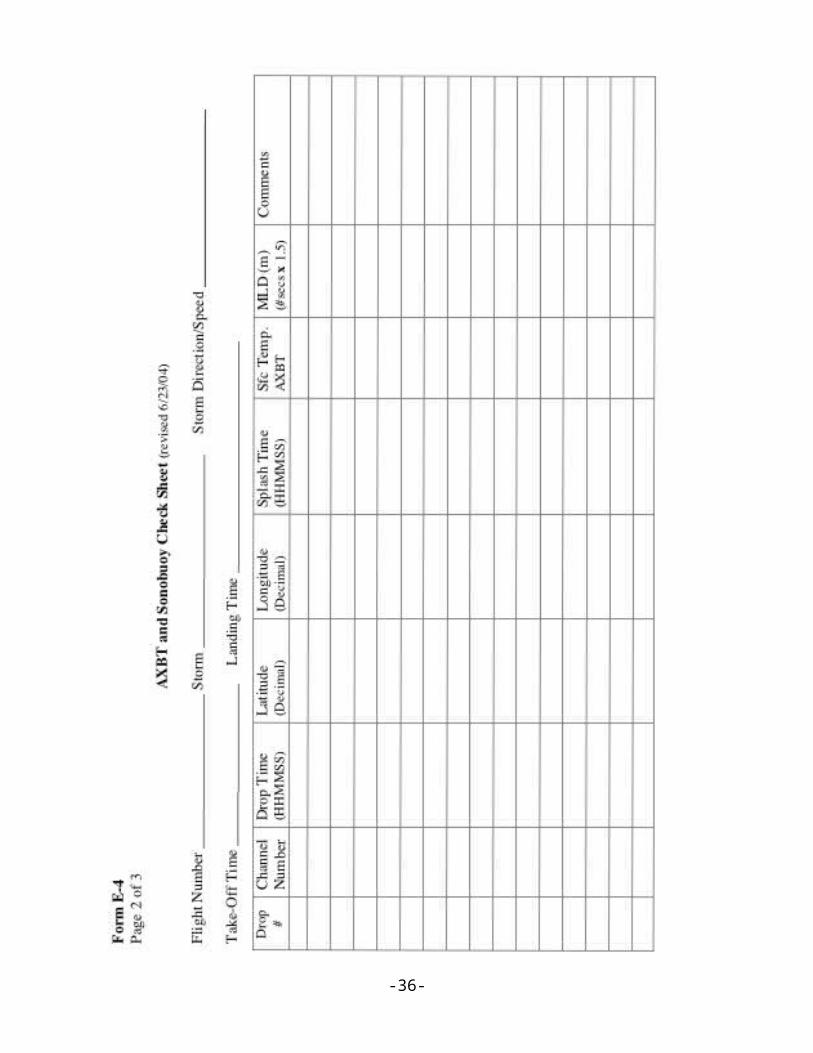
E.4 Boundary-Layer Scientist
The on-board boundary-layer scientist (BLS) is responsible for data collection from AXBTs, AXCPs, AXCTDs, Buoys, and SST radiometers (if these systems are used on the mission). Detailed calibration and instrument operation procedures are contained in the air-sea interaction (ASI) manual supplied to each operator. General supplementary procedures follow. (Check off and initial.)
E.4.1 Preflight
_____ 1. Determine the status of equipment and report results to the on-board lead project scientist (LPS).
_____ 2. Confirm mission and pattern selection from the LPS.
_____ 3. Select the mode of operation for instruments after consultation with the HRD/BLS and the LPS.
_____ 4. Complete appropriate preflight check lists as specified in the ASI manual and as directed from the LPS.
E.4.2 In-Flight
_____ 1. Operate the instruments as specified in the ASI manual and as directed by the on-board LPS.
E.4.3 Post flight
_____ 1. Complete summary checklist forms and all other appropriate forms.
_____ 2. Brief the on-board LPS on equipment status and turn in completed checklists to the LPS.
_____ 3. Debrief as necessary at HRD Field Program Director or the hotel during a deployment.
_____ 4. Determine the status of future missions and notify HRD Field Program Director as to where you can be contacted.
-26-

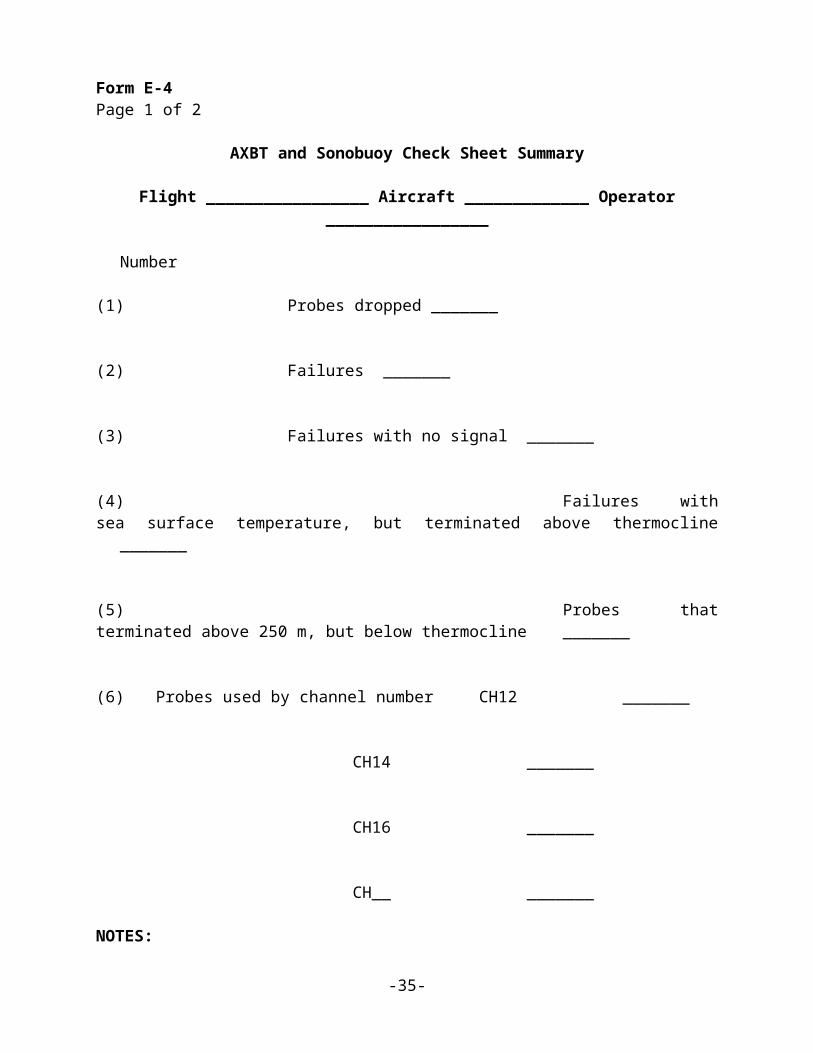
Form E-4Page 1 of 2
AXBT and Sonobuoy Check Sheet Summary
Flight _________________ Aircraft _____________ Operator _________________
Number
(1) Probes dropped _______
(2) Failures _______
(3) Failures with no signal _______
(4) Failures with sea surface temperature, but terminated above thermocline _______
(5) Probes that terminated above 250 m, but below thermocline _______
(6) Probes used by channel number CH12 _______
CH14 _______
CH16 _______
CH__ _______
NOTES:
-27-
-28-

E.5Radar Scientist
The on-board radar scientist is responsible for data collection from all radar systems on his/her assigned aircraft. Detailed operational procedures and checklists are contained in the operator's manual supplied to each operator. General supplementary procedures follow. (Check off and initial.)
E.5.1 Preflight
_____ 1. Determine the status of equipment and report results to the lead project scientist (LPS).
_____ 2. Confirm mission and pattern selection from the LPS.
_____ 3. Select the operational mode for radar system(s) after consultation with the LPS.
_____ 4. Complete the appropriate preflight calibrations and check lists as specified in the radar operator's manual.
E.5.2 In-Flight
_____ 1. Operate the system(s) as specified in the operator's manual and as directed by the LPS or as required for aircraft safety as determined by the AOC flight director or aircraft commander.
_____ 2. Maintain a written commentary in the radar logbook of tape and event times, such as the start and end times of F/AST legs. Also document any equipment problems or changes in R/T, INE, or signal status.
E.5.3 Post flight
_____ 1. Complete the summary checklists and all other appropriate check lists and forms.
_____ 2. Brief the LPS on equipment status and turn in completed forms to the LPS.
_____ 3. Hand-carry all radar tapes and arrange delivery as follows:
a. Outside of Miami-to the LPS.b. In Miami-to AOML/HRD. [Note: all data removed from the aircraft by HRD
personnel should be cleared with the AOC flight director.]
_____ 4. Debrief at AOML/HRD or the hotel during a deployment.
_____ 5. Determine the status of future missions and notify HRD Field Program Director as to where you can be contacted.
-29-
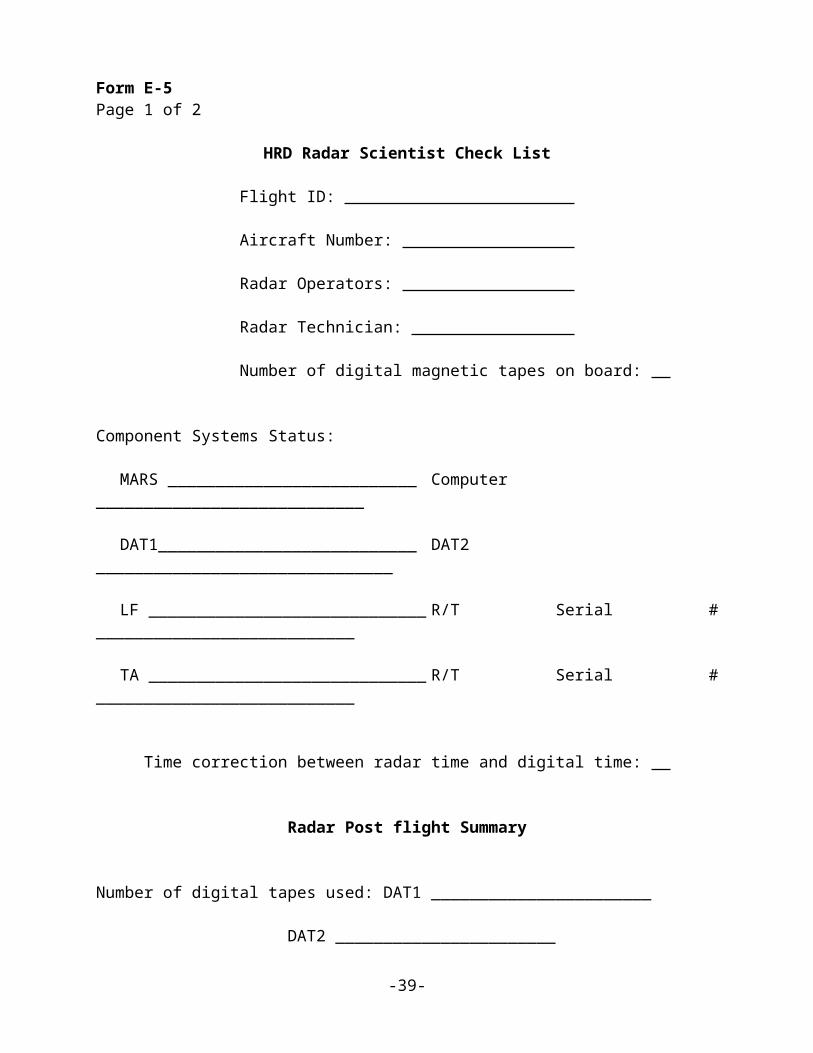
Form E-5Page 1 of 2
HRD Radar Scientist Check List
Flight ID:
Aircraft Number:
Radar Operators:
Radar Technician:
Number of digital magnetic tapes on board:
Component Systems Status:
MARS __________________________ Computer ____________________________
DAT1___________________________ DAT2 _______________________________
LF _____________________________ R/T Serial # ___________________________
TA _____________________________ R/T Serial # ___________________________
Time correction between radar time and digital time:
Radar Post flight Summary
Number of digital tapes used: DAT1 _______________________
DAT2 _______________________
Significant down time:
DAT1 ______________________ Radar LF ____________________
DAT2 ______________________ Radar TA ____________________
Other Problems:
-30-
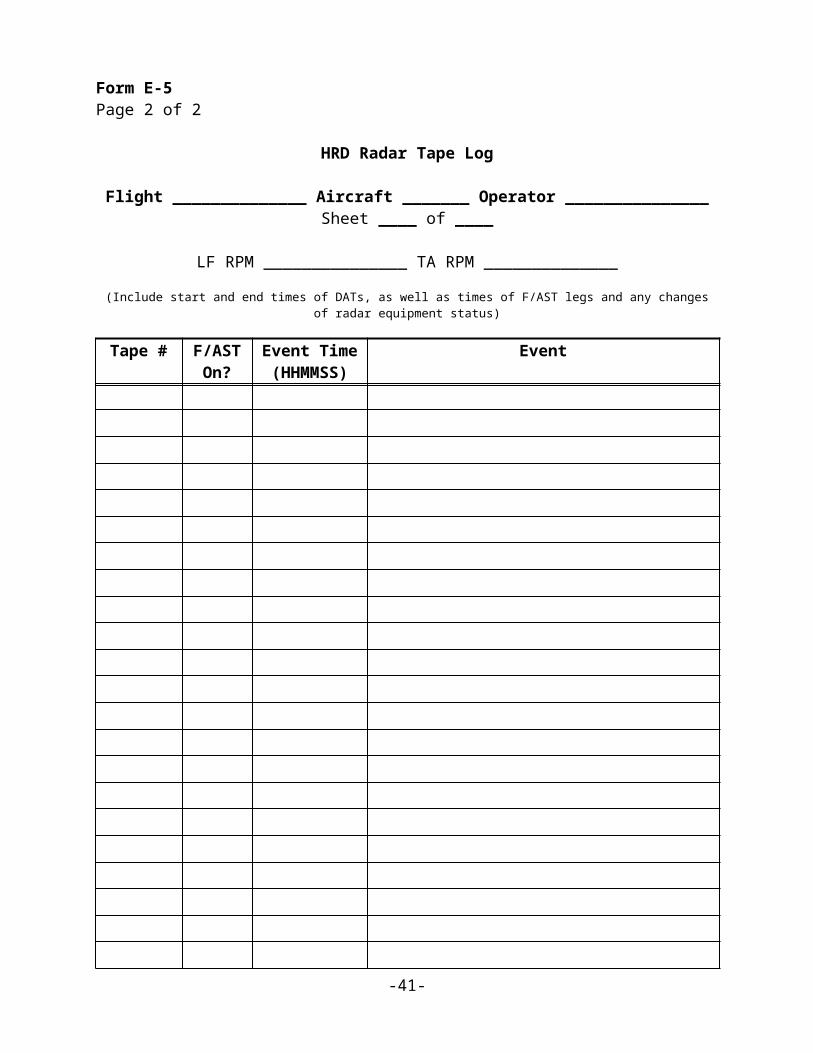
Form E-5Page 2 of 2
HRD Radar Tape Log
Flight ______________ Aircraft _______ Operator _______________ Sheet ____ of ____
LF RPM _______________ TA RPM ______________
(Include start and end times of DATs, as well as times of F/AST legs and any changes of radar equipment status)
Tape # F/ASTOn?
Event Time(HHMMSS)
Event
Item List: DAT1, DAT2, COMP, MARS, LF, and TA.Include serial numbers of any new R/Ts.
-31-
E.6 Dropsonde Scientist
The lead project scientist (LPS) on each aircraft is responsible for determining the distribution patterns for dropwindsonde releases. Predetermined desired data collection patterns are illustrated on the flight patterns. However, these patterns often are required to be altered because of clearance problems, etc. Operational procedures are contained in the operator's manual. The following list contains more general supplementary procedures to be followed. (Check off and initial.)
E.6.1 Preflight
_____ 1. Determine the status of the AVAPS and HAPS. Report results to the LPS.
_____ 2. Confirm the mission and pattern selection from the LPS and assure that enough dropsondes are on board the aircraft.
_____ 3. Modify the flight pattern or drop locations if requested by AOC to accommodate changes in storm location or closeness to land.
_____ 4. Complete the appropriate preflight set-up and checklists.
E.6.2 In-Flight
_____ 1. Operate the system as specified in the operator's manual.
_____ 2. Ensure the AOC flight director is aware of upcoming drops.
_____ 3. Ensure the AVAPS operator has determined that the dropsonde is (or is not) transmitting a good signal. Recommend if a backup dropsonde should be launched in case of failure.
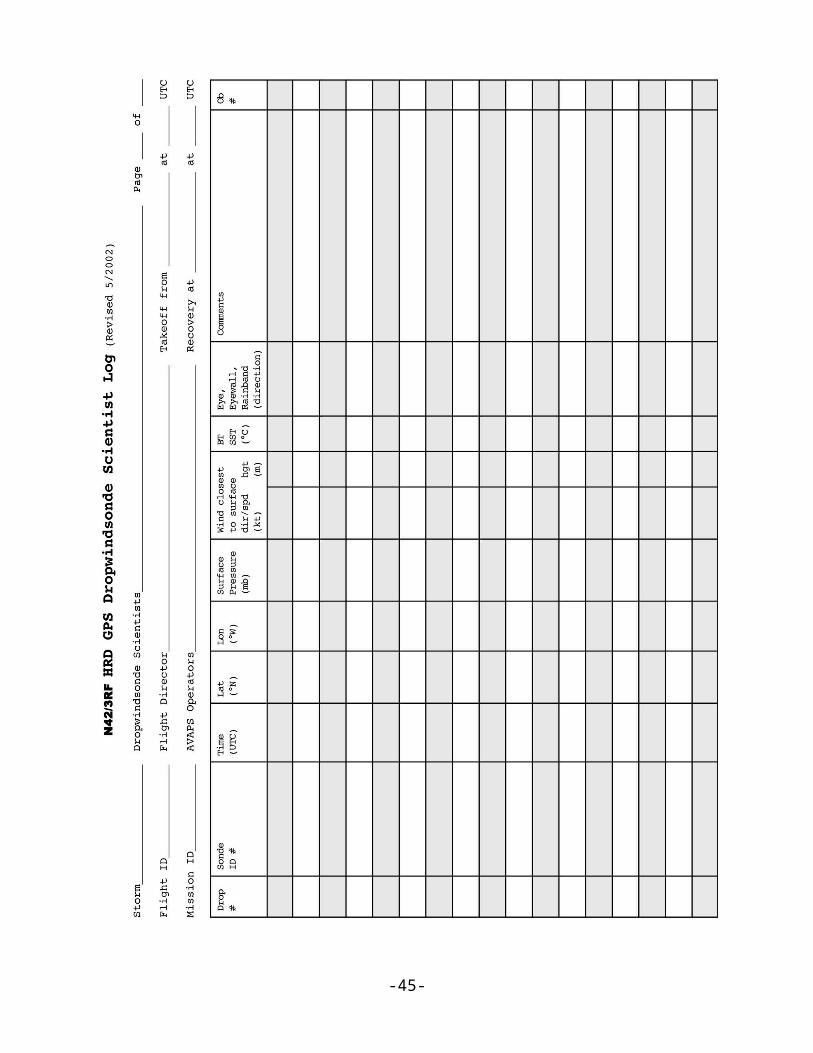
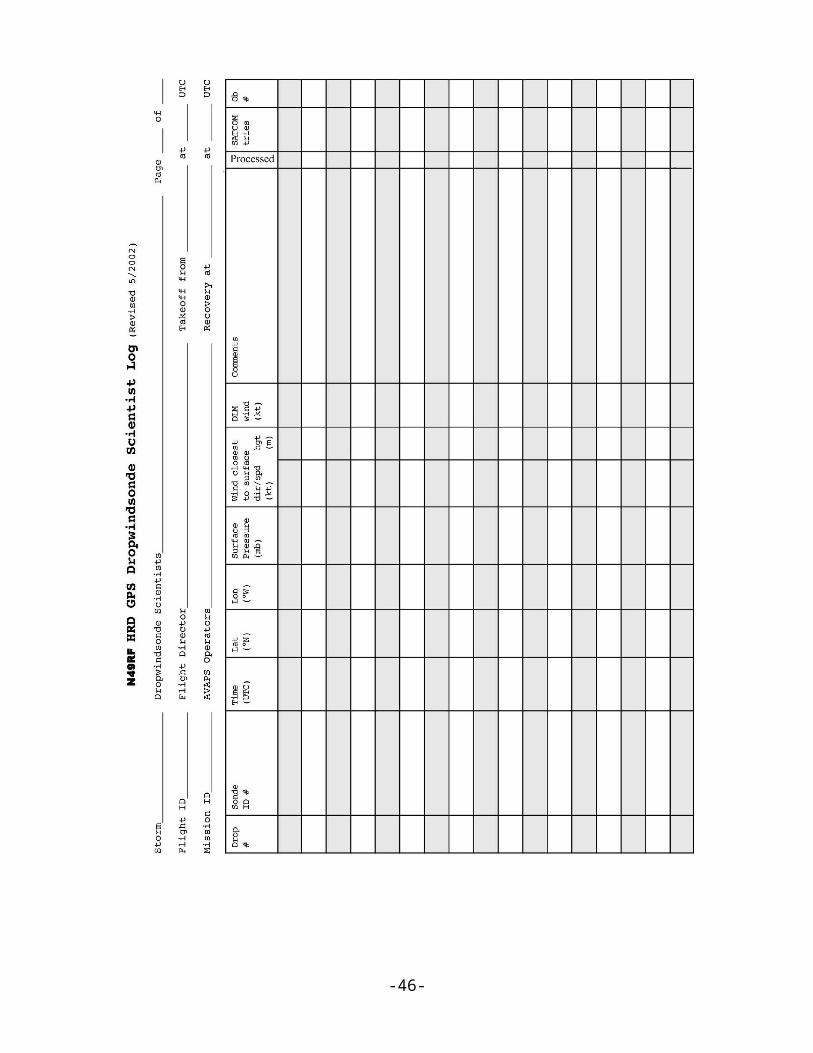
_____ 4. Report the transmission of each drop and fill in the Dropwindsonde Scientist Log.
E.6.3 Post flight
_____ 1. Complete Dropwindsonde Scientist Log.
_____ 2. Brief the LPS on equipment status and turn in reports and completed forms.
_____ 3. Hand-carry all dropwindsonde data tapes or CDs as follows:
a. Outside of Miami-to the LPS or PI.b. In Miami-to AOML/HRD. [Note: all data removed from the aircraft by HRD
personnel should be cleared with the AOC flight director.]
_____ 4. Debrief at the AOML/HRD or the hotel during a deployment.
_____ 5. Determine the status of future missions and notify HRD Field Program Director as to where you can be contacted.
-32-
-33-

-34-
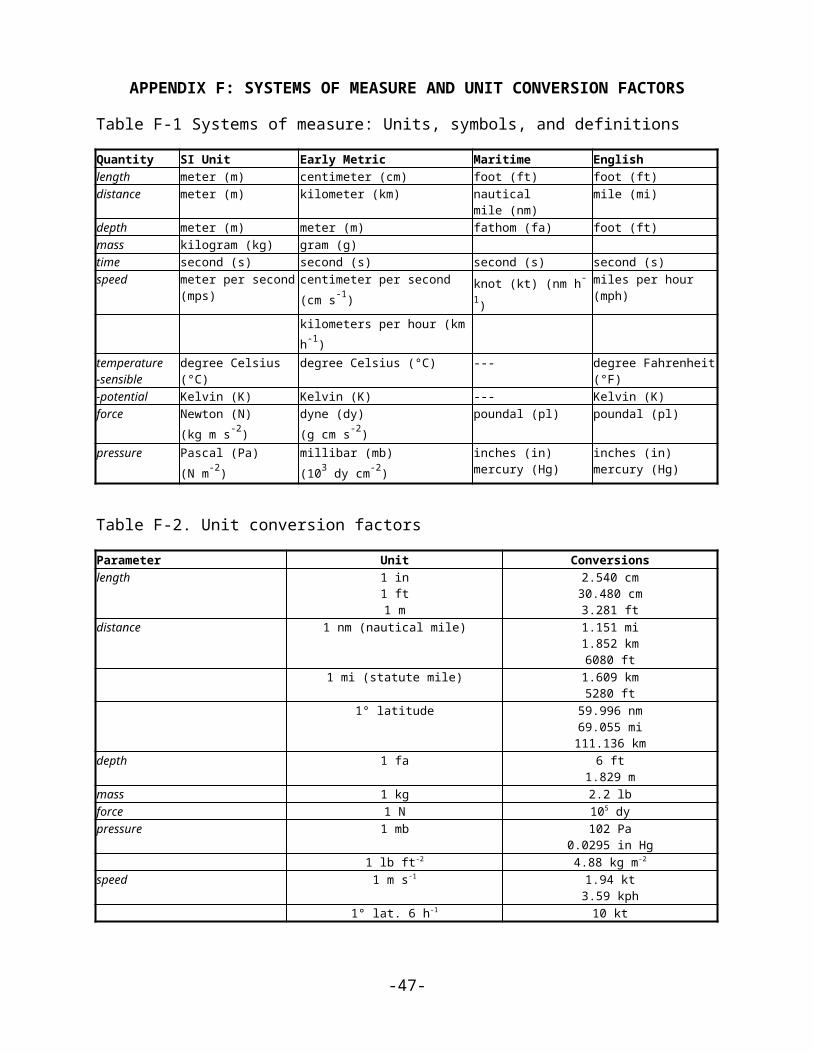
APPENDIX F: SYSTEMS OF MEASURE AND UNIT CONVERSION FACTORS
Table F-1 Systems of measure: Units, symbols, and definitions
Quantity SI Unit Early Metric Maritime Englishlength meter (m) centimeter (cm) foot (ft) foot (ft)distance meter (m) kilometer (km) nautical
mile (nm)mile (mi)
depth meter (m) meter (m) fathom (fa) foot (ft)mass kilogram (kg) gram (g)time second (s) second (s) second (s) second (s)speed meter per second (mps) centimeter per second (cm s-1) knot (kt) (nm h-1) miles per hour (mph)
kilometers per hour (km h-1)temperature-sensible
degree Celsius (°C) degree Celsius (°C) --- degree Fahrenheit (°F)
-potential Kelvin (K) Kelvin (K) --- Kelvin (K)force Newton (N)
(kg m s-2)dyne (dy)(g cm s-2)
poundal (pl) poundal (pl)
pressure Pascal (Pa)(N m-2)
millibar (mb)(103 dy cm-2)
inches (in)mercury (Hg)
inches (in)mercury (Hg)
Table F-2. Unit conversion factors
Parameter Unit Conversionslength 1 in
1 ft1 m
2.540 cm30.480 cm
3.281 ftdistance 1 nm (nautical mile) 1.151 mi
1.852 km6080 ft
1 mi (statute mile) 1.609 km5280 ft
1° latitude 59.996 nm69.055 mi
111.136 kmdepth 1 fa 6 ft
1.829 mmass 1 kg 2.2 lbforce 1 N 105 dypressure 1 mb 102 Pa
0.0295 in Hg1 lb ft-2 4.88 kg m-2
speed 1 m s-1 1.94 kt3.59 kph
1° lat. 6 h-1 10 kt
-35-
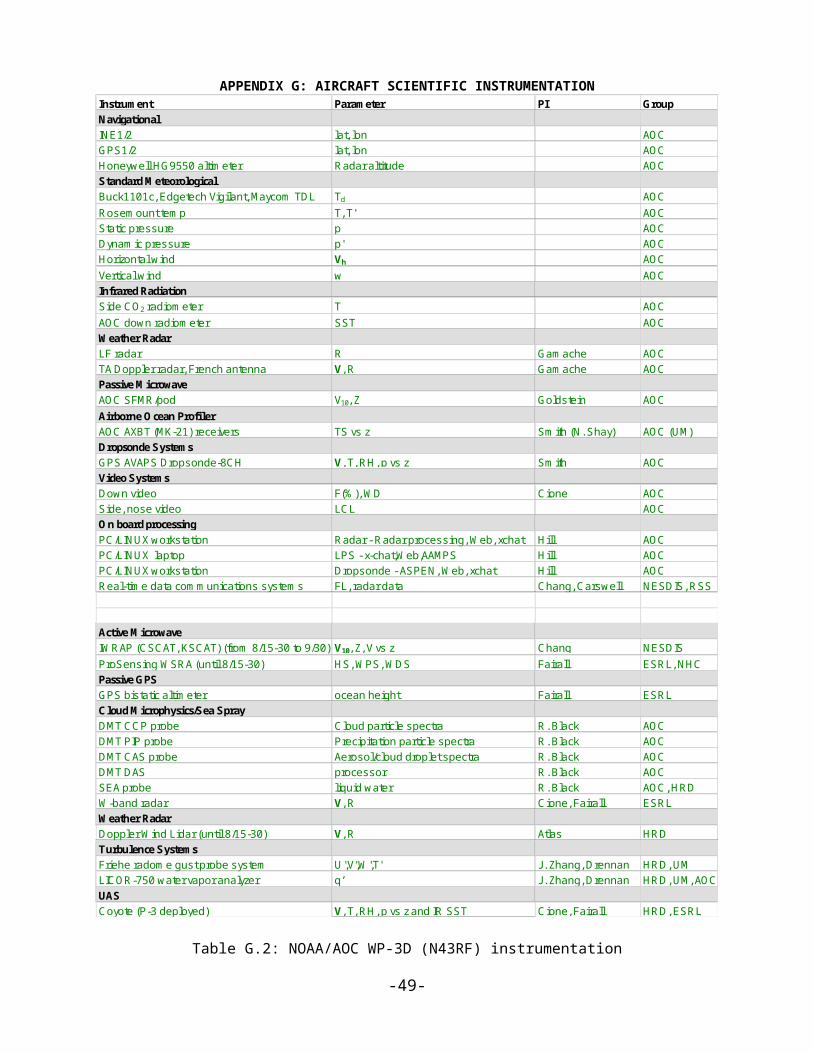
APPENDIX G: AIRCRAFT SCIENTIFIC INSTRUMENTATIONInstrument Parameter PI GroupNavigationalINE1/2 lat, lon AOCGPS1/2 lat, lon AOCHoneywell HG9550 altimeter Radar altitude AOCStandard MeteorologicalBuck1101c, Edgetech Vigilant, Maycom TDL Td AOCRosemount temp T, T' AOCStatic pressure p AOCDynamic pressure p' AOCHorizontal wind Vh AOCVertical wind w AOCInfrared RadiationSide CO2 radiometer T AOCAOC down radiometer SST AOCWeather RadarLF radar R Gamache AOCTA Doppler radar, French antenna V, R Gamache AOCPassive MicrowaveAOC SFMR/pod V10, Z Goldstein AOCAirborne Ocean ProfilerAOC AXBT (MK-21) receivers TS vs z Smith (N. Shay) AOC (UM)Dropsonde SystemsGPS AVAPS Dropsonde-8CH V, T, RH, p vs z Smith AOCVideo SystemsDown video F(%), WD Cione AOCSide, nose video LCL AOCOn board processingPC/LINUX workstation Radar - Radar processing, Web, xchat Hill AOCPC/LINUX laptop LPS - x-chat,Web,AAMPS Hill AOCPC/LINUX workstation Dropsonde - ASPEN, Web, xchat Hill AOCReal-time data communications systems FL, radar data Chang, Carswell NESDIS, RSS
Active MicrowaveIWRAP (CSCAT, KSCAT) (from 8/15-30 to 9/30) V10, Z, V vs z Chang NESDISProSensing WSRA (until 8/15-30) HS, WPS, WDS Fairall ESRL, NHCPassive GPSGPS bistatic altimeter ocean height Fairall ESRLCloud Microphysics/Sea SprayDMT CCP probe Cloud particle spectra R. Black AOCDMT PIP probe Precipitation particle spectra R. Black AOCDMT CAS probe Aerosol/cloud droplet spectra R. Black AOCDMT DAS processor R. Black AOCSEA probe liquid water R. Black AOC, HRDW-band radar V, R Cione, Fairall ESRLWeather RadarDoppler Wind Lidar (until 8/15-30) V, R Atlas HRDTurbulence SystemsFriehe radome gust probe system U',V',W',T' J. Zhang, Drennan HRD, UMLICOR-750 water vapor analyzer q’ J. Zhang, Drennan HRD, UM, AOCUASCoyote (P-3 deployed) V, T, RH, p vs z and IR SST Cione, Fairall HRD, ESRL
Table G.2: NOAA/AOC WP-3D (N43RF) instrumentation
-36-
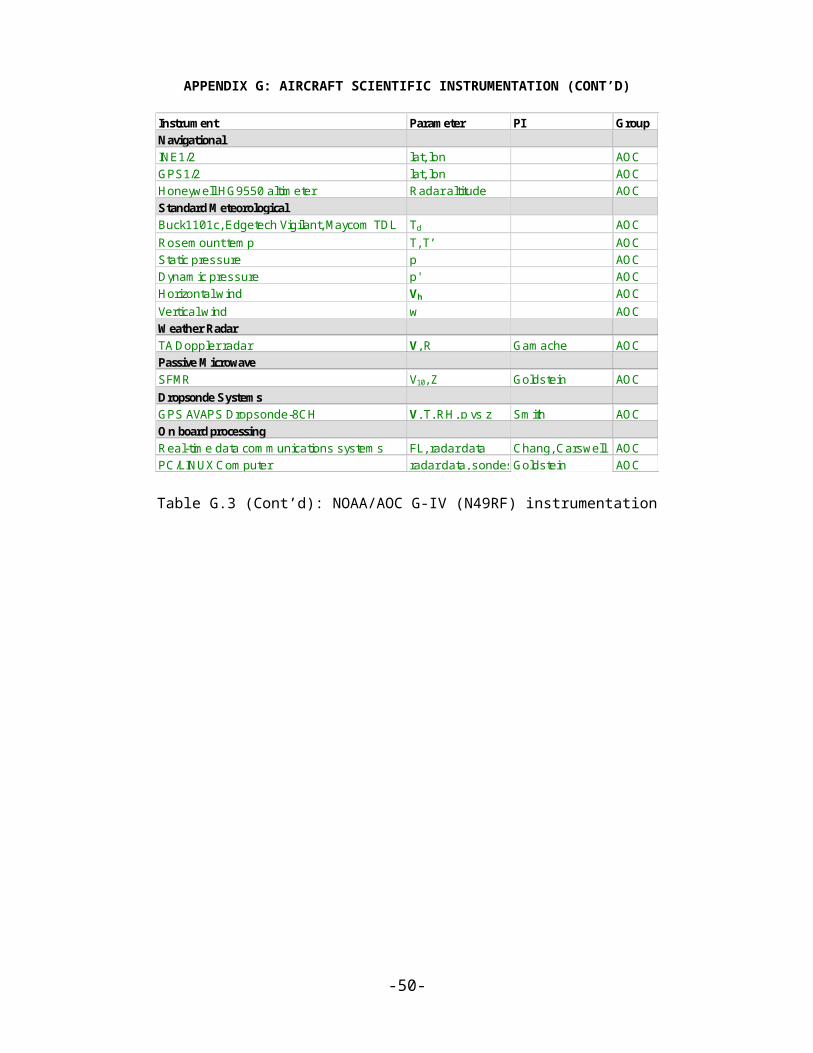
APPENDIX G: AIRCRAFT SCIENTIFIC INSTRUMENTATION (CONT’D)
Instrument Parameter PI GroupNavigationalINE1/2 lat, lon AOCGPS1/2 lat, lon AOCHoneywell HG9550 altimeter Radar altitude AOCStandard MeteorologicalBuck1101c, Edgetech Vigilant, Maycom TDL Td AOCRosemount temp T, T’ AOCStatic pressure p AOCDynamic pressure p' AOCHorizontal wind Vh AOCVertical wind w AOCWeather RadarTA Doppler radar V, R Gamache AOCPassive MicrowaveSFMR V10, Z Goldstein AOCDropsonde SystemsGPS AVAPS Dropsonde-8CH V, T, RH, p vs z Smith AOCOn board processingReal-time data communications systems FL, radar data Chang, Carswell AOCPC/LINUX Computer radar data, sondesGoldstein AOC
Table G.3 (Cont’d): NOAA/AOC G-IV (N49RF) instrumentation
-37-
APPENDIX H: NOAA EXPENDABLE AND MEDIA
Experiment GPS Dropwindsondes AXBTs CADs
G-IV P-3 P-3 P-3
P-3 3D Doppler Winds - 20 10 10
G-IV Tail Doppler Radar 20 20 10 10
DWL - 25 - -
SUAVE - 20 15 15
Ocean Winds - 5 - -
SFMR Hi-Incidence Ang - 1 1 1
Offshore Wind - 10 - -
East Wave Genesis 25 15 - -
EastPac Genesis 20 - - -
Rapid Intensification 25 25 15 15
TC in Shear 25 40 - -
TC Diurnal Cycle 25 10 - -
TC-Ocean Interaction - 20 15 15
TC Landfall - 20 5 5
Rapid Weakening 20 20 10 10
Convective Burst - 15 - -
Eye-eyewall mixing - - - -
SEF/ERC 25 35 10 10
TC Warm Core 20 10 - -
Hurricane PBL - 30 - -
SALEX Arc Cloud - 10 - -
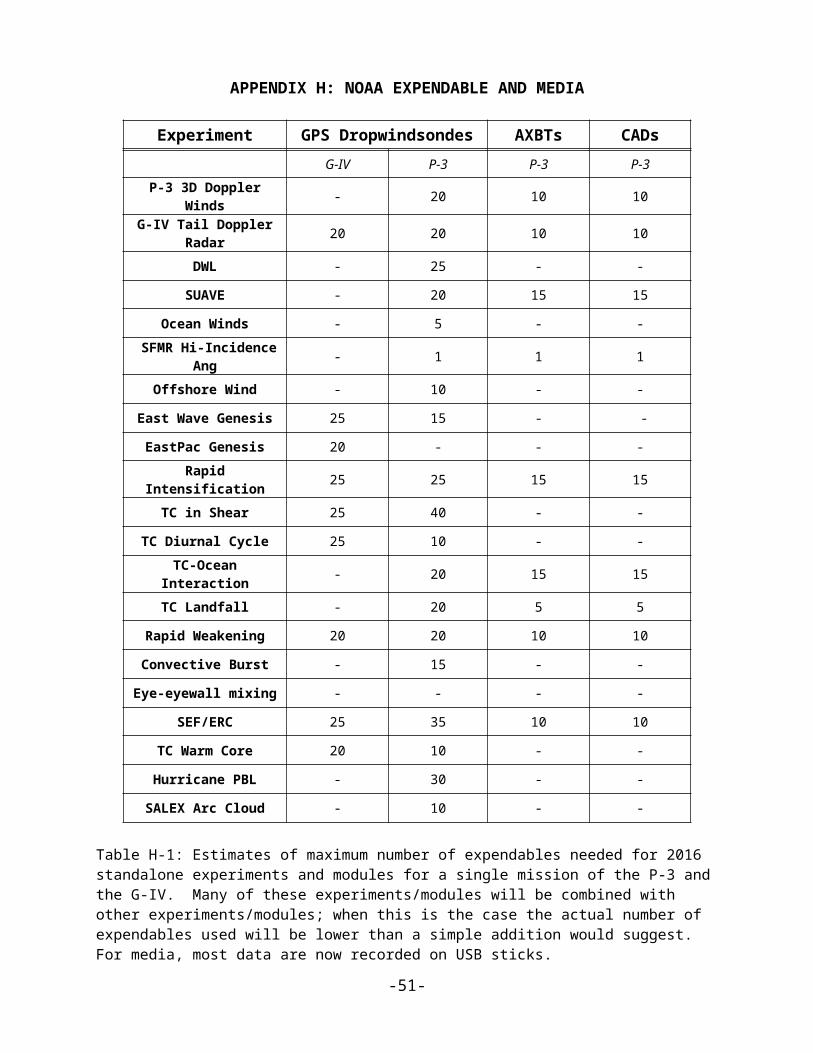
Table H-1: Estimates of maximum number of expendables needed for 2016 standalone experiments and modules for a single mission of the P-3 and the G-IV. Many of these experiments/modules will be combined with other experiments/modules; when this is the case the actual number of expendables used will be lower than a simple addition would suggest. For media, most data are now recorded on USB sticks.
-38-
APPENDIX I: OPERATIONAL MAPS
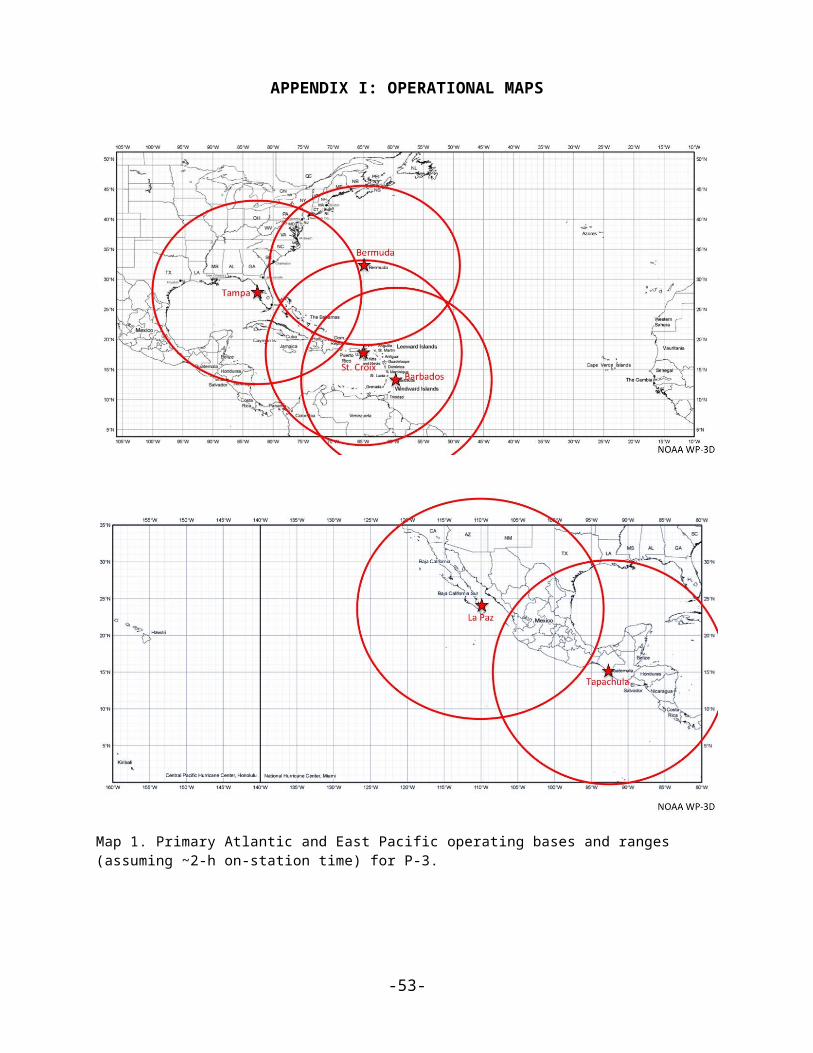
Map 1. Primary Atlantic and East Pacific operating bases and ranges (assuming ~2-h on-station time) for P-3.
-39-

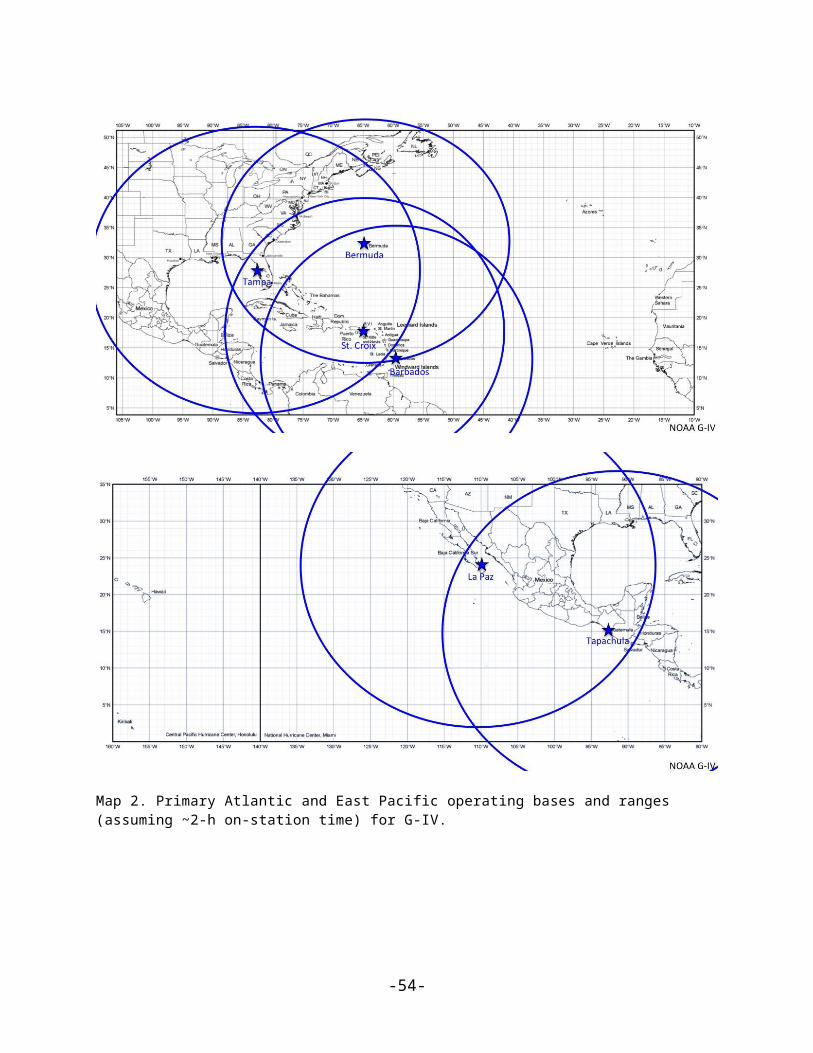
Map 2. Primary Atlantic and East Pacific operating bases and ranges (assuming ~2-h on-station time) for G-IV.
-40-
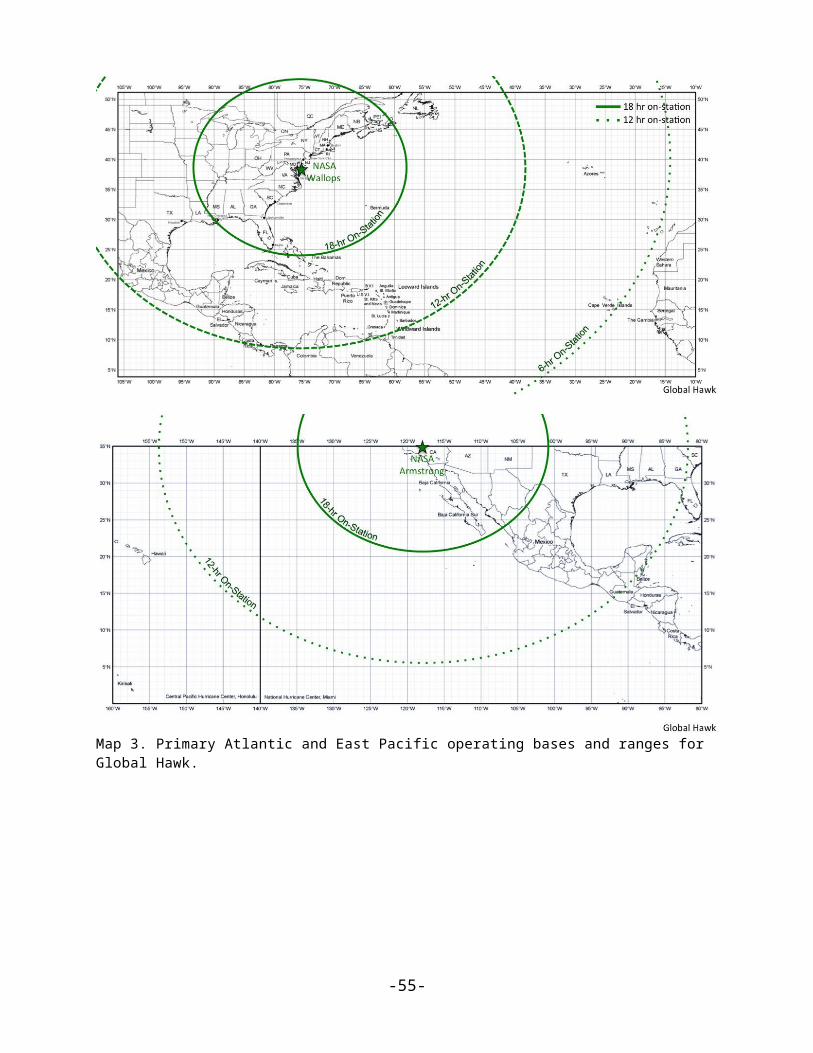
Map 3. Primary Atlantic and East Pacific operating bases and ranges for Global Hawk.
-41-

APPENDIX J: FLIGHT PATTERNS
J.1 Patterns from Experiments
P-3 Lawnmower pattern
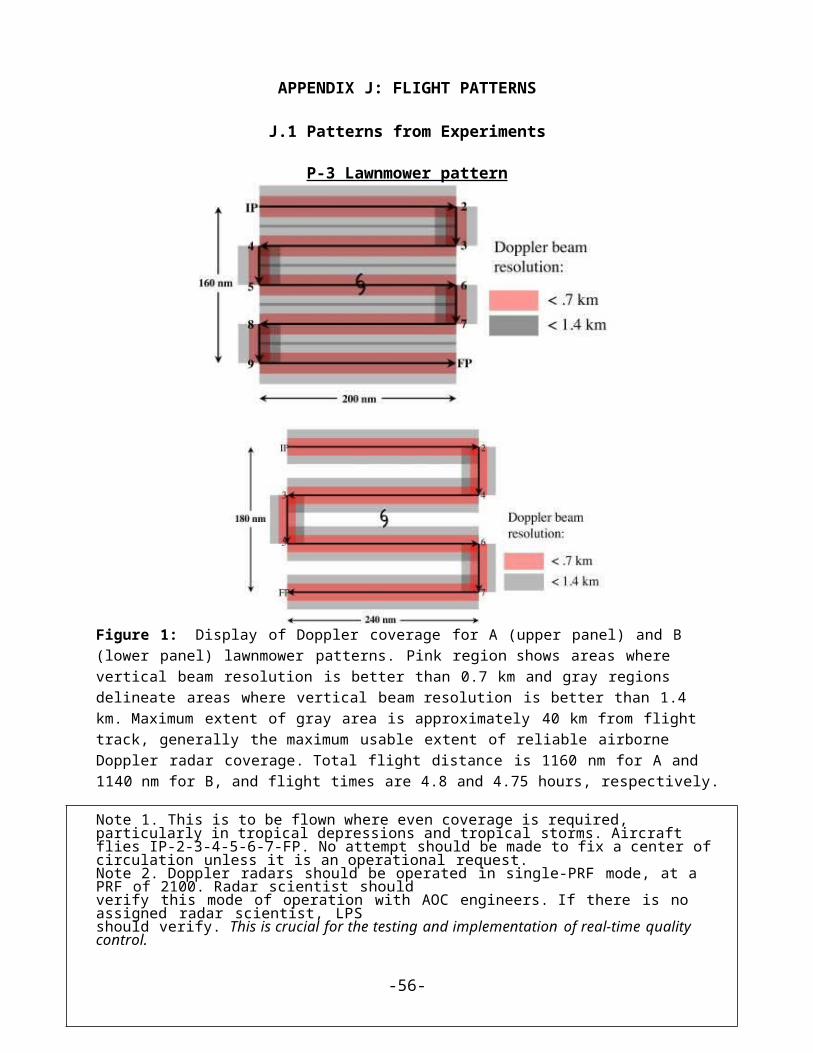
Figure 1: Display of Doppler coverage for A (upper panel) and B (lower panel) lawnmower patterns. Pink region shows areas where vertical beam resolution is better than 0.7 km and gray regions delineate areas where vertical beam resolution is better than 1.4 km. Maximum extent of gray area is approximately 40 km from flight track, generally the maximum usable extent of reliable airborne Doppler radar coverage. Total flight distance is 1160 nm for A and 1140 nm for B, and flight times are 4.8 and 4.75 hours, respectively.
Note 1. This is to be flown where even coverage is required, particularly in tropical depressions and tropical storms. Aircraft flies IP-2-3-4-5-6-7-FP. No attempt should be made to fix a center of circulation unless it is an operational request.Note 2. Doppler radars should be operated in single-PRF mode, at a PRF of 2100. Radar scientist shouldverify this mode of operation with AOC engineers. If there is no assigned radar scientist, LPSshould verify. This is crucial for the testing and implementation of real-time quality control.Note 3. Assure that transmitter is switching between fore and aft antennas, by examining the real time display.Note 4. IP can be at any desired heading relative to storm centerNote 5. To maximize dropwindsonde coverage aircraft should operate at highest altitudes that stillminimize icingNote 6. If dropwindsondes are not deployed, aircraft can operate at any level below the melting level, with 10,000 ft preferred. Aircraft might also fly lower, if circulation not evident at 10,000 ft.Note 7. Dropwindsondes are not a required part of this flight plan and are optional
-42-
P-3 Box-spiral patterns
Figure 2: Doppler radar coverage for box-spiral pattern A. Pink region shows areas where vertical beam resolution is better than 0.7 km and gray regions delineate areas where vertical beam resolution is better than1.4 km. Maximum extent of gray area is approximately 40 km from flight track, approximately the maximum usable extent of reliable airborne Doppler radar coverage. Flight distance in pattern above is 1280 nm, and flight time is 5.33 hours.
Note 1. This is to be flown where even coverage is required, particularly in tropical depressions and tropical storms. Aircraft flies IP-2-3-4-5-6-7-8-FP. No attempt should be made to fix a center of circulation unless it is an operational request.Note 2. Doppler radars should be operated in single-PRF mode, at a PRF of 2100. Radar scientist shouldverify this mode of operation with AOC engineers. If there is no assigned radar scientist, LPSshould verify. This is crucial for the testing and implementation of real-time quality control.Note 3. Assure that transmitter is switching between fore and aft antennas, by examining the real time display.Note 4. IP can be at any desired heading relative to storm centerNote 5. To maximize dropwindsonde coverage aircraft should operate at highest altitudes that stillminimize icingNote 6. If dropwindsondes are not deployed, aircraft can operate at any level below the melting level, with10,000 ft preferred. Aircraft might also fly lower, if circulation not evident at 10,000 ft.Note 7. Dropwindsondes are not a required part of this flight plan and are optional.
-43-
P-3 Box-spiral patterns
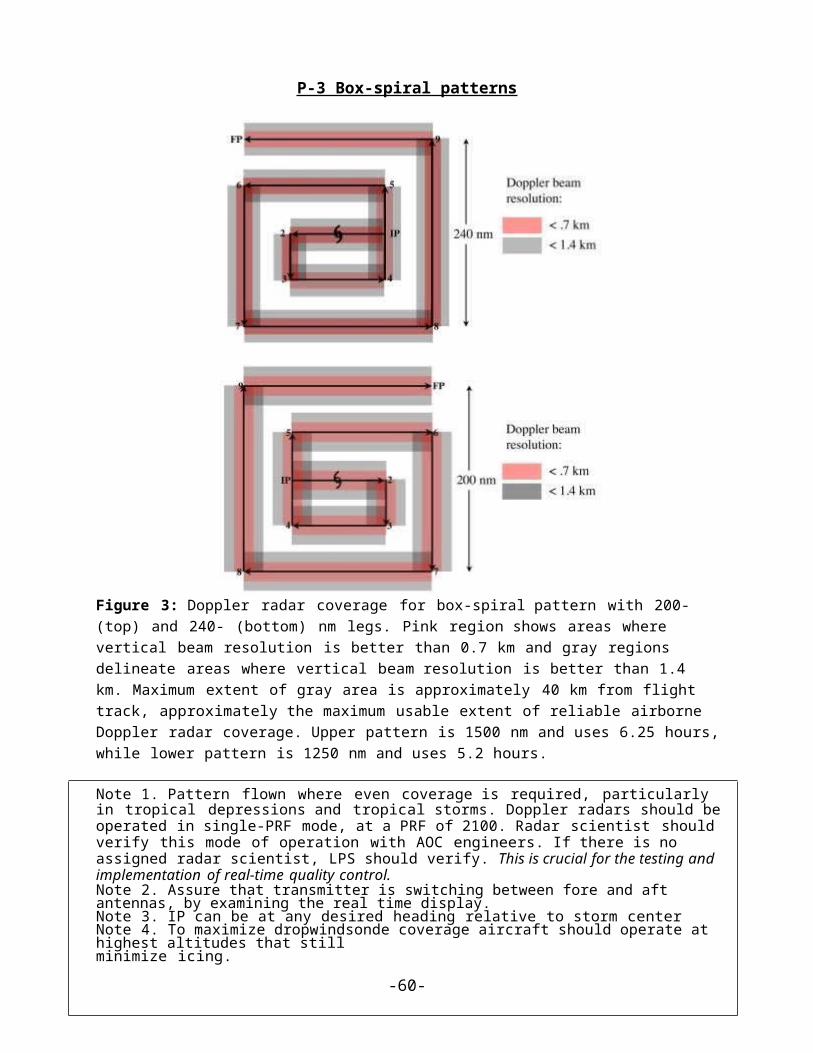
Figure 3: Doppler radar coverage for box-spiral pattern with 200- (top) and 240- (bottom) nm legs. Pink region shows areas where vertical beam resolution is better than 0.7 km and gray regions delineate areas where vertical beam resolution is better than 1.4 km. Maximum extent of gray area is approximately 40 km from flight track, approximately the maximum usable extent of reliable airborne Doppler radar coverage. Upper pattern is 1500 nm and uses 6.25 hours, while lower pattern is 1250 nm and uses 5.2 hours.
Note 1. Pattern flown where even coverage is required, particularly in tropical depressions and tropical storms. Doppler radars should be operated in single-PRF mode, at a PRF of 2100. Radar scientist should verify this mode of operation with AOC engineers. If there is no assigned radar scientist, LPS should verify. This is crucial for the testing and implementation of real-time quality control.Note 2. Assure that transmitter is switching between fore and aft antennas, by examining the real time display.Note 3. IP can be at any desired heading relative to storm centerNote 4. To maximize dropwindsonde coverage aircraft should operate at highest altitudes that stillminimize icing.Note 5. Maximum radius may be decreased or increased within operational constraints. Note 6. Dropwindsondes are not a required part of this flight plan and are optional.Note 7. Maximum radius may be changed to meet operational needs while conforming to flight-length constraints.Note 8. If dropwindsondes are not deployed, aircraft can operate at any level below the melting level, with 10,000 ft preferred. Aircraft might also fly lower, if circulation not evident at 10,000 ft.
-44-
P-3 Rotating Figure-4 patterns
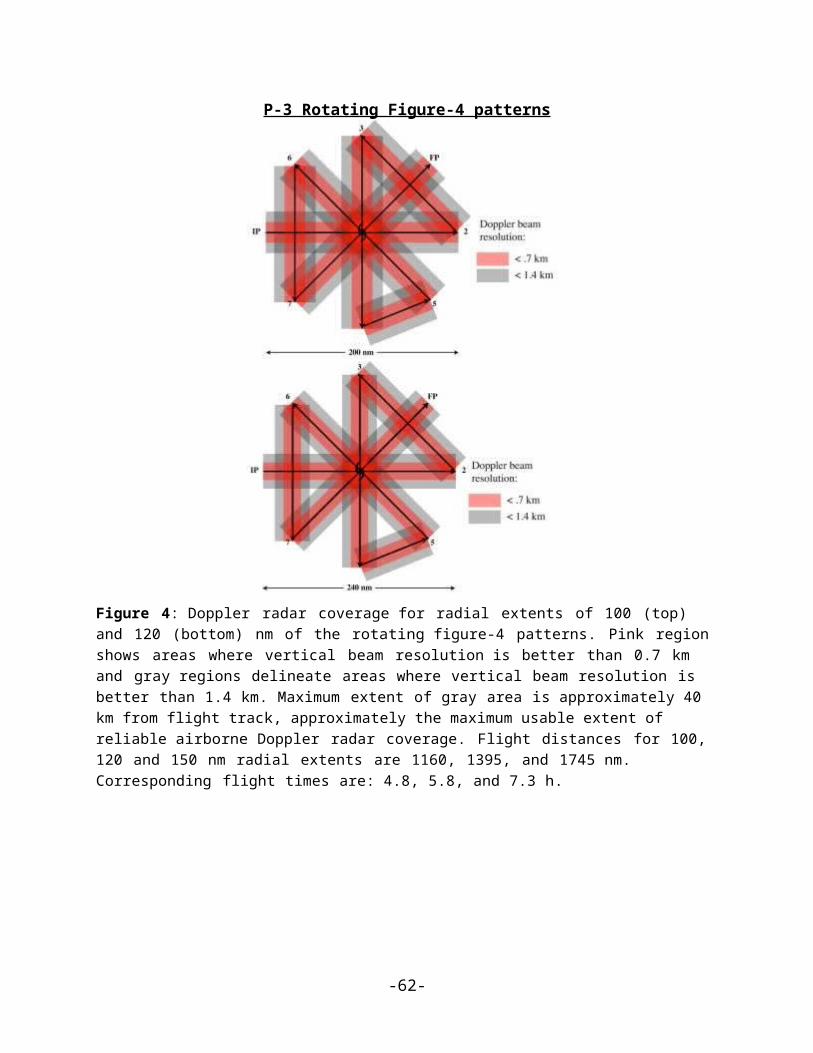
Figure 4: Doppler radar coverage for radial extents of 100 (top) and 120 (bottom) nm of the rotating figure-4 patterns. Pink region shows areas where vertical beam resolution is better than 0.7 km and gray regions delineate areas where vertical beam resolution is better than 1.4 km. Maximum extent of gray area is approximately 40 km from flight track, approximately the maximum usable extent of reliable airborne Doppler radar coverage. Flight distances for 100, 120 and 150 nm radial extents are 1160, 1395, and 1745 nm. Corresponding flight times are: 4.8, 5.8, and 7.3 h.
-45-
P-3 Rotating Figure-4 patterns
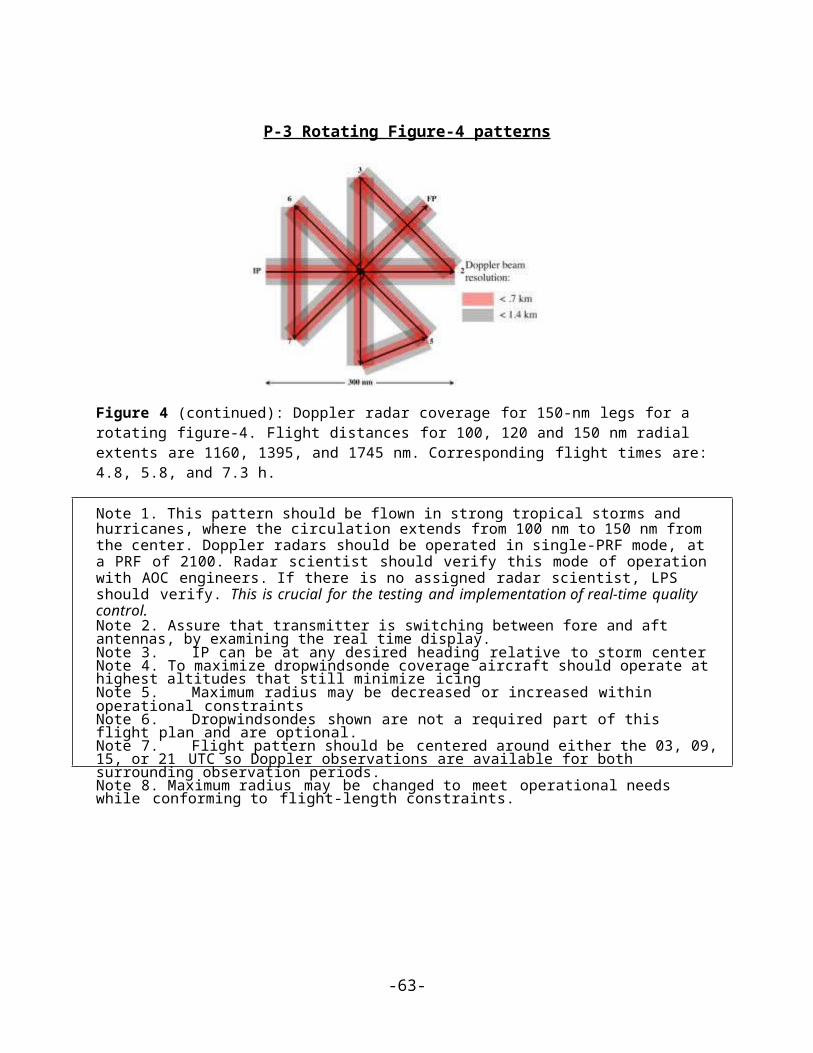
Figure 4 (continued): Doppler radar coverage for 150-nm legs for a rotating figure-4. Flight distances for 100, 120 and 150 nm radial extents are 1160, 1395, and 1745 nm. Corresponding flight times are: 4.8, 5.8, and 7.3 h.
Note 1. This pattern should be flown in strong tropical storms and hurricanes, where the circulation extends from 100 nm to 150 nm from the center. Doppler radars should be operated in single-PRF mode, at a PRF of 2100. Radar scientist should verify this mode of operation with AOC engineers. If there is no assigned radar scientist, LPS should verify. This is crucial for the testing and implementation of real-time quality control.Note 2. Assure that transmitter is switching between fore and aft antennas, by examining the real time display.Note 3. IP can be at any desired heading relative to storm centerNote 4. To maximize dropwindsonde coverage aircraft should operate at highest altitudes that still minimize icingNote 5. Maximum radius may be decreased or increased within operational constraintsNote 6. Dropwindsondes shown are not a required part of this flight plan and are optional.Note 7. Flight pattern should be centered around either the 03, 09, 15, or 21 UTC so Doppler observations are available for both surrounding observation periods.Note 8. Maximum radius may be changed to meet operational needs while conforming to flight-length constraints.
-46-
P-3 Butterfly-4 patterns
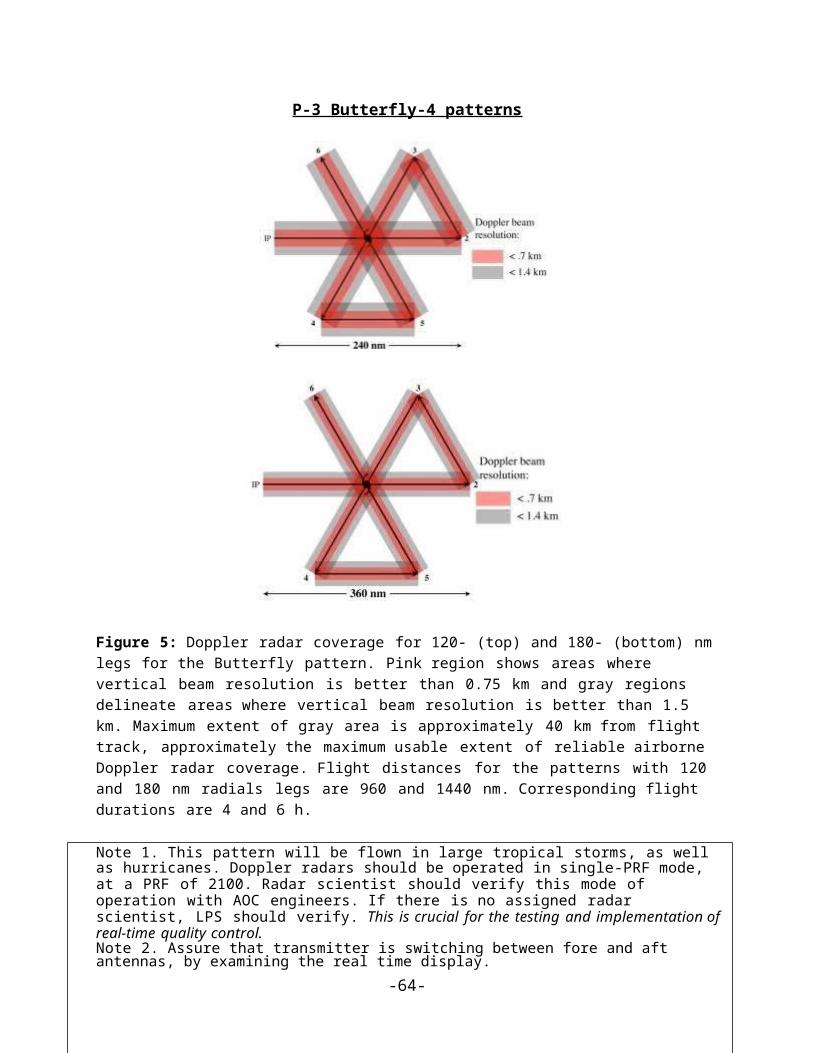
Figure 5: Doppler radar coverage for 120- (top) and 180- (bottom) nm legs for the Butterfly pattern. Pink region shows areas where vertical beam resolution is better than 0.75 km and gray regions delineate areas where vertical beam resolution is better than 1.5 km. Maximum extent of gray area is approximately 40 km from flight track, approximately the maximum usable extent of reliable airborne Doppler radar coverage. Flight distances for the patterns with 120 and 180 nm radials legs are 960 and 1440 nm. Corresponding flight durations are 4 and 6 h.
Note 1. This pattern will be flown in large tropical storms, as well as hurricanes. Doppler radars should be operated in single-PRF mode, at a PRF of 2100. Radar scientist should verify this mode of operation with AOC engineers. If there is no assigned radar scientist, LPS should verify. This is crucial for the testing and implementation of real-time quality control.Note 2. Assure that transmitter is switching between fore and aft antennas, by examining the real time display.Note 3. IP can be at any desired heading relative to storm centerNote 4. To maximize dropwindsonde coverage aircraft should operate at highest altitudes that still minimize icingNote 5. Maximum radius may be decreased or increased within operational constraintsNote 6. Dropwindsondes are not a required part of this flight plan and are optional.Note 7. Flight pattern should be centered around either 03, 09, 15, or 21 UTC so Doppler observations are available for both surrounding observation periods.Note 8. Maximum radius may be changed to meet operational needs while conforming to flight-length constraints.
-47-

P-3 Figure-4 patterns
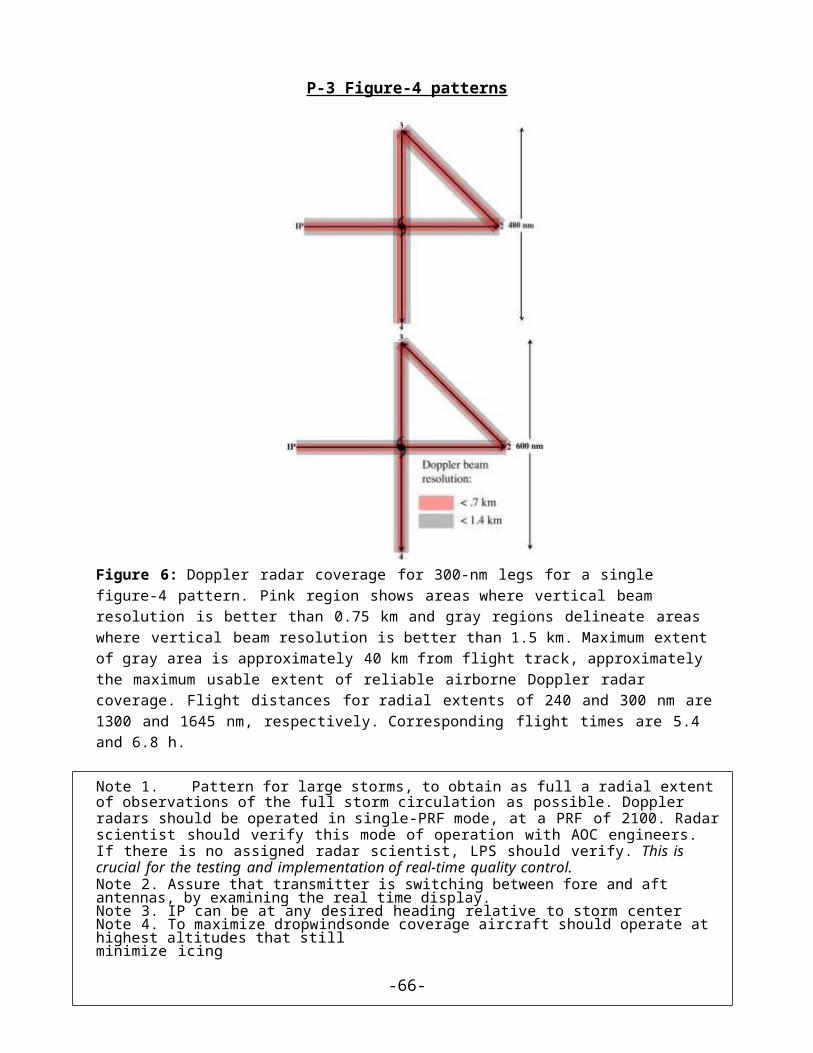
Figure 6: Doppler radar coverage for 300-nm legs for a single figure-4 pattern. Pink region shows areas where vertical beam resolution is better than 0.75 km and gray regions delineate areas where vertical beam resolution is better than 1.5 km. Maximum extent of gray area is approximately 40 km from flight track, approximately the maximum usable extent of reliable airborne Doppler radar coverage. Flight distances for radial extents of 240 and 300 nm are 1300 and 1645 nm, respectively. Corresponding flight times are 5.4 and 6.8 h.
Note 1. Pattern for large storms, to obtain as full a radial extent of observations of the full storm circulation as possible. Doppler radars should be operated in single-PRF mode, at a PRF of 2100. Radar scientist should verify this mode of operation with AOC engineers. If there is no assigned radar scientist, LPS should verify. This is crucial for the testing and implementation of real-time quality control.Note 2. Assure that transmitter is switching between fore and aft antennas, by examining the real time display.Note 3. IP can be at any desired heading relative to storm centerNote 4. To maximize dropwindsonde coverage aircraft should operate at highest altitudes that stillminimize icingNote 5. Maximum radius may be decreased or increased within operational constraintsNote 6. Dropwindsondes are not a required part of this flight plan and are optional.Note 7. Flight pattern should be centered around either the 03, 09, 15, or 21 UTC so Doppler observations are available for both surrounding observation periods.Note 8. Maximum radius may be changed to meet operational needs while conforming to flight-length constraints.
-48-
Duration: 5.75 h
300 nm
IPIP
FP
G-IV Square spiral (outward) pattern
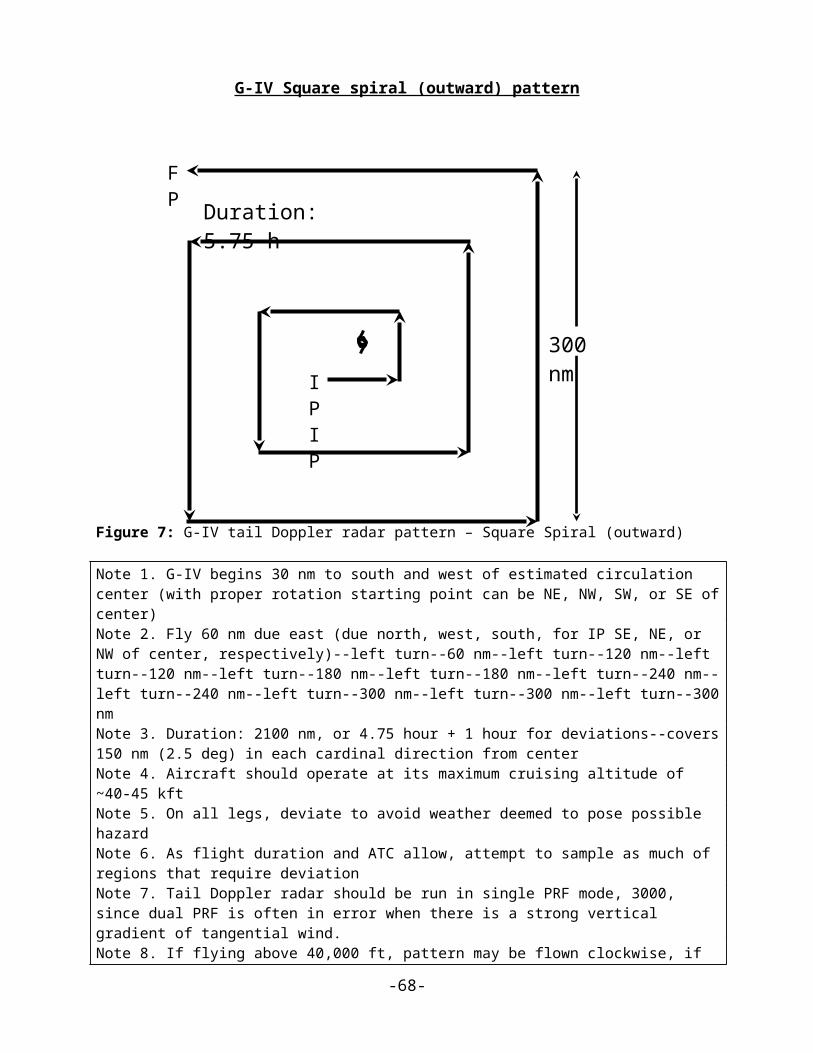
Figure 7: G-IV tail Doppler radar pattern – Square Spiral (outward)
Note 1. G-IV begins 30 nm to south and west of estimated circulation center (with proper rotation starting point can be NE, NW, SW, or SE of center)Note 2. Fly 60 nm due east (due north, west, south, for IP SE, NE, or NW of center, respectively)--left turn--60 nm--left turn--120 nm--left turn--120 nm--left turn--180 nm--left turn--180 nm--left turn--240 nm--left turn--240 nm--left turn--300 nm--left turn--300 nm--left turn--300 nm Note 3. Duration: 2100 nm, or 4.75 hour + 1 hour for deviations--covers 150 nm (2.5 deg) in each cardinal direction from centerNote 4. Aircraft should operate at its maximum cruising altitude of ~40-45 kftNote 5. On all legs, deviate to avoid weather deemed to pose possible hazardNote 6. As flight duration and ATC allow, attempt to sample as much of regions that require deviationNote 7. Tail Doppler radar should be run in single PRF mode, 3000, since dual PRF is often in error when there is a strong vertical gradient of tangential wind.Note 8. If flying above 40,000 ft, pattern may be flown clockwise, if preferred.
-49-
Duration: 5.75 h
IP
FP
G-IV Square spiral (inward) pattern
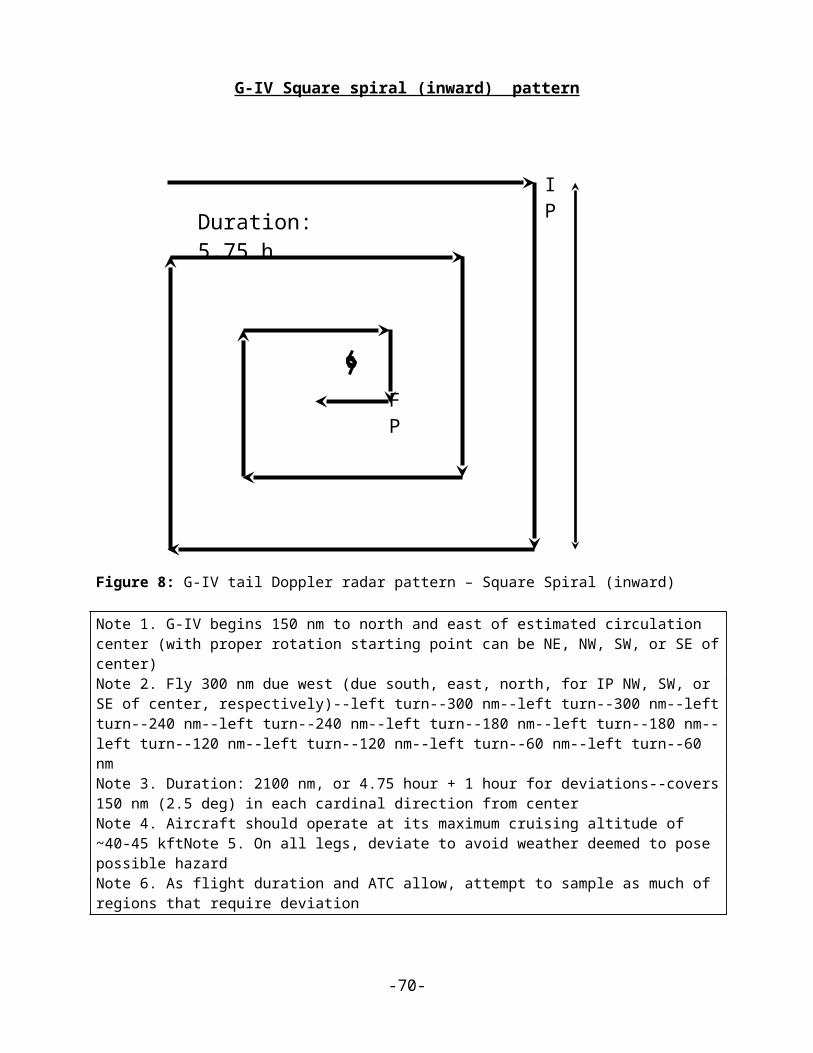
Figure 8: G-IV tail Doppler radar pattern – Square Spiral (inward)
Note 1. G-IV begins 150 nm to north and east of estimated circulation center (with proper rotation starting point can be NE, NW, SW, or SE of center)Note 2. Fly 300 nm due west (due south, east, north, for IP NW, SW, or SE of center, respectively)--left turn--300 nm--left turn--300 nm--left turn--240 nm--left turn--240 nm--left turn--180 nm--left turn--180 nm--left turn--120 nm--left turn--120 nm--left turn--60 nm--left turn--60 nm Note 3. Duration: 2100 nm, or 4.75 hour + 1 hour for deviations--covers 150 nm (2.5 deg) in each cardinal direction from centerNote 4. Aircraft should operate at its maximum cruising altitude of ~40-45 kftNote 5. On all legs, deviate to avoid weather deemed to pose possible hazardNote 6. As flight duration and ATC allow, attempt to sample as much of regions that require deviationNote 7. Tail Doppler radar should be run in single PRF mode, 3000, since dual PRF is often in error when there is a strong vertical gradient of tangential wind.Note 8. If flying above 40,000 ft, pattern may be flown clockwise, if preferred.
-50-
1 2
3
4
5
6
7
8
Duration: 6.25 h
400 nm
Preferred track (if safe)
G-IV Rotating Figure-4 pattern
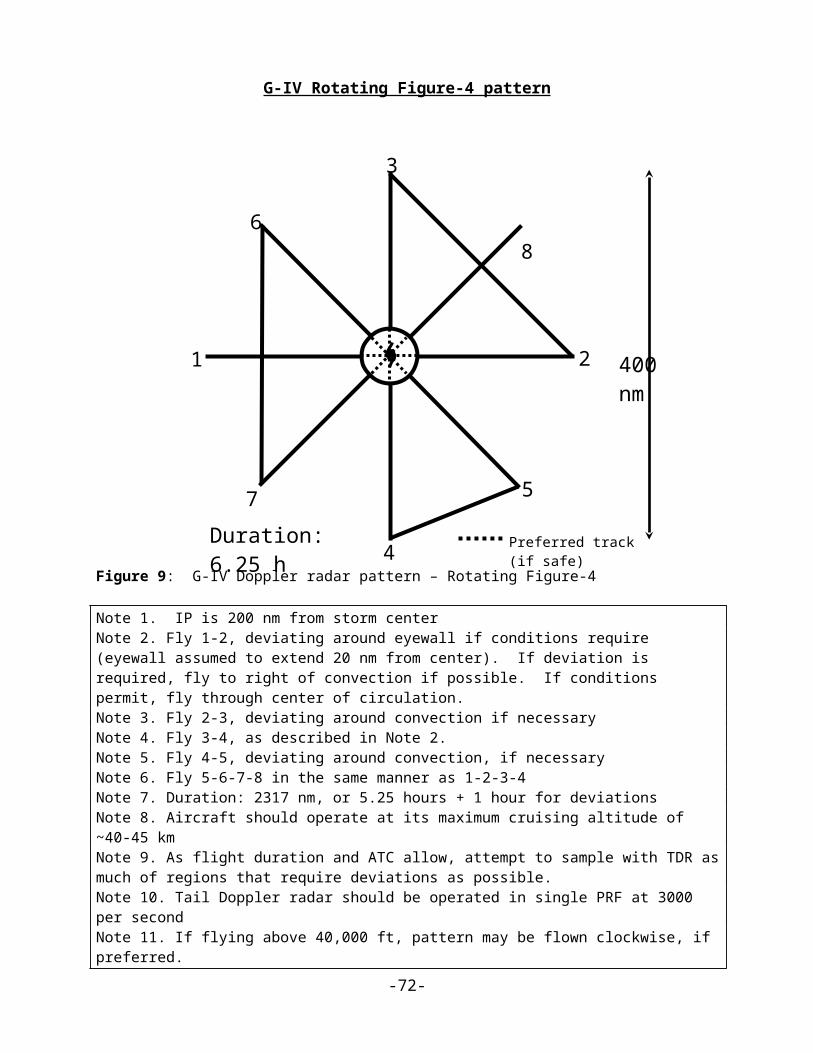
Figure 9: G-IV Doppler radar pattern – Rotating Figure-4
Note 1. IP is 200 nm from storm centerNote 2. Fly 1-2, deviating around eyewall if conditions require (eyewall assumed to extend 20 nm from center). If deviation is required, fly to right of convection if possible. If conditions permit, fly through center of circulation.Note 3. Fly 2-3, deviating around convection if necessaryNote 4. Fly 3-4, as described in Note 2.Note 5. Fly 4-5, deviating around convection, if necessaryNote 6. Fly 5-6-7-8 in the same manner as 1-2-3-4Note 7. Duration: 2317 nm, or 5.25 hours + 1 hour for deviationsNote 8. Aircraft should operate at its maximum cruising altitude of ~40-45 kmNote 9. As flight duration and ATC allow, attempt to sample with TDR as much of regions that require deviations as possible.Note 10. Tail Doppler radar should be operated in single PRF at 3000 per secondNote 11. If flying above 40,000 ft, pattern may be flown clockwise, if preferred.
-51-

1 2
3
4 5
Preferred track (if safe)
Duration: 5.35 h
480 nm
G-IV Butterfly pattern
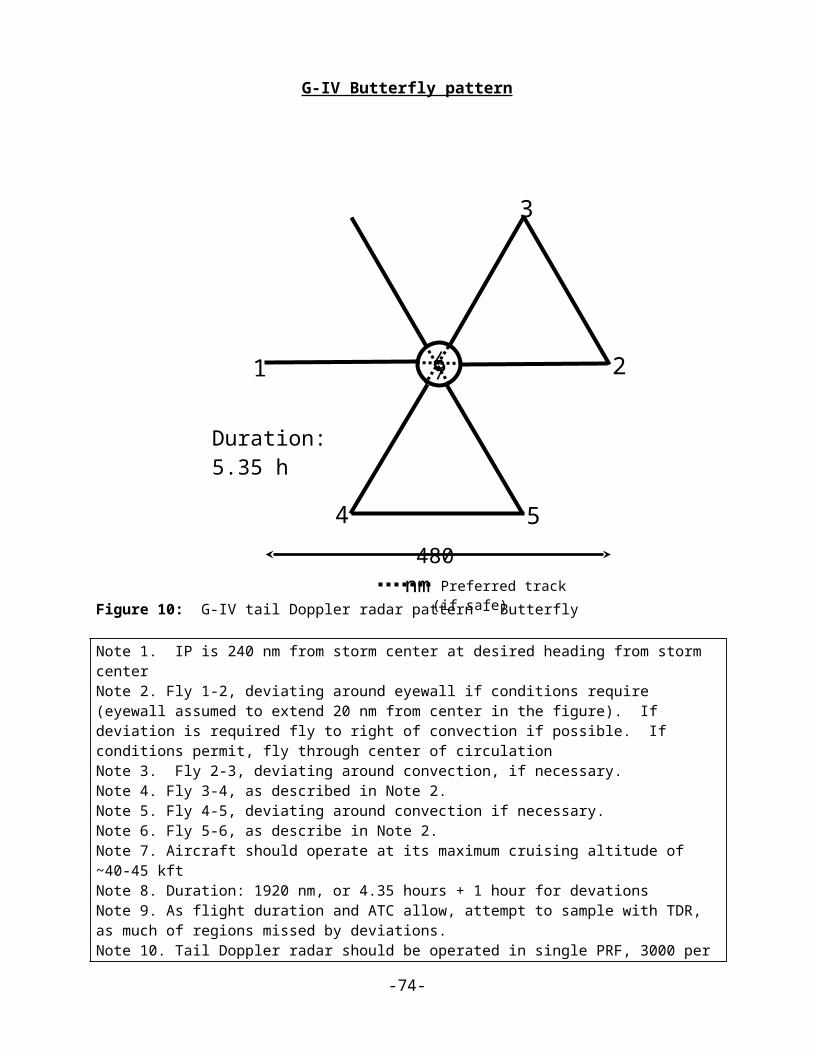
Figure 10: G-IV tail Doppler radar pattern – Butterfly
Note 1. IP is 240 nm from storm center at desired heading from storm centerNote 2. Fly 1-2, deviating around eyewall if conditions require (eyewall assumed to extend 20 nm from center in the figure). If deviation is required fly to right of convection if possible. If conditions permit, fly through center of circulationNote 3. Fly 2-3, deviating around convection, if necessary.Note 4. Fly 3-4, as described in Note 2.Note 5. Fly 4-5, deviating around convection if necessary.Note 6. Fly 5-6, as describe in Note 2.Note 7. Aircraft should operate at its maximum cruising altitude of ~40-45 kftNote 8. Duration: 1920 nm, or 4.35 hours + 1 hour for devationsNote 9. As flight duration and ATC allow, attempt to sample with TDR, as much of regions missed by deviations.Note 10. Tail Doppler radar should be operated in single PRF, 3000 per second.Note 11. If flying above 40,000 ft., pattern may be flown clockwise, if preferred.
-52-
3
1 2
4
Duration: 4.7 h
Preferred track (if safe)
600 nm
G-IV Figure-4 pattern
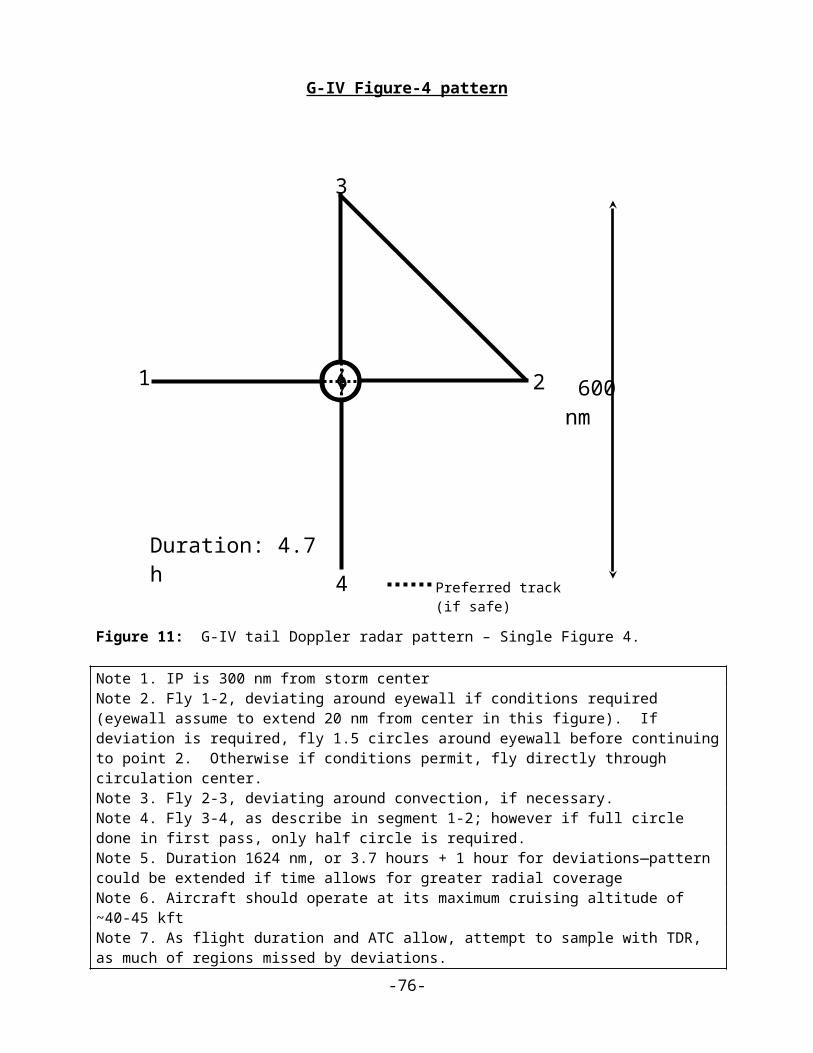
Figure 11: G-IV tail Doppler radar pattern – Single Figure 4.
Note 1. IP is 300 nm from storm centerNote 2. Fly 1-2, deviating around eyewall if conditions required (eyewall assume to extend 20 nm from center in this figure). If deviation is required, fly 1.5 circles around eyewall before continuing to point 2. Otherwise if conditions permit, fly directly through circulation center.Note 3. Fly 2-3, deviating around convection, if necessary.Note 4. Fly 3-4, as describe in segment 1-2; however if full circle done in first pass, only half circle is required.Note 5. Duration 1624 nm, or 3.7 hours + 1 hour for deviations—pattern could be extended if time allows for greater radial coverageNote 6. Aircraft should operate at its maximum cruising altitude of ~40-45 kftNote 7. As flight duration and ATC allow, attempt to sample with TDR, as much of regions missed by deviations.Note 8. Tail Doppler radar should be operated in single PRF, 3000 per second.Note 9. If flying above 40,000 ft., pattern may be flown clockwise, if preferred.
-53-
1, 18
2
3
4
5
6
7
8
9
10 111213
14
1516
17
Duration: 5.5 h
300 nm
Preferred track (if safe)
G-IV Surveillance/TDR combination pattern
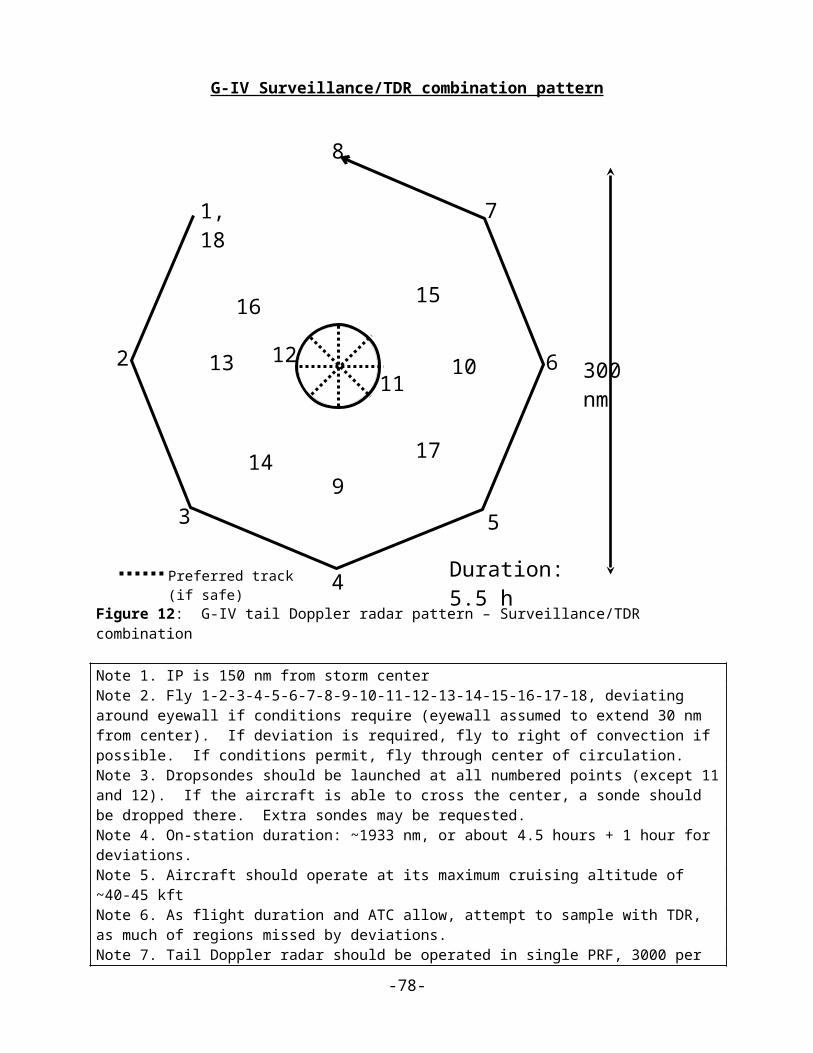
Figure 12: G-IV tail Doppler radar pattern – Surveillance/TDR combination
Note 1. IP is 150 nm from storm centerNote 2. Fly 1-2-3-4-5-6-7-8-9-10-11-12-13-14-15-16-17-18, deviating around eyewall if conditions require (eyewall assumed to extend 30 nm from center). If deviation is required, fly to right of convection if possible. If conditions permit, fly through center of circulation.Note 3. Dropsondes should be launched at all numbered points (except 11 and 12). If the aircraft is able to cross the center, a sonde should be dropped there. Extra sondes may be requested.Note 4. On-station duration: ~1933 nm, or about 4.5 hours + 1 hour for deviations.Note 5. Aircraft should operate at its maximum cruising altitude of ~40-45 kftNote 6. As flight duration and ATC allow, attempt to sample with TDR, as much of regions missed by deviations.Note 7. Tail Doppler radar should be operated in single PRF, 3000 per second.Note 8. If flying above 40,000 ft., pattern may be flown clockwise, if preferred.
-54-
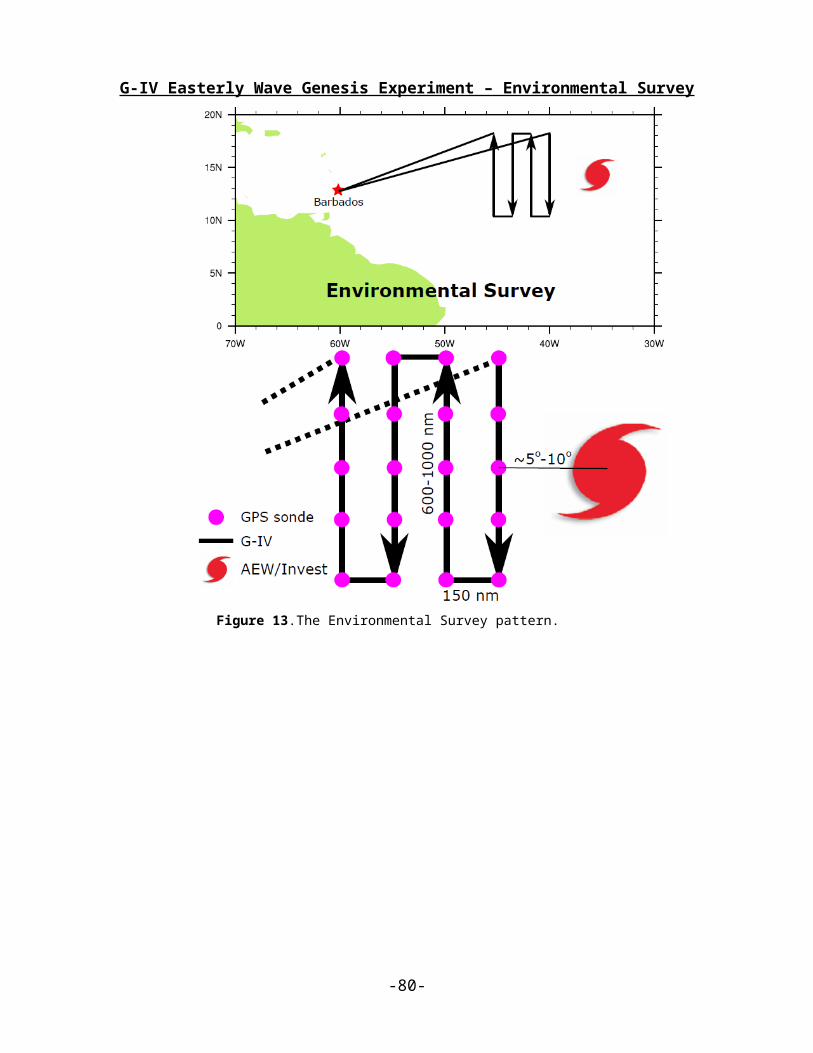
G-IV Easterly Wave Genesis Experiment – Environmental Survey
-55-
Figure 13. The Environmental Survey pattern.
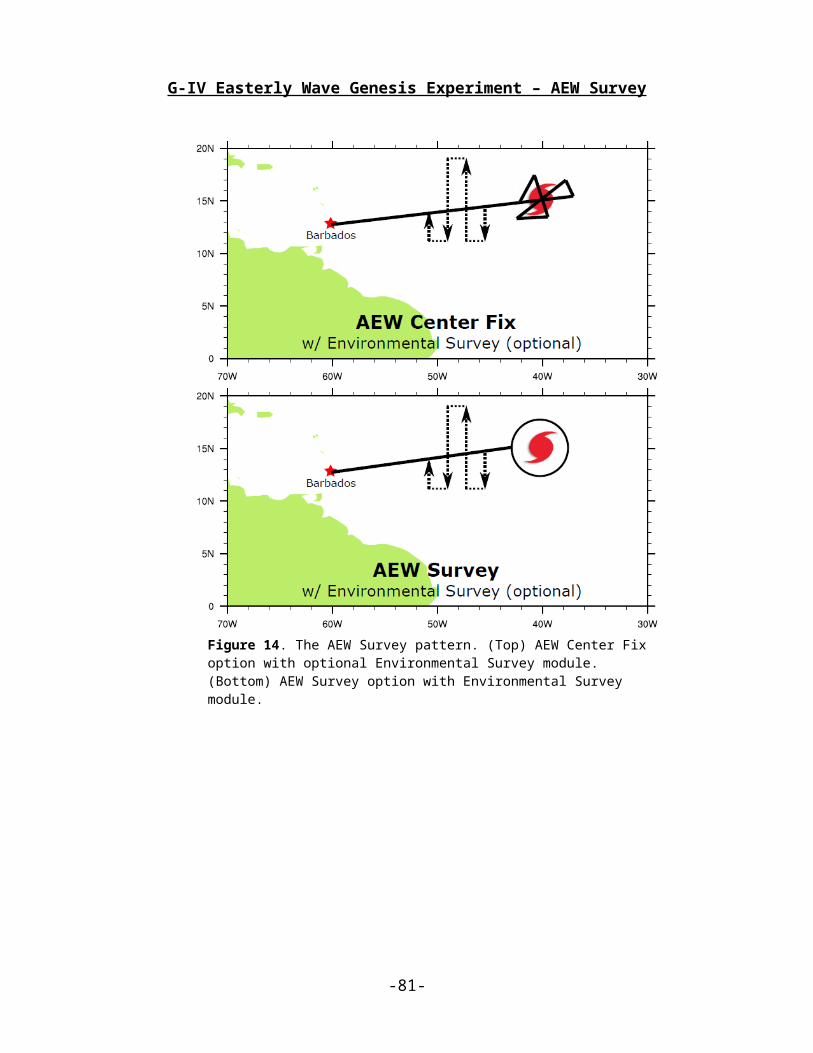
G-IV Easterly Wave Genesis Experiment – AEW Survey
-56-
Figure 14. The AEW Survey pattern. (Top) AEW Center Fix option with optional Environmental Survey module. (Bottom) AEW Survey option with Environmental Survey module.

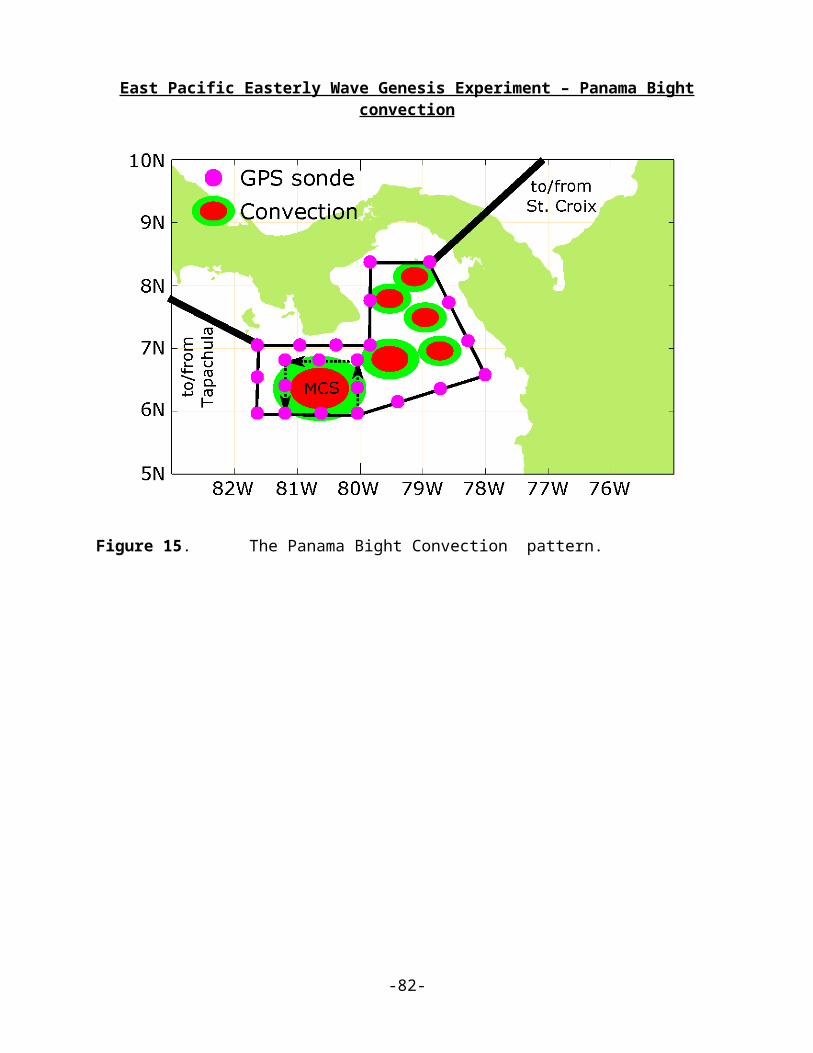
East Pacific Easterly Wave Genesis Experiment – Panama Bight convection
Figure 15. The Panama Bight Convection pattern.
-57-

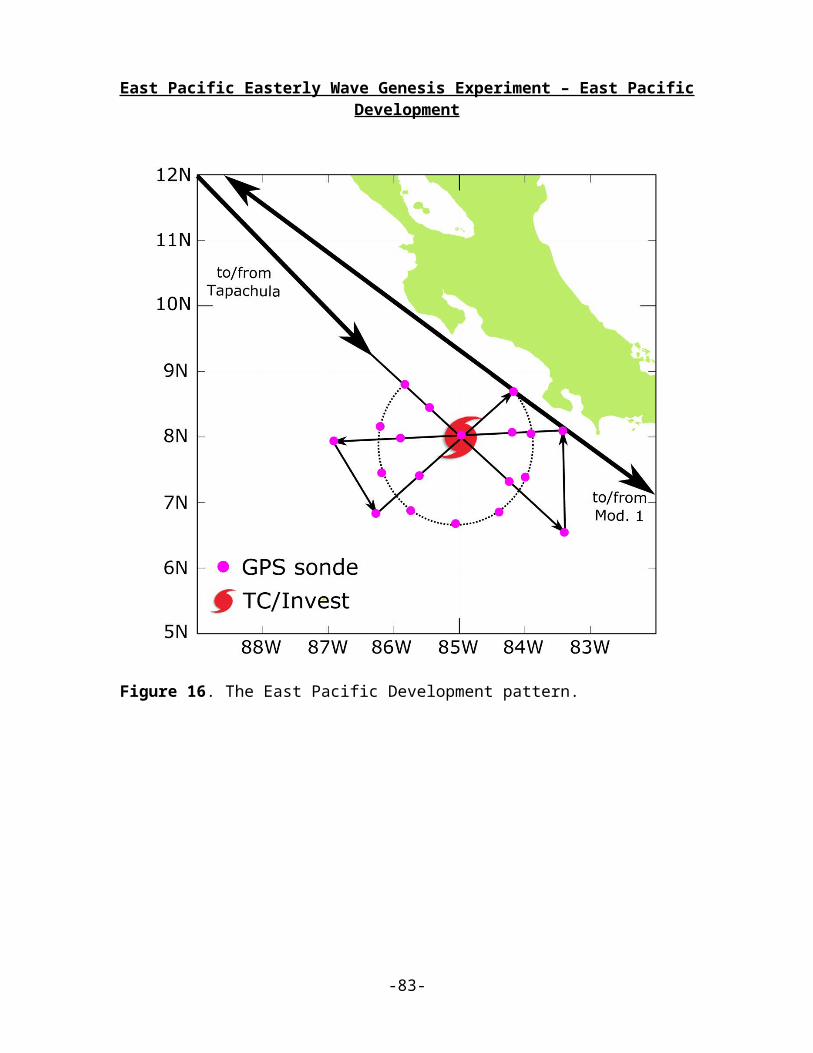
East Pacific Easterly Wave Genesis Experiment – East Pacific Development
Figure 16. The East Pacific Development pattern.
-58-

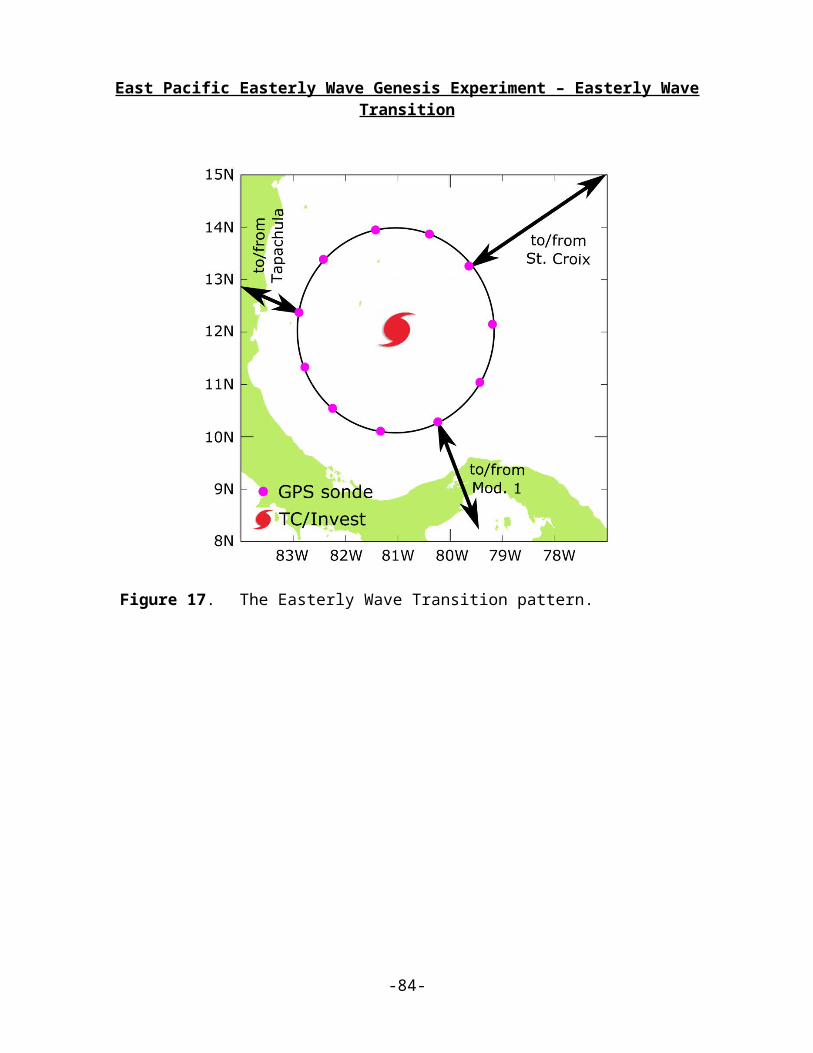
East Pacific Easterly Wave Genesis Experiment – Easterly Wave Transition
Figure 17. The Easterly Wave Transition pattern.
-59-
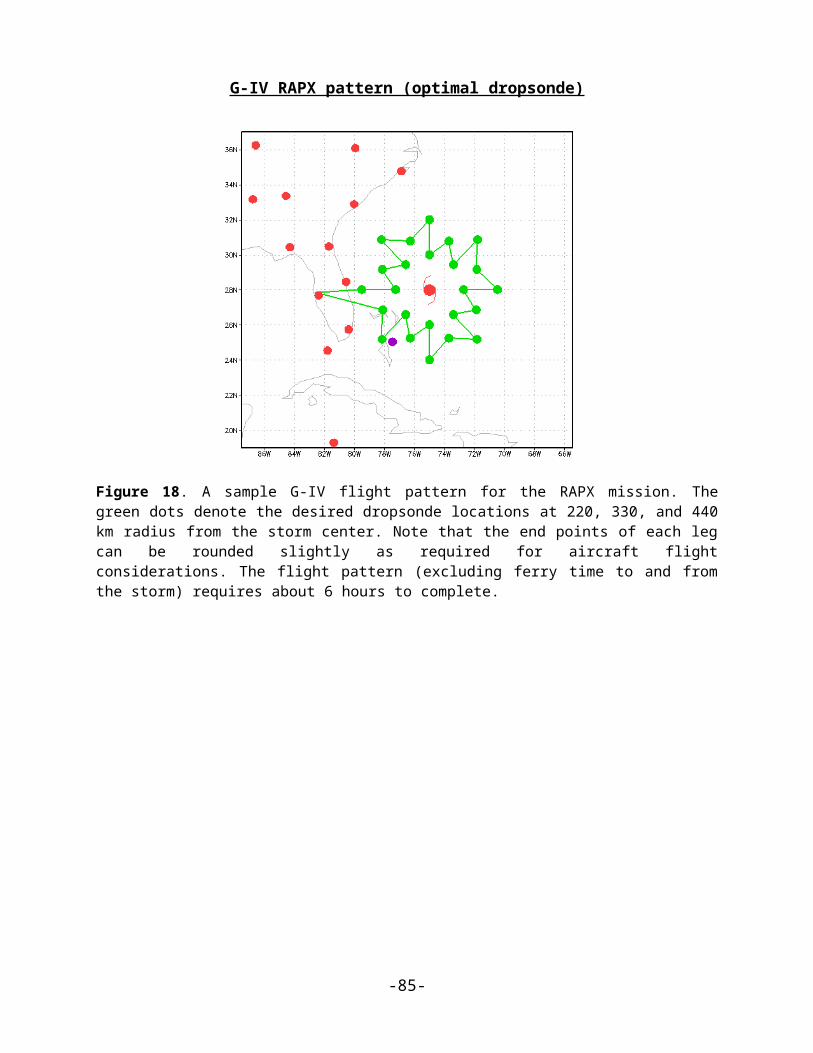
G-IV RAPX pattern (optimal dropsonde)
Figure 18. A sample G-IV flight pattern for the RAPX mission. The green dots denote the desired dropsonde locations at 220, 330, and 440 km radius from the storm center. Note that the end points of each leg can be rounded slightly as required for aircraft flight considerations. The flight pattern (excluding ferry time to and from the storm) requires about 6 hours to complete.
-60-

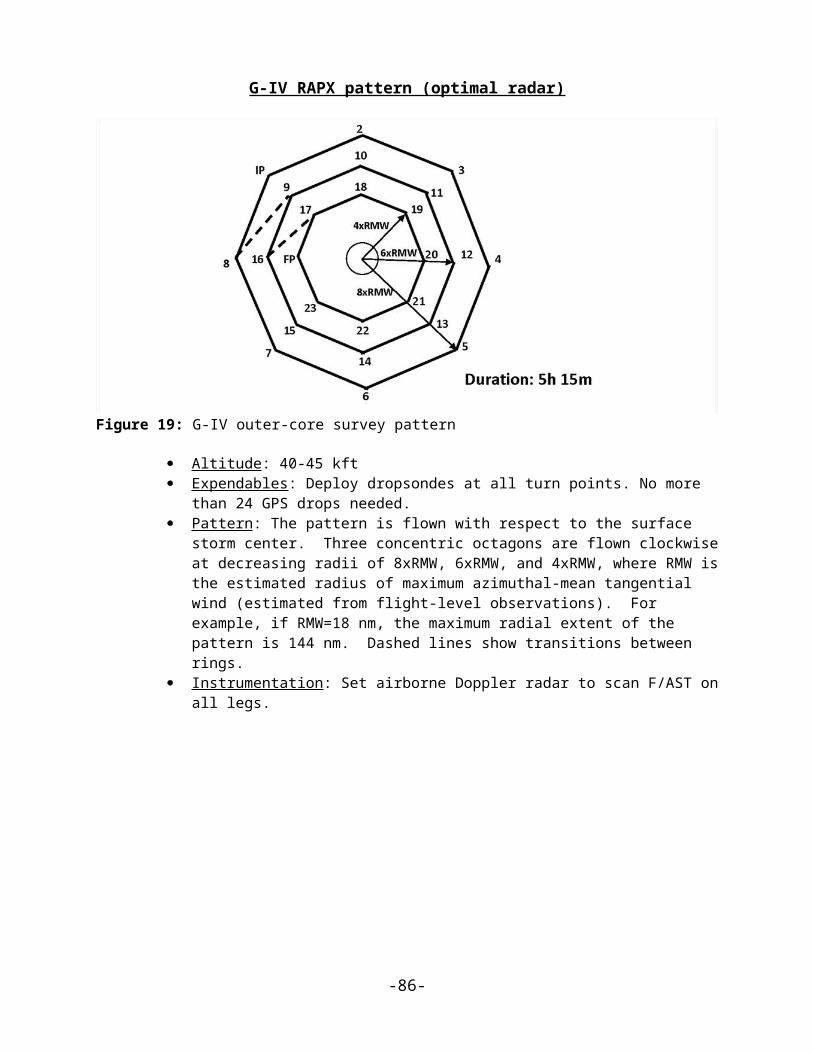
G-IV RAPX pattern (optimal radar)
Figure 19: G-IV outer-core survey pattern
Altitude : 40-45 kft Expendables : Deploy dropsondes at all turn points. No more than 24 GPS drops needed. Pattern : The pattern is flown with respect to the surface storm center. Three concentric
octagons are flown clockwise at decreasing radii of 8xRMW, 6xRMW, and 4xRMW, where RMW is the estimated radius of maximum azimuthal-mean tangential wind (estimated from flight-level observations). For example, if RMW=18 nm, the maximum radial extent of the pattern is 144 nm. Dashed lines show transitions between rings.
Instrumentation : Set airborne Doppler radar to scan F/AST on all legs.
-61-
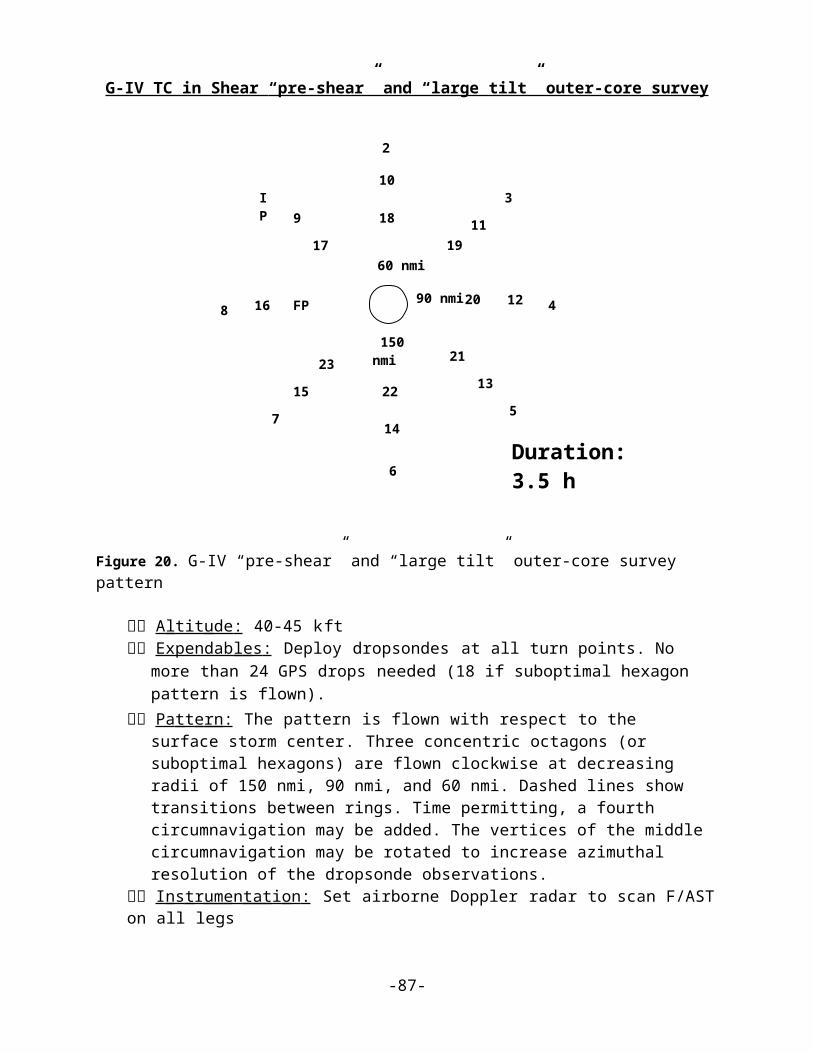
G-IV TC in Shear “pre-shear” and “large tilt” outer-core survey
Figure 20. G-IV “pre-shear” and “large tilt” outer-core survey pattern
A ltit ude : 40-45 kft Expendab l es : Deploy dropsondes at all turn points. No more than 24 GPS drops
needed (18 if suboptimal hexagon pattern is flown). Pa tt e r n : The pattern is flown with respect to the surface storm center. Three
concentric octagons (or suboptimal hexagons) are flown clockwise at decreasing radii of 150 nmi, 90 nmi, and 60 nmi. Dashed lines show transitions between rings. Time permitting, a fourth circumnavigation may be added. The vertices of the middle circumnavigation may be rotated to increase azimuthal resolution of the dropsonde observations.
I ns tr u m en t a ti on : Set airborne Doppler radar to scan F/AST on all legs
-62-
150 nmi
90 nmi
60 nmi17
18
22
21
20
19
23
FP
9
16
15
14
13
12
11
10
7
8
6
4
5
3
2
I
Duration: 3.5 h
P-3TC in Shear – “pre-shear” core-region survey
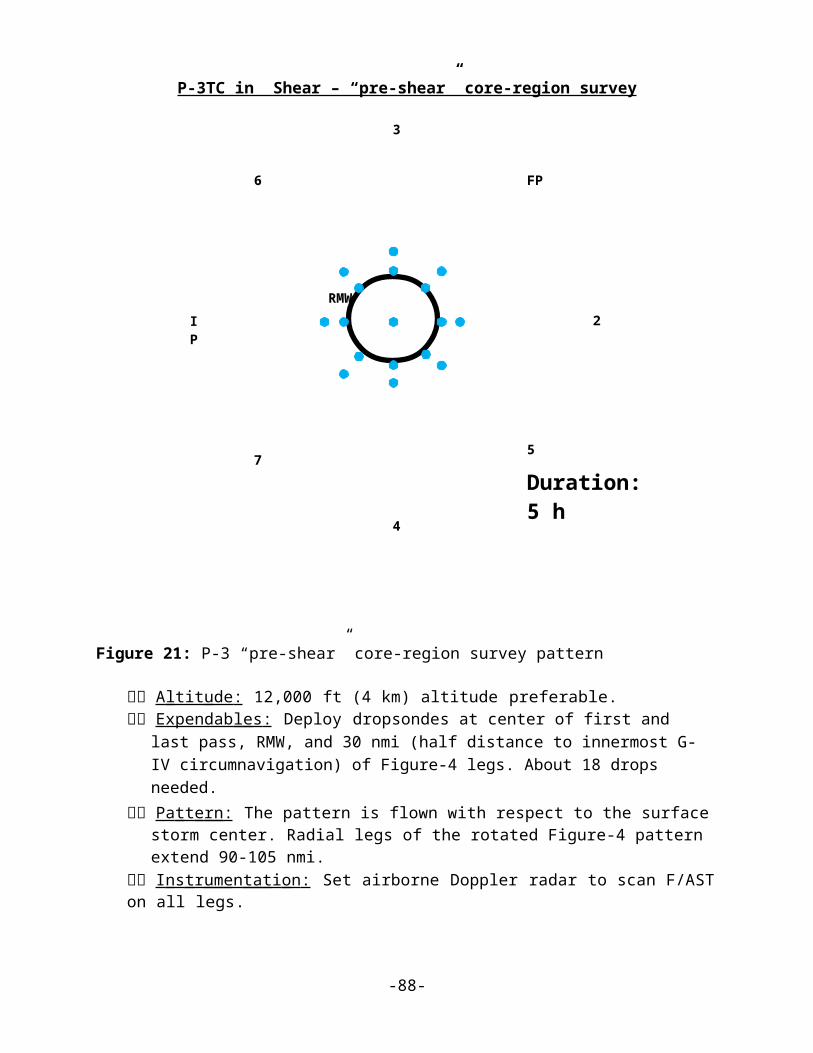
Figure 21: P-3 “pre-shear” core-region survey pattern
A ltit ude : 12,000 ft (4 km) altitude preferable. Expendab l es : Deploy dropsondes at center of first and last pass, RMW, and 30 nmi
(half distance to innermost G-IV circumnavigation) of Figure-4 legs. About 18 drops needed.
Pa tt e r n : The pattern is flown with respect to the surface storm center. Radial legs of the rotated Figure-4 pattern extend 90-105 nmi.
I ns tr u m en t a ti on : Set airborne Doppler radar to scan F/AST on all legs.
-63-
5
6
7
FP
4
3
2IP
RMW
Duration: 5 h
P-3TC in Shear – “threshold shear”, “large tilt”, and “realignment/recovery” core region
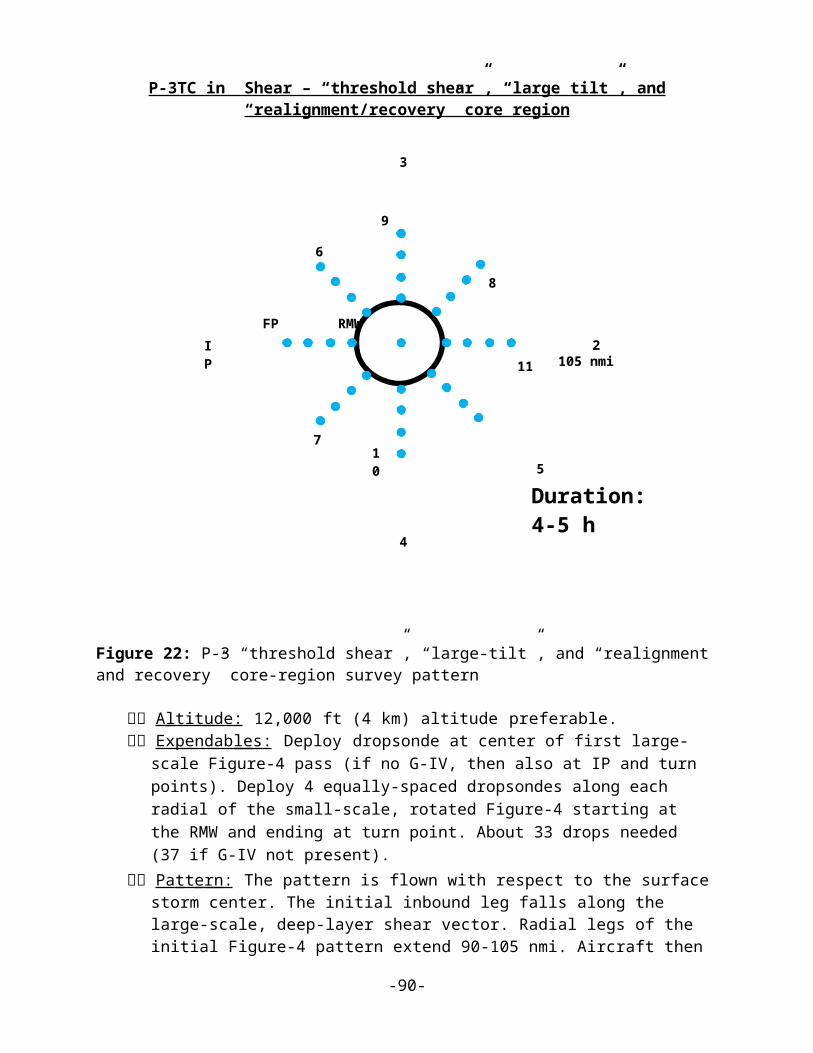
Figure 22: P-3 “threshold shear”, “large-tilt”, and “realignment and recovery” core-region survey pattern
A ltit ude : 12,000 ft (4 km) altitude preferable. Expendab l es : Deploy dropsonde at center of first large-scale Figure-4 pass (if no G-
IV, then also at IP and turn points). Deploy 4 equally-spaced dropsondes along each radial of the small-scale, rotated Figure-4 starting at the RMW and ending at turn point. About 33 drops needed (37 if G-IV not present).
Pa tt e r n : The pattern is flown with respect to the surface storm center. The initial inbound leg falls along the large-scale, deep-layer shear vector. Radial legs of the initial Figure-4 pattern extend 90-105 nmi. Aircraft then flies 45 deg downwind (4 -> 5) to begin small-scale rotated Figure-4. Legs should extend just beyond the primary region of organized convection outside the eyewall (~15-30 nmi beyond RMW).
I ns tr u m en t a ti on : Set airborne Doppler radar to scan F/AST on all legs.
-64-
FP
11
10
9
7
8
5
6
4
3
2IP
RMW
105 nmi
Duration: 4-5 h
S⃗

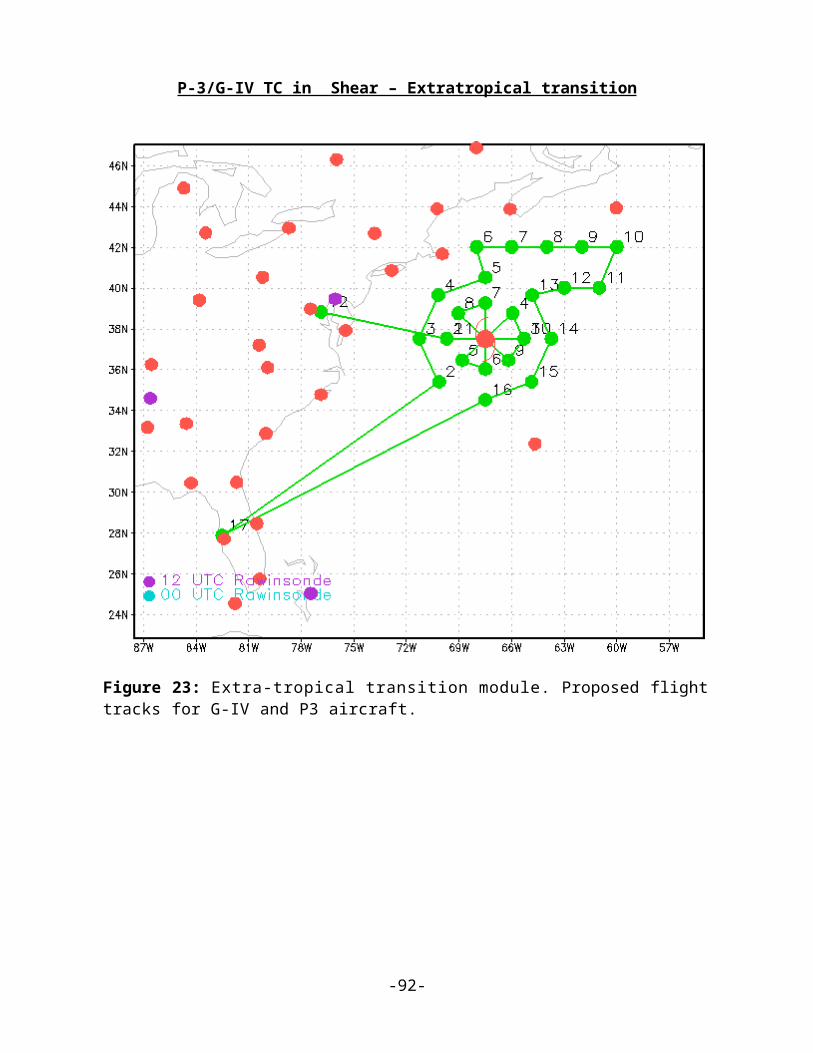
P-3/G-IV TC in Shear – Extratropical transition
Figure 23: Extra-tropical transition module. Proposed flight tracks for G-IV and P3 aircraft.
-65-
G-IV Diurnal Cycle Star pattern
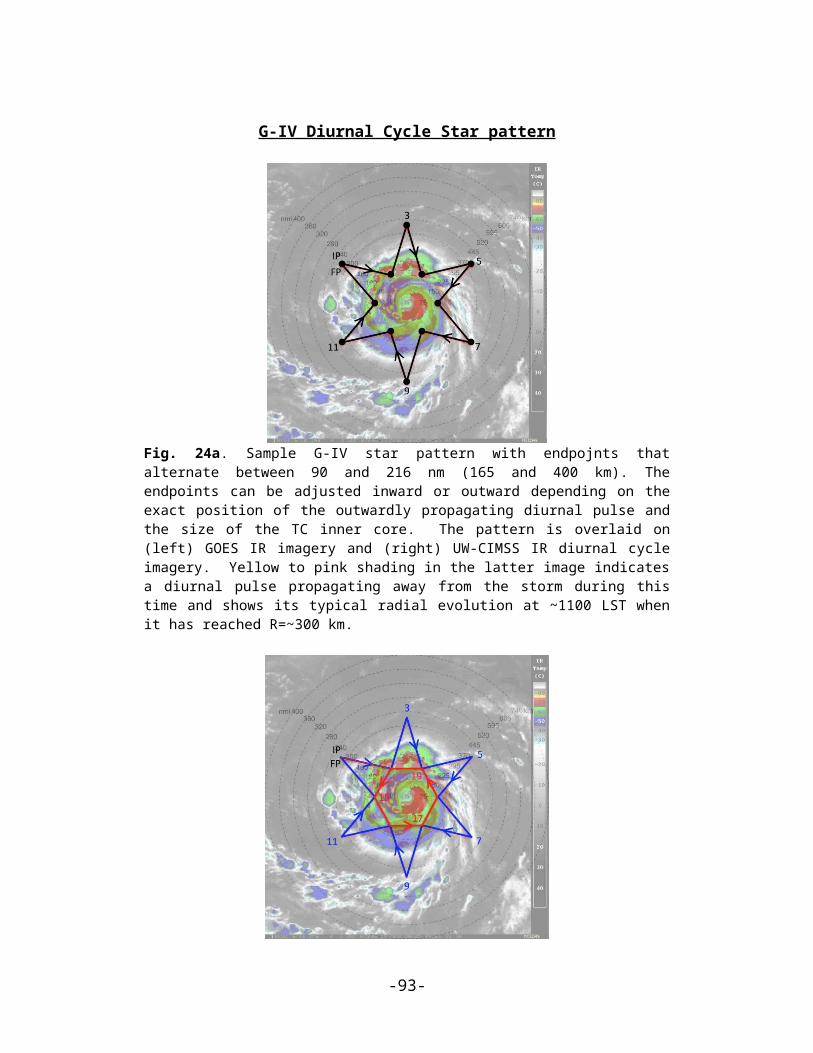
Fig. 24a. Sample G-IV star pattern with endpojnts that alternate between 90 and 216 nm (165 and 400 km). The endpoints can be adjusted inward or outward depending on the exact position of the outwardly propagating diurnal pulse and the size of the TC inner core. The pattern is overlaid on (left) GOES IR imagery and (right) UW-CIMSS IR diurnal cycle imagery. Yellow to pink shading in the latter image indicates a diurnal pulse propagating away from the storm during this time and shows its typical radial evolution at ~1100 LST when it has reached R=~300 km.
Fig. 24b. Same as in Fig. 24a, except that a circumnavigation of the storm is performed after (or before) the star pattern is completed. The hexagon circumnavigation that is shown has points that are 90 nm (165 km) from the storm center, but can be adjusted outward for safety considerations depending on the strength and size of the TC.
-66-

P-3 Pre- or post-storm Ocean survey patterns
Figure 25. Left: Post-storm ocean sampling flight pattern (red line), over previously-sampled area (black box). In this example, the pattern extends around 470 km in the along-track dimension, or around 0.75 of a near-inertial wavelength. Right: Flight pattern with expendable drop locations, consisting of a combination of AXCP and AXBT probes.
-67-
P-3 Pre- or post-storm Ocean survey patterns
Figure 2 6 a : Typical pre- or post-storm pattern with ocean expendable deployment locations relative to the Loop Current. Specific patterns will be adjusted based on actual and forecasted storm tracks and Loop Current locations. Missions generally are expected to originate and terminate at KMCF.
Figure 26b: Track-dependent AXBT/AXCTD ocean survey. As for the Loop Current survey, a total of 60-80 probes would be deployed on a grid (blue dots).
-68-

P-3 In-storm Ocean survey pattern (over existing drifter array)
Figure 27: P-3 pattern over float and drifter array. The array has been distorted since its deployment on the previous day and moves relative to the storm during the survey. The pattern includes two legs along the array (waypoints 1-6 and 13-18) and an 8 radial line survey. Dropwindsondes are deployed along all legs, with double deployments at the floats. AXBTs are deployed in the storm core.
-69-
Global Hawk Survey patterns
Figure 28. Sample GH flight patterns for the 2016 NOAA SHOUT field campaign. (Left) sequence of small-large-small butterflies. The small butterfly patterns have 120 nm (220 km) radial legs and take ~3-hr to complete while the large butterfly pattern has 240 nm (450 km) legs and takes ~6.5-hr to complete. (Right) rotated butterfly pattern with 30 degree rotated radials that are 240 nm (450 km) in length from the storm center. Both GH patterns would be flown in a storm relative framework.
-70-

J.2 Patterns from Modules
P-3 DWL SAL module
Fig. 29: Sample WP-3D flight track during the ferry to/from the storm and GPS dropsonde points for the P-3DWL SAL module.
-71-
P-3/Coyote SUAVE eye/eyewall module
Figure 30. P3 (top) and Coyote (bottom) patterns for SUAVE eye/eyewall module
-72-

P-3/Coyote SUAVE eye/eyewall module (continued)
Figure 30. Coyote pattern for SUAVE eye/eyewall module
-73-
P-3 SUAVE “short-leg” figure-4
Figure 31. (P-3 ‘short leg’ figure 4 pattern)
-74-

P-3/Coyote SUAVE PBL entrainment flux module
Figure 32. Vertical cross-section of the stepped-descent module. P3 pattern is in black, low altitude Coyote UAS in heavy blue. Alternatively, the P3 could stay at the highest altitude shown here (i.e., 3.0 km), while the Coyote performs the stepped descent.
-75-
P-3/Coyote SUAVE Boundary Layer inflow module
Figure 3 3 (from the HFP Boundary Layer Inflow Experiment): Boundary Layer Inflow Module. GPS dropwindsondes (34 total) are deployed at 105 nmi and 60 nmi radii and at the radius of maximum wind along each of 8 radial legs (rotated alpha/Figure-4 pattern). On 4 of the 8 passes across the RMW, rapid deployment (~1 min spacing) of 3 sondes is requested. Center drops are requested on the initial and final pass through the eye. AXBT (16 total) deployments are paired with dropsondes at the indicated locations. Flight altitude is as required for the parent TDR mission, and initial and final points of the pattern are dictated by these same TDR mission requirements. Projected Coyote UAS spiral inflow pattern (in heavy blue) is overlayed.
-76-

Coyote SUAVE RMW mapping module
Figure 34: Radius of Maximum Wind (RMW) Mapping. For this module the NOAA P3 pattern is shown in Figure 4-2a. P3 would not be required to continuously loiter. However, P3-UAS range considerations would need to be taken into consideration. Optimally up to 10 GPS/IR sondes would be deployed along with 5 AXBTs. These data would be used to compare with similar ocean/atmospheric data collected by the Coyote UAS. Coyote UAS track is shown in red while the hurricane RMW is denoted by a green ring. Once the UAS is deployed from the P3 within the eye, the Coyote descends to the desired altitude of 300m. Once at this level, the UAS proceeds to the eyewall and begins a counter clockwise flight path. Once the RMW is reached, the UAS continues radially outward and downwind until the maximum wind attained by the platform decreases by ~10-20%. Once this is level is achieved, the Coyote heads inbound and downwind until it enters the storm eye. This sequence would continue for the duration of the mission.
-77-
Coyote SUAVE Eddy dissipation module
Figure 35: Eddy dissipation measurements. The Coyote begins the experiment at a height of 350 m, descends at a constant rate of 1/6 = 0.167 m s-1, and reaches a height of 50 m after 30 minutes. The entire descent is conducted at a constant radius from the storm center (preferably at the radius of maximum wind).
-78-

P-3 SFMR-HI module
Figure 36: Flight pattern for module flown in Hurricane Gustav (2008) in a rain-free portion of the eyewall experiencing approximately 35 ms-1 surface winds (top panel). Time series of P-3 roll angle during period of turns in Gustav (bottom panel).
-79-
P-3 Offshore Wind Module
Figure 37: Schematic of piggyback pattern showing hypothetical wind farm fly-by with expendable launches at a 2-4 km interval. No U.S. wind farms are yet in operation. (Dong Energy Gunfleet Sands 1farm off SE England)
-80-
P-3 Offshore Intense Convection Module
Fig. 38. Offshore Intense convection module.
Notes:
The IP should be a minimum of 90 nm (150 km) from the storm center. The first leg (IP-2) starts 13 km (25 km) inside the rain band axis. Legs IP-2 and 3-4 should be ~10-13 (20-25 km) downwind and upwind of the target cells to ensure adequate Doppler coverage. Legs 2-3 and 4-IP should be 13 nm inside and outside the rain band axis. The length of legs 2-3 and 4-IP can be adjusted but should be 40 nm (75 km) at a minimum. Deploy GPS dropwindsondes at the start or end points of each leg, at the band axis crossing points, and at ~10-13 nm intervals along each leg parallel to the band. The interval at which GPS dropwindsondes are deployed depends on how many are available, but at least 2 GPS dropwindsondes should be deployed on either side of the convection and at least 1 dropwindsonde should be deployed each time the band-axis is crossed (for a minimum of 6 GPS dropwindsondes). Aircraft altitude should be at 10,000 ft. (3.0 km) or higher. Set airborne Doppler to scan in F/AST mode on all legs. Aircraft should avoid penetration of intense reflectivity regions (particularly over land).
-81-
P-3 Coastal Survey Module
Fig. 39. Coastal Survey module.
Notes:
First pass starts 80 nm (150 km) from center or at radius of gale-force wind speeds, whichever is closer. Pass from1-2 should be 6-10 nm (10-15 km) offshore for optimum SFMR measurements. Release GPS dropwindsondes at RMW, and 7.5, 15, 30, 45, and 60 or 75 nm (12.5, 25, 50, 75, and 100 or 125 km) from RMW on either side of storm in legs 1-2 and 3-4. GPS dropwindsondes should be deployed quickly at start of leg 5-6, and then every 6-10 nm hereafter. Set airborne Doppler on all legs with single PRF > 2400 and 20% tilt. Aircraft should avoid penetration of intense reflectivity regions (particularly those over land)
-82-
P-3 Real-time Module
Fig. 40. Real-time module.
Notes:
TAS calibration required. The legs through the eye may be flown along any compass heading along a radial from the ground-based radar. The IP is approximately 100 nm (185 km) from the storm center. Downwind legs may be adjusted to pass over buoys. P-3 should fly legs along the WSR-88D radials.Aircraft should avoid penetration of intense reflectivity regions (particularly those over land). Wind center penetrations are optional.
-83-
P-3 Convective burst Module
IP, 81
2
3
4
5 6
7
FP
High-altitude aircraft flies above P3 for dropsonde and microphysical information
Low cloud boundary
30 dBZ
40 dBZ core
GPS dropsonde
30 km
RMW
RMW
High-altitude aircraft flies above P3 for dropsonde and microphysical information
IP, FP2, 4, 6, etc.
30 km
Low cloud boundary
30 dBZ
40 dBZ core
GPS dropsonde
(a)
(b)
Figure 41: P-3 Convective burst module. (a) circumnavigation for when burst is well outside RMW or within a TC of tropical depression strength or less; (b) bowtie pattern for when burst is within or near RMW of tropical storm or hurricane.
Altitude : 12,000 ft (4 km) altitude preferable. Expendables : Release dropsondes at turn points and at intermediate points as indicated in Figure.
Additionally, release 1-2 drops during penetration of convective system. No more than 15 dropsondes needed for this module.
Pattern : Circumnavigation (IP to point 6) by single P-3 when burst is outside RMW or in weak system. Then fly convective crossing (6-7-FP). Repeat circumnavigation (time permitting). If available, high-altitude aircraft (e.g., ER-2 or Global Hawk) flies either racetrack or bowtie pattern during P-3 circumnavigation, flies vertically aligned with P-3 during convective crossing. Repeated radial penetration (i.e. bowtie) when burst is inside or near RMW of tropical storm or hurricane.
Instrumentation : Set airborne Doppler radar to scan F/AST on all legs.
-84-
P-3 Eye-eyewall Mixing Module
Figure 42. The P-3 approaches from the north, penetrates the eyewall into the eye, and descends below the inversion while performing a figure-4 (dotted line) in the eye. The P-3 circumnavigates the eye in an octagon or pentagon (solid line), and then ascends while conducting another figure-4 (time permitting) rotated 45 degrees from the original (dashed line).
-85-
P-3/G-IV SEF/ERC “pre-SEF” Module
(a)
(b)Figure 43: (a) P-3 Rotating figure-four pattern with Coyote deployed inflow path (dashed line; proposed launch point for Coyote Inflow Module indicated by triangle) overlain on a sample 85 GHz satellite image, showing pre-SEF, to depict features to target. Circles indicate dropsonde locations; open squares indicate AXBT deployment locations. Alternatively, the use of IR sondes would be preferred. This scenario may be combined with DWL Experiment. (b) G-IV circumnavigation pattern.
-86-
P-3/G-IV SEF/ERC “post-SEF” Module
(a)
(b)Figure 44: (a) P-3 Rotating figure-four pattern with Coyote deployed inflow path (dashed line; proposed launch point for Coyote inflow module indicated by triangle) overlain on a sample 85 GHz satellite image, showing post-SEF, to depict features to target. Circles indicate dropsonde locations; open squares indicate AXBT deployment locations. Alternatively, the use of IR sondes would be preferred. This scenario may be combined with DWL module. (b) G-IV circumnavigation pattern
-87-
G-IV Warm Core (weak system) module
Figure 45. Sample G-IV 8x8 degree lawn mower pattern with areal coverage of ~900x900 km, leg spacing of 2 degrees, 2 center crossings made during figure 4 pattern at the end of the path, and a duration of ~8 hours. Blue dots are dropsonde deployment locations. The clouds represent the area of interest and the red symbol indicates the approximate location of the center of this region.
-88-

P-3 Hurricane Boundary Layer Stepped Descent module
Figure 46: Plan view (top) of the preferred location for the stepped-descent module. Red line shows aircraft track. (bottom) Vertical cross section of the stepped-descent module.
-89-
P-3/G-IV Arc Cloud Module
Figure 47: The G-IV (or WP-3D) flight track inbound or outbound to/from the TC/AEW. Azimuth and length of GPS dropsonde sequences during G-IV missions will be dictated by the pre-determined flight plan. For these cases, any G-IV flight legs that transect through the trailing and leading edges of the arc cloud are candidates for this module. When multiple arc clouds are present, the feature closest to the pre-determined flight track is desirable.
-90-

P-3 Arc Cloud Module (Multi-level option)
Figure 48: The WP-3D flight track for the multi-level option. Azimuth and length of initial midlevel pass with GPS dropsonde sequence will be dictated by the pre-determined flight plan. Lengths of the low-level passes should span much of the distance between the arc cloud and its initiating convection, while flight altitudes should be near the top and middle of any near-surface density currents (adjusting for safe aircraft operation as needed).
-91-
ACRONYMS AND ABBREVIATIONS
e equivalent potential temperature
ABL atmospheric boundary-layerA/C aircraftACLAIM Airborne Coherent Lidar for Advanced In-flight MeasurementsAES Atmospheric Environment Service (Canada)AFRES U. S. Air Force ReserveAOC Aircraft Operations CenterAOML Atlantic Oceanographic and Meteorological LaboratoryASDL aircraft-satellite data linkAXBT airborne expendable bathythermographAXCP airborne expendable current probeAXCTD airborne expendable conductivity, temperature, and depth probe
CARCAH Chief, Aerial Reconnaissance Coordinator, All HurricanesCDO central dense overcastCIRA Cooperative Institute for Research in the AtmosphereC-MAN Coastal-Marine Automated NetworkCP coordination pointCW cross wind
DLM deep-layer meanDOD Department of DefenseDOW Doppler on WheelsDRI Desert Research Institute (at Reno)
E vector electric fieldEPAC Eastern PacificETL Environmental Technology LaboratoryEVTD extended velocity track display
FAA Federal Aviation AdministrationF/AST fore and aft scanning techniqueFEMA Federal Emergency Management AgencyFL flight levelFP final pointFSSP forward scattering spectrometer probe
GFDL Geophysical Fluid Dynamics LaboratoryG-IV Gulfstream IV-SP aircraftGOMWE Gulf of Mexico Warm EddyGPS global positioning system
HL Hurricanes at LandfallHRD Hurricane Research Division
INE inertial navigation equipmentIP initial point (or initial positionIWRS Improved Weather Reconnaissance System
JW Johnson-WilliamsKu-SCAT Ku-band scatterometer
LF lower fuselage (radar)LIP Lightning Instrument PackageLPS Lead Project Scientist
MCS mesoscale convective systemsMLD Mixed Layer Depth MPO Meteorology and Physical Oceanography
-92-
NASA National Aeronautics and Space AdministrationNCAR National Center for Atmospheric ResearchNCEP National Centers for Environmental PredictionNDBC NOAA Data Buoy CenterNESDIS National Environmental Satellite, Data and Information ServiceNHC National Hurricane CenterNOAA National Oceanic and Atmospheric AdministrationNWS National Weather Service
OML oceanic mixed-layer
PDD pseudo-dual DopplerPMS Particle Measuring SystemsPOD Plan of the DayPPI plan position indicatorPV potential vorticity
RA radar altitudeRAOB radiosonde (upper-air observation)RAWIN rawinsonde (upper-air observation)RECCO reconnaissance observationRHI range height indicatorRSMAS Rosenstiel School of Marine and Atmospheric Science
SFMR Stepped-Frequency Microwave RadiometerSLOSH sea, lake, and overland surge from hurricanes (operational storm surge model)SRA Scanning Radar AltimeterSST sea-surface temperature
TA tail (radar)TAS true airspeedTC tropical cycloneTOPEX The Ocean Topography Experiment
UMASS University of Massachusetts (at Amherst)USACE United States Army Corps of EngineersUSAF United States Air ForceUSWRP U. S. Weather Research ProgramUTC universal coordinated time (U.S. usage; same as “GMT” and "Zulu" time)
VTD velocity-track display
-93-

Acknowledgments
The preparation of HRD's 2016 Hurricane Field Program Plan was a team effort. The authors would like to express their appreciation to: the HRD scientists that contributed information on specific experiments.
-94-