Embed Size (px)
Citation preview
0
Asia’s Fashion Jewellery &
Accessories Fair – September 2017
1
2
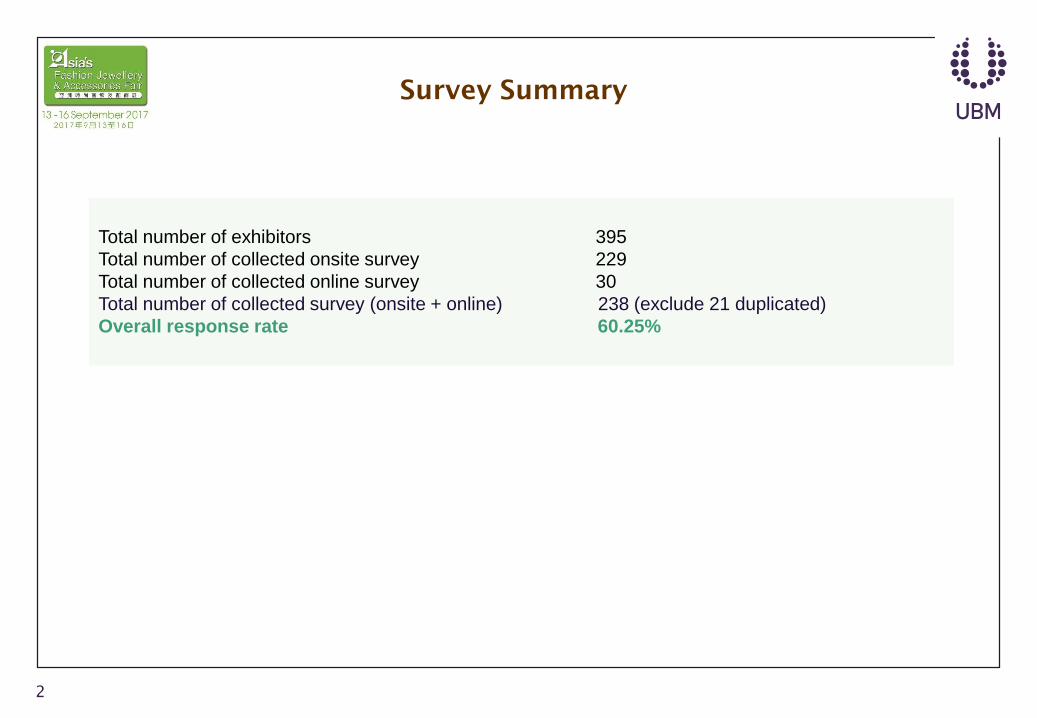
Total number of exhibitors 395
Total number of collected onsite survey 229
Total number of collected online survey 30
Total number of collected survey (onsite + online) 238 (exclude 21 duplicated)
Overall response rate 60.25%
Survey Summary
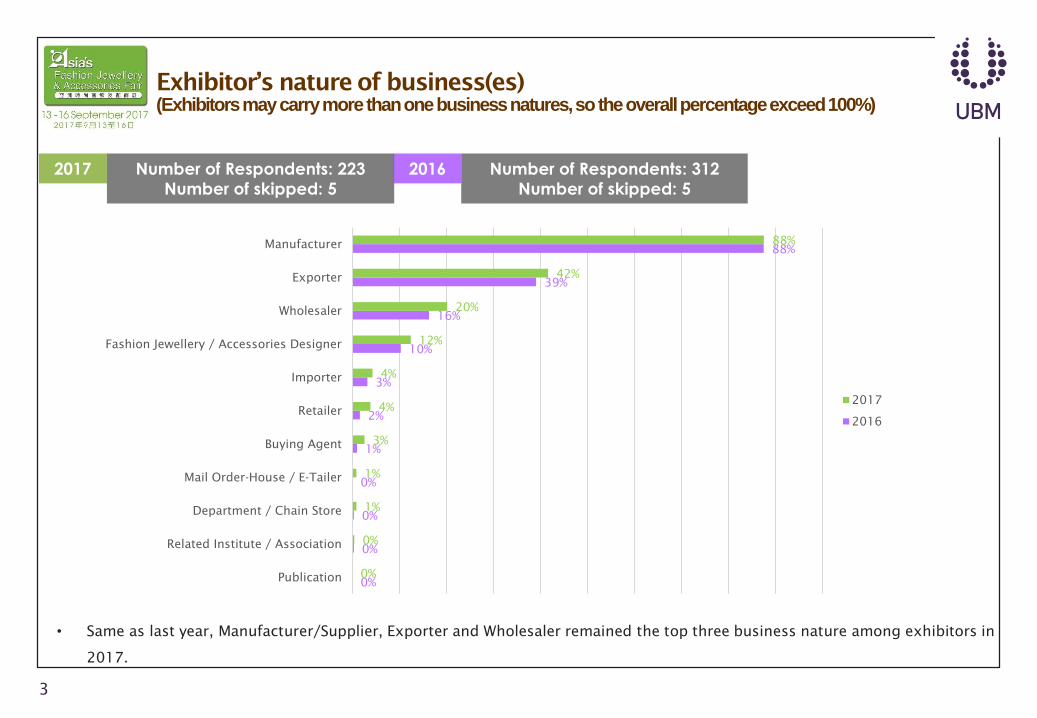
Exhibitor’s nature of business(es)
(Exhibitors may carry more than one business natures, so the overall percentage exceed 100%)
3
• Same as last year, Manufacturer/Supplier, Exporter and Wholesaler remained the top three business nature among exhibitors in
2017.
0%
0%
0%
0%
1%
2%
3%
10%
16%
39%
88%
0%
0%
1%
1%
3%
4%
4%
12%
20%
42%
88%
Publication
Related Institute / Association
Department / Chain Store
Mail Order-House / E-Tailer
Buying Agent
Retailer
Importer
Fashion Jewellery / Accessories Designer
Wholesaler
Exporter
Manufacturer
2017
2016
2017 Number of Respondents: 223
Number of skipped: 5
Number of Respondents: 312
Number of skipped: 5
2016
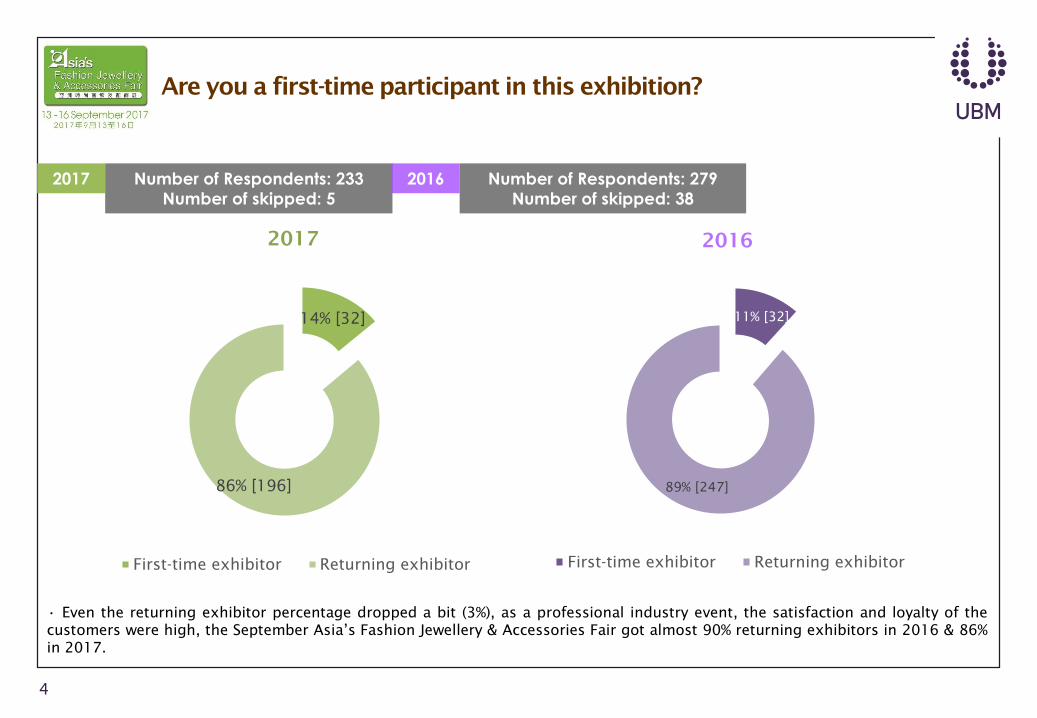
Are you a first-time participant in this exhibition?
4
• Even the returning exhibitor percentage dropped a bit (3%), as a professional industry event, the satisfaction and loyalty of the
customers were high, the September Asia’s Fashion Jewellery & Accessories Fair got almost 90% returning exhibitors in 2016 & 86%
in 2017.
11% [32]
89% [247]
2016
First-time exhibitor Returning exhibitor
14% [32]
86% [196]
2017
First-time exhibitor Returning exhibitor
2017 Number of Respondents: 233
Number of skipped: 5
Number of Respondents: 279
Number of skipped: 38
2016

Overall, how would you rate your satisfaction with your experience at
Asia’s Fashion Jewellery & Accessories Fair – September?
(0 = Extremely dissatisfied, 10 = Extremely satisfied)
5
• The satisfaction level among exhibitors were on average level. The CSAT of both years are very closed, a very slight decrease
(0.13) from 2016.
• 27.07% of exhibitors gave rating 8 -10 in 2017 and 23.81% in 2016, had a 3.26% increase from 2016.
CSAT 2017
5.66
CSAT 2016
5.79
3.06% [7]
2.62% [6]
5.68% [13]
8.73% [20]
8.73% [20]
17.03% [39]
15.72% [36]
11.35% [26]
17.90% [41]
3.06% [7]
6.11% [14]
1.90% [6]
3.49% [11]
3.81% [12]
6.35% [20]
9.84% [31]
16.19% [51]
18.73% [59]
15.87% [50]
13.97% [44]
4.76% [15]
5.08% [16]
0%
2%
4%
6%
8%
10%
12%
14%
16%
18%
20%
0 1 2 3 4 5 6 7 8 9 10
2017
2016
2017 Number of Respondents: 229
Number of skipped: 9
Number of Respondents: 315
Number of skipped: 2
2016
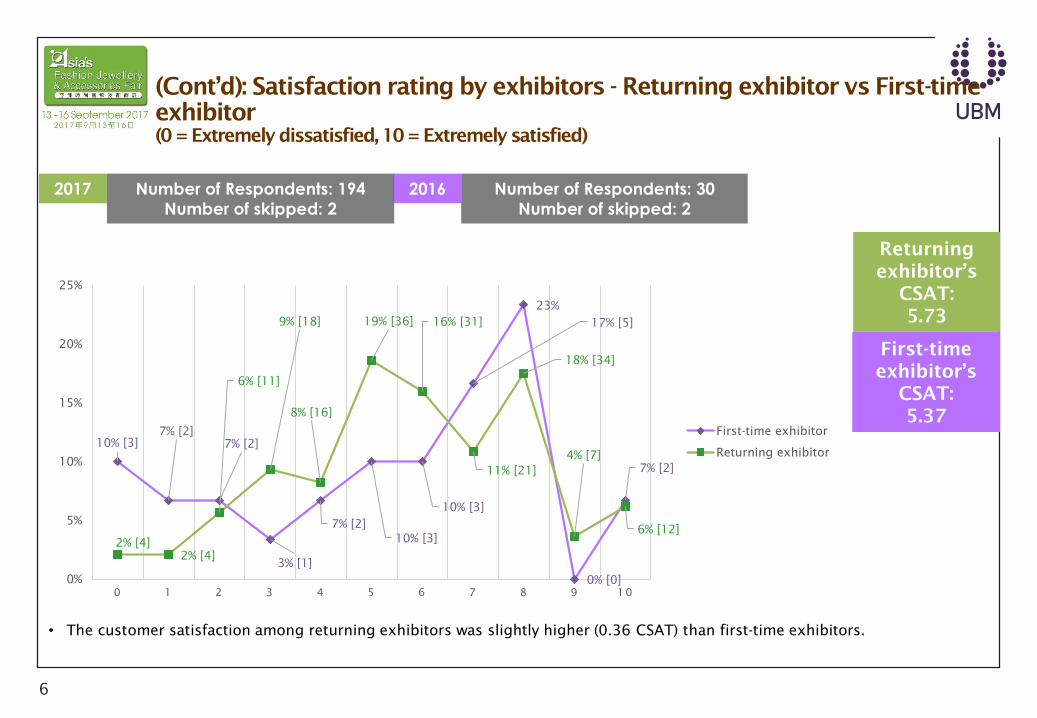
(Cont’d): Satisfaction rating by exhibitors - Returning exhibitor vs First-time
exhibitor
(0 = Extremely dissatisfied, 10 = Extremely satisfied)
6
• The customer satisfaction among returning exhibitors was slightly higher (0.36 CSAT) than first-time exhibitors.
Returning
exhibitor’s
CSAT:
5.73
First-time
exhibitor’s
CSAT:
5.37
10% [3]
7% [2]
7% [2]
3% [1]
7% [2]
10% [3]
10% [3]
17% [5]
23%
0% [0]
7% [2]
2% [4]
2% [4]
6% [11]
9% [18]
8% [16]
19% [36] 16% [31]
11% [21]
18% [34]
4% [7]
6% [12]
0%
5%
10%
15%
20%
25%
0 1 2 3 4 5 6 7 8 9 10
First-time exhibitor
Returning exhibitor
2017 Number of Respondents: 194
Number of skipped: 2
Number of Respondents: 30
Number of skipped: 2
2016
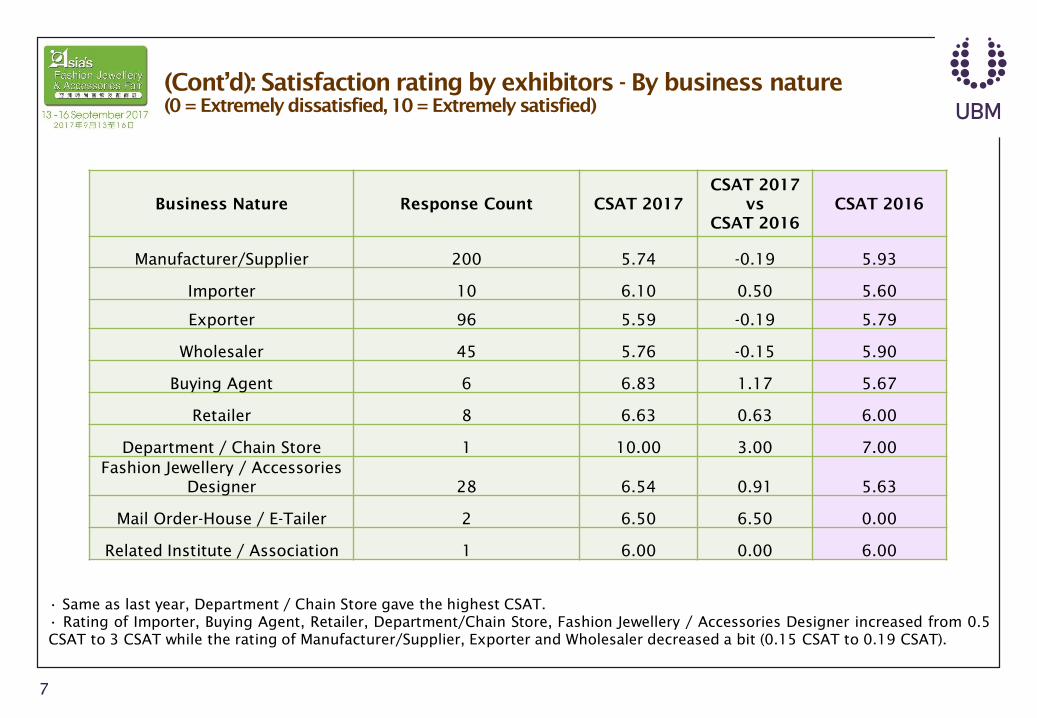
(Cont’d): Satisfaction rating by exhibitors - By business nature
(0 = Extremely dissatisfied, 10 = Extremely satisfied)
7
• Same as last year, Department / Chain Store gave the highest CSAT.
• Rating of Importer, Buying Agent, Retailer, Department/Chain Store, Fashion Jewellery / Accessories Designer increased from 0.5
CSAT to 3 CSAT while the rating of Manufacturer/Supplier, Exporter and Wholesaler decreased a bit (0.15 CSAT to 0.19 CSAT).
Business Nature Response Count CSAT 2017
CSAT 2017
vs
CSAT 2016
CSAT 2016
Manufacturer/Supplier 200 5.74 -0.19 5.93
Importer 10 6.10 0.50 5.60
Exporter 96 5.59 -0.19 5.79
Wholesaler 45 5.76 -0.15 5.90
Buying Agent 6 6.83 1.17 5.67
Retailer 8 6.63 0.63 6.00
Department / Chain Store 1 10.00 3.00 7.00
Fashion Jewellery / Accessories
Designer 28 6.54 0.91 5.63
Mail Order-House / E-Tailer 2 6.50 6.50 0.00
Related Institute / Association 1 6.00 0.00 6.00
(Cont’d): Satisfaction rating by exhibitors - By country/region
(0 = Extremely dissatisfied, 10 = Extremely satisfied)
8
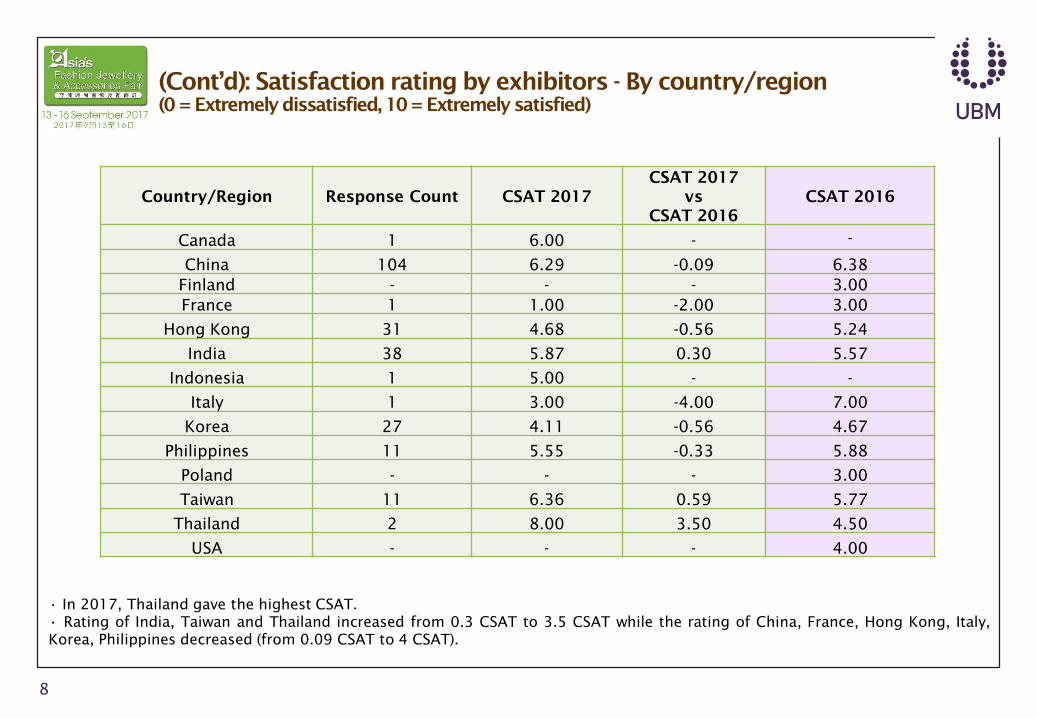
• In 2017, Thailand gave the highest CSAT.
• Rating of India, Taiwan and Thailand increased from 0.3 CSAT to 3.5 CSAT while the rating of China, France, Hong Kong, Italy,
Korea, Philippines decreased (from 0.09 CSAT to 4 CSAT).
Country/Region Response Count CSAT 2017
CSAT 2017
vs
CSAT 2016
CSAT 2016
Canada 1 6.00 - -
China 104 6.29 -0.09 6.38
Finland - - - 3.00
France 1 1.00 -2.00 3.00
Hong Kong 31 4.68 -0.56 5.24
India 38 5.87 0.30 5.57
Indonesia 1 5.00 - -
Italy 1 3.00 -4.00 7.00
Korea 27 4.11 -0.56 4.67
Philippines 11 5.55 -0.33 5.88
Poland - - - 3.00
Taiwan 11 6.36 0.59 5.77
Thailand 2 8.00 3.50 4.50
USA - - - 4.00

(Cont’d): Satisfaction rating by exhibitors - By pavilion
(0 = Extremely dissatisfied, 10 = Extremely satisfied)
9
• CSAT of all country pavilions decreased a bit (from 0.03 CSAT to 0.78 CSAT).
• Rating of Stainless Steel Jewellery Pavilion got a slight increase (0.17 CSAT).
Pavilion Response Count CSAT 2017
CSAT 2017
vs
CSAT 2016
CSAT 2016
China Pavilion 77 6.10 -0.22 6.32
India Pavilion 23 5.52 -0.03 5.56
Korea Pavilion 28 4.29 -0.78 5.06
Philippines Pavilion 8 5.13 -0.48 5.60
Taiwan Pavilion 11 6.36 -0.36 6.73
Stainless Steel Jewellery
Pavilion 39 5.90 0.17 5.73
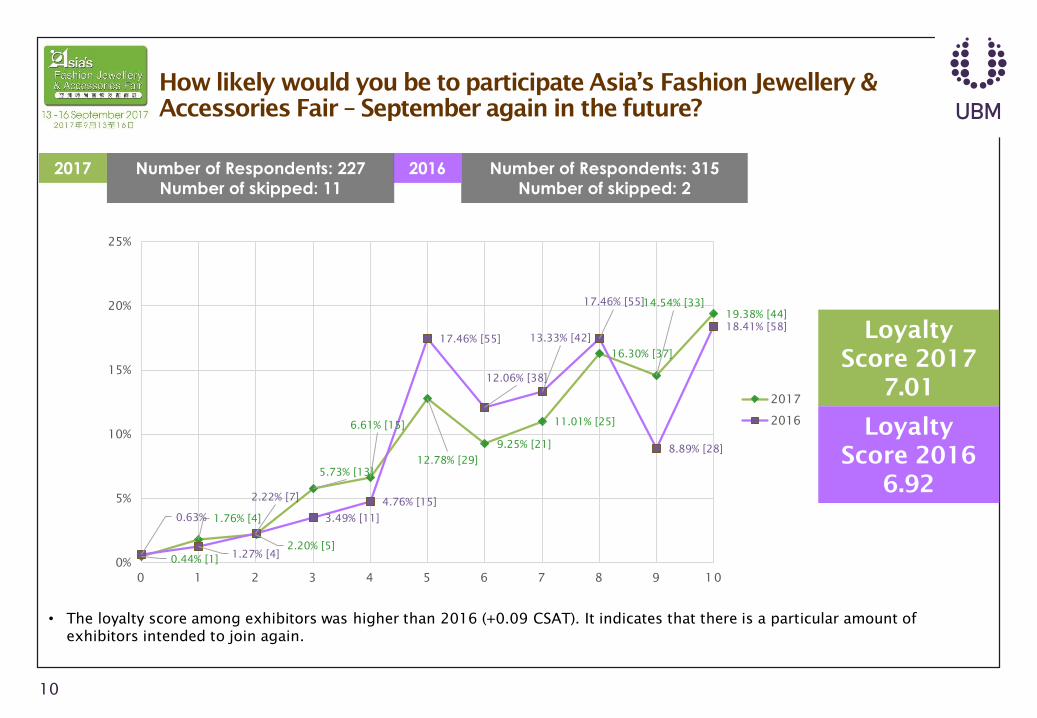
How likely would you be to participate Asia’s Fashion Jewellery &
Accessories Fair – September again in the future?
10
• The loyalty score among exhibitors was higher than 2016 (+0.09 CSAT). It indicates that there is a particular amount of
exhibitors intended to join again.
Loyalty
Score 2017
7.01
Loyalty
Score 2016
6.92
0.44% [1]
1.76% [4]
2.20% [5]
5.73% [13]
6.61% [15]
12.78% [29]
9.25% [21]
11.01% [25]
16.30% [37]
14.54% [33]
19.38% [44]
0.63%
1.27% [4]
2.22% [7]
3.49% [11]
4.76% [15]
17.46% [55]
12.06% [38]
13.33% [42]
17.46% [55]
8.89% [28]
18.41% [58]
0%
5%
10%
15%
20%
25%
0 1 2 3 4 5 6 7 8 9 10
2017
2016
2017 Number of Respondents: 227
Number of skipped: 11
Number of Respondents: 315
Number of skipped: 2
2016
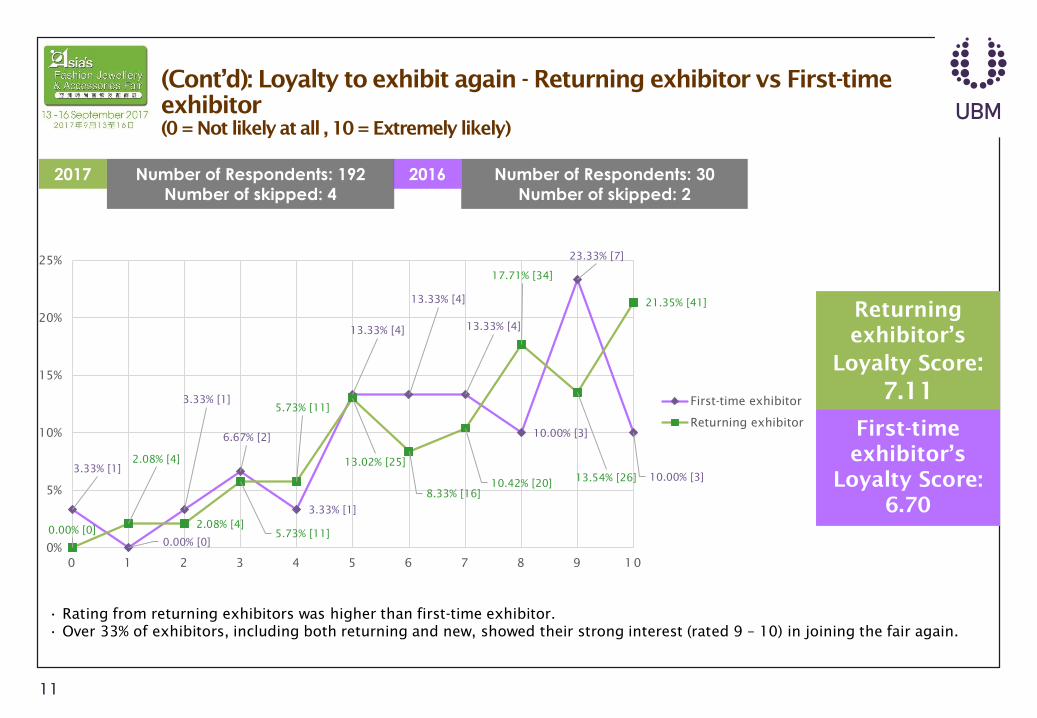
(Cont’d): Loyalty to exhibit again - Returning exhibitor vs First-time
exhibitor
(0 = Not likely at all , 10 = Extremely likely)
11
Returning
exhibitor’s
Loyalty Score:
7.11
First-time
exhibitor’s
Loyalty Score:
6.70
• Rating from returning exhibitors was higher than first-time exhibitor.
• Over 33% of exhibitors, including both returning and new, showed their strong interest (rated 9 – 10) in joining the fair again.
3.33% [1]
0.00% [0]
3.33% [1]
6.67% [2]
3.33% [1]
13.33% [4]
13.33% [4]
13.33% [4]
10.00% [3]
23.33% [7]
10.00% [3]
0.00% [0]
2.08% [4]
2.08% [4]
5.73% [11]
5.73% [11]
13.02% [25]
8.33% [16]
10.42% [20]
17.71% [34]
13.54% [26]
21.35% [41]
0%
5%
10%
15%
20%
25%
0 1 2 3 4 5 6 7 8 9 10
First-time exhibitor
Returning exhibitor
2017 Number of Respondents: 192
Number of skipped: 4
Number of Respondents: 30
Number of skipped: 2
2016
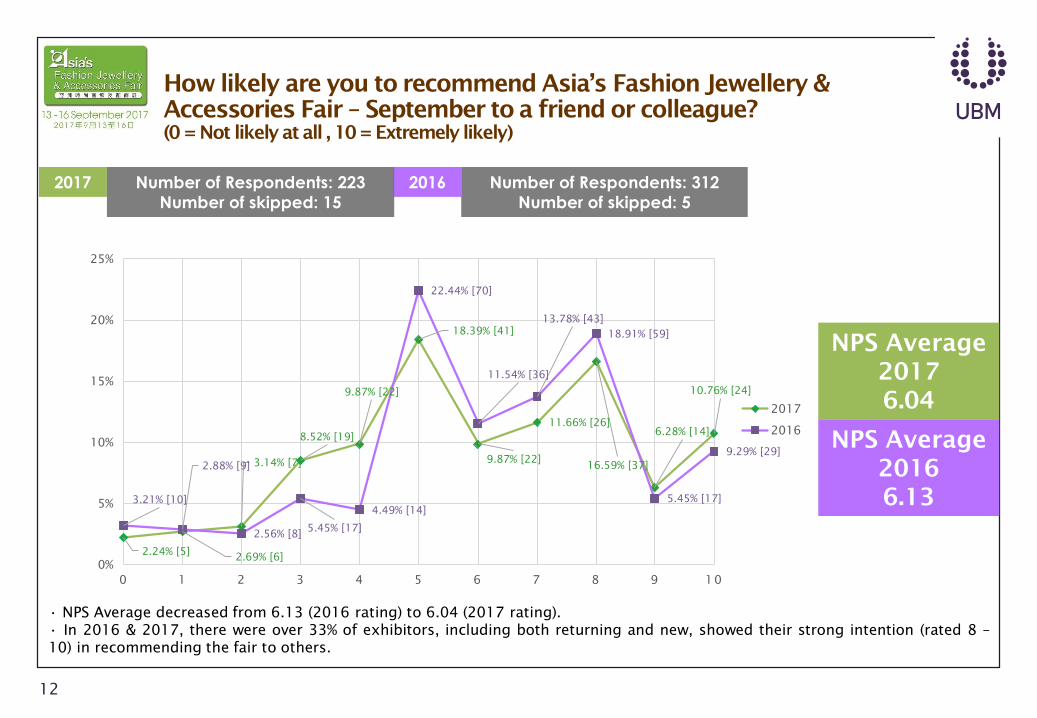
How likely are you to recommend Asia’s Fashion Jewellery &
Accessories Fair – September to a friend or colleague?
(0 = Not likely at all , 10 = Extremely likely)
12
NPS Average
2017
6.04
NPS Average
2016
6.13
• NPS Average decreased from 6.13 (2016 rating) to 6.04 (2017 rating).
• In 2016 & 2017, there were over 33% of exhibitors, including both returning and new, showed their strong intention (rated 8 –
10) in recommending the fair to others.
2.24% [5]2.69% [6]
3.14% [7]
8.52% [19]
9.87% [22]
18.39% [41]
9.87% [22]
11.66% [26]
16.59% [37]
6.28% [14]
10.76% [24]
3.21% [10]
2.88% [9]
2.56% [8]5.45% [17]
4.49% [14]
22.44% [70]
11.54% [36]
13.78% [43]
18.91% [59]
5.45% [17]
9.29% [29]
0%
5%
10%
15%
20%
25%
0 1 2 3 4 5 6 7 8 9 10
2017
2016
2017 Number of Respondents: 223
Number of skipped: 15
Number of Respondents: 312
Number of skipped: 5
2016
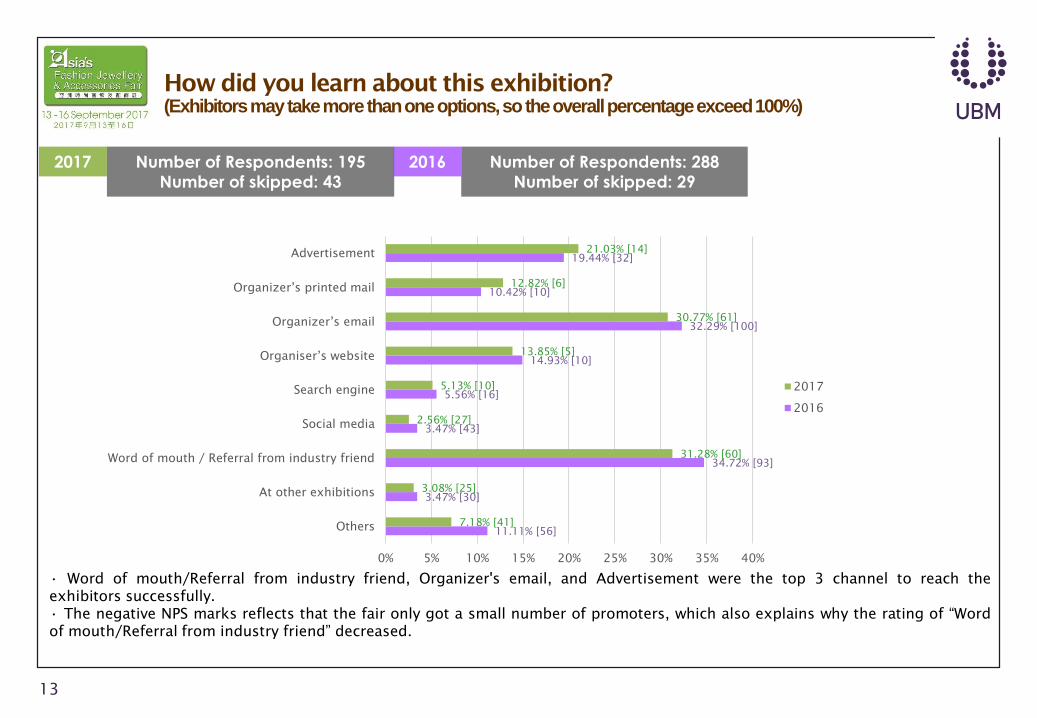
How did you learn about this exhibition?
(Exhibitors may take more than one options, so the overall percentage exceed 100%)
13
• Word of mouth/Referral from industry friend, Organizer's email, and Advertisement were the top 3 channel to reach the
exhibitors successfully.
• The negative NPS marks reflects that the fair only got a small number of promoters, which also explains why the rating of “Word
of mouth/Referral from industry friend” decreased.
11.11% [56]
3.47% [30]
34.72% [93]
3.47% [43]
5.56% [16]
14.93% [10]
32.29% [100]
10.42% [10]
19.44% [32]
7.18% [41]
3.08% [25]
31.28% [60]
2.56% [27]
5.13% [10]
13.85% [5]
30.77% [61]
12.82% [6]
21.03% [14]
0% 5% 10% 15% 20% 25% 30% 35% 40%
Others
At other exhibitions
Word of mouth / Referral from industry friend
Social media
Search engine
Organiser’s website
Organizer’s email
Organizer’s printed mail
Advertisement
2017
2016
2017 Number of Respondents: 195
Number of skipped: 43
Number of Respondents: 288
Number of skipped: 29
2016
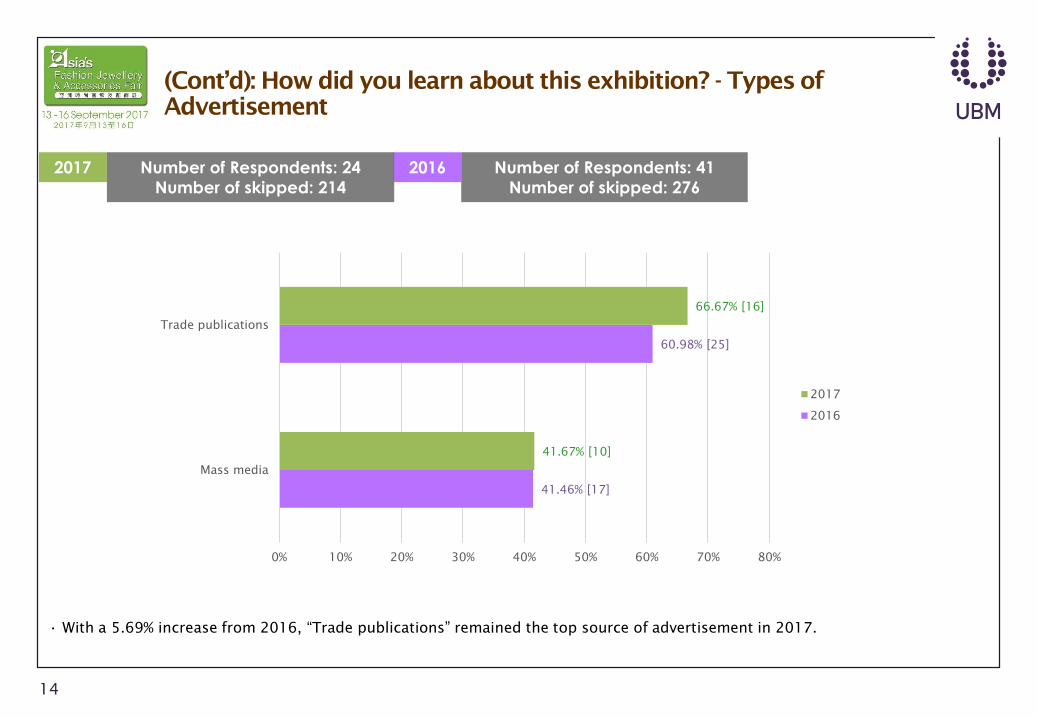
(Cont’d): How did you learn about this exhibition? - Types of
Advertisement
14
• With a 5.69% increase from 2016, “Trade publications” remained the top source of advertisement in 2017.
41.46% [17]
60.98% [25]
41.67% [10]
66.67% [16]
0% 10% 20% 30% 40% 50% 60% 70% 80%
Mass media
Trade publications
2017
2016
2017 Number of Respondents: 24
Number of skipped: 214
Number of Respondents: 41
Number of skipped: 276
2016
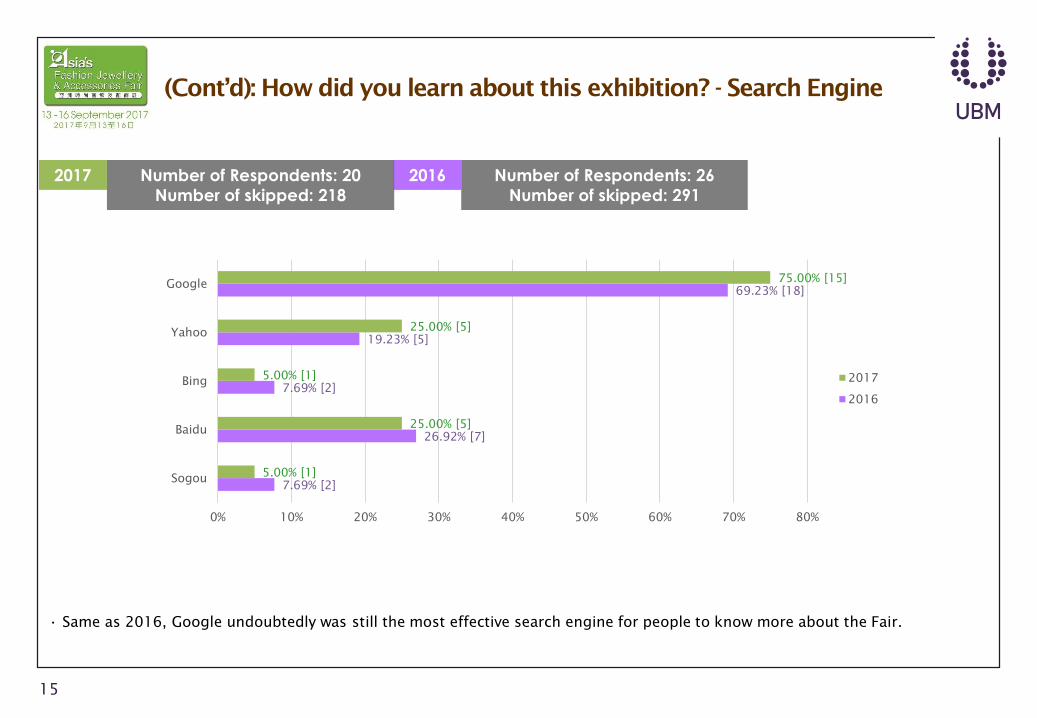
(Cont’d): How did you learn about this exhibition? - Search Engine
15
• Same as 2016, Google undoubtedly was still the most effective search engine for people to know more about the Fair.
7.69% [2]
26.92% [7]
7.69% [2]
19.23% [5]
69.23% [18]
5.00% [1]
25.00% [5]
5.00% [1]
25.00% [5]
75.00% [15]
0% 10% 20% 30% 40% 50% 60% 70% 80%
Sogou
Baidu
Bing
Yahoo
2017
2016
2017 Number of Respondents: 20
Number of skipped: 218
Number of Respondents: 26
Number of skipped: 291
2016
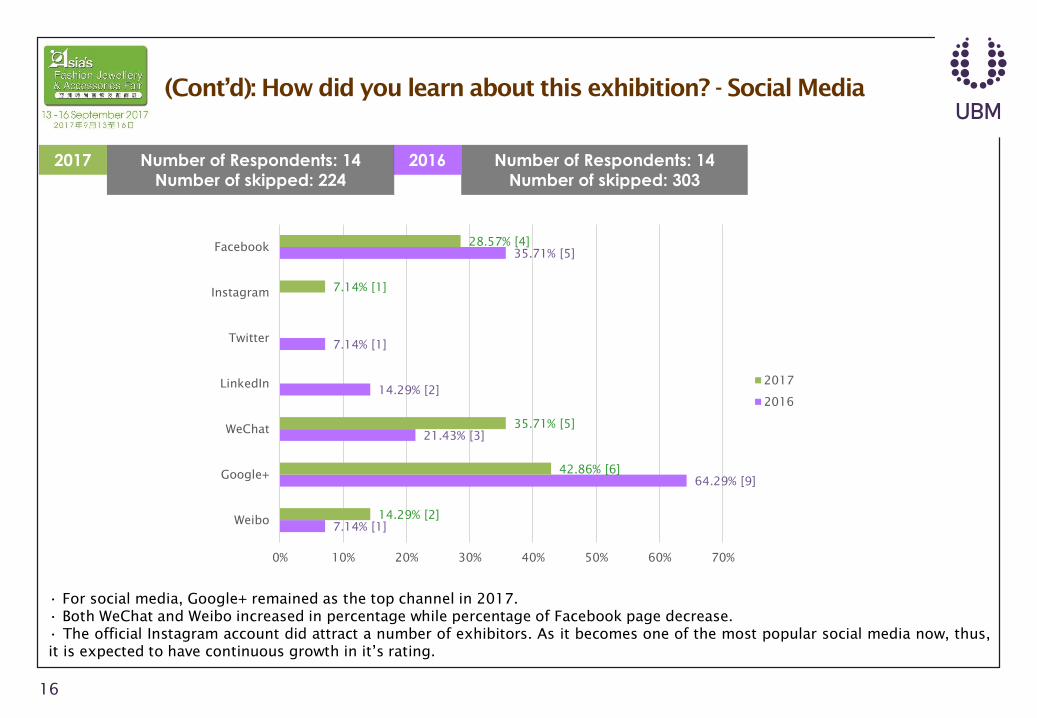
(Cont’d): How did you learn about this exhibition? - Social Media
16
• For social media, Google+ remained as the top channel in 2017.
• Both WeChat and Weibo increased in percentage while percentage of Facebook page decrease.
• The official Instagram account did attract a number of exhibitors. As it becomes one of the most popular social media now, thus,
it is expected to have continuous growth in it’s rating.
7.14% [1]
64.29% [9]
21.43% [3]
14.29% [2]
7.14% [1]
35.71% [5]
14.29% [2]
42.86% [6]
35.71% [5]
7.14% [1]
28.57% [4]
0% 10% 20% 30% 40% 50% 60% 70%
Google+
2017
2016
2017 Number of Respondents: 14
Number of skipped: 224
Number of Respondents: 14
Number of skipped: 303
2016

Which online platform do you usually use to source your products?
17
• With it’s popularity, Alibaba.com undoubtedly was the top online sourcing platform among exhibitors in both 2016 & 2017.
• Over 30% exhibitors sourced from AsiaFJA.com in 2016 & 2017.
7.69% [18]
11.11% [26]
9.83% [23]
56.84% [133]
31.62% [74]
8.54% [14]
16.46% [27]
16.46% [27]
53.05% [87]
32.32% [53]
0% 10% 20% 30% 40% 50% 60%
Others
GlobalSources.com
HKTDC.com
Alibaba.com
AsiaFJA.com
2017
2016
2017 Number of Respondents: 164
Number of skipped: 74
Number of Respondents: 234
Number of skipped: 83
2016
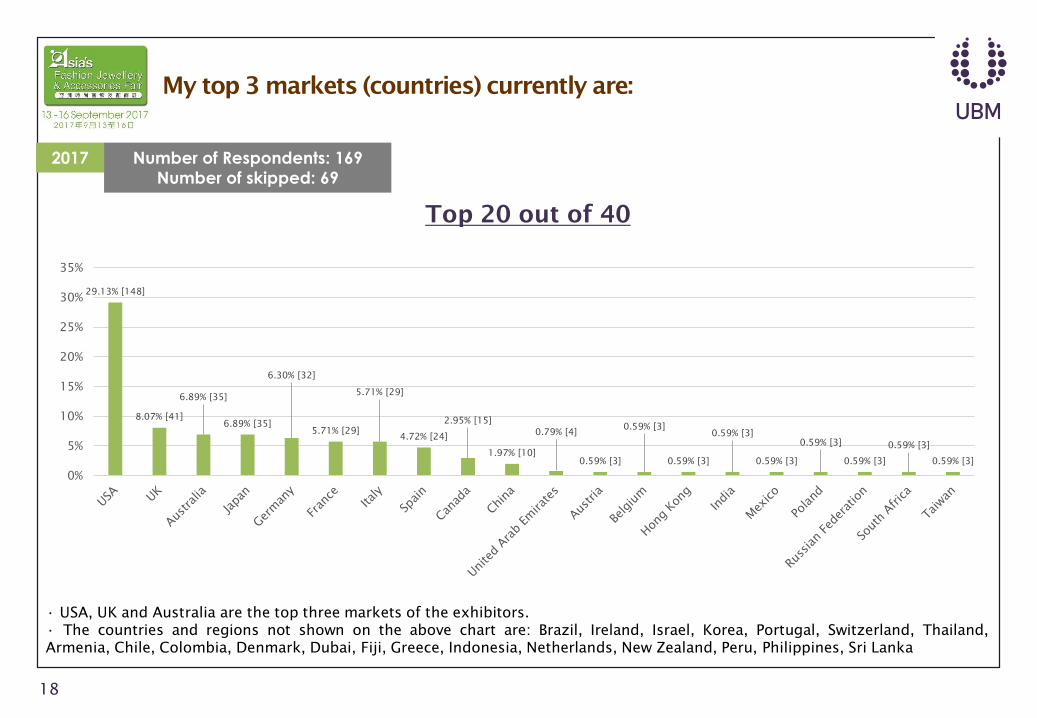
My top 3 markets (countries) currently are:
18
Top 20 out of 40
• USA, UK and Australia are the top three markets of the exhibitors.
• The countries and regions not shown on the above chart are: Brazil, Ireland, Israel, Korea, Portugal, Switzerland, Thailand,
Armenia, Chile, Colombia, Denmark, Dubai, Fiji, Greece, Indonesia, Netherlands, New Zealand, Peru, Philippines, Sri Lanka
29.13% [148]
8.07% [41]
6.89% [35]
6.89% [35]
6.30% [32]
5.71% [29]
5.71% [29]
4.72% [24]
2.95% [15]
1.97% [10]
0.79% [4]
0.59% [3]
0.59% [3]
0.59% [3]
0.59% [3]
0.59% [3]
0.59% [3]
0.59% [3]
0.59% [3]
0.59% [3]
0%
5%
10%
15%
20%
25%
30%
35%
2017 Number of Respondents: 169
Number of skipped: 69
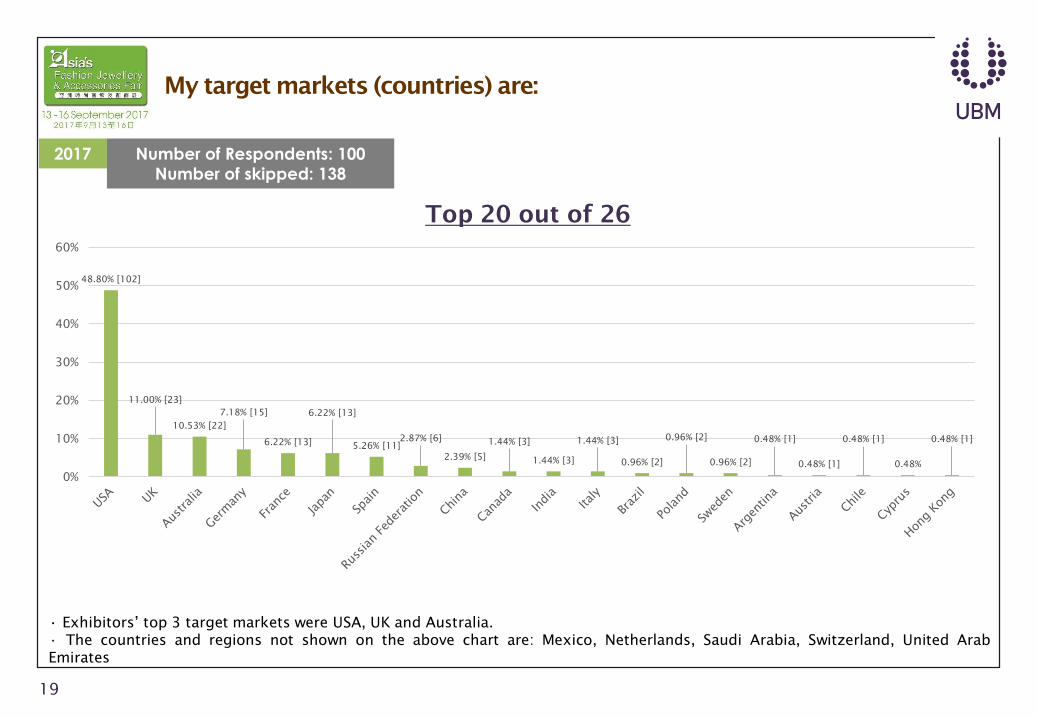
My target markets (countries) are:
19
Top 20 out of 26
• Exhibitors’ top 3 target markets were USA, UK and Australia.
• The countries and regions not shown on the above chart are: Mexico, Netherlands, Saudi Arabia, Switzerland, United Arab
Emirates
48.80% [102]
11.00% [23]
10.53% [22]
7.18% [15]
6.22% [13]
6.22% [13]
5.26% [11]
2.87% [6]
2.39% [5]
1.44% [3]
1.44% [3]
1.44% [3]
0.96% [2]
0.96% [2]
0.96% [2]
0.48% [1]
0.48% [1]
0.48% [1]
0.48%
0.48% [1]
0%
10%
20%
30%
40%
50%
60%
2017 Number of Respondents: 100
Number of skipped: 138
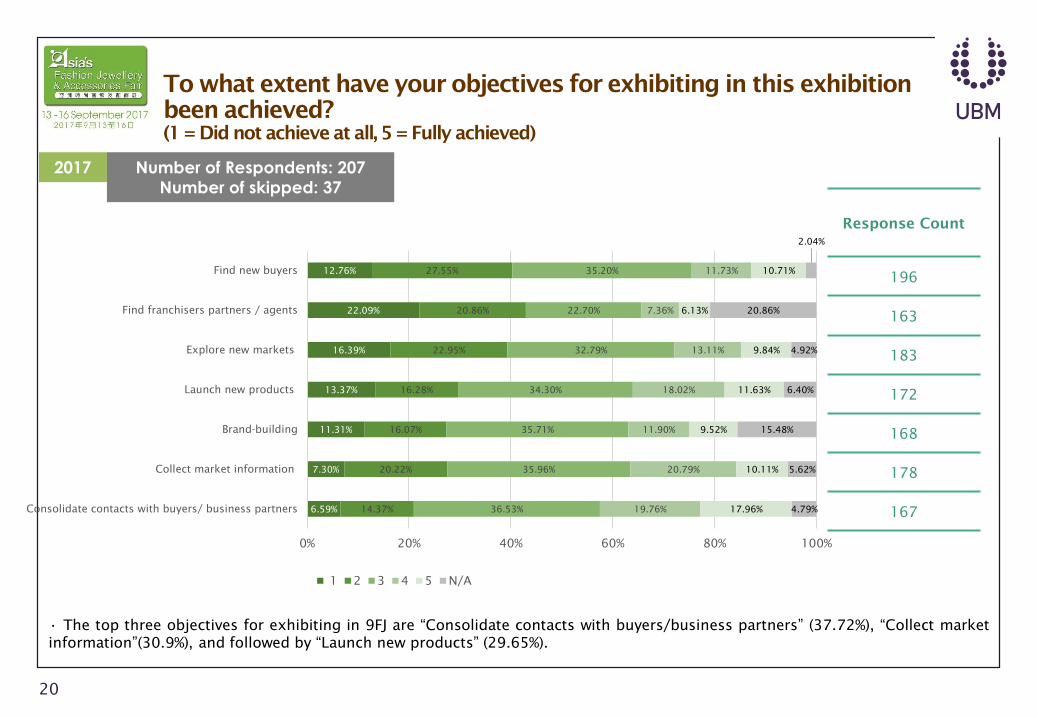
To what extent have your objectives for exhibiting in this exhibition
been achieved?
(1 = Did not achieve at all, 5 = Fully achieved)
20
• The top three objectives for exhibiting in 9FJ are “Consolidate contacts with buyers/business partners” (37.72%), “Collect market
information”(30.9%), and followed by “Launch new products” (29.65%).
Response Count
196
163
183
172
168
178
1676.59%
7.30%
11.31%
13.37%
16.39%
22.09%
12.76%
14.37%
20.22%
16.07%
16.28%
22.95%
20.86%
27.55%
36.53%
35.96%
35.71%
34.30%
32.79%
22.70%
35.20%
19.76%
20.79%
11.90%
18.02%
13.11%
7.36%
11.73%
17.96%
10.11%
9.52%
11.63%
9.84%
6.13%
10.71%
4.79%
5.62%
15.48%
6.40%
4.92%
20.86%
2.04%
0% 20% 40% 60% 80% 100%
Consolidate contacts with buyers/ business partners
Collect market information
Brand-building
Launch new products
Explore new markets
Find franchisers partners / agents
Find new buyers
1 2 3 4 5 N/A
2017 Number of Respondents: 207
Number of skipped: 37
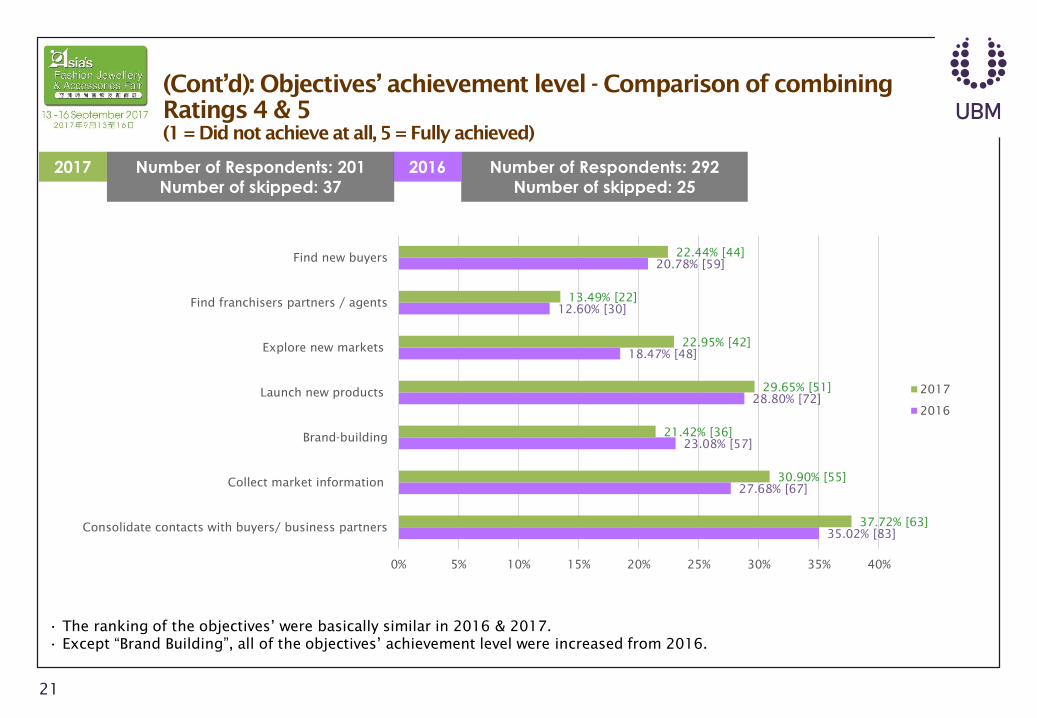
(Cont’d): Objectives’ achievement level - Comparison of combining
Ratings 4 & 5
(1 = Did not achieve at all, 5 = Fully achieved)
21
• The ranking of the objectives’ were basically similar in 2016 & 2017.
• Except “Brand Building”, all of the objectives’ achievement level were increased from 2016.
35.02% [83]
27.68% [67]
23.08% [57]
28.80% [72]
18.47% [48]
12.60% [30]
20.78% [59]
37.72% [63]
30.90% [55]
21.42% [36]
29.65% [51]
22.95% [42]
13.49% [22]
22.44% [44]
0% 5% 10% 15% 20% 25% 30% 35% 40%
Consolidate contacts with buyers/ business partners
Collect market information
Brand-building
Launch new products
Explore new markets
Find franchisers partners / agents
Find new buyers
2017
2016
2017 Number of Respondents: 201
Number of skipped: 37
Number of Respondents: 292
Number of skipped: 25
2016
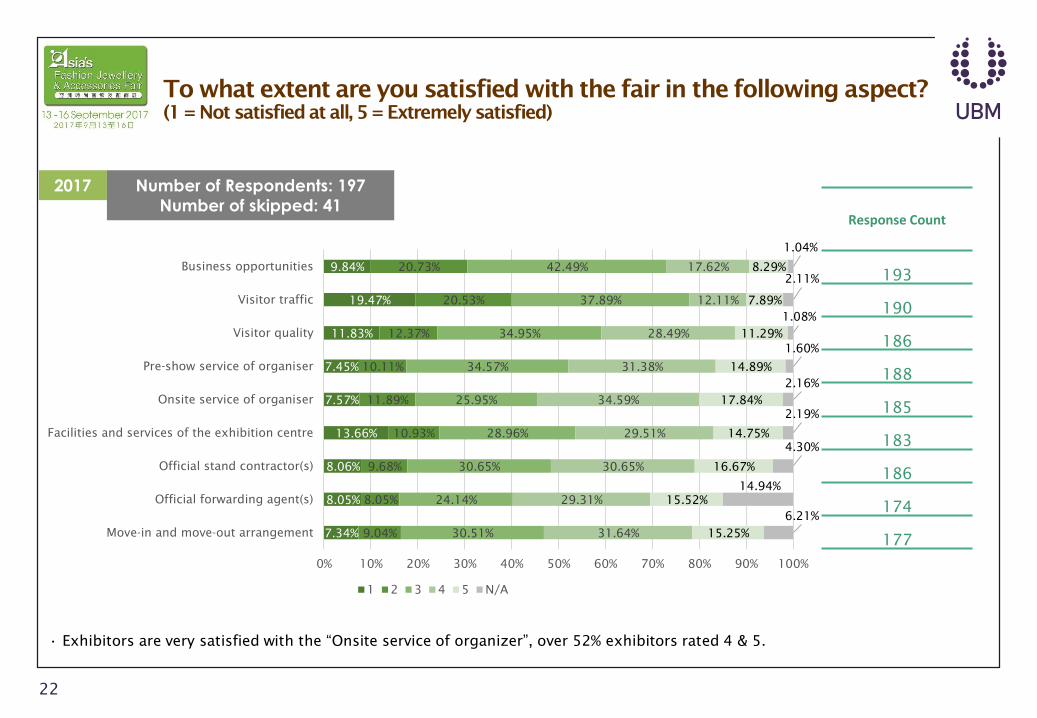
To what extent are you satisfied with the fair in the following aspect?
(1 = Not satisfied at all, 5 = Extremely satisfied)
22
• Exhibitors are very satisfied with the “Onsite service of organizer”, over 52% exhibitors rated 4 & 5.
Response Count
193
190
186
188
185
183
186
174
1777.34%
8.05%
8.06%
13.66%
7.57%
7.45%
11.83%
19.47%
9.84%
9.04%
8.05%
9.68%
10.93%
11.89%
10.11%
12.37%
20.53%
20.73%
30.51%
24.14%
30.65%
28.96%
25.95%
34.57%
34.95%
37.89%
42.49%
31.64%
29.31%
30.65%
29.51%
34.59%
31.38%
28.49%
12.11%
17.62%
15.25%
15.52%
16.67%
14.75%
17.84%
14.89%
11.29%
7.89%
8.29%
6.21%
14.94%
4.30%
2.19%
2.16%
1.60%
1.08%
2.11%
1.04%
0% 10% 20% 30% 40% 50% 60% 70% 80% 90% 100%
Move-in and move-out arrangement
Official forwarding agent(s)
Official stand contractor(s)
Facilities and services of the exhibition centre
Onsite service of organiser
Pre-show service of organiser
Visitor quality
Visitor traffic
Business opportunities
1 2 3 4 5 N/A
2017 Number of Respondents: 197
Number of skipped: 41
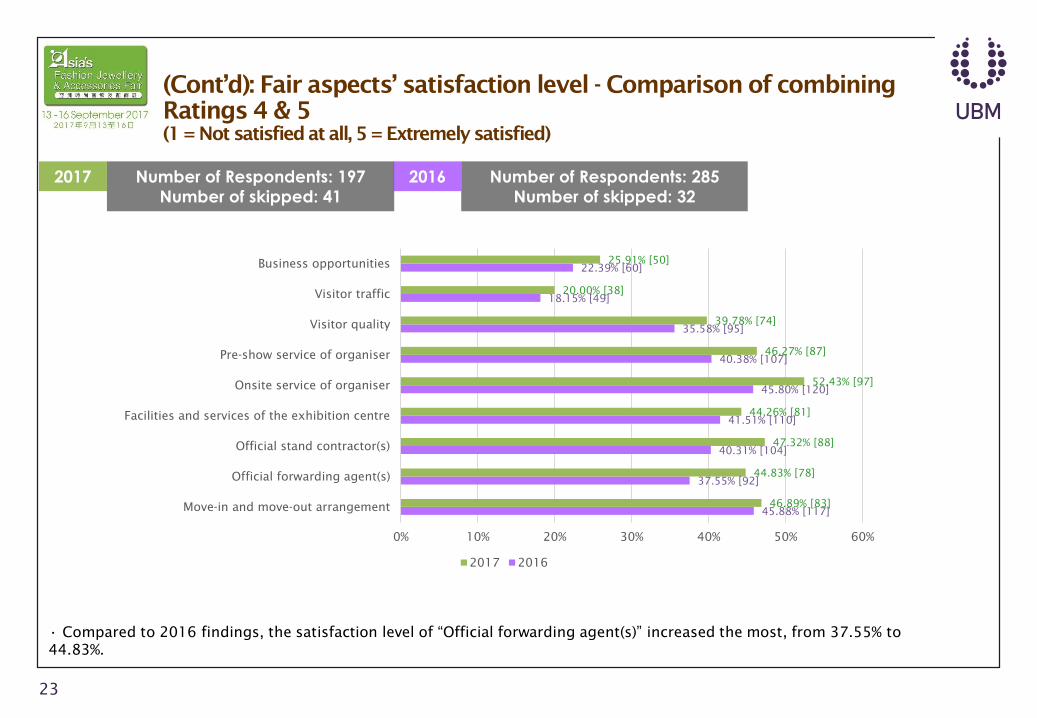
(Cont’d): Fair aspects’ satisfaction level - Comparison of combining
Ratings 4 & 5
(1 = Not satisfied at all, 5 = Extremely satisfied)
23
• Compared to 2016 findings, the satisfaction level of “Official forwarding agent(s)” increased the most, from 37.55% to
44.83%.
45.88% [117]
37.55% [92]
40.31% [104]
41.51% [110]
45.80% [120]
40.38% [107]
35.58% [95]
18.15% [49]
22.39% [60]
46.89% [83]
44.83% [78]
47.32% [88]
44.26% [81]
52.43% [97]
46.27% [87]
39.78% [74]
20.00% [38]
25.91% [50]
0% 10% 20% 30% 40% 50% 60%
Move-in and move-out arrangement
Official forwarding agent(s)
Official stand contractor(s)
Facilities and services of the exhibition centre
Onsite service of organiser
Pre-show service of organiser
Visitor quality
Visitor traffic
Business opportunities
2017 2016
2017 Number of Respondents: 197
Number of skipped: 41
Number of Respondents: 285
Number of skipped: 32
2016


![HiP Amersfoort [Watches & Jewellery]](https://img.pdfslide.tips/doc/110x75/568c4be11a28ab49169de98c/hip-amersfoort-watches-jewellery.jpg)