Embed Size (px)
Citation preview
NCCOR School Nutrition Supported Peer-Review Research, Reports and Resources
Academic Achievement Added Sugars After-School Research BMI Screening in Schools Classroom Parties Commodities Competitive Foods Energy Drinks Food as a Reward Food Fundraising Food Marketing to Children Food Waste Fruit and Vegetable Consumption Local Wellness Policies Off-Campus School Food Environment Open Campus Lunch Policies NSLP Participation Nutrition Education and Promotion (including school gardens) Pricing Strategies School Accountability Policies School Breakfast Program School Food Environments, Policies, Practices and Partnerships School Lunches from Home School Meal Nutrition Standards Scratch-cooking Sodium Reduction Water Access Other Childhood Obesity Relevant Findings
Academic Achievement
1
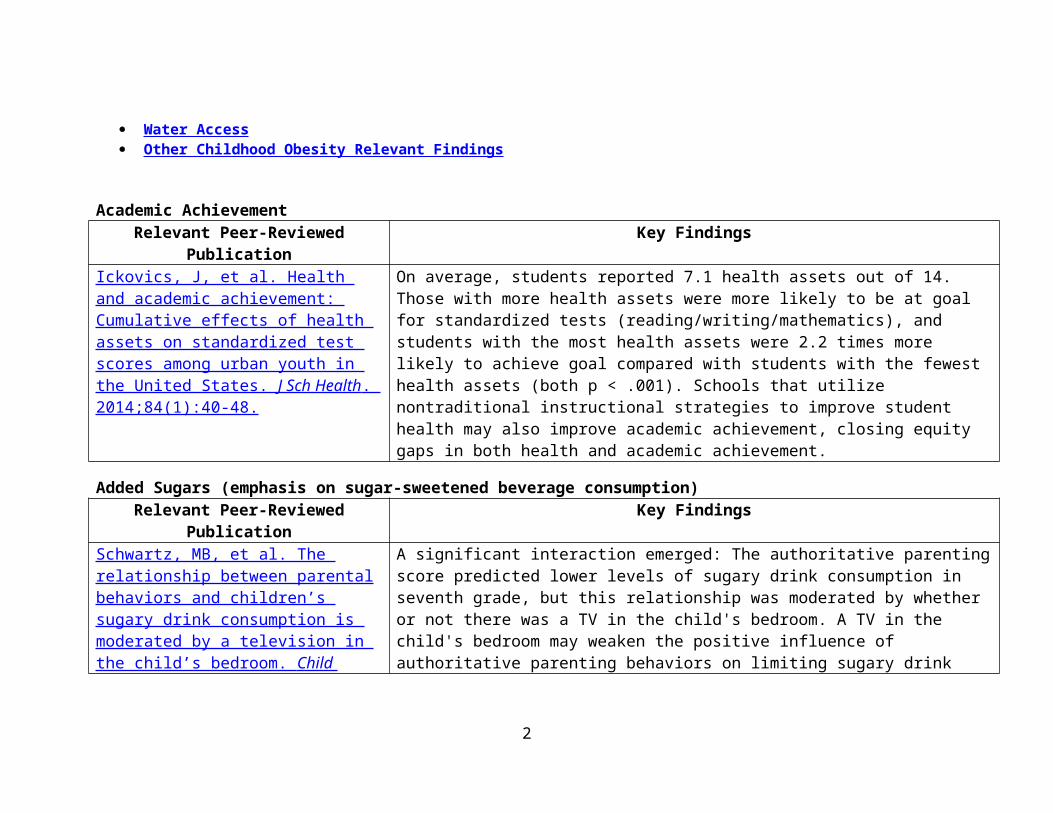
Relevant Peer-Reviewed Publication Key FindingsIckovics, J, et al. Health and academic achievement: Cumulative effects of health assets on standardized test scores among urban youth in the United States. J Sch Health . 2014;84(1):40-48.
On average, students reported 7.1 health assets out of 14. Those with more health assets were more likely to be at goal for standardized tests (reading/writing/mathematics), and students with the most health assets were 2.2 times more likely to achieve goal compared with students with the fewest health assets (both p < .001). Schools that utilize nontraditional instructional strategies to improve student health may also improve academic achievement, closing equity gaps in both health and academic achievement.
Added Sugars (emphasis on sugar-sweetened beverage consumption)Relevant Peer-Reviewed Publication Key Findings
Schwartz, MB, et al. The relationship between parental behaviors and children’s sugary drink consumption is moderated by a television in the child’s bedroom. Child Obes . 2015;11(5):560- 568.
A significant interaction emerged: The authoritative parenting score predicted lower levels of sugary drink consumption in seventh grade, but this relationship was moderated by whether or not there was a TV in the child's bedroom. A TV in the child's bedroom may weaken the positive influence of authoritative parenting behaviors on limiting sugary drink consumption among middle school children from low-income families. Stronger initiatives are recommended to educate parents and help them refrain from placing TVs in their children's bedrooms.
Beck AL, et al. Trends in sugar-sweetened beverage and 100% fruit juice consumption among California children. Acad Pediatr . 2013;13(4):364- 370.
The percentage of children consuming an SSB on the prior day declined from 40% in 2003 to 16% in 2009 (P < .001) among children ages 2 to 5 and from 54% in 2003 to 33% in 2009 (P < .001) among children ages 6 to 11. The percentage of children consuming any SSB decreased for all racial/ethnic groups, although there were disparities with higher consumption among Latinos. Among children ages 2 to 5, consumption of 2 or more servings of 100% fruit juice per day decreased among white children and increased among Latinos. For children ages 6 to 11, consumption of 2 or more servings of 100% fruit juice per day remained stable for white children and increased among Latinos and African Americans.
Briefel RR, Wilson A, Cabili C, Hedley Dodd A. Reducing calories and added sugars by improving children's beverage
Changes translated to a mean of 205 calories or a 10% savings in energy intake across all students (8% among children in elementary school and 11% in middle and high schools). Eighty percent of the daily savings were attributed to beverages
2
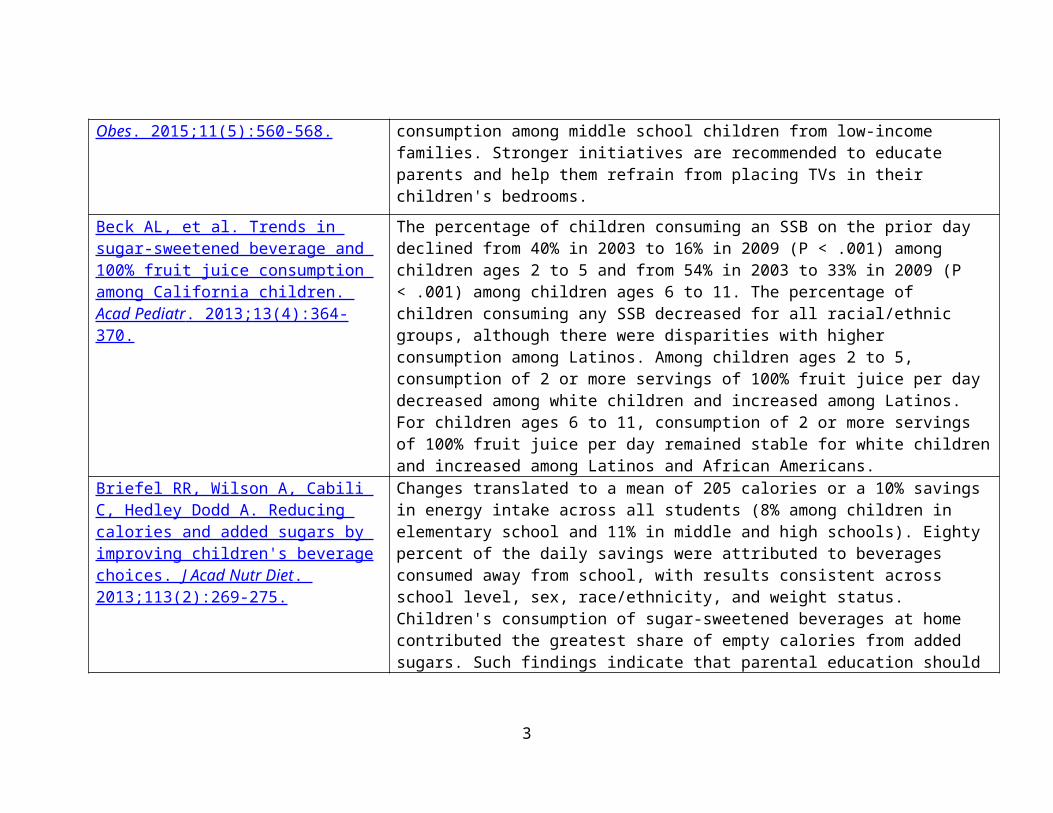
choices. J Acad Nutr Diet . 2013;113(2):269-275.
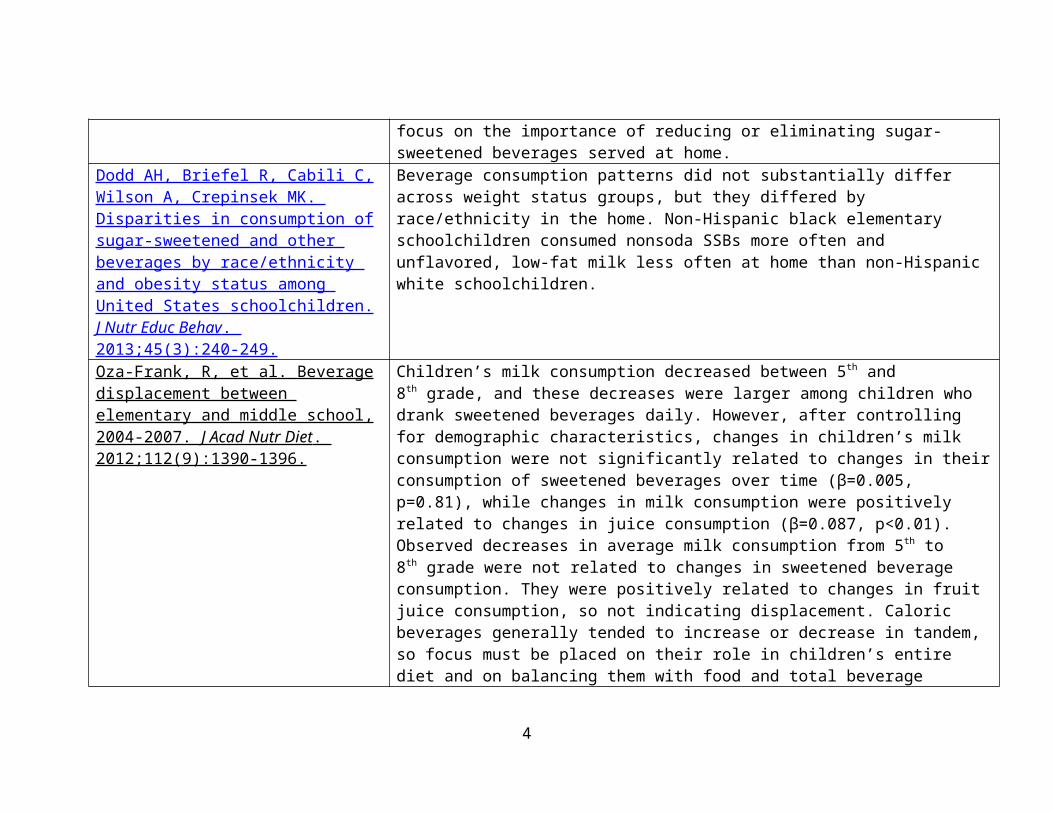
consumed away from school, with results consistent across school level, sex, race/ethnicity, and weight status. Children's consumption of sugar-sweetened beverages at home contributed the greatest share of empty calories from added sugars. Such findings indicate that parental education should focus on the importance of reducing or eliminating sugar-sweetened beverages served at home.
Dodd AH, Briefel R, Cabili C, Wilson A, Crepinsek MK. Disparities in consumption of sugar-sweetened and other beverages by race/ethnicity and obesity status among United States schoolchildren. J Nutr Educ Behav . 2013;45(3):240-249.
Beverage consumption patterns did not substantially differ across weight status groups, but they differed by race/ethnicity in the home. Non-Hispanic black elementary schoolchildren consumed nonsoda SSBs more often and unflavored, low-fat milk less often at home than non-Hispanic white schoolchildren.
Oza-Frank, R, et al. Beverage displacement between elementary and middle school, 2004-2007. J Acad Nutr Diet . 2012;112(9):1390-1396.
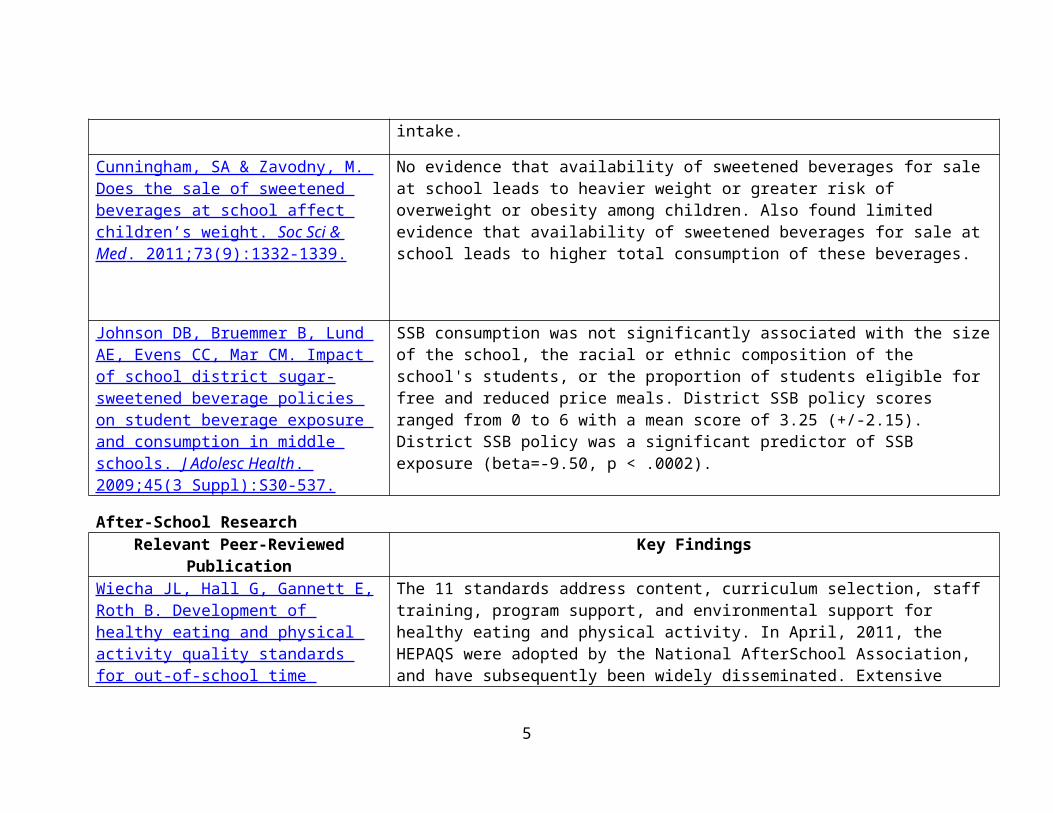
Children’s milk consumption decreased between 5th and 8th grade, and these decreases were larger among children who drank sweetened beverages daily. However, after controlling for demographic characteristics, changes in children’s milk consumption were not significantly related to changes in their consumption of sweetened beverages over time (β=0.005, p=0.81), while changes in milk consumption were positively related to changes in juice consumption (β=0.087, p<0.01). Observed decreases in average milk consumption from 5th to 8th grade were not related to changes in sweetened beverage consumption. They were positively related to changes in fruit juice consumption, so not indicating displacement. Caloric beverages generally tended to increase or decrease in tandem, so focus must be placed on their role in children’s entire diet and on balancing them with food and total beverage intake.
Cunningham, SA & Zavodny, M. Does the sale of sweetened beverages at school affect children’s weight. Soc Sci & Med . 2011;73(9):1332-1339.
No evidence that availability of sweetened beverages for sale at school leads to heavier weight or greater risk of overweight or obesity among children. Also found limited evidence that availability of sweetened beverages for sale at school leads to higher total consumption of these beverages.
3
Johnson DB, Bruemmer B, Lund AE, Evens CC, Mar CM. Impact of school district sugar-sweetened beverage policies on student beverage exposure and consumption in middle schools. J Adolesc Health . 2009;45(3 Suppl):S30- 537.
SSB consumption was not significantly associated with the size of the school, the racial or ethnic composition of the school's students, or the proportion of students eligible for free and reduced price meals. District SSB policy scores ranged from 0 to 6 with a mean score of 3.25 (+/-2.15). District SSB policy was a significant predictor of SSB exposure (beta=-9.50, p < .0002).
After-School Research Relevant Peer-Reviewed Publication Key Findings
Wiecha JL, Hall G, Gannett E, Roth B. Development of healthy eating and physical activity quality standards for out-of-school time programs. Child Obes . 2012;8(6):572-576.
The 11 standards address content, curriculum selection, staff training, program support, and environmental support for healthy eating and physical activity. In April, 2011, the HEPAQS were adopted by the National AfterSchool Association, and have subsequently been widely disseminated. Extensive adoption and implementation efforts are underway.
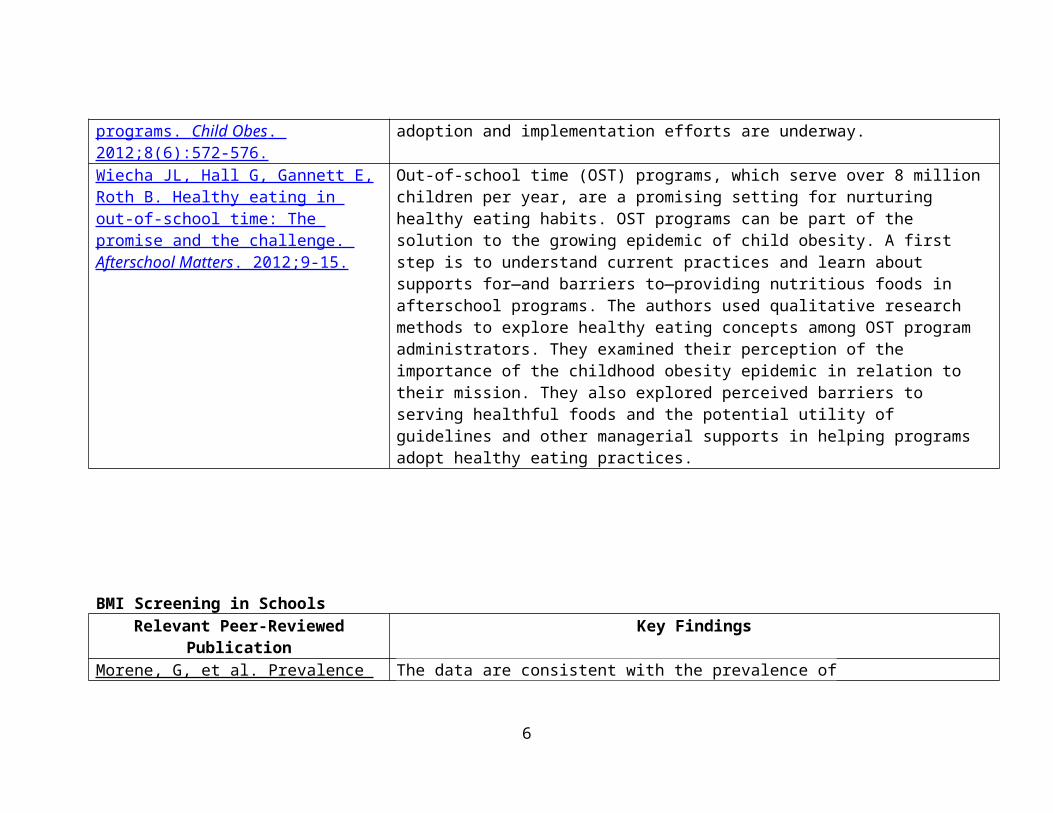
Wiecha JL, Hall G, Gannett E, Roth B. Healthy eating in out-of-school time: The promise and the challenge. Afterschool Matters . 2012;9-15.
Out-of-school time (OST) programs, which serve over 8 million children per year, are a promising setting for nurturing healthy eating habits. OST programs can be part of the solution to the growing epidemic of child obesity. A first step is to understand current practices and learn about supports for—and barriers to—providing nutritious foods in afterschool programs. The authors used qualitative research methods to explore healthy eating concepts among OST program administrators. They examined their perception of the importance of the childhood obesity epidemic in relation to their mission. They also explored perceived barriers to serving healthful foods and the potential utility of guidelines and other managerial supports in helping programs adopt healthy eating practices.
4
BMI Screening in SchoolsRelevant Peer-Reviewed Publication Key Findings
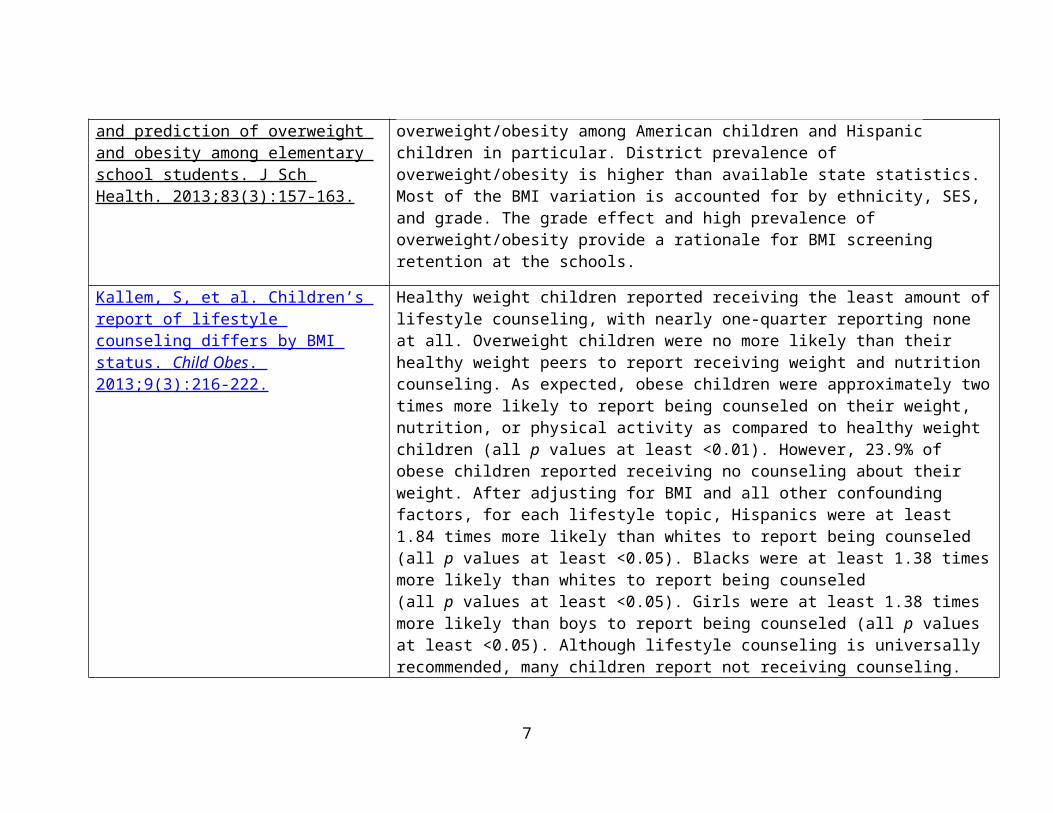
Morene, G, et al. Prevalence and prediction of overweight and obesity among elementary school students. J Sch Health. 2013;83(3):157-163.
The data are consistent with the prevalence of overweight/obesity among American children and Hispanic children in particular. District prevalence of overweight/obesity is higher than available state statistics. Most of the BMI variation is accounted for by ethnicity, SES, and grade. The grade effect and high prevalence of overweight/obesity provide a rationale for BMI screening retention at the schools.
Kallem, S, et al. Children’s report of lifestyle counseling differs by BMI status. Child Obes . 2013;9(3):216-222.
Healthy weight children reported receiving the least amount of lifestyle counseling, with nearly one-quarter reporting none at all. Overweight children were no more likely than their healthy weight peers to report receiving weight and nutrition counseling. As expected, obese children were approximately two times more likely to report being counseled on their weight, nutrition, or physical activity as compared to healthy weight children (all p values at least <0.01). However, 23.9% of obese children reported receiving no counseling about their weight. After adjusting for BMI and all other confounding factors, for each lifestyle topic, Hispanics were at least 1.84 times more likely than whites to report being counseled (all p values at least <0.05). Blacks were at least 1.38 times more likely than whites to report being counseled (all p values at least <0.05). Girls were at least 1.38 times more likely than boys to report being counseled (all p values at least <0.05). Although lifestyle counseling is universally recommended, many children report not receiving counseling. Despite clinical indications for more intensive counseling, overweight children report similar counseling rates as their healthy weight peers. Furthermore, a substantial proportion of obese children report not receiving lifestyle counseling. Future research should examine how lifestyle counseling can more effectively reach all children.
5
Classroom Parties Relevant Peer-Reviewed Publication Key Findings
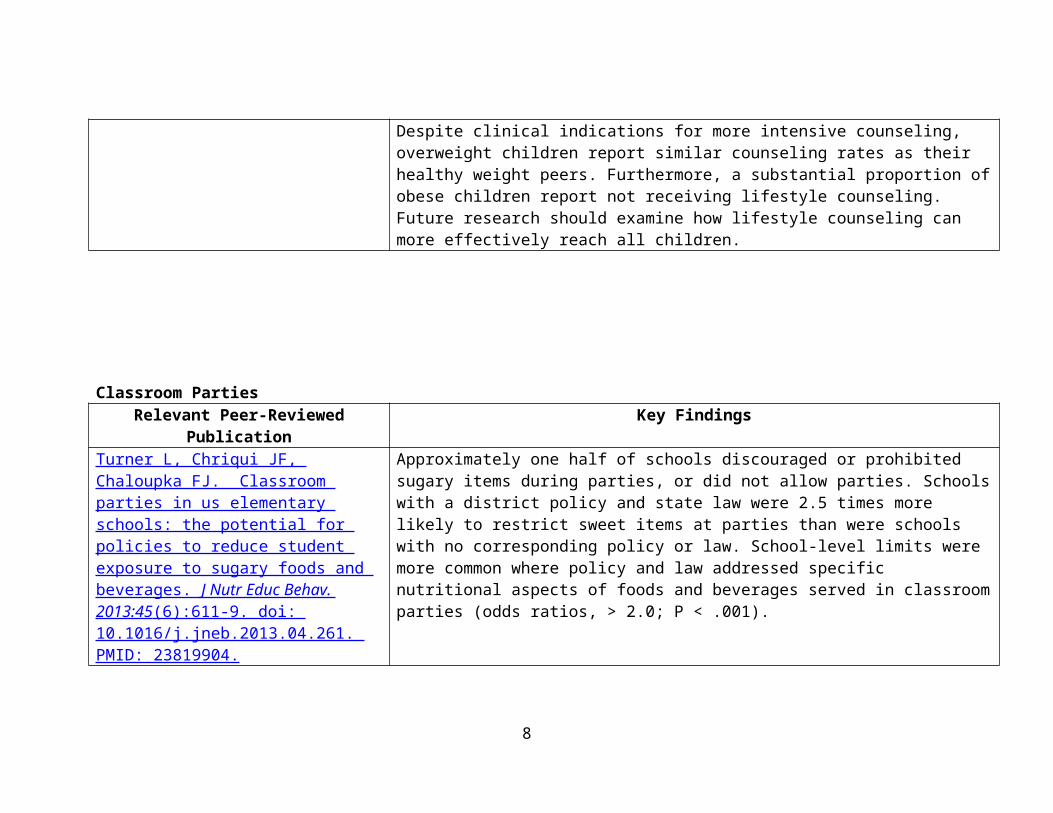
Turner L, Chriqui JF, Chaloupka FJ. Classroom parties in us elementary schools: the potential for policies to reduce student exposure to sugary foods and beverages. J Nutr Educ Behav. 2013:45 (6):611-9. doi: 10.1016/j.jneb.2013.04.261. PMID: 23819904.
Approximately one half of schools discouraged or prohibited sugary items during parties, or did not allow parties. Schools with a district policy and state law were 2.5 times more likely to restrict sweet items at parties than were schools with no corresponding policy or law. School-level limits were more common where policy and law addressed specific nutritional aspects of foods and beverages served in classroom parties (odds ratios, > 2.0; P < .001).
Commodities Relevant Report: Hecht K, Sharp M, Beller D, et al. The Federal Child Nutrition Commodity Program: A Report on
Nutritional Quality . Oakland, CA: California Food Policy Advocates; Samuels & Associates; September 2008.
Competitive Foods Relevant Peer-Reviewed Publication Key Findings
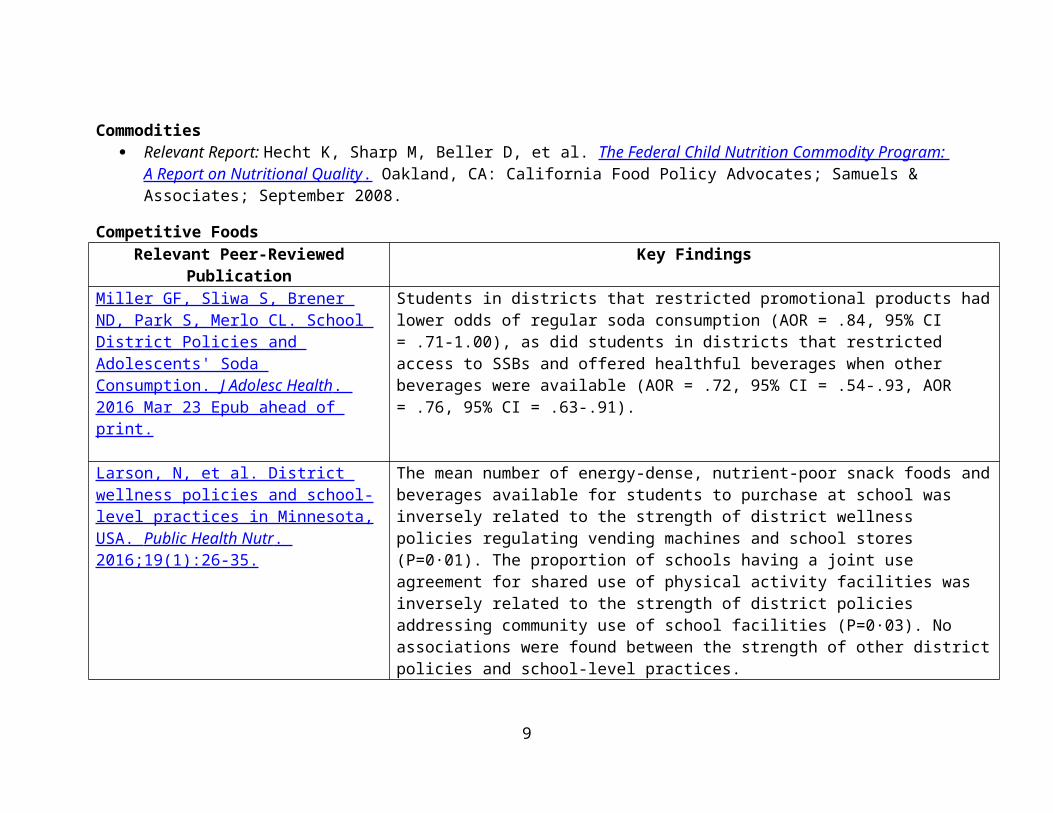
Miller GF, Sliwa S, Brener ND, Park S, Merlo CL. School District Policies and Adolescents' Soda Consumption. J Adolesc Health . 2016 Mar 23 Epub ahead of print.
Students in districts that restricted promotional products had lower odds of regular soda consumption (AOR = .84, 95% CI = .71-1.00), as did students in districts that restricted access to SSBs and offered healthful beverages when other beverages were available (AOR = .72, 95% CI = .54-.93, AOR = .76, 95% CI = .63-.91).
Larson, N, et al. District wellness policies and school-level practices in Minnesota, USA. Public Health Nutr . 2016;19(1):26-35.
The mean number of energy-dense, nutrient-poor snack foods and beverages available for students to purchase at school was inversely related to the strength of district wellness policies regulating vending machines and school stores (P=0·01). The proportion of schools having a joint use agreement for shared use of physical activity facilities was inversely related to the strength of district policies addressing
6
community use of school facilities (P=0·03). No associations were found between the strength of other district policies and school-level practices.
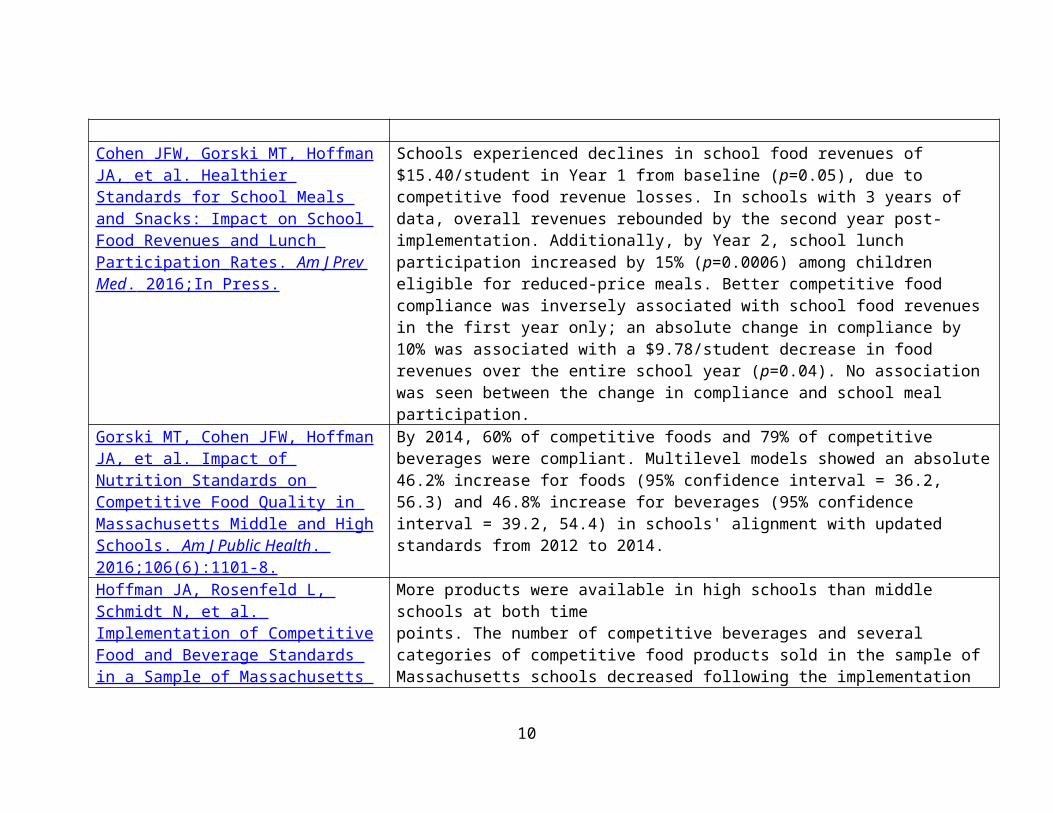
Cohen JFW, Gorski MT, Hoffman JA, et al. Healthier Standards for School Meals and Snacks: Impact on School Food Revenues and Lunch Participation Rates. Am J Prev Med . 2016;In Press.
Schools experienced declines in school food revenues of $15.40/student in Year 1 from baseline (p=0.05), due to competitive food revenue losses. In schools with 3 years of data, overall revenues rebounded by the second year post-implementation. Additionally, by Year 2, school lunch participation increased by 15% (p=0.0006) among children eligible for reduced-price meals. Better competitive food compliance was inversely associated with school food revenues in the first year only; an absolute change in compliance by 10% was associated with a $9.78/student decrease in food revenues over the entire school year (p=0.04). No association was seen between the change in compliance and school meal participation.
Gorski MT, Cohen JFW, Hoffman JA, et al. Impact of Nutrition Standards on Competitive Food Quality in Massachusetts Middle and High Schools. Am J Public Health . 2016;106(6):1101-8.
By 2014, 60% of competitive foods and 79% of competitive beverages were compliant. Multilevel models showed an absolute 46.2% increase for foods (95% confidence interval = 36.2, 56.3) and 46.8% increase for beverages (95% confidence interval = 39.2, 54.4) in schools' alignment with updated standards from 2012 to 2014.
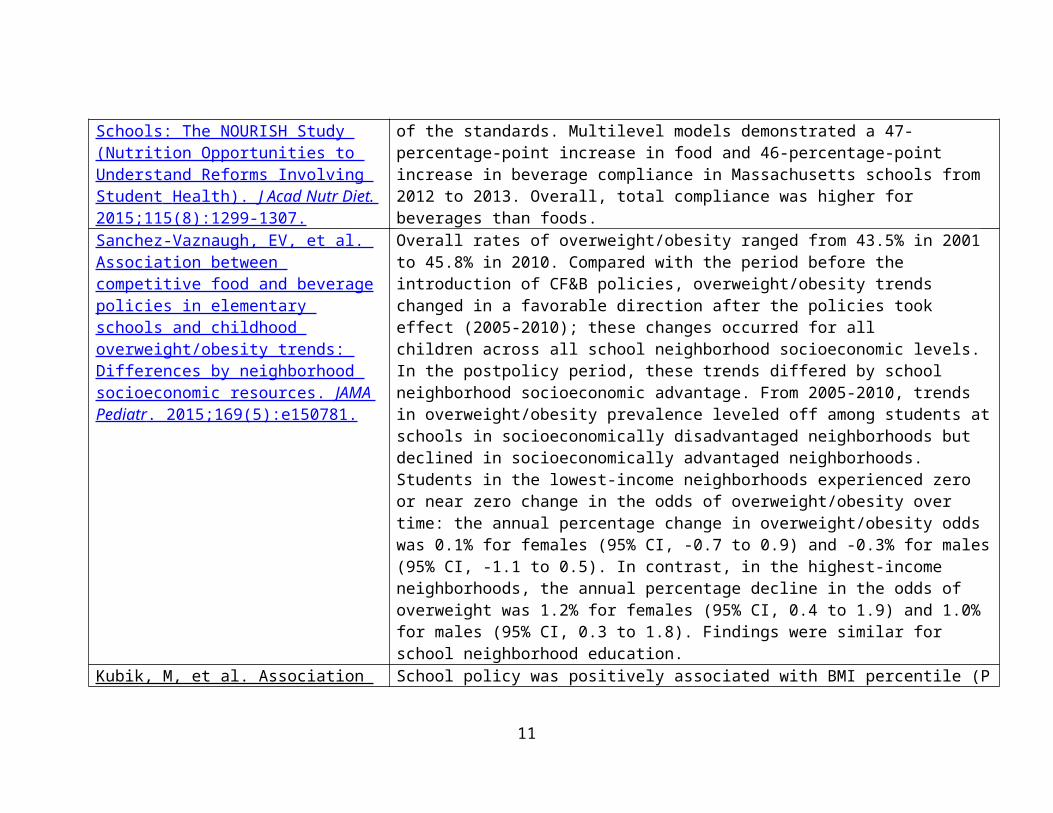
Hoffman JA, Rosenfeld L, Schmidt N, et al. Implementation of Competitive Food and Beverage Standards in a Sample of Massachusetts Schools: The NOURISH Study (Nutrition Opportunities to Understand Reforms Involving Student Health). J Acad Nutr Diet. 2015;115(8):1299-1307.
More products were available in high schools than middle schools at both timepoints. The number of competitive beverages and several categories of competitive food products sold in the sample of Massachusetts schools decreased following the implementation of the standards. Multilevel models demonstrated a 47-percentage-point increase in food and 46-percentage-point increase in beverage compliance in Massachusetts schools from 2012 to 2013. Overall, total compliance was higher for beverages than foods.
Sanchez-Vaznaugh, EV, et al. Association between competitive food and beverage policies in elementary schools and childhood overweight/obesity trends: Differences
Overall rates of overweight/obesity ranged from 43.5% in 2001 to 45.8% in 2010. Compared with the period before the introduction of CF&B policies, overweight/obesity trends changed in a favorable direction after the policies took effect (2005-2010); these changes occurred for all children across all school neighborhood socioeconomic levels. In the postpolicy period, these trends differed
7
by neighborhood socioeconomic resources. JAMA Pediatr . 2015;169(5):e150781.
by school neighborhood socioeconomic advantage. From 2005-2010, trends in overweight/obesity prevalence leveled off among students at schools in socioeconomically disadvantaged neighborhoods but declined in socioeconomically advantaged neighborhoods. Students in the lowest-income neighborhoods experienced zero or near zero change in the odds of overweight/obesity over time: the annual percentage change in overweight/obesity odds was 0.1% for females (95% CI, -0.7 to 0.9) and -0.3% for males (95% CI, -1.1 to 0.5). In contrast, in the highest-income neighborhoods, the annual percentage decline in the odds of overweight was 1.2% for females (95% CI, 0.4 to 1.9) and 1.0% for males (95% CI, 0.3 to 1.8). Findings were similar for school neighborhood education.
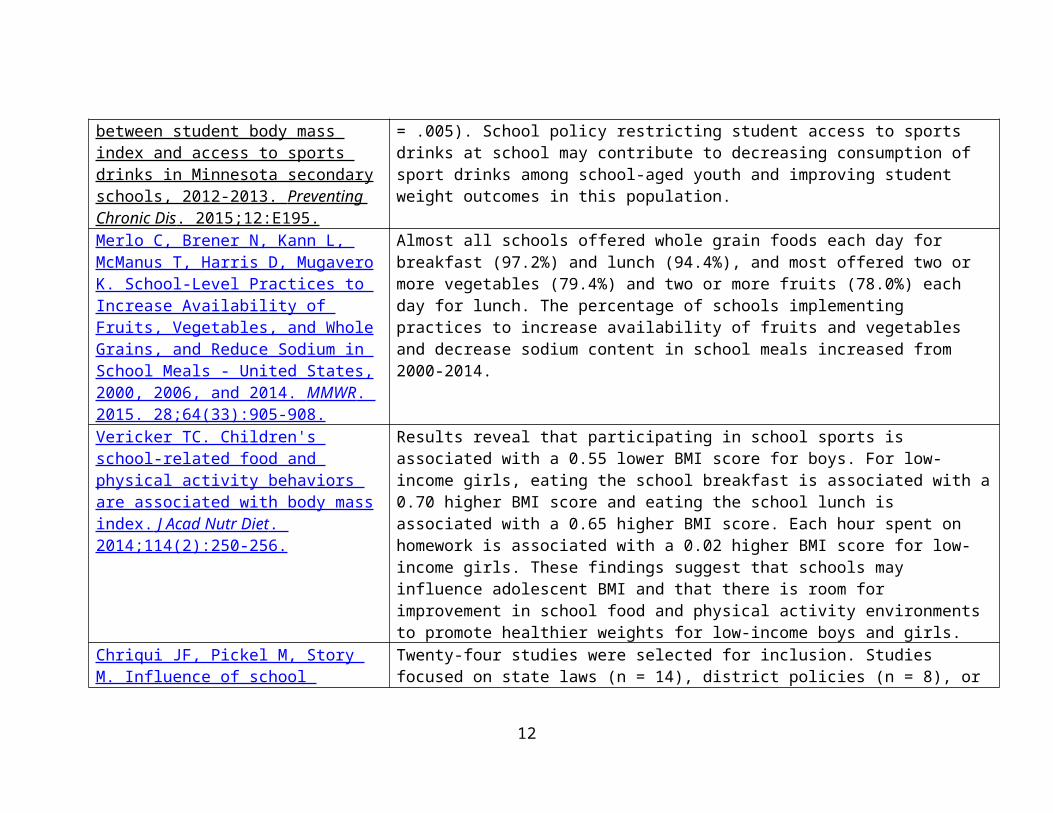
Kubik, M, et al. Association between student body mass index and access to sports drinks in Minnesota secondary schools, 2012-2013. Preventing Chronic Dis . 2015;12:E195.
School policy was positively associated with BMI percentile (P = .005). School policy restricting student access to sports drinks at school may contribute to decreasing consumption of sport drinks among school-aged youth and improving student weight outcomes in this population.
Merlo C, Brener N, Kann L, McManus T, Harris D, Mugavero K. School-Level Practices to Increase Availability of Fruits, Vegetables, and Whole Grains, and Reduce Sodium in School Meals - United States, 2000, 2006, and 2014. MMWR . 2015. 28;64(33):905-908.
Almost all schools offered whole grain foods each day for breakfast (97.2%) and lunch (94.4%), and most offered two or more vegetables (79.4%) and two or more fruits (78.0%) each day for lunch. The percentage of schools implementing practices to increase availability of fruits and vegetables and decrease sodium content in school meals increased from 2000-2014.
Vericker TC. Children's school-related food and physical activity behaviors are associated with body mass index. J Acad Nutr Diet . 2014;114(2):250-256.
Results reveal that participating in school sports is associated with a 0.55 lower BMI score for boys. For low-income girls, eating the school breakfast is associated with a 0.70 higher BMI score and eating the school lunch is associated with a 0.65 higher BMI score. Each hour spent on homework is associated with a 0.02 higher BMI score for low-income girls. These findings suggest that schools may influence adolescent BMI and that there is room for improvement in school food and physical activity environments to promote healthier weights for low-income boys and girls.
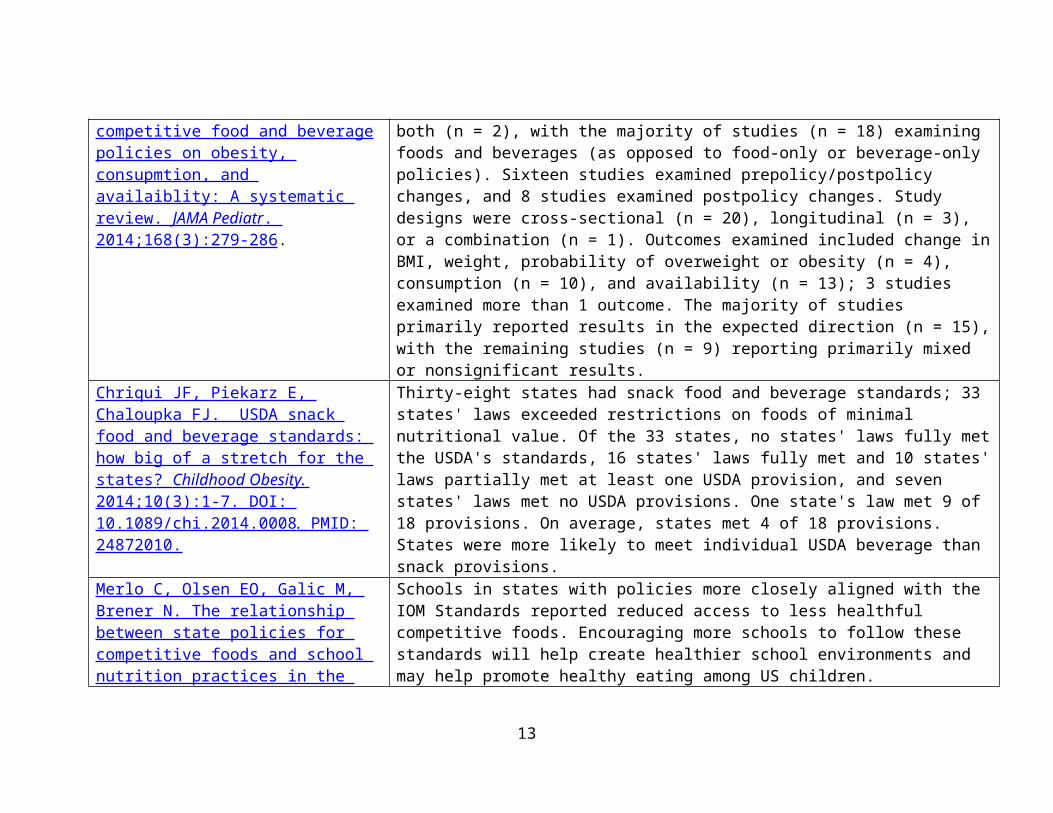
Chriqui JF, Pickel M, Story M. Influence of school competitive food and
Twenty-four studies were selected for inclusion. Studies focused on state laws (n = 14), district policies (n = 8), or both (n = 2), with the majority of studies (n = 18)
8
beverage policies on obesity, consupmtion, and availaiblity: A systematic review. JAMA Pediatr . 2014;168(3):279-286.
examining foods and beverages (as opposed to food-only or beverage-only policies). Sixteen studies examined prepolicy/postpolicy changes, and 8 studies examined postpolicy changes. Study designs were cross-sectional (n = 20), longitudinal (n = 3), or a combination (n = 1). Outcomes examined included change in BMI, weight, probability of overweight or obesity (n = 4), consumption (n = 10), and availability (n = 13); 3 studies examined more than 1 outcome. The majority of studies primarily reported results in the expected direction (n = 15), with the remaining studies (n = 9) reporting primarily mixed or nonsignificant results.
Chriqui JF, Piekarz E, Chaloupka FJ. USDA snack food and beverage standards: how big of a stretch for the states? Childhood Obesity. 2014; 10(3):1-7. DOI: 10.1089/chi.2014.0008 . PMID: 24872010.
Thirty-eight states had snack food and beverage standards; 33 states' laws exceeded restrictions on foods of minimal nutritional value. Of the 33 states, no states' laws fully met the USDA's standards, 16 states' laws fully met and 10 states' laws partially met at least one USDA provision, and seven states' laws met no USDA provisions. One state's law met 9 of 18 provisions. On average, states met 4 of 18 provisions. States were more likely to meet individual USDA beverage than snack provisions.
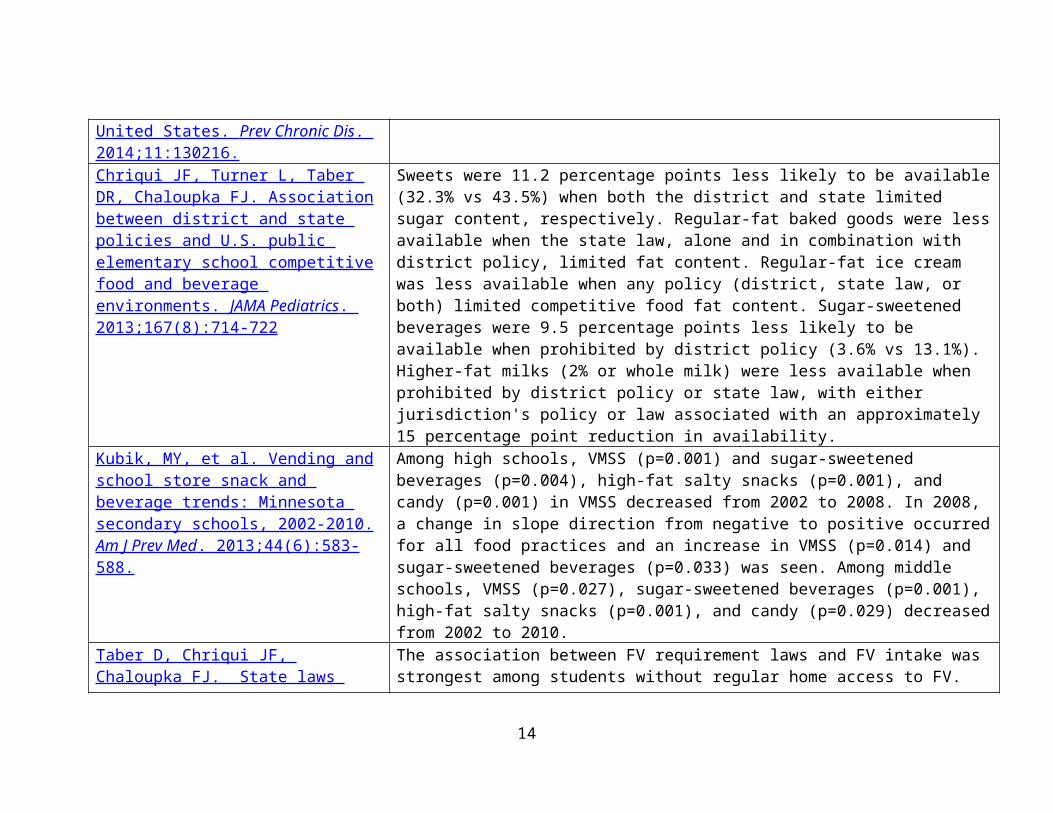
Merlo C, Olsen EO, Galic M, Brener N. The relationship between state policies for competitive foods and school nutrition practices in the United States. Prev Chronic Dis . 2014;11:130216.
Schools in states with policies more closely aligned with the IOM Standards reported reduced access to less healthful competitive foods. Encouraging more schools to follow these standards will help create healthier school environments and may help promote healthy eating among US children.
Chriqui JF, Turner L, Taber DR, Chaloupka FJ. Association between district and state policies and U.S. public elementary school competitive food and beverage environments. JAMA Pediatrics . 2013;167(8):714-722
Sweets were 11.2 percentage points less likely to be available (32.3% vs 43.5%) when both the district and state limited sugar content, respectively. Regular-fat baked goods were less available when the state law, alone and in combination with district policy, limited fat content. Regular-fat ice cream was less available when any policy (district, state law, or both) limited competitive food fat content. Sugar-sweetened beverages were 9.5 percentage points less likely to be available when prohibited by district policy (3.6% vs 13.1%). Higher-fat milks (2% or whole milk) were less available when prohibited by district policy or state law, with either jurisdiction's policy or law associated with an approximately 15 percentage point reduction in availability.
9
Kubik, MY, et al. Vending and school store snack and beverage trends: Minnesota secondary schools, 2002-2010. Am J Prev Med . 2013;44(6):583- 588.
Among high schools, VMSS (p=0.001) and sugar-sweetened beverages (p=0.004), high-fat salty snacks (p=0.001), and candy (p=0.001) in VMSS decreased from 2002 to 2008. In 2008, a change in slope direction from negative to positive occurred for all food practices and an increase in VMSS (p=0.014) and sugar-sweetened beverages (p=0.033) was seen. Among middle schools, VMSS (p=0.027), sugar-sweetened beverages (p=0.001), high-fat salty snacks (p=0.001), and candy (p=0.029) decreased from 2002 to 2010.
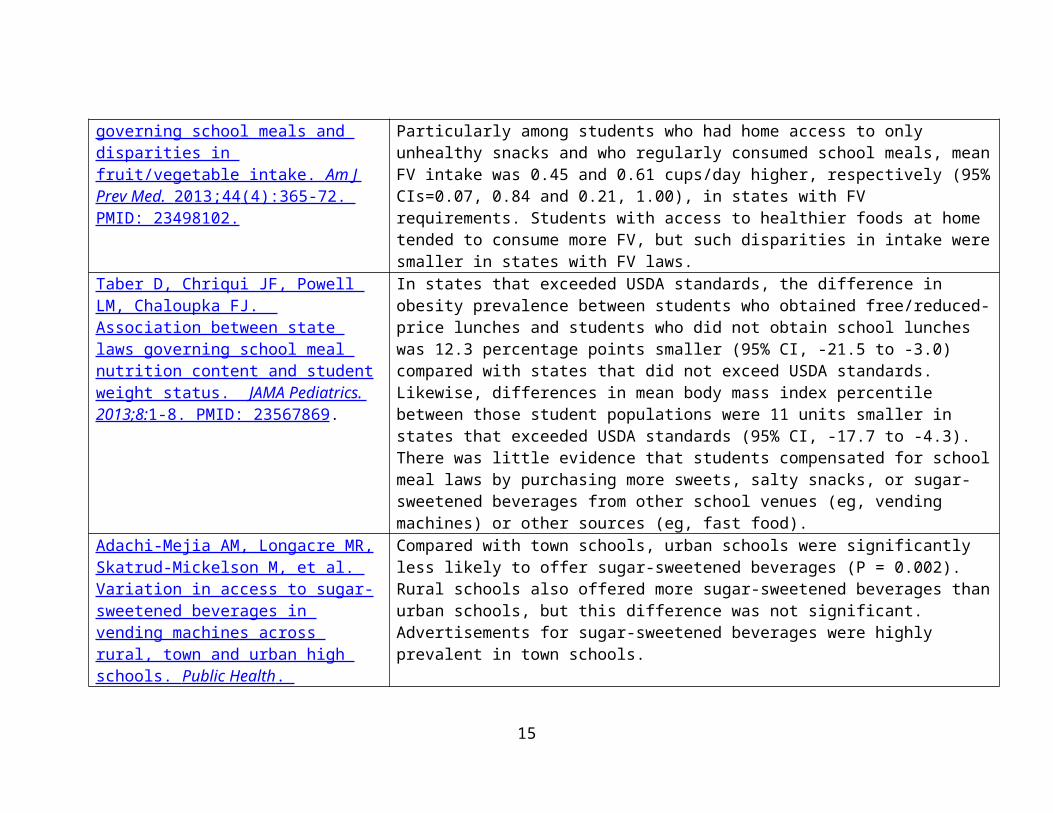
Taber D, Chriqui JF, Chaloupka FJ. State laws governing school meals and disparities in fruit/vegetable intake. Am J Prev Med. 2013;44 (4):365-72. PMID: 23498102.
The association between FV requirement laws and FV intake was strongest among students without regular home access to FV. Particularly among students who had home access to only unhealthy snacks and who regularly consumed school meals, mean FV intake was 0.45 and 0.61 cups/day higher, respectively (95% CIs=0.07, 0.84 and 0.21, 1.00), in states with FV requirements. Students with access to healthier foods at home tended to consume more FV, but such disparities in intake were smaller in states with FV laws.
Taber D, Chriqui JF, Powell LM, Chaloupka FJ. Association between state laws governing school meal nutrition content and student weight status. JAMA Pediatrics. 2013;8: 1-8. PMID: 23567869.
In states that exceeded USDA standards, the difference in obesity prevalence between students who obtained free/reduced-price lunches and students who did not obtain school lunches was 12.3 percentage points smaller (95% CI, -21.5 to -3.0) compared with states that did not exceed USDA standards. Likewise, differences in mean body mass index percentile between those student populations were 11 units smaller in states that exceeded USDA standards (95% CI, -17.7 to -4.3). There was little evidence that students compensated for school meal laws by purchasing more sweets, salty snacks, or sugar-sweetened beverages from other school venues (eg, vending machines) or other sources (eg, fast food).
Adachi-Mejia AM, Longacre MR, Skatrud-Mickelson M, et al. Variation in access to sugar-sweetened beverages in vending machines across rural, town and urban high schools. Public Health . 2013;127(5):485-491.
Compared with town schools, urban schools were significantly less likely to offer sugar-sweetened beverages (P = 0.002). Rural schools also offered more sugar-sweetened beverages than urban schools, but this difference was not significant. Advertisements for sugar-sweetened beverages were highly prevalent in town schools.
10
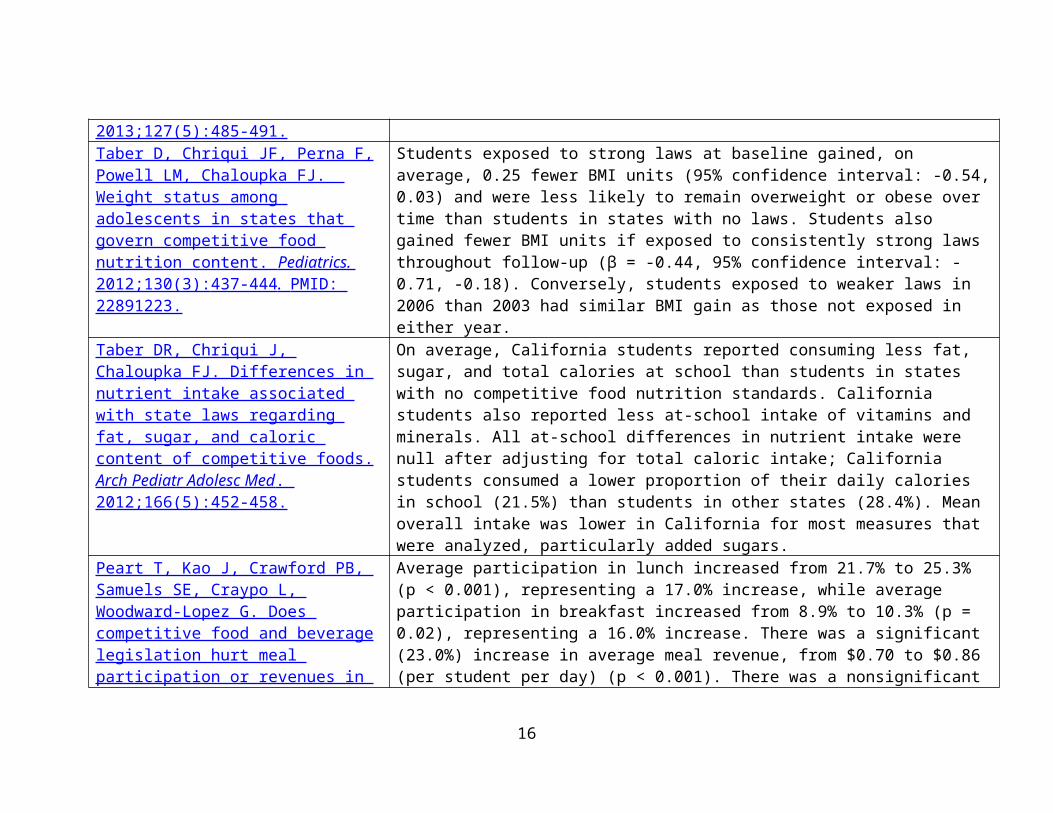
Taber D, Chriqui JF, Perna F, Powell LM, Chaloupka FJ. Weight status among adolescents in states that govern competitive food nutrition content. Pediatrics. 2012;130(3): 437- 444 . PMID: 22891223.
Students exposed to strong laws at baseline gained, on average, 0.25 fewer BMI units (95% confidence interval: -0.54, 0.03) and were less likely to remain overweight or obese over time than students in states with no laws. Students also gained fewer BMI units if exposed to consistently strong laws throughout follow-up (β = -0.44, 95% confidence interval: -0.71, -0.18). Conversely, students exposed to weaker laws in 2006 than 2003 had similar BMI gain as those not exposed in either year.
Taber DR, Chriqui J, Chaloupka FJ. Differences in nutrient intake associated with state laws regarding fat, sugar, and caloric content of competitive foods. Arch Pediatr Adolesc Med . 2012;166(5):452-458.
On average, California students reported consuming less fat, sugar, and total calories at school than students in states with no competitive food nutrition standards. California students also reported less at-school intake of vitamins and minerals. All at-school differences in nutrient intake were null after adjusting for total caloric intake; California students consumed a lower proportion of their daily calories in school (21.5%) than students in other states (28.4%). Mean overall intake was lower in California for most measures that were analyzed, particularly added sugars.
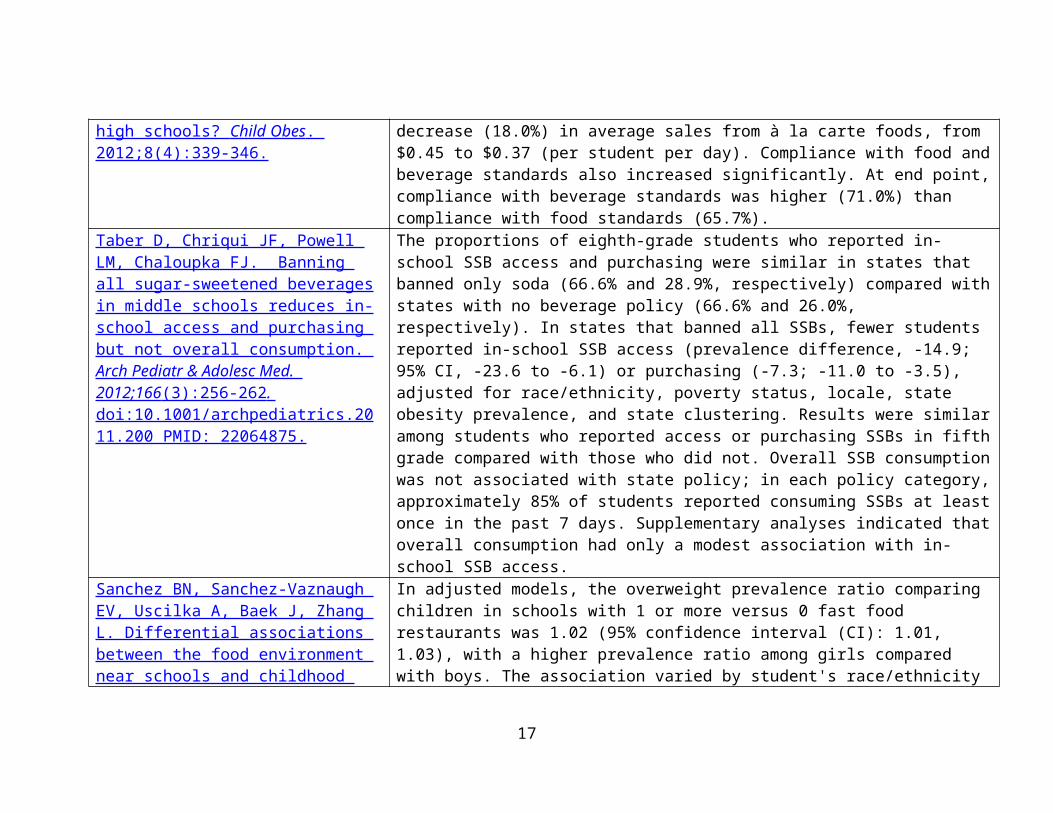
Peart T, Kao J, Crawford PB, Samuels SE, Craypo L, Woodward-Lopez G. Does competitive food and beverage legislation hurt meal participation or revenues in high schools? Child Obes . 2012;8(4):339-346.
Average participation in lunch increased from 21.7% to 25.3% (p < 0.001), representing a 17.0% increase, while average participation in breakfast increased from 8.9% to 10.3% (p = 0.02), representing a 16.0% increase. There was a significant (23.0%) increase in average meal revenue, from $0.70 to $0.86 (per student per day) (p < 0.001). There was a nonsignificant decrease (18.0%) in average sales from à la carte foods, from $0.45 to $0.37 (per student per day). Compliance with food and beverage standards also increased significantly. At end point, compliance with beverage standards was higher (71.0%) than compliance with food standards (65.7%).
Taber D, Chriqui JF, Powell LM, Chaloupka FJ. Banning all sugar-sweetened beverages in middle schools reduces in-school access and purchasing but not overall consumption. Arch Pediatr & Adolesc Med. 2012;166 (3):256-262 . doi:10.1001/archpediatrics.2011.200
The proportions of eighth-grade students who reported in-school SSB access and purchasing were similar in states that banned only soda (66.6% and 28.9%, respectively) compared with states with no beverage policy (66.6% and 26.0%, respectively). In states that banned all SSBs, fewer students reported in-school SSB access (prevalence difference, -14.9; 95% CI, -23.6 to -6.1) or purchasing (-7.3; -11.0 to -3.5), adjusted for race/ethnicity, poverty status, locale, state obesity prevalence, and state clustering. Results were similar among students who reported access or purchasing SSBs in fifth grade compared with those who did not. Overall
11
PMID: 22064875. SSB consumption was not associated with state policy; in each policy category, approximately 85% of students reported consuming SSBs at least once in the past 7 days. Supplementary analyses indicated that overall consumption had only a modest association with in-school SSB access.
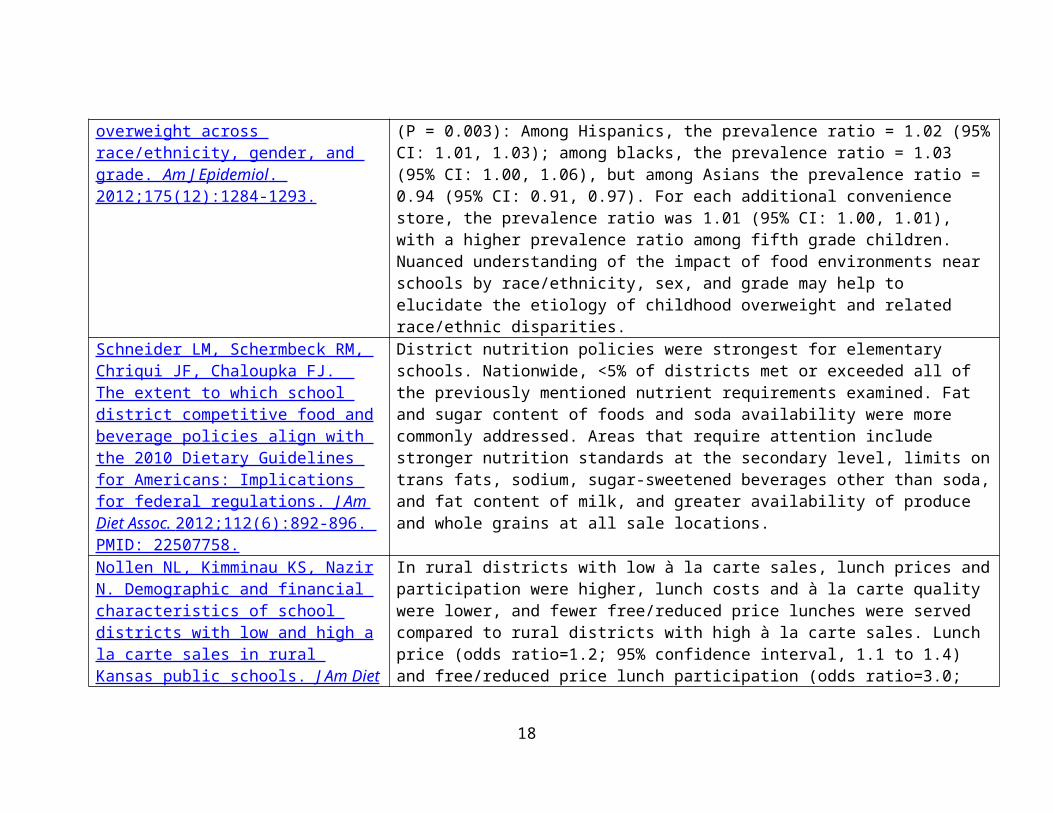
Sanchez BN, Sanchez-Vaznaugh EV, Uscilka A, Baek J, Zhang L. Differential associations between the food environment near schools and childhood overweight across race/ethnicity, gender, and grade. Am J Epidemiol . 2012;175(12):1284-1293.
In adjusted models, the overweight prevalence ratio comparing children in schools with 1 or more versus 0 fast food restaurants was 1.02 (95% confidence interval (CI): 1.01, 1.03), with a higher prevalence ratio among girls compared with boys. The association varied by student's race/ethnicity (P = 0.003): Among Hispanics, the prevalence ratio = 1.02 (95% CI: 1.01, 1.03); among blacks, the prevalence ratio = 1.03 (95% CI: 1.00, 1.06), but among Asians the prevalence ratio = 0.94 (95% CI: 0.91, 0.97). For each additional convenience store, the prevalence ratio was 1.01 (95% CI: 1.00, 1.01), with a higher prevalence ratio among fifth grade children. Nuanced understanding of the impact of food environments near schools by race/ethnicity, sex, and grade may help to elucidate the etiology of childhood overweight and related race/ethnic disparities.
Schneider LM, Schermbeck RM, Chriqui JF, Chaloupka FJ. The extent to which school district competitive food and beverage policies align with the 2010 Dietary Guidelines for Americans: Implications for federal regulations. J Am Diet Assoc. 2012;112(6): 892-896. PMID: 22507758.
District nutrition policies were strongest for elementary schools. Nationwide, <5% of districts met or exceeded all of the previously mentioned nutrient requirements examined. Fat and sugar content of foods and soda availability were more commonly addressed. Areas that require attention include stronger nutrition standards at the secondary level, limits on trans fats, sodium, sugar-sweetened beverages other than soda, and fat content of milk, and greater availability of produce and whole grains at all sale locations.
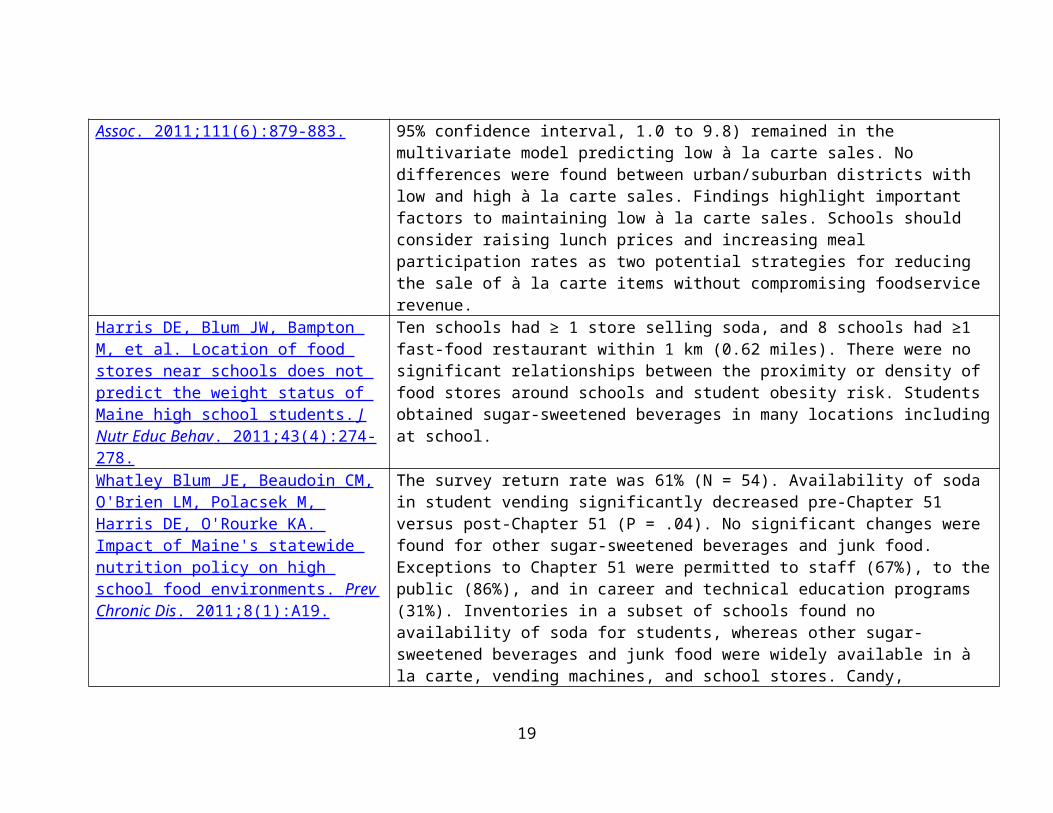
Nollen NL, Kimminau KS, Nazir N. Demographic and financial characteristics of school districts with low and high a la carte sales in rural Kansas public schools. J Am Diet Assoc . 2011;111(6):879-883.
In rural districts with low à la carte sales, lunch prices and participation were higher, lunch costs and à la carte quality were lower, and fewer free/reduced price lunches were served compared to rural districts with high à la carte sales. Lunch price (odds ratio=1.2; 95% confidence interval, 1.1 to 1.4) and free/reduced price lunch participation (odds ratio=3.0; 95% confidence interval, 1.0 to 9.8) remained in the multivariate model predicting low à la carte sales. No differences were found between urban/suburban districts with low and high à la carte sales. Findings highlight important factors to maintaining low à la carte sales. Schools should
12
consider raising lunch prices and increasing meal participation rates as two potential strategies for reducing the sale of à la carte items without compromising foodservice revenue.
Harris DE, Blum JW, Bampton M, et al. Location of food stores near schools does not predict the weight status of Maine high school students. J Nutr Educ Behav . 2011;43(4):274-278.
Ten schools had ≥ 1 store selling soda, and 8 schools had ≥1 fast-food restaurant within 1 km (0.62 miles). There were no significant relationships between the proximity or density of food stores around schools and student obesity risk. Students obtained sugar-sweetened beverages in many locations including at school.
Whatley Blum JE, Beaudoin CM, O'Brien LM, Polacsek M, Harris DE, O'Rourke KA. Impact of Maine's statewide nutrition policy on high school food environments. Prev Chronic Dis . 2011;8(1):A19.
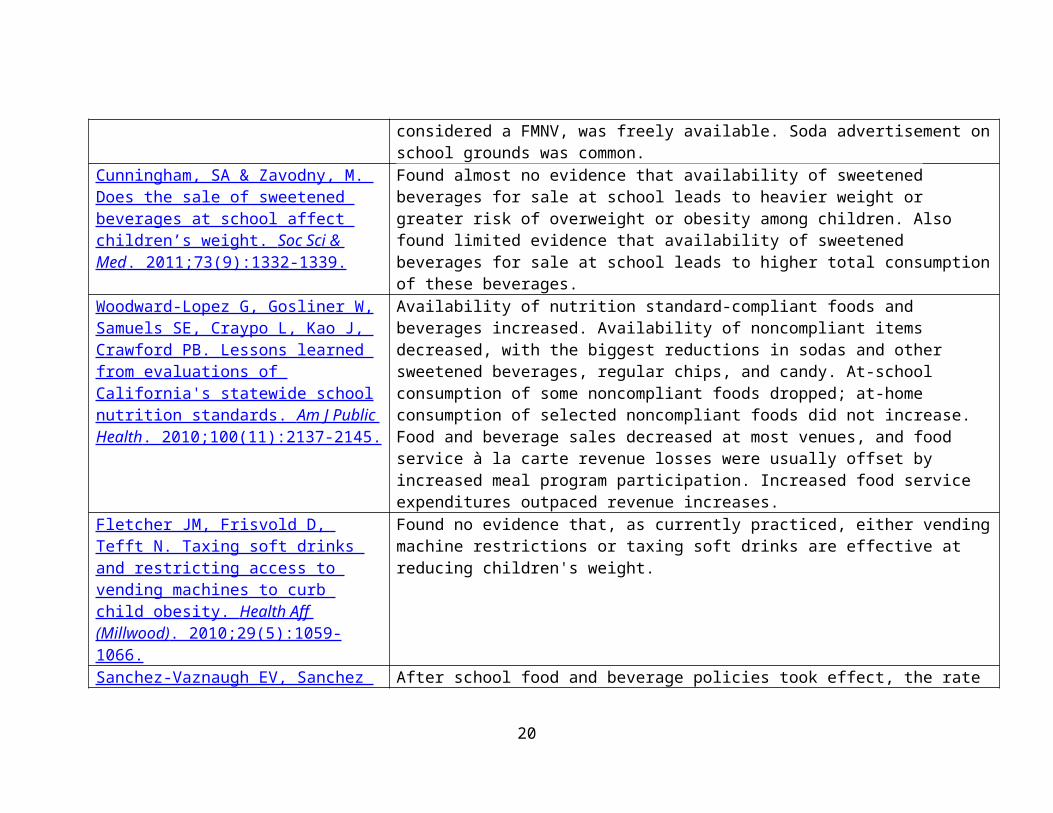
The survey return rate was 61% (N = 54). Availability of soda in student vending significantly decreased pre-Chapter 51 versus post-Chapter 51 (P = .04). No significant changes were found for other sugar-sweetened beverages and junk food. Exceptions to Chapter 51 were permitted to staff (67%), to the public (86%), and in career and technical education programs (31%). Inventories in a subset of schools found no availability of soda for students, whereas other sugar-sweetened beverages and junk food were widely available in à la carte, vending machines, and school stores. Candy, considered a FMNV, was freely available. Soda advertisement on school grounds was common.
Cunningham, SA & Zavodny, M. Does the sale of sweetened beverages at school affect children’s weight. Soc Sci & Med . 2011;73(9):1332-1339.
Found almost no evidence that availability of sweetened beverages for sale at school leads to heavier weight or greater risk of overweight or obesity among children. Also found limited evidence that availability of sweetened beverages for sale at school leads to higher total consumption of these beverages.
Woodward-Lopez G, Gosliner W, Samuels SE, Craypo L, Kao J, Crawford PB. Lessons learned from evaluations of California's statewide school nutrition standards. Am J Public Health . 2010;100(11):2137-2145.
Availability of nutrition standard-compliant foods and beverages increased. Availability of noncompliant items decreased, with the biggest reductions in sodas and other sweetened beverages, regular chips, and candy. At-school consumption of some noncompliant foods dropped; at-home consumption of selected noncompliant foods did not increase. Food and beverage sales decreased at most venues, and food service à la carte revenue losses were usually offset by increased meal program participation. Increased food service expenditures outpaced revenue increases.
Fletcher JM, Frisvold D, Tefft N. Taxing Found no evidence that, as currently practiced, either vending machine restrictions
13
soft drinks and restricting access to vending machines to curb child obesity. Health Aff (Millwood) . 2010;29(5):1059- 1066.
or taxing soft drinks are effective at reducing children's weight.
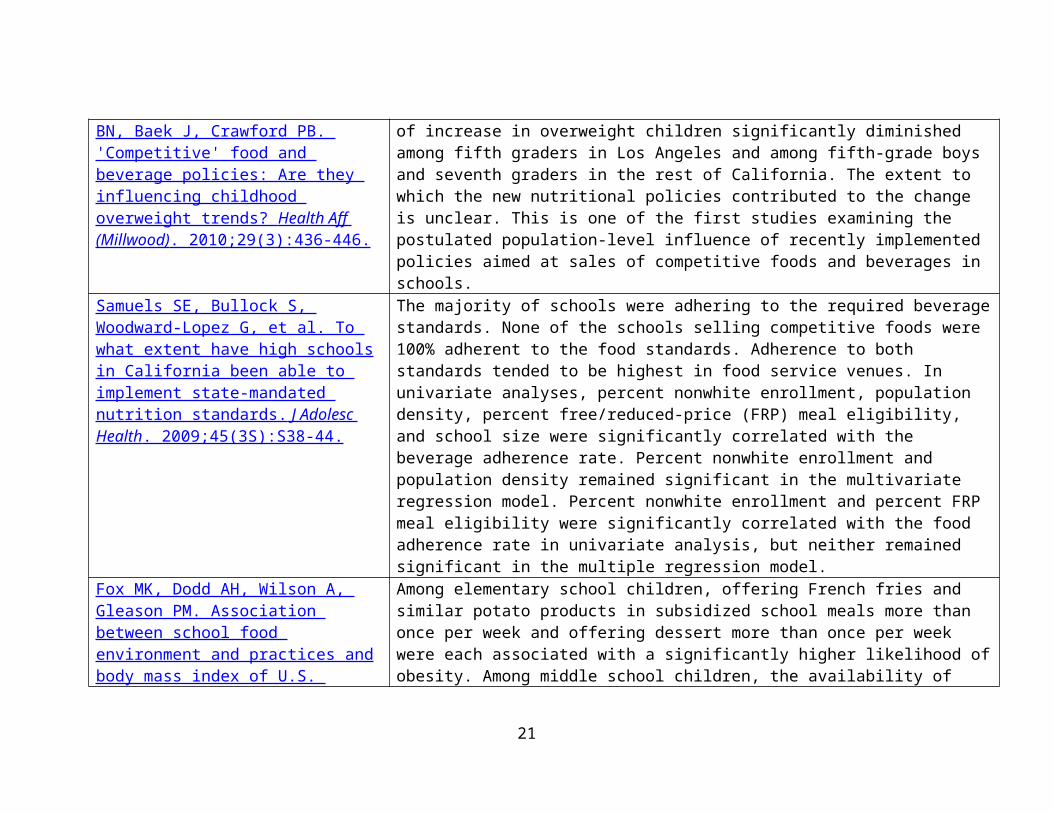
Sanchez-Vaznaugh EV, Sanchez BN, Baek J, Crawford PB. 'Competitive' food and beverage policies: Are they influencing childhood overweight trends? Health Aff (Millwood) . 2010;29(3):436-446.
After school food and beverage policies took effect, the rate of increase in overweight children significantly diminished among fifth graders in Los Angeles and among fifth-grade boys and seventh graders in the rest of California. The extent to which the new nutritional policies contributed to the change is unclear. This is one of the first studies examining the postulated population-level influence of recently implemented policies aimed at sales of competitive foods and beverages in schools.
Samuels SE, Bullock S, Woodward-Lopez G, et al. To what extent have high schools in California been able to implement state-mandated nutrition standards. J Adolesc Health . 2009;45(3S):S38-44.
The majority of schools were adhering to the required beverage standards. None of the schools selling competitive foods were 100% adherent to the food standards. Adherence to both standards tended to be highest in food service venues. In univariate analyses, percent nonwhite enrollment, population density, percent free/reduced-price (FRP) meal eligibility, and school size were significantly correlated with the beverage adherence rate. Percent nonwhite enrollment and population density remained significant in the multivariate regression model. Percent nonwhite enrollment and percent FRP meal eligibility were significantly correlated with the food adherence rate in univariate analysis, but neither remained significant in the multiple regression model.
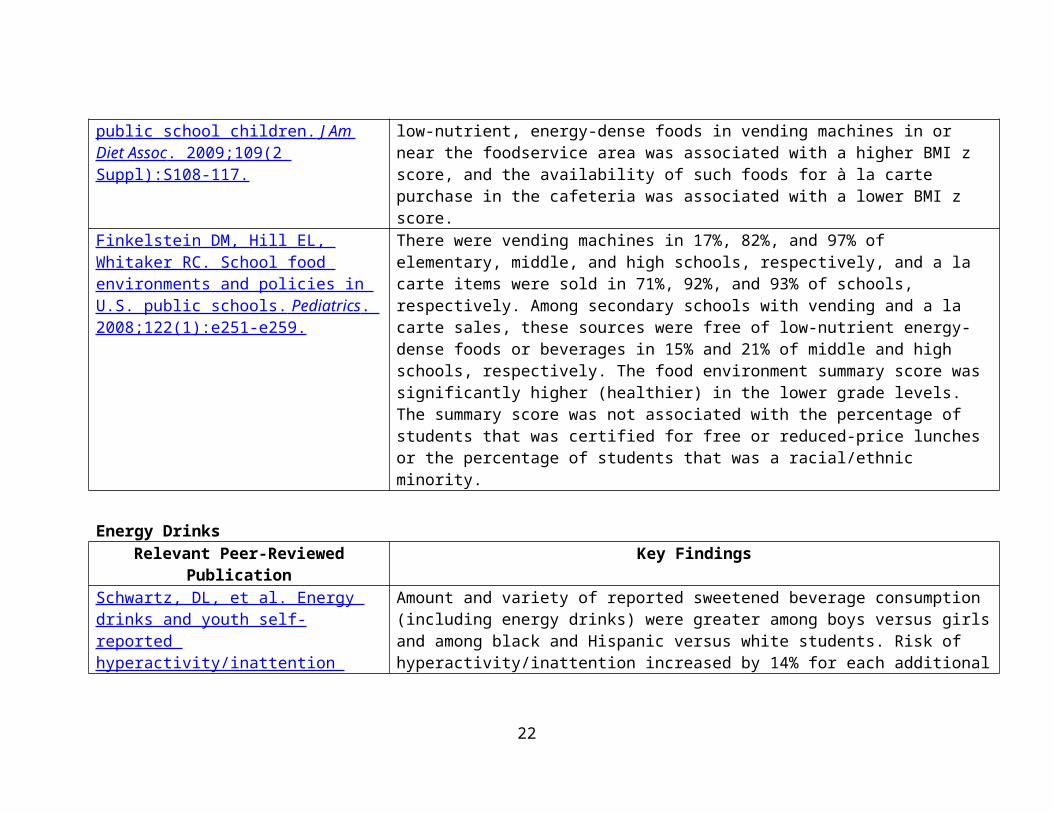
Fox MK, Dodd AH, Wilson A, Gleason PM. Association between school food environment and practices and body mass index of U.S. public school children. J Am Diet Assoc . 2009;109(2 Suppl):S108-117.
Among elementary school children, offering French fries and similar potato products in subsidized school meals more than once per week and offering dessert more than once per week were each associated with a significantly higher likelihood of obesity. Among middle school children, the availability of low-nutrient, energy-dense foods in vending machines in or near the foodservice area was associated with a higher BMI z score, and the availability of such foods for à la carte purchase in the cafeteria was associated with a lower BMI z score.
Finkelstein DM, Hill EL, Whitaker RC. School food environments and policies in U.S. public schools. Pediatrics . 2008;122(1):e251-e259.
There were vending machines in 17%, 82%, and 97% of elementary, middle, and high schools, respectively, and a la carte items were sold in 71%, 92%, and 93% of schools, respectively. Among secondary schools with vending and a la carte sales, these sources were free of low-nutrient energy-dense foods or beverages in 15%
14
and 21% of middle and high schools, respectively. The food environment summary score was significantly higher (healthier) in the lower grade levels. The summary score was not associated with the percentage of students that was certified for free or reduced-price lunches or the percentage of students that was a racial/ethnic minority.
Energy DrinksRelevant Peer-Reviewed Publication Key Findings
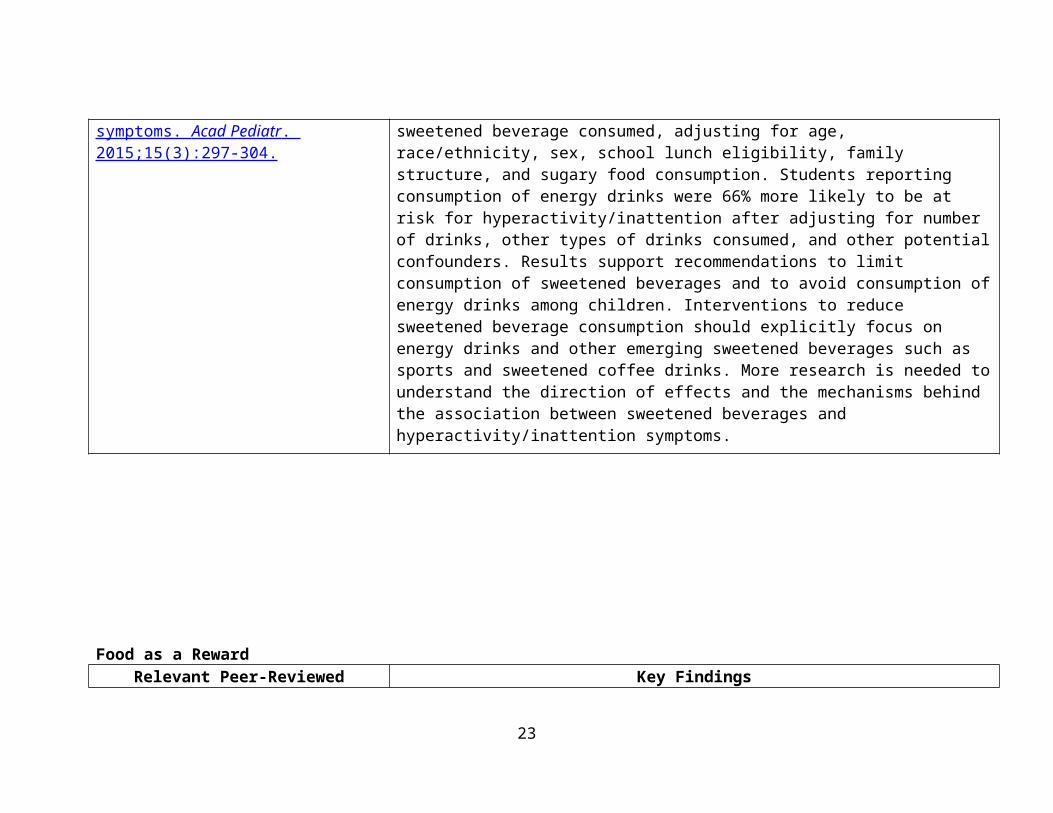
Schwartz, DL, et al. Energy drinks and youth self-reported hyperactivity/inattention symptoms. Acad Pediatr . 2015;15(3):297-304.
Amount and variety of reported sweetened beverage consumption (including energy drinks) were greater among boys versus girls and among black and Hispanic versus white students. Risk of hyperactivity/inattention increased by 14% for each additional sweetened beverage consumed, adjusting for age, race/ethnicity, sex, school lunch eligibility, family structure, and sugary food consumption. Students reporting consumption of energy drinks were 66% more likely to be at risk for hyperactivity/inattention after adjusting for number of drinks, other types of drinks consumed, and other potential confounders. Results support recommendations to limit consumption of sweetened beverages and to avoid consumption of energy drinks among children. Interventions to reduce sweetened beverage consumption should explicitly focus on energy drinks and other emerging sweetened beverages such as sports and sweetened coffee drinks. More research is needed to understand the direction of effects and the mechanisms behind the association between sweetened beverages and hyperactivity/inattention symptoms.
15
Food as a RewardRelevant Peer-Reviewed Publication Key Findings
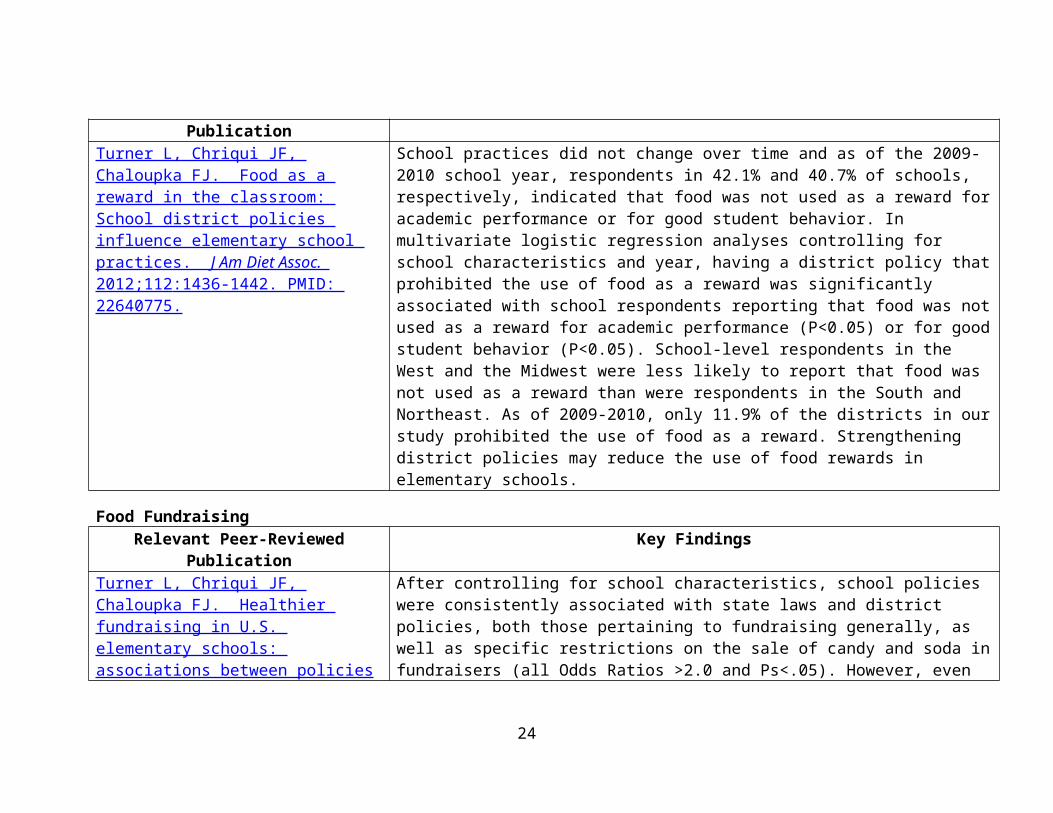
Turner L, Chriqui JF, Chaloupka FJ. Food as a reward in the classroom: School district policies influence elementary school practices. J Am Diet Assoc. 2012;112 :1436-1442. PMID: 22640775.
School practices did not change over time and as of the 2009-2010 school year, respondents in 42.1% and 40.7% of schools, respectively, indicated that food was not used as a reward for academic performance or for good student behavior. In multivariate logistic regression analyses controlling for school characteristics and year, having a district policy that prohibited the use of food as a reward was significantly associated with school respondents reporting that food was not used as a reward for academic performance (P<0.05) or for good student behavior (P<0.05). School-level respondents in the West and the Midwest were less likely to report that food was not used as a reward than were respondents in the South and Northeast. As of 2009-2010, only 11.9% of the districts in our study prohibited the use of food as a reward. Strengthening district policies may reduce the use of food rewards in elementary schools.
Food Fundraising Relevant Peer-Reviewed Publication Key Findings
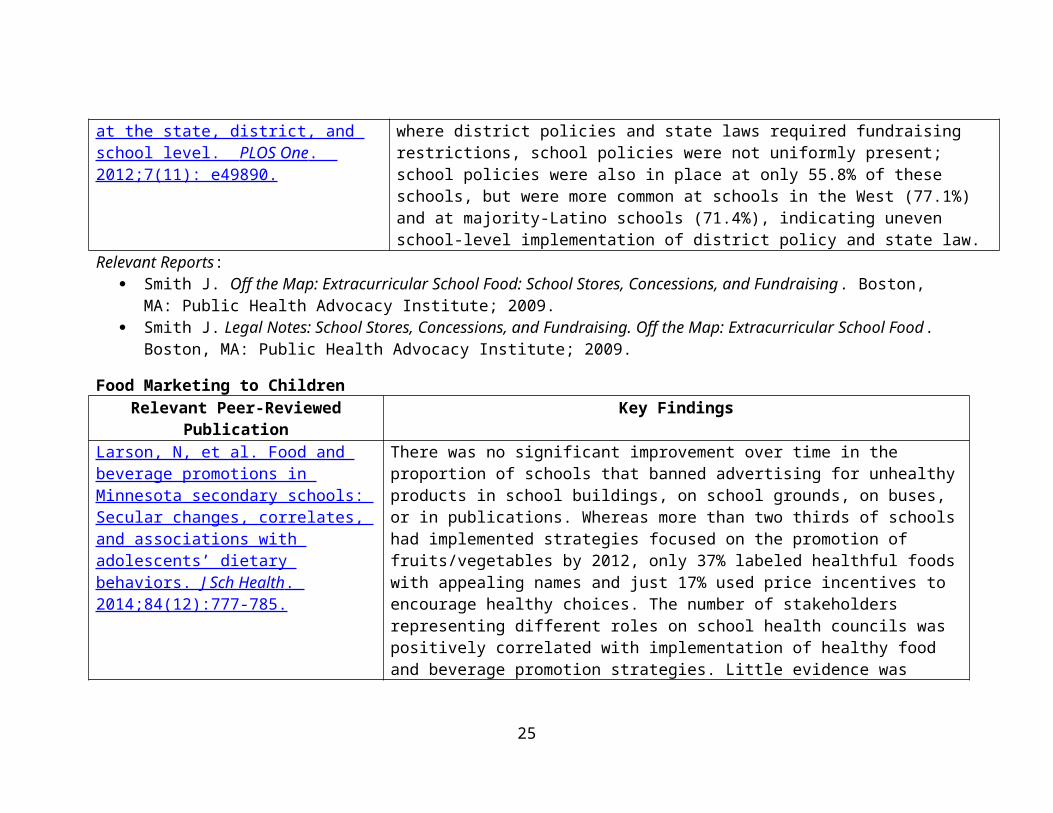
Turner L, Chriqui JF, Chaloupka FJ. Healthier fundraising in U.S. elementary schools: associations between policies at the state, district, and school level. PLOS One . 2012;7(11): e49890.
After controlling for school characteristics, school policies were consistently associated with state laws and district policies, both those pertaining to fundraising generally, as well as specific restrictions on the sale of candy and soda in fundraisers (all Odds Ratios >2.0 and Ps<.05). However, even where district policies and state laws required fundraising restrictions, school policies were not uniformly present; school policies were also in place at only 55.8% of these schools, but were more common at schools in the West (77.1%) and at majority-Latino schools (71.4%), indicating uneven school-level implementation of district policy and state law.
Relevant Reports: Smith J. Off the Map: Extracurricular School Food: School Stores, Concessions, and Fundraising. Boston, MA:
Public Health Advocacy Institute; 2009.
16
Smith J. Legal Notes: School Stores, Concessions, and Fundraising. Off the Map: Extracurricular School Food. Boston, MA: Public Health Advocacy Institute; 2009.
Food Marketing to Children Relevant Peer-Reviewed Publication Key FindingsLarson, N, et al. Food and beverage promotions in Minnesota secondary schools: Secular changes, correlates, and associations with adolescents’ dietary behaviors. J Sch Health . 2014;84(12):777-785.
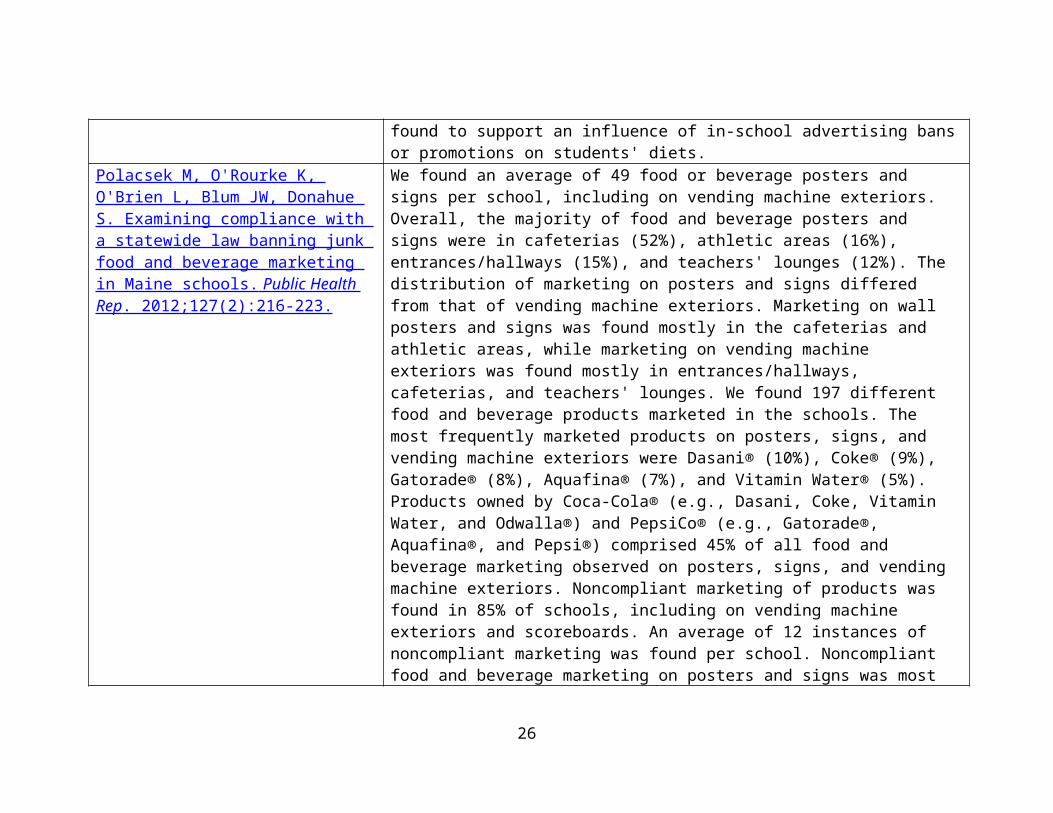
There was no significant improvement over time in the proportion of schools that banned advertising for unhealthy products in school buildings, on school grounds, on buses, or in publications. Whereas more than two thirds of schools had implemented strategies focused on the promotion of fruits/vegetables by 2012, only 37% labeled healthful foods with appealing names and just 17% used price incentives to encourage healthy choices. The number of stakeholders representing different roles on school health councils was positively correlated with implementation of healthy food and beverage promotion strategies. Little evidence was found to support an influence of in-school advertising bans or promotions on students' diets.
Polacsek M, O'Rourke K, O'Brien L, Blum JW, Donahue S. Examining compliance with a statewide law banning junk food and beverage marketing in Maine schools. Public Health Rep . 2012;127(2):216-223.
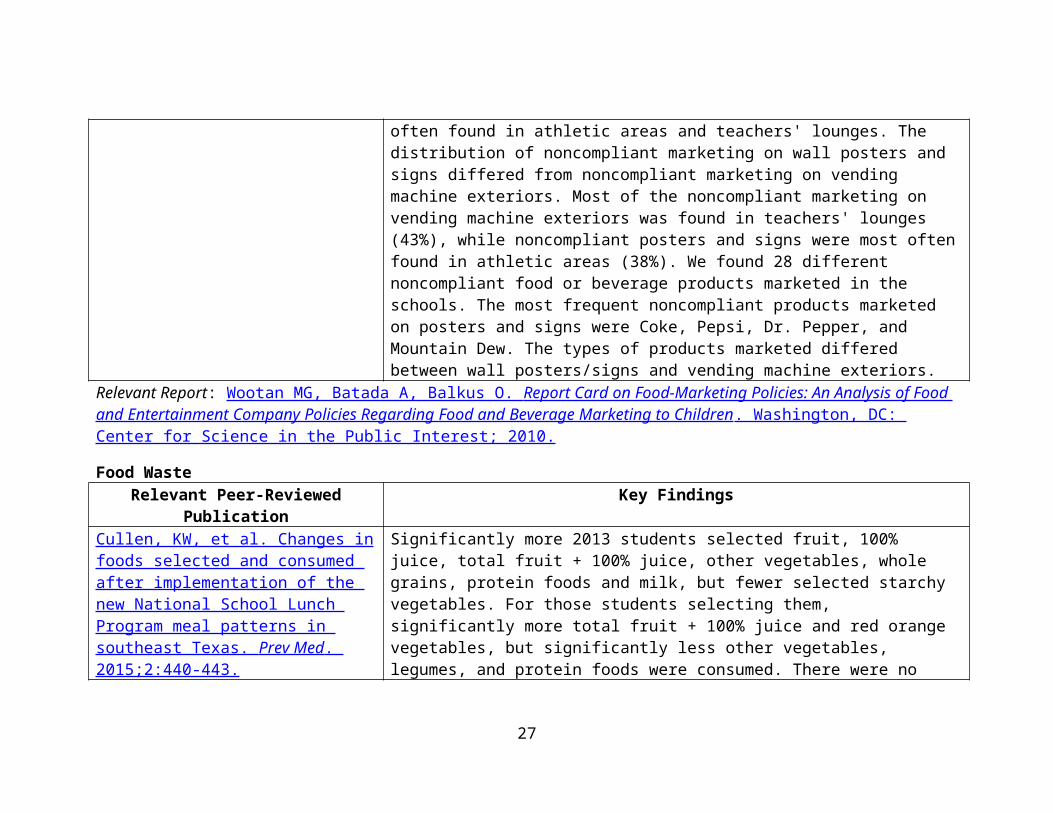
We found an average of 49 food or beverage posters and signs per school, including on vending machine exteriors. Overall, the majority of food and beverage posters and signs were in cafeterias (52%), athletic areas (16%), entrances/hallways (15%), and teachers' lounges (12%). The distribution of marketing on posters and signs differed from that of vending machine exteriors. Marketing on wall posters and signs was found mostly in the cafeterias and athletic areas, while marketing on vending machine exteriors was found mostly in entrances/hallways, cafeterias, and teachers' lounges. We found 197 different food and beverage products marketed in the schools. The most frequently marketed products on posters, signs, and vending machine exteriors were Dasani® (10%), Coke® (9%), Gatorade® (8%), Aquafina® (7%), and Vitamin Water® (5%). Products owned by Coca-Cola® (e.g., Dasani, Coke, Vitamin Water, and Odwalla®) and PepsiCo® (e.g., Gatorade®, Aquafina®, and Pepsi®) comprised 45% of all food and beverage marketing observed on posters, signs, and vending machine exteriors. Noncompliant marketing of products was found in 85% of schools, including on vending machine exteriors and scoreboards. An
17
average of 12 instances of noncompliant marketing was found per school. Noncompliant food and beverage marketing on posters and signs was most often found in athletic areas and teachers' lounges. The distribution of noncompliant marketing on wall posters and signs differed from noncompliant marketing on vending machine exteriors. Most of the noncompliant marketing on vending machine exteriors was found in teachers' lounges (43%), while noncompliant posters and signs were most often found in athletic areas (38%). We found 28 different noncompliant food or beverage products marketed in the schools. The most frequent noncompliant products marketed on posters and signs were Coke, Pepsi, Dr. Pepper, and Mountain Dew. The types of products marketed differed between wall posters/signs and vending machine exteriors.
Relevant Report: Wootan MG, Batada A, Balkus O. Report Card on Food-Marketing Policies: An Analysis of Food and Entertainment Company Policies Regarding Food and Beverage Marketing to Children . Washington, DC: Center for Science in the Public Interest; 2010.
Food WasteRelevant Peer-Reviewed Publication Key FindingsCullen, KW, et al. Changes in foods selected and consumed after implementation of the new National School Lunch Program meal patterns in southeast Texas. Prev Med . 2015;2:440-443.
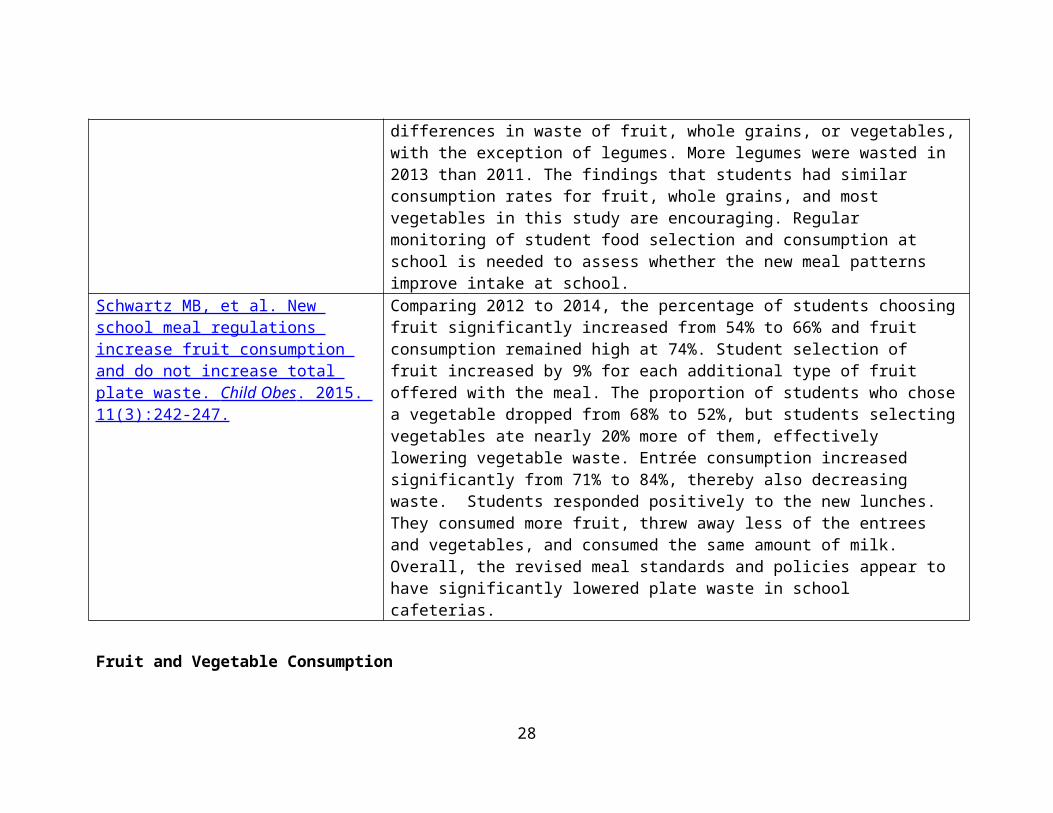
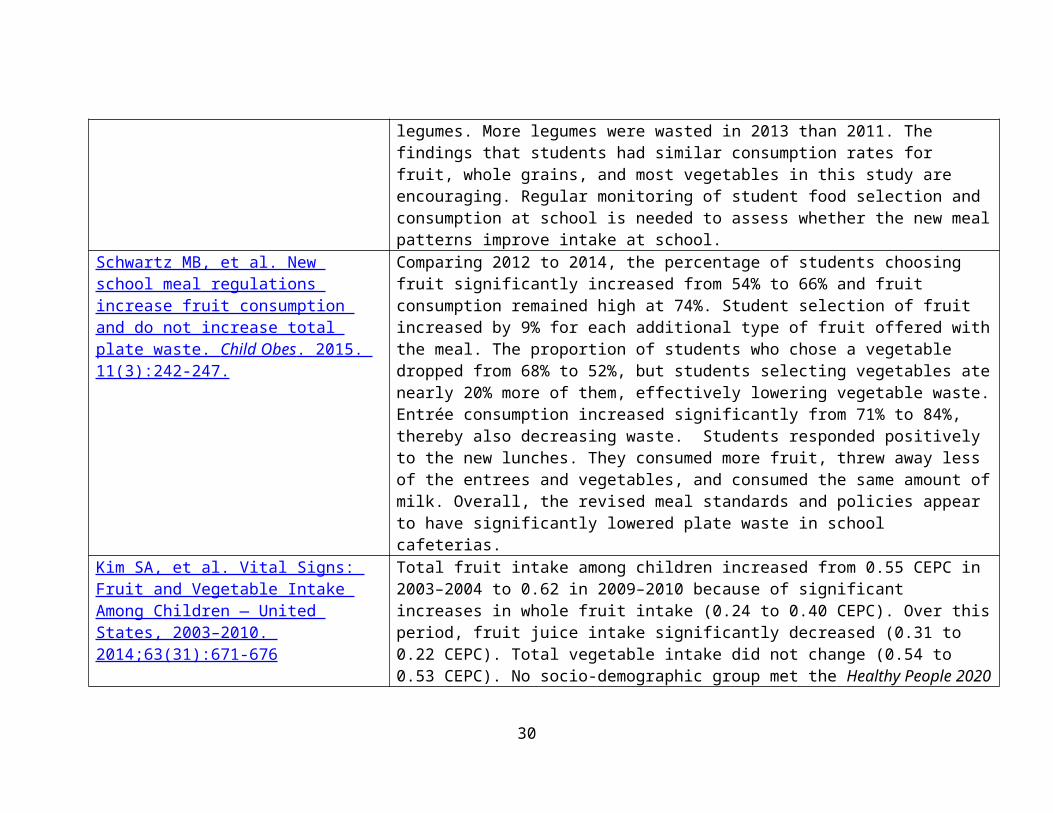
Significantly more 2013 students selected fruit, 100% juice, total fruit + 100% juice, other vegetables, whole grains, protein foods and milk, but fewer selected starchy vegetables. For those students selecting them, significantly more total fruit + 100% juice and red orange vegetables, but significantly less other vegetables, legumes, and protein foods were consumed. There were no differences in waste of fruit, whole grains, or vegetables, with the exception of legumes. More legumes were wasted in 2013 than 2011. The findings that students had similar consumption rates for fruit, whole grains, and most vegetables in this study are encouraging. Regular monitoring of student food selection and consumption at school is needed to assess whether the new meal patterns improve intake at school.
Schwartz MB, et al. New school meal regulations increase fruit consumption and do not increase total plate waste.
Comparing 2012 to 2014, the percentage of students choosing fruit significantly increased from 54% to 66% and fruit consumption remained high at 74%. Student selection of fruit increased by 9% for each additional type of fruit offered
18
Child Obes . 2015. 11(3):242-247. with the meal. The proportion of students who chose a vegetable dropped from 68% to 52%, but students selecting vegetables ate nearly 20% more of them, effectively lowering vegetable waste. Entrée consumption increased significantly from 71% to 84%, thereby also decreasing waste. Students responded positively to the new lunches. They consumed more fruit, threw away less of the entrees and vegetables, and consumed the same amount of milk. Overall, the revised meal standards and policies appear to have significantly lowered plate waste in school cafeterias.
Fruit and Vegetable Consumption Relevant Peer-Reviewed Publication Key Findings
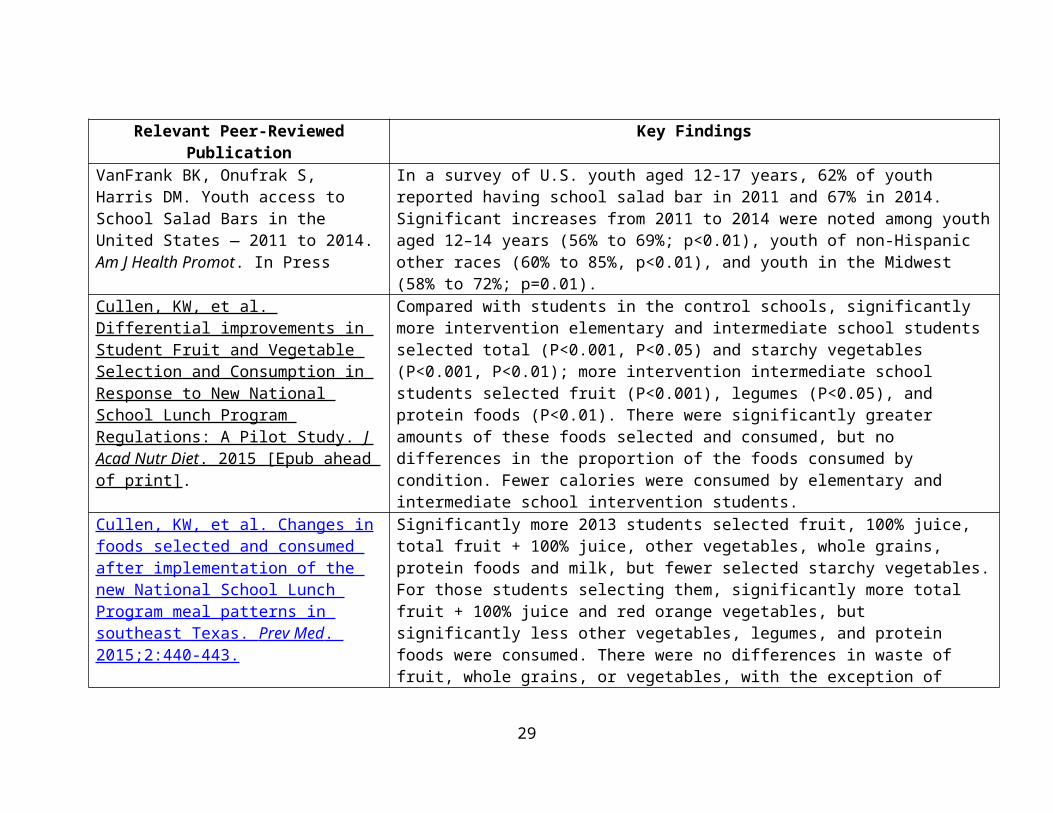
VanFrank BK, Onufrak S, Harris DM. Youth access to School Salad Bars in the United States — 2011 to 2014. Am J Health Promot. In Press
In a survey of U.S. youth aged 12-17 years, 62% of youth reported having school salad bar in 2011 and 67% in 2014. Significant increases from 2011 to 2014 were noted among youth aged 12–14 years (56% to 69%; p<0.01), youth of non-Hispanic other races (60% to 85%, p<0.01), and youth in the Midwest (58% to 72%; p=0.01).
Cullen, KW, et al. Differential improvements in Student Fruit and Vegetable Selection and Consumption in Response to New National School Lunch Program Regulations: A Pilot Study. J Acad Nutr Diet . 2015 [Epub ahead of print].
Compared with students in the control schools, significantly more intervention elementary and intermediate school students selected total (P<0.001, P<0.05) and starchy vegetables (P<0.001, P<0.01); more intervention intermediate school students selected fruit (P<0.001), legumes (P<0.05), and protein foods (P<0.01). There were significantly greater amounts of these foods selected and consumed, but no differences in the proportion of the foods consumed by condition. Fewer calories were consumed by elementary and intermediate school intervention students.
Cullen, KW, et al. Changes in foods selected and consumed after implementation of the new National School Lunch Program meal patterns in southeast Texas. Prev Med . 2015;2:440-443.
Significantly more 2013 students selected fruit, 100% juice, total fruit + 100% juice, other vegetables, whole grains, protein foods and milk, but fewer selected starchy vegetables. For those students selecting them, significantly more total fruit + 100% juice and red orange vegetables, but significantly less other vegetables, legumes, and protein foods were consumed. There were no differences in waste of fruit, whole grains, or vegetables, with the exception of legumes. More legumes were wasted in 2013 than 2011. The findings that students had similar consumption rates
19
for fruit, whole grains, and most vegetables in this study are encouraging. Regular monitoring of student food selection and consumption at school is needed to assess whether the new meal patterns improve intake at school.
Schwartz MB, et al. New school meal regulations increase fruit consumption and do not increase total plate waste. Child Obes . 2015. 11(3):242-247.
Comparing 2012 to 2014, the percentage of students choosing fruit significantly increased from 54% to 66% and fruit consumption remained high at 74%. Student selection of fruit increased by 9% for each additional type of fruit offered with the meal. The proportion of students who chose a vegetable dropped from 68% to 52%, but students selecting vegetables ate nearly 20% more of them, effectively lowering vegetable waste. Entrée consumption increased significantly from 71% to 84%, thereby also decreasing waste. Students responded positively to the new lunches. They consumed more fruit, threw away less of the entrees and vegetables, and consumed the same amount of milk. Overall, the revised meal standards and policies appear to have significantly lowered plate waste in school cafeterias.
Kim SA, et al. Vital Signs: Fruit and Vegetable Intake Among Children — United States, 2003–2010. 2014;63(31):671-676
Total fruit intake among children increased from 0.55 CEPC in 2003–2004 to 0.62 in 2009–2010 because of significant increases in whole fruit intake (0.24 to 0.40 CEPC). Over this period, fruit juice intake significantly decreased (0.31 to 0.22 CEPC). Total vegetable intake did not change (0.54 to 0.53 CEPC). No socio-demographic group met the Healthy People 2020 target of 1.1 CEPC vegetables, and only children aged 2–5 years met the target of 0.9 CEPC fruits.
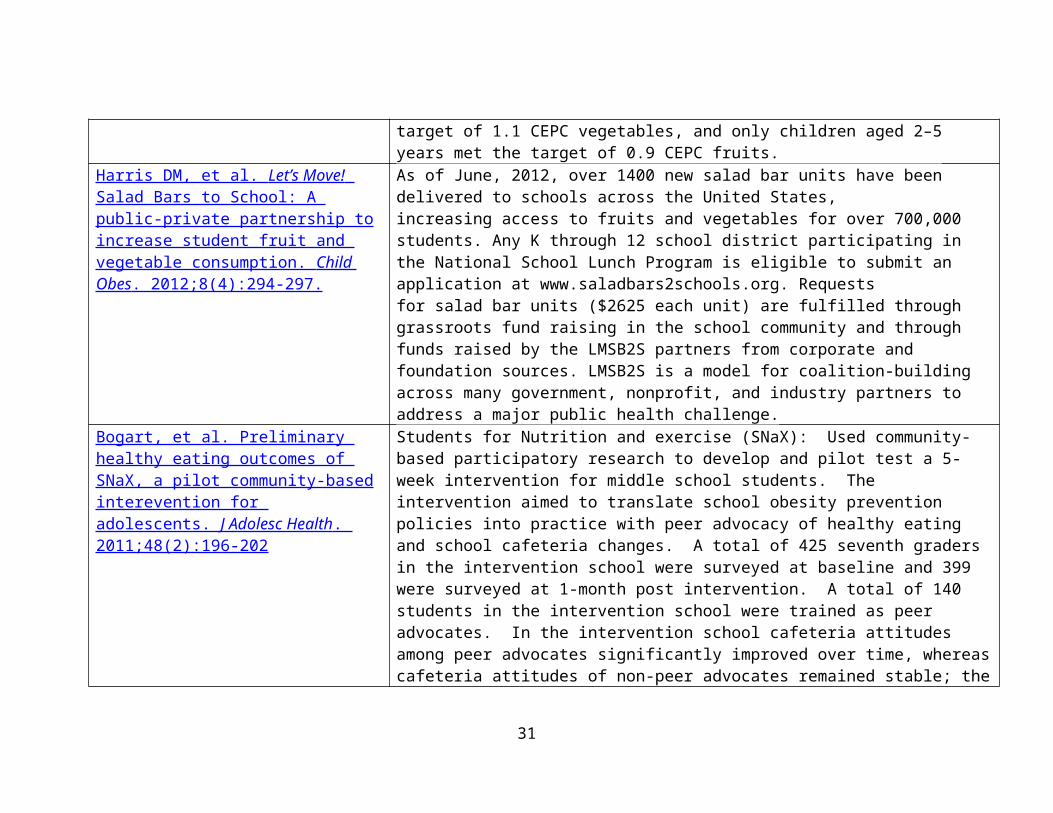
Harris DM, et al. Let’s Move! Salad Bars to School: A public-private partnership to increase student fruit and vegetable consumption. Child Obes . 2012;8(4):294-297.
As of June, 2012, over 1400 new salad bar units have been delivered to schools across the United States, increasing access to fruits and vegetables for over 700,000 students. Any K through 12 school district participating in the National School Lunch Program is eligible to submit an application at www.saladbars2schools.org. Requests for salad bar units ($2625 each unit) are fulfilled through grassroots fund raising in the school community and through funds raised by the LMSB2S partners from corporate and foundation sources. LMSB2S is a model for coalition-building across many government, nonprofit, and industry partners to address a major public health challenge.
Bogart, et al. Preliminary healthy eating outcomes of SNaX, a pilot community-based interevention for adolescents. J
Students for Nutrition and exercise (SNaX): Used community-based participatory research to develop and pilot test a 5-week intervention for middle school students. The intervention aimed to translate school obesity prevention policies into practice
20
Adolesc Health . 2011;48(2):196-202 with peer advocacy of healthy eating and school cafeteria changes. A total of 425 seventh graders in the intervention school were surveyed at baseline and 399 were surveyed at 1-month post intervention. A total of 140 students in the intervention school were trained as peer advocates. In the intervention school cafeteria attitudes among peer advocates significantly improved over time, whereas cafeteria attitudes of non-peer advocates remained stable; the improvement among peer advocates was significantly greater than the pre-post-change for non-peer advocates. Peer advocates significantly reduced their sugar-sweetened beverage intake from 33% before intervention to 21% after intervention (P=0.03). Cafeteria records indicated that servings of fruit and healthier entrees significantly decreased in the comparison school and significantly increased in the intervention school; the magnitude of the changes differed significantly between the schools (P<0.001) (See Bogart, et al. J Adolesc Health . 2011;48(2):196-202 ).
French, et al. Am J Pub Health . 2004;94(9):1507-1512 .
Trying Alternative Cafeteria Options in Schools (TACOS): 22 secondary schools were randomly assigned to either an environmental intervention or a control group for a 2-year school-based nutrition intervention trial that consisted of increased availability of lower-fat foods and implemented student-based promotions. A steeper rate of increase in sales of lower-fat foods in year 1 and a higher percentage of sales of lower-fat foods in year 2 were observed and there were no significant changes in student self-reported food choices.
Relevant Resources: Let’s Move! Salad Bars 2 Schools : This initiative was founded by the Chef Ann Foundation, National Fruit and
Vegetable Alliance, United Fresh Produce Association Foundation, and Whole Foods Market in support of the First Lady Michelle Obama’s Let’s Move! Initiative.
CDC resources and success stories The National Farm to School Network Evaluation for Transformation: A Cross-Sectoral Evaluation Framework for
Farm to School
21
Local Wellness Policies Relevant Peer-Reviewed Publication Key FindingsSchwartz MB, Henderson KE, Falbe J, et al. Strength and comprehensiveness of district school wellness policies predict policy implementation at the school level. J Sch Health . 2012;82(6):262-267.
Statewide, more complete implementation of nutrition and physical activity policies at the school level was reported after adoption of written policies. Districts with stronger, more comprehensive policies were more successful in implementing them at the school level. Some sociodemographic characteristics predicted the strength of wellness policies.
Coffield JE, et al. A multivariate analysis of federally mandated school wellness policies on adolescent obesity. J Adoles Health . 2011;49(4):363-370.
Each additional component included in a district's wellness policy was associated with as much as: 3.2% lower odds in the prevalence of adolescent overweight (OR = .968; 95% CI = .941-.997), 2.5% lower odds of obesity (OR = .975; CI = .952-.997), and 3.4% lower odds of severe obesity (OR = .966; CI = .938-.995). Wellness policy components related to diet were significantly associated with lower body mass indexes across all three thresholds, whereas those related to physical activity had significant associations for lower odds of severe obesity only.
Jomaa LH, McDonnell E, Weirich E, Hartman T, Jensen L, Probart C. Student involvement in wellness policies: A study of Pennsylvania local education agencies. J Nutr Educ Behav . 2010;42(6):372-379.
Majority of LEAs included policy goals that address student involvement in an array of activities related to wellness policy, food service, and role modeling. Regression models showed that LEAs with comprehensive and strong policies were most likely to include student-involvement goals regardless of LEA location, enrollment, or socioeconomic status of students.
Probart C, McDonnell ET, Jomaa L, Fekete V. Lessons from Pennsylvania's mixed response to federal school wellness law. Health Aff (Millwood) . 2010;29(3):447-453.
Federal legislation aimed at tackling the nation's soaring childhood obesity rate through changes to school meals and nutrition and wellness programs has met with mixed results. An examination of Pennsylvania's response to the Child Nutrition and Women, Infants, and Children (WIC) Reauthorization Act of 2004, one of the most comprehensive state responses, found improvements to the nutritional quality of foods offered à la carte in conjunction with school meal programs. However, multiple weaknesses remain. Consistent wellness policy
22
implementation steps were not followed, and there was inadequate statewide enforcement. Despite this, Pennsylvania can offer lessons for other states in moving forward with programs to promote good nutrition and wellness.
Long MW, Henderson KE, Schwartz MB. Evaluating the impact of a Connecticut program to reduce availability of unhealthy competitive food in schools. J Sch Health . 2010;80(10):478-486.
On average, all districts in Connecticut reduced the availability of unhealthy competitive foods, with a significantly greater reduction among HFC districts. Average NSLP participation also increased across the state. Participating in HFC was associated with significantly greater NSLP participation for paid meals in middle school; however, implementing HFC did not increase overall NSLP participation beyond the statewide upward trend.
Schwartz MB, Lund AE, Grow HM, et al. A comprehensive coding system to measure the quality of school wellness policies. J Am Diet Assoc . 2009;109(7):1256-1262.
A 96-item coding tool was developed to evaluate seven goal areas: nutrition education, standards for US Department of Agriculture child nutrition programs and school meals, nutrition standards for competitive and other foods and beverages, physical education, physical activity, communication and promotion, and evaluation. Each goal area subscale and the total scale were scored on two dimensions: comprehensiveness and strength. Reliability was assessed by having pairs of researchers from four different states code a sample of 60 polices between July 2007 and July 2008. Goal area subscales were internally reliable (Cronbach's alpha=.60 to .93). Adequate interrater reliability scores were obtained at each level of scoring: total comprehensiveness and strength scores (intraclass correlation coefficient 0.82), subscale scores (intraclass correlation coefficient 0.70), and individual items (intraclass correlation coefficient 0.72). This coding system provided a reliable method for analyzing and comparing school district wellness policies in single or multistate studies.
Belansky ES, Cutforth N, Delong E, et al. Early impact of the federally mandated local wellness policy on physical activity in rural, low-income elementary schools in Colorado. J Public Health Policy . 2009;30(Suppl 1):S141-60.
The What's Working project described the initial impact of the United States' federally mandated Local Wellness Policy in rural, low-income elementary schools located in Colorado. Before and after the Local Wellness Policy mandate went into effect, a survey about school features related to nutrition and physical activity was sent to a random sample of 45 rural elementary schools (i.e., schools located outside of urban areas), in which at least 40% of students qualified for free or reduced-cost lunch. Overall, opportunities for physical activity did not change after the policy went into effect: although time in physical
23
education increased by 14 min per week (P=0.10), time for recess decreased by roughly 19 min per week (P=0.10). Policies supporting student participation in physical education and recess (an unstructured time during school hours when students are allowed to play outside) did not change. The researchers coded Local Wellness Policies and found them to have weak wording that produced minimal impact. Content analysis of key informant interviews suggested several barriers to the impact of the Local Wellness Policies: (1) competing pressures facing school districts, (2) lack of resources devoted to the Local Wellness Policy, (3) principals' lack of knowledge about the policy, and (4) lack of accountability mechanisms to ensure policy implementation. Financial resources and more effective communication about Local Wellness Policies among school districts and principals are needed to elevate the importance of and increase opportunities for physical activity in rural, low-income Colorado elementary schools.
Probart C, McDonnell E, Weirich JE, Schilling L, Fekete V. Statewide assessment of local wellness policies in Pennsylvania public school districts. J Am Diet Assoc . 2008;108(9):1497- 1502.
Most school district local wellness policies (85.6%-100%) met each mandate requirement (e.g., included goals for nutrition education, physical activity, etc.). The most common policy goals were general and may be difficult to measure, suggesting school staff may need assistance developing action plans and measuring policy implementation. Most respondents identified the superintendent (n=377; 75.6%) and school foodservice director (n=301; 60.3%) as responsible for ensuring local wellness policy implementation. Questions remain about feasibility of these district-level personnel to ensure policy implementation at the school level. The ability of local wellness policies to impact childhood obesity will depend on efforts at both the school and district levels to implement and enforce local wellness policies.
Relevant Resources: Local School Wellness Policy Research Briefs : CDC and the Robert Wood Johnson Foundation-supported Bridging the
Gap (BTG) research program developed a series of briefs highlighting opportunities to support wellness policies through evidence-based strategies. These briefs provide an assessment of policies across school districts nationwide, related to seven wellness policy components. They also highlight areas of opportunity for state agencies, school districts, and schools to strengthen wellness policy components.
24
o Creating Supportive School Nutrition Environments Discuss strategies to increase participation in school meals like scheduling recess before lunch at the
elementary school level, instituting closed campus policies at the secondary level, providing adequate time to eat meals and offering grab-and-go breakfast.
o Local School Wellness Policies: Where Do They Stand and What Can You Do? Discuss how schools are required to include assurance that school meals at least meet the federal
standards and that districts may also include other requirements related to school meals (Healthy, Hunger-Free Kids Act of 2010, Pub. L. No. 111-296, § 204, 124 Stat. 3183, 3236-3238 (2010).
Note approximately 85% of districts included an assurance in the wellness policy that school meals meet federal standards and that 51% of districts required participation in the School Breakfast Program.
Nutrition and Obesity Policy Research and Evaluation Network : Thematic research network of the Prevention Research Centers Programs. Mission is to conduct transdisciplinary nutrition- and obesity-related policy research and evaluation along a policy change continuum. The work of NOPREN members helps foster understanding of the effectiveness of policies related to preventing childhood obesity through improved access to affordable, healthy foods and beverages in a variety of settings including communities, workplaces, healthcare facilities, childcare institutions, and schools. One of the newer working groups is focusing on School Wellness Policies.
School Wellness Survey : Ongoing monitoring and analysis work being conducted by Bridging the Gap School Wellness Survey that creates linkages between School Wellness data and those of federal school health related surveillance systems supported by USDA, NCI, and CDC.
Off-Campus School Food Environment Relevant Peer-Reviewed Publication Key Findings
Kiszko K, et al. Corner store purchases in a low-income urban community in NYC. J Community Health . 2015;40(6):1084-1090.
Most consumers shopped at the bodega because it was close to their home (52 %). The majority (68 %) reported shopping at the bodega at least once per day. The five most commonly purchased items were sugary beverages, (29.27 %), sugary snacks (22.34 %), coffee, (13.99 %), sandwiches, (13.09 %) and non-baked potato chips (12.2 %). Nearly 60 % of bodega customers reported their purchase to be healthy. Most of the participants shopped at the bodega frequently, valued its convenient location, and purchased unhealthy items. Work is needed to discover ways to encourage healthier choices at these stores.
Carroll-Scott, A, et al. Disentangling Property crimes and living further from a grocery store were associated with higher
25
neighborhood contextual associations with child body mass index, diet, and physical activity: The role of built, socioeconomic, and social environments. Soc Sci & Med . 2013;95:106-114.
BMI. Students living within a 5-min walk of a fast food outlet had higher BMI, and those living in a tract with higher density of fast food outlets reported less frequent healthy eating and more frequent unhealthy eating. Students’ reported perceptions of access to parks, playgrounds, and gyms were associated with more frequent healthy eating and exercise. Students living in more affluent neighborhoods reported more frequent healthy eating, less unhealthy eating, and less screen time. Neighborhood social ties were positively associated with frequency of exercise. In conclusion, distinct domains of neighborhood environment characteristics were independently related to children’s BMI and health behaviors. Findings link healthy behaviors with built, social, and socioeconomic environment assets (access to parks, social ties, affluence), and unhealthy behaviors with built environment inhibitors (access to fast food outlets), suggesting neighborhood environments are an important level at which to intervene to prevent childhood obesity and its adverse consequences.
Tester JM, Yen IH, Laraia B. Using mobile fruit vendors to increase access to fresh fruit and vegetables for schoolchildren. Prev Chronic Dis . 2012;9:E102.
We found 2 types of competing vendors: an ice cream vendor and a cotton candy vendor. At least 1 competing vendor was present for 12 afternoons. Of the frutero’s 233 consumers, 59% were elementary school students; for 27% of frutero transactions, no adults were present. The frutero sold an average of 17.7 bags of fruits and vegetables each afternoon during an average of 26 minutes of sales, and for the last 5 days of observation, at least 20 bags were sold each afternoon. Overall, the frutero sold 248 bags during 324 minutes of observed sales (an approximate rate of 0.8 bags per minute). A β coefficient of 0.95 (P < .001) for frutero sales suggests 1 additional bag was sold on each successive day; a β coefficient of −1.48 (P = .02) for sales of competing vendors suggests 1.5 fewer nonnutritious items were sold on each successive day. We completed quarter-mile buffer observations in an average of 12.8 minutes. The mean number of nonintervention vendors decreased: 2.3 (range, 0–4; standard deviation [SD], 1.3) before, 1.4 (range, 0–3; SD, 1.1) during, and 0.8 (range, 0–2; SD, 0.9) after the intervention.
26
Datar A, Nicosia N. Junk food in schools and childhood obesity. J Policy Anal Manage . 2012;31(2):312-337.
Our main finding is that junk food availability does not significantly increase BMI or obesity among this fifth grade cohort despite the increased likelihood of in-school junk food purchases. The results are robust to alternate measures of junk food availability including school administrator reports of sales during school hours, school administrator reports of competitive food outlets, and children's reports of junk food availability. Moreover, the absence of any effects on overall food consumption and physical activity further support the null findings for BMI and obesity.
Tester JM, Yen IH, Pallis LC, Laraia BA. Healthy food availability and participation in WIC (Special Supplemental Nutrition Program for Women, Infants, and Children) in food stores around lower- and higher-income elementary schools. Public Health Nutr . 2011;14(6):960-964.
There were considerably more food outlets around lower-income schools. Food stores near higher-income schools had higher scores in two of the five domains (healthy beverages/low-fat dairy and healthy snacks). However, there were more food stores near lower-income schools that accepted WIC vouchers. Stratification showed that WIC stores scored higher than non-WIC stores on four of the five domains.
Laska MN, Borradaile KE, Tester J, Foster GD, Gittelsohn J. Healthy food availability in small urban food stores: A comparison of four U.S. cities. Public Health Nutr . 2010;13(7):1031-1035.
The availability of healthy food items was low, particularly in single-aisle and small stores, and there was significant cross-site variability in the availability of healthy snacks (P < 0.0001) and other healthy staple foods (P < 0.0001). No cross-site differences existed for fruits/vegetables or healthy beverages/low-fat dairy availability. Healthy food availability scores increased significantly with store size for nearly all food/beverage categories (P < 0.01).
Kwate NO, Loh JM. Separate and unequal: The influence of neighborhood and school characteristics on spatial proximity between fast food and schools. Prev Med . 2010;51(2):153-156 .
A minimum of 25% of schools had a fast food restaurant within 400 m. High schools had higher fast food clustering than elementary schools. Public elementary and high schools with large proportions of Black students or in block groups with large proportions of Black residents had higher clustering than White counterparts. Finally, public high schools had higher clustering than private counterparts, with 1.25 to 2 times as many restaurants than expected by chance.
Tester JM, Stevens SA, Yen IH, Laraia We present key components of mobile vending regulation and provide examples
27
BL. An analysis of public health policy and legal issues relevant to mobile food vending. Am J Public Health . 2010;100(11):2038-2046.
from 12 US cities to illustrate the variation that can exist surrounding these regulations. Using these regulatory features as a framework, we highlight existing examples of "healthy vending policies" to describe how mobile food vending can be used to increase access to nutritious food for vulnerable populations.
Tester JM, Yen IH, Laraia B. Mobile food vending and the after-school food environment. Am J Prev Med . 2010;38(1):70-73.
During 37 observation-hours across 23 days, there were 1355 items sold to 1195 individuals. Fifty-six percent of the transactions involved children with no adults present. There was a wide range in foods sold, and although there were vendors selling low-nutrient, energy-dense foods, there were also vendors selling whole and processed (precut and bagged) fresh fruits and vegetables. Roughly 40% of these whole fruits and processed fruits and vegetables were consumed by children. On average, children each consumed $1.54 of foods per transaction.
Kwate NO, Yau CY, Loh JM, Williams D. Inequality in obesigenic environments: Fast food density in New York City. Health Place . 2009;15(1):364-373.
We found that predominantly Black areas had higher densities of fast food than predominantly White areas; high-income Black areas had similar exposure as low-income Black areas; and national chains were most dense in commercial areas. The results highlight the importance of policy level interventions to address disparities in food environments as a key goal in obesity prevention efforts.
Borradaile KE, Sherman S, Vander Veur SS, et al. Snacking in children: The role of urban corner stores. Pediatrics . 2009;124(5):1292-1297.
The most frequently purchased items were energy-dense, low-nutritive foods and beverages, such as chips, candy, and sugar-sweetened beverages. Students spent $1.07 + 0.93 on 2.1 + 1.3 items (1.6 + 1.1 food items and 0.5 + 0.6 beverage items) per purchase. The total number of calories purchased per trip was 1497.7 + 1219.3 kJ (356.6 + 290.3 kcal). More calories came from foods than from beverages.
Fernandes MM. The effect of soft drink availability in elementary schools on consumption. J Am Diet Assoc . 2008;108(9):1445-1452.
In this study, 26% of children who have access to soft drinks at school consume them. Those who consume more soft drinks at school, such as low-income and black non-Hispanic children, are more likely to consume more soft drinks overall. Controlling for covariates, limiting availability of soft drinks at school is associated with a 4% decrease (odds ratio 1.38) in the rate of any consumption overall.
Sturm R. Disparities in the food environment surrounding U.S. middle and high schools. Public Health . 2008;122(7):681-690.
Hispanic youth are particularly likely to attend schools that are surrounded by convenience stores, restaurants, snack stores or off-licences. This effect is independent and in addition to poverty (i.e. students eligible for free school meals or schools that are Title I eligible) or location (urban core, suburban, town, rural). The association between other racial groups and nearby businesses is weaker, with the
28
exception of off-licences, where a higher proportion of minority groups increases the probability of off-licences in close proximity to the school. Middle schools have fewer surrounding businesses than high schools, and larger schools have fewer surrounding businesses than smaller schools.
Sturm R, Datar A. Food prices and weight gain during elementary school: 5-year update. Public Health . 2008;122(11):1140-1143.
This study confirms initial evidence for an association between weight gain among elementary school children and relative food prices in their environment. In particular, lower real prices for fruit and vegetables relative to other goods and services (including other foods, housing) may slow excess weight gain.
Open Campus Lunch Policies
Relevant Reports: Miura MR. Legal Notes: Open Campus Lunch. Off the Map: Extracurricular School Food. Boston, MA: Public
Health Advocacy Institute; 2009. Miura MR. Off the Map: Extracurricular School Food: Open Campus Lunch. Boston, MA: Public Health Advocacy
Institute; 2009.
NSLP Participation Relevant Peer-Reviewed Publication Key Findings
Johnson DB, et al. Effect of the Healthy Hunger-Free Kids Act on the nutritional quality of meals selected by students and school lunch participation rates. JAMA Pediatr . 2016;170(1):e153918.
After implementation of the Healthy Hunger-Free Kids Act, change was associated with significant improvement in the nutritional quality of foods chosen by students, as measured by increased mean adequacy ratio from a mean of 58.7 (range, 49.6-63.1) prior to policy implementation to 75.6 (range, 68.7-81.8) after policy implementation and decreased energy density from a mean of 1.65 (range, 1.53-1.82) to 1.44 (range, 1.29-1.61), respectively. There was negligible difference in student meal participation following implementation of the new meal standards with 47% meal participation (range, 40.4%-49.5%) meal participation prior to the implemented policy and 46% participation (range, 39.1%-48.2%) afterward.
29
Nutrition Education and Promotion (including school gardens)Relevant Peer-Reviewed Publication Key FindingsHeo M, et al. Behaviors and knowledge of HealthCorps New York City high school students: Nutrition, mental health, and physical activity. J Sch Health . 2016;86(2):84-95.
The HealthCorps program significantly increased all 3 knowledge domains (p < .05), and significantly changed several key behavioral domains. Boys significantly increased fruits/vegetables intake (p = .03). Girls increased acceptance of new fruits/vegetables (p = .03) and breakfast consumption (p = .04), and decreased sugar-sweetened beverages and energy dense food intake (p = .03). The associations between knowledge and behavior were stronger in boys than girls.
Davis, JN, et al. LA Sprouts: A 12-Week gardening, nutrition, and cooking randomized control trial improves determinants of dietary behaviors. J Nutr Educ Behav . 2016;48(1):2-11.
After the 12-week program, compared with controls, LA Sprouts participants improved scores for identification of vegetables (+11% vs +5%; P = .001) and nutrition and gardening knowledge (+14.5% vs -5.0%; P = .003), and were more likely to garden at home (+7.5% vs -4.4%; P = .003).
Gatto NM, et al. LA Sprouts randomized controlled nutrition and gardening program reduces obesity and metabolic risk in Latino youth. Obesity (Silver Spring) . 2015;23(6):1244-1251.
LA Sprouts participants had significantly greater reductions in BMI z-scores (0.1-vs. 0.04-point decrease, respectively; P = 0.01) and WC (-1.2 cm vs. no change; P < 0.001). Fewer LA Sprouts participants had the metabolic syndrome (MetSyn) after the intervention than before, while the number of controls with MetSyn increased. LA Sprouts participants had improvements in dietary fiber intake (+3.5% vs. -15.5%; P = 0.04) and less decreases in vegetable intake (-3.6% vs. -26.4%; P = 0.04). Change in fruit intake before and after the intervention did not significantly differ between LA Sprouts and control subjects.
Martinez, LC, et al. Design and methodology of the LA Sprouts nutrition, cooking and gardening program for Latino youth: A randomized controlled intervention. Contemp Clin Trial . 2015;42:219-227.
Baseline data was collected from 364 children, and 320 (88%) completed follow-up. No participants withdrew from the program (data were missing for other reasons). Intervention students attended 9.7 ± 2.3 lessons. Fasting blood samples were collected on 169 children at baseline, and 113 (67%) at follow-up. Questionnaire scales had good internal consistency (IC) and intra-rater reliability (IRR; in child scales: 88% items with IC > 0.7 and 70% items with IRR > 0.50; in parent scales: 75% items with IC > 0.7).
30
Pricing Strategies Relevant Peer-Reviewed Publication Key FindingsFrench SA, et al. Pricing strategy to promote fruit and vegetable purchase in high school cafeterias. J Am Diet Assoc . 1997;97(9):1008-1010.
Fruit sales increased by about fourfold during the low-price period, from an average weekly total of 14.4 to 63.3 pieces of fruit (P<.0006). Carrot sales increased by about twofold, from an average weekly total of 35.6 packets to 77.6 packets per week (P<.021). There were no significant intervention effects on sales of salads (P<.85). No significant period changes in the number of meal pattern customers or in total dollar sales for the a la carte purchases were observed. An additional model that examined school-specific patterns showed higher sales during the low-price period in each school. However, the magnitude of the intervention effect for fruit was larger in the urban school and was larger for carrots in the suburban. The results suggest that lower pricing for fruit and vegetables, with minimal promotion, increases sales of these items among high school students.
School Accountability Policies Relevant Peer-Reviewed Publication Key Findings
Anderson PM, Butcher KF, Cascio EU, Schanzenbach DW. Is being in school better? The impact of school on children's BMI when starting age is endogenous. J Health Econ . 2011;30(5):977-986.
As is the case with academic outcomes, school exposure is related to unobserved determinants of weight outcomes because some families choose to have their child start school late (or early). If one does not account for this endogeneity, it appears that an additional year of school exposure results in a greater BMI and a higher probability of being overweight or obese. When we compare the weight outcomes of similar age children with one versus two years of school exposure due to regulations on school starting age, the significant positive effects disappear, and most point estimates become negative, but insignificant. However, additional school exposure appears to improve weight outcomes of children for whom the transition to elementary school represents a more dramatic change in environment (those who spent less time in childcare prior to kindergarten).
Relevant Report: Anderson PM, Butcher KF, Schanzenbach DW. Adequate (or Adipose?) Yearly Progress: Assessing the Effect of "No Child Left Behind" on Children's Obesity. Working Paper 16873. Cambridge, MA: National Bureau of Economic Research; 2011.
31
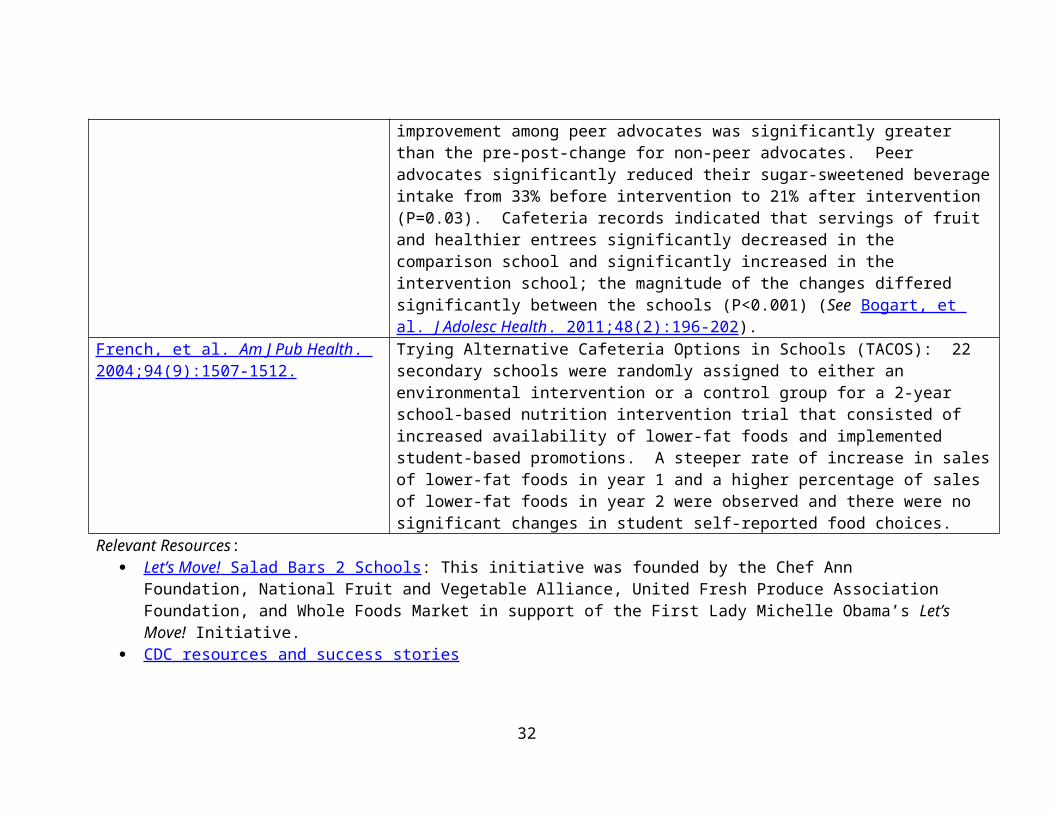
School Breakfast ProgramRelevant Peer-Reviewed Publication Key Findings
Hearst, MO, et al. Barriers, benefits, and behaviors related to breakfast consumption among rural adolescents. J Sch Health . 2016;86(3):187-194.
Breakfast skippers compared to nonbreakfast skippers reported fewer school related benefits and beliefs and more barriers to eating breakfast (p < .01). Adjusted models revealed students reported more positive beliefs (OR = 0.78, 95% CI = 0.73-0.83), more benefits (OR = 0.95, 95% CI = 0.93-0.97) and fewer barriers (OR = 0.85, 95% CI = 0.82-0.87) and were less likely to skip breakfast. Future intervention research should focus on alleviating barriers and enhancing education around the school related benefits of eating breakfast.
Egner, R, et al. The school breakfast program: A view of the present and preparing for the future- a commentary. J Sch Health . 2014;84(7):417-420.
This report reviews the status of the SBP and summarizes discussions about possible expansions and improvements.
Leos-Urbel, S, et al. Not just for poor kids: The impact of universal free school breakfast on meal participation and student outcomes. Econ Educ Rev . 2013;36:88-107.
Our estimates suggest that the policy resulted in small increases in breakfast participation both for students who experienced a decrease in the price of breakfast and for free-lunch eligible students who experienced no price change. The latter suggests that universal provision may alter behavior through mechanisms other than price, highlighting the potential merits of universal provision over targeted services. We find limited evidence of policy impacts on academic outcomes.
School Food Environments, Policies, Practices and PartnershipsRelevant Peer-Reviewed Publication Key Findings
Larson, N, et al. District wellness policies and school-level practices in Minnesota, USA. Public Health Nutr . 2016;19(1):26-35.
The mean number of energy-dense, nutrient-poor snack foods and beverages available for students to purchase at school was inversely related to the strength of district wellness policies regulating vending machines and school stores (P=0·01). The proportion of schools having a joint use agreement for shared use of physical activity facilities was inversely related to the strength of district policies addressing community use of school facilities (P=0·03). No associations were found between the strength of other district policies and school-level practices.
Caspi, CE, et al. Disparities persist in nutrition policies and practices in
Among school-level characteristics, school location was most strongly related to school nutrition policies. Across all years, city schools were less likely than
32
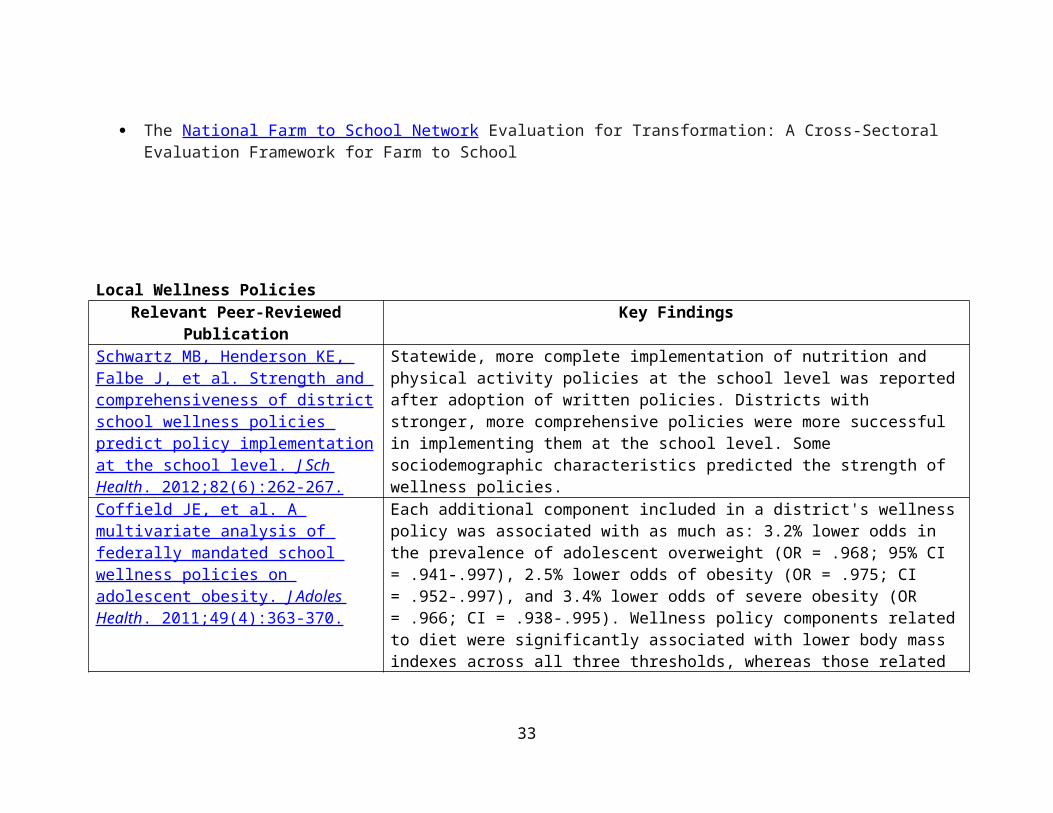
Minnesota secondary schools. J Acad Nutr Diet . 2015;115(3):419-425.
town/rural schools to have vending machines/school stores (prevalence difference [PD] -13.7, 95% CI -25.0 to -2.3), and less likely to sell sport drinks (PD -36.3, 95% CI -51.8 to -20.7). City schools were also more likely to prohibit advertisements for LNED products in school buildings (PD 17.7, 95% CI 5.5 to 29.9) and on school grounds (PD 15.6, 95% CI 1.7 to 29.5). Between 2008 and 2012, the prevalence of some healthy eating policies/practices (e.g., limiting salty snacks, offering taste testing, and banning unhealthy food advertisements in school publications) declined in city schools only, where these policies/practices had previously been more common. Monitoring of these trends is needed to understand the influence of these policies on student outcomes across school settings.
Kehm, R, et al. The role of family and community involvement in the development and implementation of school nutrition and physical activity policy. J Sch Health . 2015;85(2):90-99.
Family and community involvement were associated with schools more frequently utilizing healthy eating strategies and offering students healthier food options. Further, involvement was associated with greater support for physical education staff and more intramural sports opportunities for students.
Kubik, MY, et al. Snacks, beverages, vending machines, and school stores: A comparison of alternative and regular schools in Minnesota, 2002 to 2008. J Acad Nutr Diet . 2015;115(1):101-105.
Over time, food practice prevalence decreased significantly for both alternative and regular schools, although declines were mostly modest. However, the decrease in high-fat, salty snacks was significantly less for alternative than regular schools (-22.9% vs -42.2%; P<0.0001). Efforts to improve access to healthy food choices at school should reach all schools, including alternative schools. Study findings suggest high-fat salty snacks are more common in vending machines and school stores in alternative schools than regular schools, which may contribute to increased snacking behavior among students and extra consumption of salt, fat, and sugar. Study findings support the need to include alternative schools in future efforts that aim to reform the school food environment.
Kubik, M, et al. Association between student body mass index and access to sports drinks in Minnesota secondary schools, 2012-2013. Preventing Chronic Dis . 2015;12:E195.
In adjusted multivariate analysis, school policy was positively associated with BMI percentile (P = .005). School policy restricting student access to sports drinks at school may contribute to decreasing consumption of sport drinks among school-aged youth and improving student weight outcomes in this population.
33
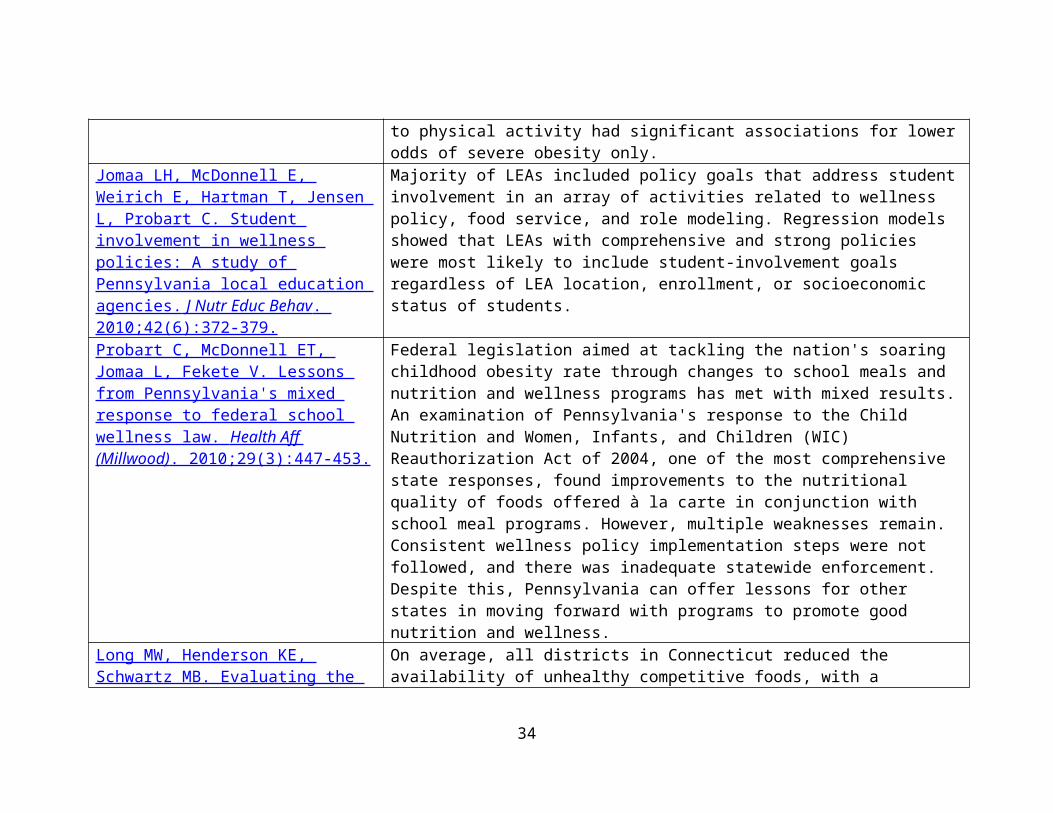
Alaimo K, Oleksyk S, Golzynski D et al. The Michigan Healthy School Action Tools Process Generates Improvements in School Nutrition Policies and Practices, and Student Dietary Intake. Health Promot Pract. 2015;16(3):401- 10.
Schools reported nutrition-related policies and practices/education using the School Environment and Policy Survey. Schools completing the HSAT were compared to schools that did not complete the HSAT with regard to number of policy and practice changes and student dietary intake. Schools that completed the HSAT made significantly more nutrition practice/education changes than schools that did not complete the HSAT, and students in those schools made dietary improvements in fruit, fiber, and cholesterol intake. The Michigan HSAT process is an effective strategy to initiate improvements in nutrition policies and practices within schools, and to improve student dietary intake.
Johnson-Shelton, D, et al. A community-based participatory research approach for preventing childhood obesity: The Communities and Schools Together Project. Progress in Community Health Partnerships: Research, Education and Action, 2015;9(3):351-361.
Investigator-initiated CBPR partnerships can effectively organize and facilitate large health-promoting partnerships involving multiple, diverse stakeholder communities. Lessons learned from CAST illustrate the synergy that can propel projects that are holistically linked to the agents of a community.
Baek J, et al. Hierarchial multiple informants models: Examining food environment contributions to the childhood obesity epidemic. Stat Med. 2014;33(4):662-674.
Methods for multiple informants help to estimate the marginal effect of each multiple source predictor and formally compare the strength of their association with an outcome. We extend multiple informant methods to the case of hierarchical data structures to account for within cluster correlation. We apply the proposed method to examine the relationship between features of the food environment near schools and children's body mass index z-scores (BMIz). Specifically, we compare the associations between two different features of the food environment (fast food restaurants and convenience stores) with BMIz and investigate how the association between the number of fast food restaurants or convenience stores and child's BMIz varies across distance from a school. The newly developed methodology enhances the types of research questions that can be asked by investigators studying effects of environment on childhood obesity and can be applied to other fields.
Nanney, MS, et al. Evaluating school obesity-related policies using
The ScOPE study uses a repeated, cross-sectional study design to evaluate the association between school food and activity policies in Minnesota and behavioral
34
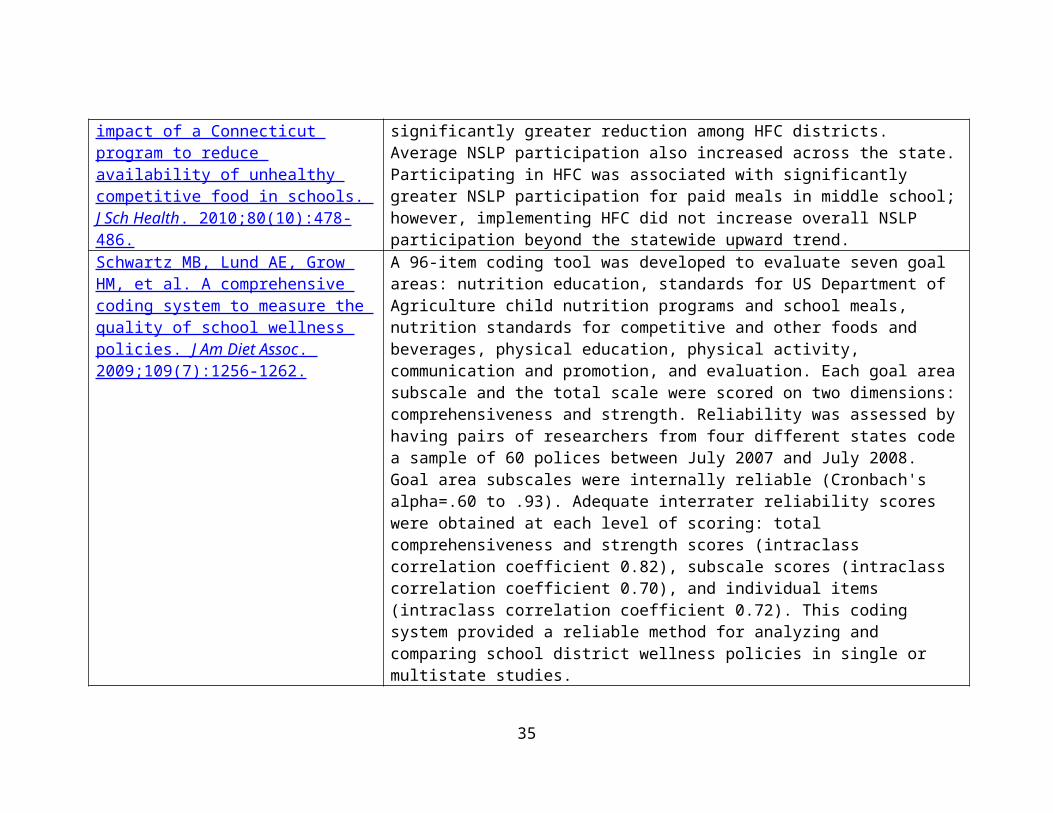
surveillance tools: Lessons from the ScOPE study. Health Promot Pract . 2014;15(5):622-628.
and weight status of youth attending those schools. Three surveillance tools are used to accomplish study goals: Minnesota School Health Profiles (2002-2012), Minnesota Student Survey (2001-2013), and National Center for Educational Statistics. The ScOPE study takes two broad steps. First, we assemble policy data across multiple years and monitor changes over time in school characteristics and the survey instrument(s), establish external validity, and describe trends and patterns in the distribution of policies. Second, we link policy data to student data on health behaviors and weight status, assess nonresponse bias, and identify cohorts of schools. To illustrate the potential for program evaluators, the process, challenges encountered, and solutions used in the ScOPE study are presented.
Nanney, MS, et al. Recommended school policies are associated with student sugary drink and fruit and vegetable intake. Prev Med. 2014;62:179-181.
Each additional recommended policy was associated with a significant decrease in consumption of sugary drinks and an increase in consumption of fruits and vegetables. There were no associations with weekly hours of sedentary activities, days per week of vigorous activity, or body mass index percentile.
Nanney MS, Davey CS, Kubik MY. Rural disparities in the distribution of policies that support healthy eating in US secondary schools. J Acad Nutr Diet . 2013;113(8):1062-1068.
Schools in small town/rural locations had significantly fewer policies that support healthy eating strategies and ban food marketing, and were less likely to serve fruits and vegetables at school celebrations, have fruits and vegetables available in vending or school stores, and limit serving-size packages. Schools serving the highest percentage of minority students consistently reported the same or better school food environments. However, schools serving the highest percentage of low-income students had varied results: vending and LNED vending policies were consistently better and fruit and vegetable availability-related policies were consistently worse. Disparities in the distribution of policies and practices that promote healthy school food environments seem most pronounced in small town/rural schools. The data also support the need for continued reinforcement and the potential for expansion of these efforts in urban and suburban areas and schools with highest minority enrollment.
Bogart, et al. Preliminary healthy eating outcomes of SNaX, a pilot community-based interevention for adolescents. J
Students for Nutrition and exercise (SNaX): Used community-based participatory research to develop and pilot test a 5-week intervention for middle school students. The intervention aimed to translate school obesity prevention policies into practice
35
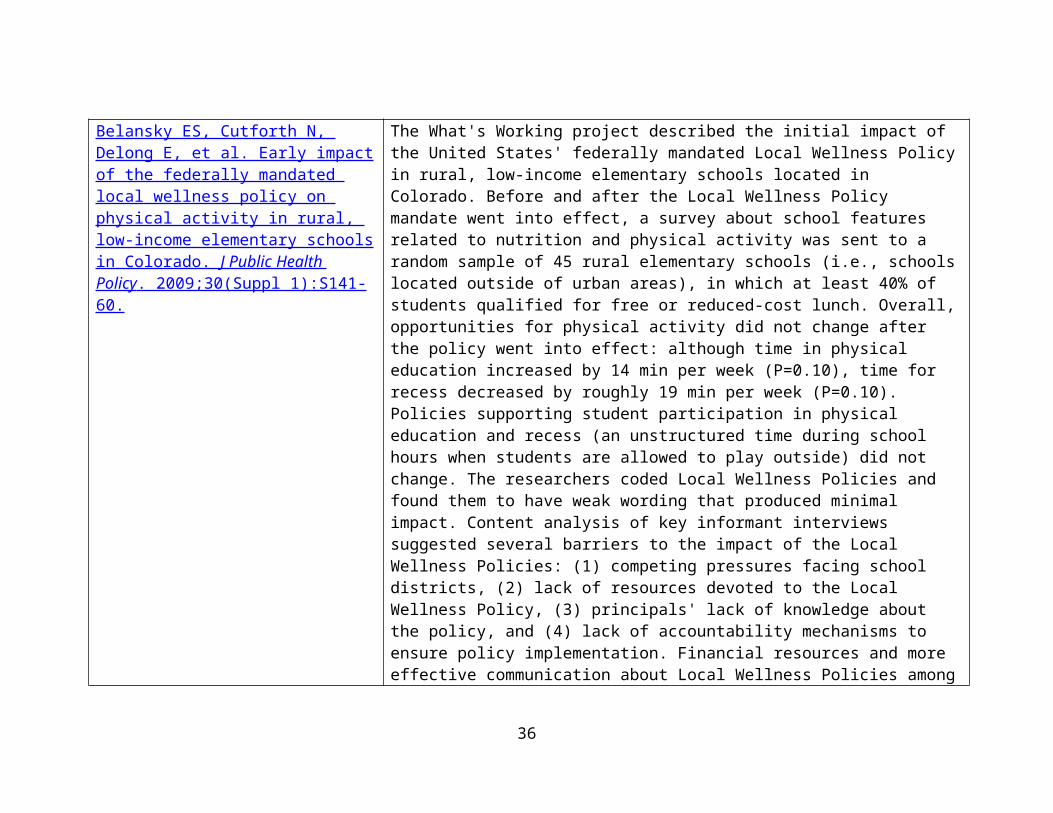
Adolesc Health . 2011;48(2):196-202
Patel, et al. Increasing the availability and consumption of drinking water in middle schools: A pilot study. Prev Chronic Dis . 2011;8(3):A60
with peer advocacy of healthy eating and school cafeteria changes. A total of 425 seventh graders in the intervention school were surveyed at baseline and 399 were surveyed at 1-month post intervention. A total of 140 students in the intervention school were trained as peer advocates. In the intervention school cafeteria attitudes among peer advocates significantly improved over time, whereas cafeteria attitudes of non-peer advocates remained stable; the improvement among peer advocates was significantly greater than the pre-post-change for non-peer advocates. Peer advocates significantly reduced their sugar-sweetened beverage intake from 33% before intervention to 21% after intervention (P=0.03). Cafeteria records indicated that servings of fruit and healthier entrees significantly decreased in the comparison school and significantly increased in the intervention school; the magnitude of the changes differed significantly between the schools (P<0.001) (See Bogart, et al. J Adolesc Health . 2011;48(2):196-202 ). Pilot program also showed the provision of filtered, chilled drinking water in school cafeterias coupled with promotion and education is associated with increased consumption of drinking water at school (See Patel, et al. Prev Chronic Dis . 2011;8(3):A60 ).
The HEALTHY Study Group. NEJM . 2010;363(5):443-453
HEALTHY study: School-based intervention with 6th-8th graders in 42 middle schools including the following four components: nutrition (specifically food service changes), physical activity, behavior and communications/social marketing. More than half of the students came from racial/ethnic minority groups or had a low socio-economic status. At the beginning of the study, half of the students were overweight or obese. Reported a decrease in the primary outcome—the combined prevalence of overweight and obesity—in both the intervention and control schools, with no significant differences between the school groups. The intervention schools had greater reductions in the secondary outcomes of BMI z scores, percentage of students with waist circumference at or above the 90th percentile, fasting insulin levels (P=0.04 for all comparisons) and prevalence of obesity (P=0.05).
Fox MK, Dodd AH, Wilson A, Gleason Among elementary school children, offering French fries and similar potato products
36
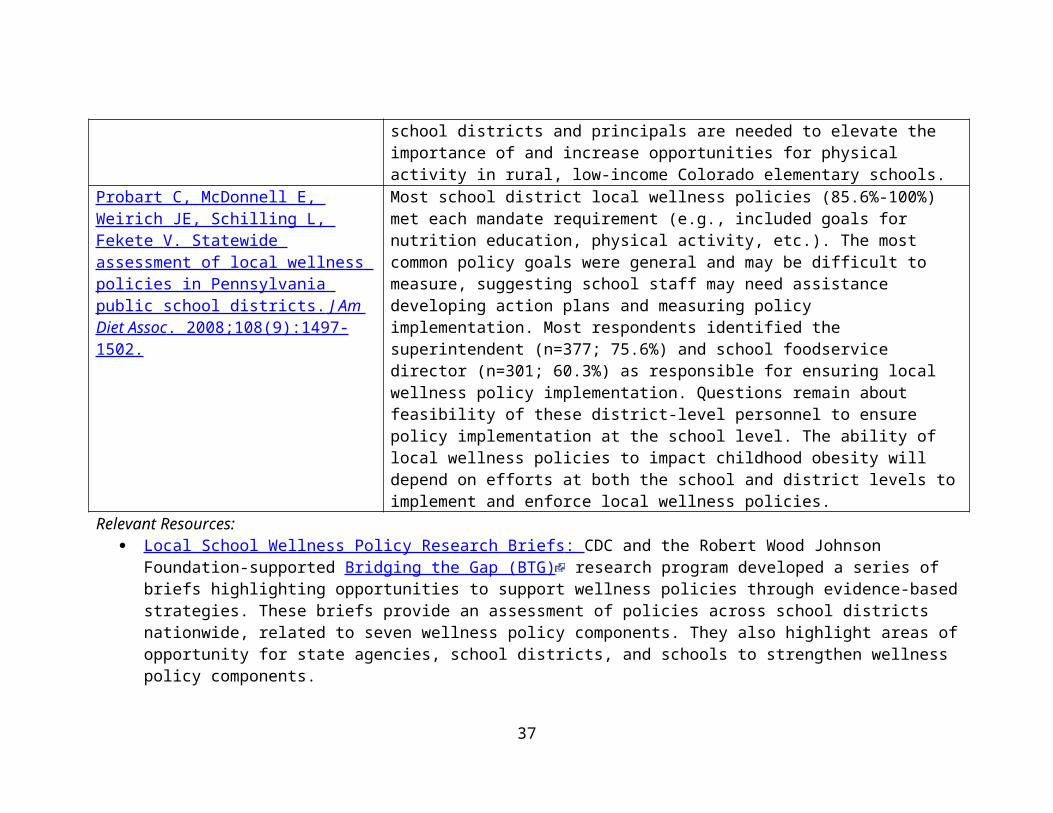
PM. Association between school food environment and practices and body mass index of U.S. public school children. J Am Diet Assoc . 2009;109(2 Suppl):S108-117.
in subsidized school meals more than once per week and offering dessert more than once per week were each associated with a significantly higher likelihood of obesity. Among middle school children, the availability of low-nutrient, energy-dense foods in vending machines in or near the foodservice area was associated with a higher BMI z score, and the availability of such foods for à la carte purchase in the cafeteria was associated with a lower BMI z score.
Briefel RR, Crepinsek MK, Cabili C, Wilson A, Gleason PM. School food environments and practices affect dietary behaviors of U.S. public school children. J Am Diet Assoc . 2009;109(2 Suppl):S91-107.
Sugar-sweetened beverages obtained at school contributed a daily mean of 29 kcal in middle school children and 46 kcal in high school children across all school children. Attending a school without stores or snack bars was estimated to reduce sugar-sweetened beverage consumption by 22 kcal per school day in middle school children (P<0.01) and by 28 kcal in high school children (P<0.01). The lack of a pouring rights contract in a school reduced sugar-sweetened beverage consumption by 16 kcal (P<0.05), and no à la carte offerings in a school reduced consumption by 52 kcal (P<0.001) in middle school children. The most effective practices for reducing energy from low-energy, energy-dense foods were characteristics of the school meal program; not offering French fries reduced low-nutrient, energy-dense foods consumption by 43 kcal in elementary school children (P<0.01) and sugar-sweetened beverage consumption by 41 kcal in high school children (P<0.001).
Johnson DB, Bruemmer B, Lund AE, Evens CC, Mar CM. Impact of school district sugar-sweetened beverage policies on student beverage exposure and consumption in middle schools. J Adolesc Health . 2009;45(3 Suppl):S30- 537.
The proportion of students who consumed any SSB at school ranged from 19.2% to 79.8%. SSB exposure was a significant predictor of SSB consumption (beta=.157, p < .001). SSB consumption was not significantly associated with the size of the school, the racial or ethnic composition of the school's students, or the proportion of students eligible for free and reduced price meals. District SSB policy scores ranged from 0 to 6 with a mean score of 3.25 (+/-2.15). District SSB policy was a significant predictor of SSB exposure (beta=-9.50, p < .0002).
Neuhouser ML, Lilley S, Lund A, Johnson DB. Development and validation of a beverage and snack questionnaire for use in evaluation of school nutrition policies. J Am Diet
Using frequency per week data, the test-retest reliability coefficients were r=0.85 for fruits and vegetables consumed at school and r=0.74 and r=0.72 for beverages and sweets/snacks, respectively, consumed at school. Correlations ranged from r=0.73 to 0.77 for foods consumed outside of school. Compared with the criterion food record, validity coefficients were very good: r=0.69 to 0.71 for foods consumed at
37
Assoc . 2009;109(9):1587-1592. school and r=0.63 to 0.70 for foods consumed away from school. The validity coefficients for the 19 individual food items ranged from r=0.56 to 0.87. This easy-to-administer 19-item questionnaire captures data on sugar-sweetened beverages, salty snacks, sweets, milk, and fruit and vegetables as well as a more lengthy and expensive food record does. The BSQ can be used by nutrition researchers and practitioners to accurately evaluate student consumption of foods that are the focus of school nutrition policies.
Finkelstein DM, Hill EL, Whitaker RC. School food environments and policies in U.S. public schools. Pediatrics . 2008;122(1):e251-e259.
There were vending machines in 17%, 82%, and 97% of elementary, middle, and high schools, respectively, and a la carte items were sold in 71%, 92%, and 93% of schools, respectively. Among secondary schools with vending and a la carte sales, these sources were free of low-nutrient energy-dense foods or beverages in 15% and 21% of middle and high schools, respectively. The food environment summary score was significantly higher (healthier) in the lower grade levels. The summary score was not associated with the percentage of students that was certified for free or reduced-price lunches or the percentage of students that was a racial/ethnic minority.
French, et al. Am J Pub Health . 2004;94(9):1507-1512 .
Trying Alternative Cafeteria Options in Schools (TACOS): 22 secondary schools were randomly assigned to either an environmental intervention or a control group for a 2-year school-based nutrition intervention trial that consisted of increased availability of lower-fat foods and implemented student-based promotions. A steeper rate of increase in sales of lower-fat foods in year 1 and a higher percentage of sales of lower-fat foods in year 2 were observed and there were no significant changes in student self-reported food choices.
Trevino, et al. Arch Pediatr Adolsec Med . 2004;158(9):911-917 .
Bienstar: RCT with 13 intervention and 14 control schools in elementary schools in inner-city neighborhoods in San Antonio, Texas. The intervention consisted of a health class and physical education curriculum, a family program, a school cafeteria program, and an after-school health club. Mean fasting capillary glucose levels decreased in intervention schools and increased in control schools after adjusting for covariates. Fitness scores and dietary fiber intake significantly increased in intervention children and decreased in control children. Percentage of body fat and dietary saturated fat intake did not differ significantly between intervention and
38
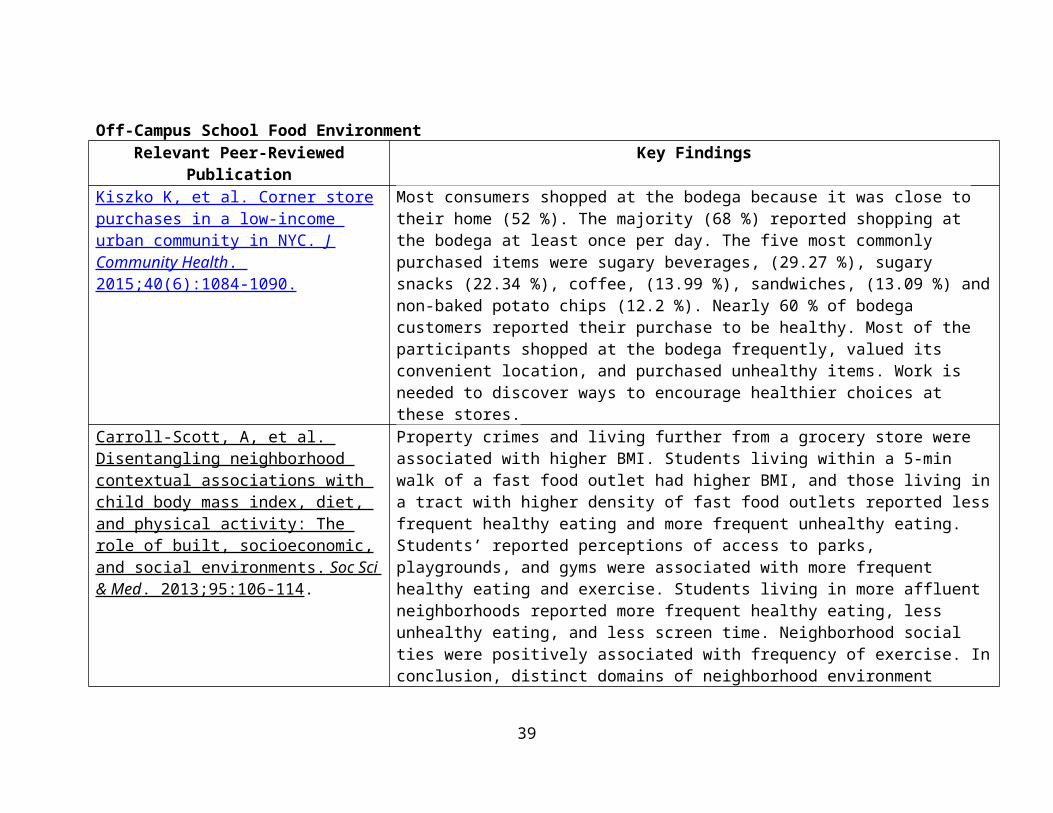
control children.Lytle, et al. Health Educ & Behav . 2004;31:270-287
Teens Eating for Energy and Nutrition at Schools (TEENS): Sixteen middle schools in Minnesota were matched in pairs based on the proportion of seventh graders expected to receive the TEENS curriculum and the proportion receiving free or reduced-price school lunches. The schools were randomly assigned to TEENS or to a wait-list control conduction. The school-based intervention consists of classroom, school-wide, and family components implemented in the seventh and eighth grades. The school-wide component involves working with food service managers and staff to increase offerings and promotion of fruits and vegetables and healthier snacks and to create an environment where healthy food choices are easier and more accepted.
Story, et al. Prev Med . 2003;37(6 Pt 2):S35-S45 and Himes, et al. Prev Med . 2003;37(6 Pt 2):S55-S61 .
Pathways: Randomized trial that evaluated the effectiveness of a school-based multicomponent intervention to reduce fatness in American Indian schoolchildren including a food service intervention to reduce fat in school lunches to no more than 30% of the energy from fat while maintaining recommended levels of calories and key nutrients over a three year period. Five consecutive days of school lunch menus were collected from 20 control and 21 intervention schools at four time periods and nutrient content was analyzed. The intervention documented feasibility of lowering percent of energy from fat as part of a coordinated obesity prevention program for American Indian children. Based on lunch observations, the intervention was associated with significant decreases in mean percentage of calories from total fat and saturated fat relative to controls. Compared to control children, intervention children reported significantly smaller 24-hour intakes of energy, protein, total fat, saturated fat, and polyunsaturated fat and as a percent of calories, total fat and saturated fat. Mean intake of carbohydrates as a percentage of calories was significantly greater in intervention children by 2.5%, compared with controls.
Lytle, et al. Prev Med . 1996;25(4):465- 477 .
CATCH: Originally known as the Child and Adolescent Trial for Cardiovascular Health, the controlled clinical CATCH trial was evaluated from 1991-1994 in 96 schools (56 intervention, 40 control) in four states (California, Louisiana, Minnesota, and Texas) and included over 5,100 students with diverse cultural and ethnic
39
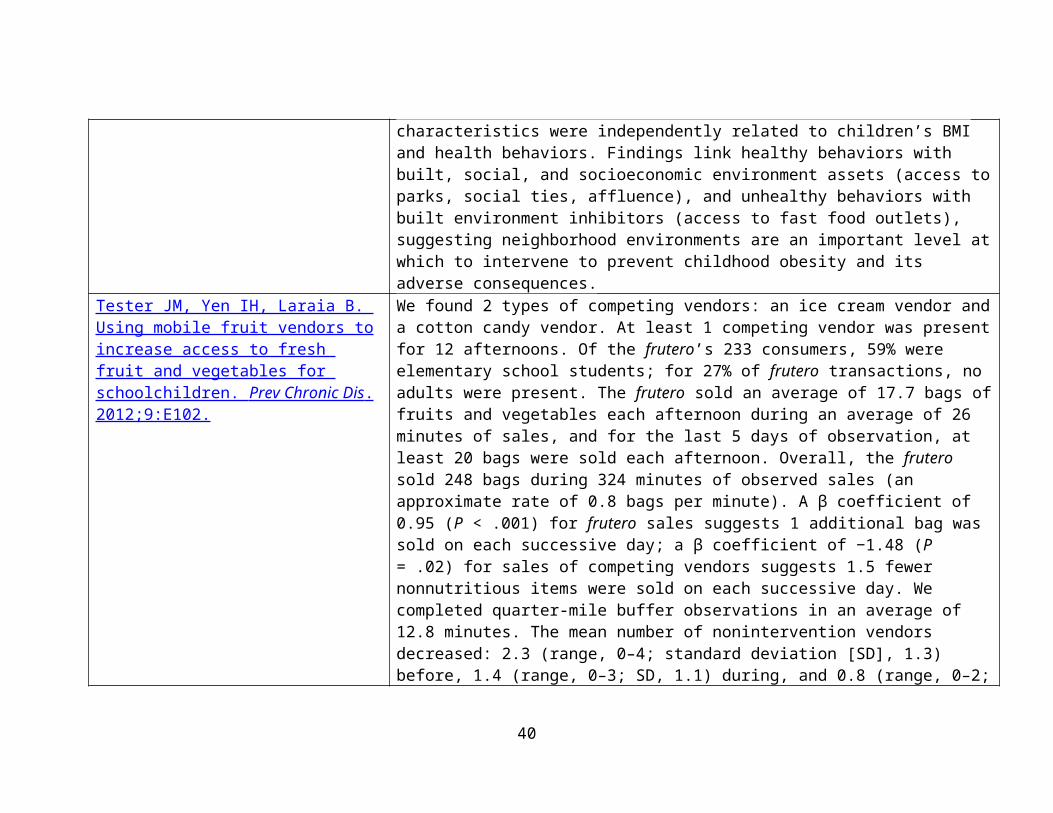
backgrounds. CATCH was a multicomponent, multiyear coordinated school health promotion program including food service changes. Results indicated students participating in the CATCH intervention decreased their consumption of dietary fat.
Relevant Study: Healthy Communities Study : Sponsored by NIH and includes additional NCCOR collaborators amongst others,
this study is an observational study of communities conducted over five years that aims to identify characteristics of community programs and policies that may help reduce childhood obesity and improve dietary and physical activity behaviors. A total of 120 communities and about 5,000 children and their parents will be part of the study. The study examines quantitative and qualitative information obtained from community-based initiatives, community characteristics (e.g., school environment), and from child and parent assessments and measurements of children’s physical activity levels, dietary practices of children, and children’s and parent’s BMI. The study is not designed to evaluate any one specific program, policy or community.
o In October 2015, study authors released a series of articles in the American Journal of Preventive Medicine to describe the study rationale and purpose and the protocol and methods. Articles in the series include:
Pate RR. Overview of the Protocol Manuscripts for the Healthy Communities Study. Am J Prev Med. 2015 Oct; 49(4): 614.
Arteaga SS, Loria CM, Crawford PB et al. The Healthy Communities Study: Its rationale, aims, and approach. Am J Prev Med. 2015 Oct; 49(4): 615-623.
Strauss WJ, Sroka CJ, Frongillo EA, et al. Statistical design features of the Healthy Communities Study. Am J Prev Med. 2015 Oct; 49(4): 624-630.
John LV, Gregoriou M, Pate RR, et al. Operational implementation of the Healthy Communities Study: How communities shape children’s health. Am J Prev Med. 2015 Oct; 49(4): 631-635.
Fawcett SB, Collie-Akers VL, Schultz JA, Kelley M. Measuring community programs and policies in the Healthy Communities Study. Am J Prev Med. 2015 Oct; 49(4): 636-641.
Sroka CJ, McIver KL, Sagatov RDF, Arteaga SS, Frongillo EA. Weight status measures collected in the Healthy Communities Study: Protocols and analyses. Am J Prev Med. 2015 Oct; 49(4): 642-646.
Ritchie LD, Wakimoto P, Woodward-Lopez G. The Healthy Communities Study nutrition assessments: Child diet and the school nutrition environment. Am J Prev Med. 2015 Oct; 49(4): 647-652.
Pate RR, McIver KL, Colabianchi N. Physical activity measures in the Healthy Communities Study. Am J Prev Med. 2015 Oct; 49(4): 653-659.
40
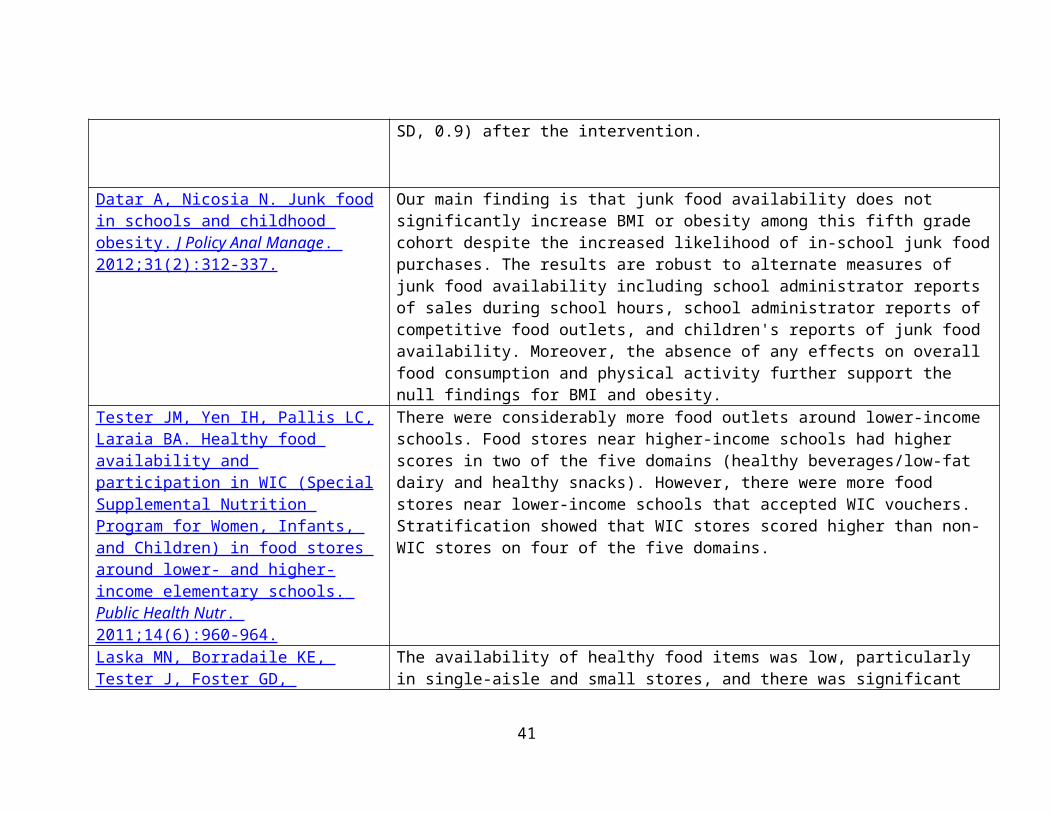
Relevant Peer-Reviewed Review: Levy DT, Mabry PL, Wang YC, et al. Simulation models of obesity: A review of the literature and implications for research and policy. Obes Rev . 2011;12(5):378-394. Relevant Resources:
Johns Hopkins Global Center on Childhood Obesity : NCCOR awarded a $16 million grant to Hopkins to study the drivers of childhood obesity epidemic and relevant environmental and policy interventions; emphasize the integration of geospatial analysis with a systems sciences and trans-disciplinary approach to childhood obesity; provide rapid-response grants to investigators in the field worldwide to obtain time-sensitive data on environmental and policy changes relevant to childhood obesity; and provide a research and training infrastructure for building capacity for integrating systems science into obesity and chronic disease research.
School Health Profiles o State-led/run surveillance system that captures school health policies and practices in weighted samples of schools in
participating states (currently 48); additionally, for CDC cooperative agreements with state health and education departments, Profiles is used to monitor progress on their performance measures
School Health Policies and Practices Study o National survey periodically conducted to assess school health policies and practices at the state, district,
school and classroom levels Most recently conducted in 2014 to answer the following questions:
What are the characteristics of each component of school health at the school and classroom level?
Are there persons responsible for coordinating each school health program component, and what are their qualifications and educational backgrounds?
What collaboration occurs among staff from each school health program component and with staff from outside agencies and organizations?
How have key policies and practices changed over time? School Health Guidelines to Promote Healthy Eating and Physical Activity
o CDC synthesized research and best practices related to promoting healthy eating and physical activity in schools, culminating in nine guidelines. These guidelines were informed by the Dietary Guidelines for Americans, the Physical Activity Guidelines for Americans, and the Healthy People 2020 objectives related to healthy eating and physical activity among children, adolescents, and schools. The guidelines serve as the foundation for developing, implementing, and evaluating school-based healthy eating and physical activity policies and practices for students.
41
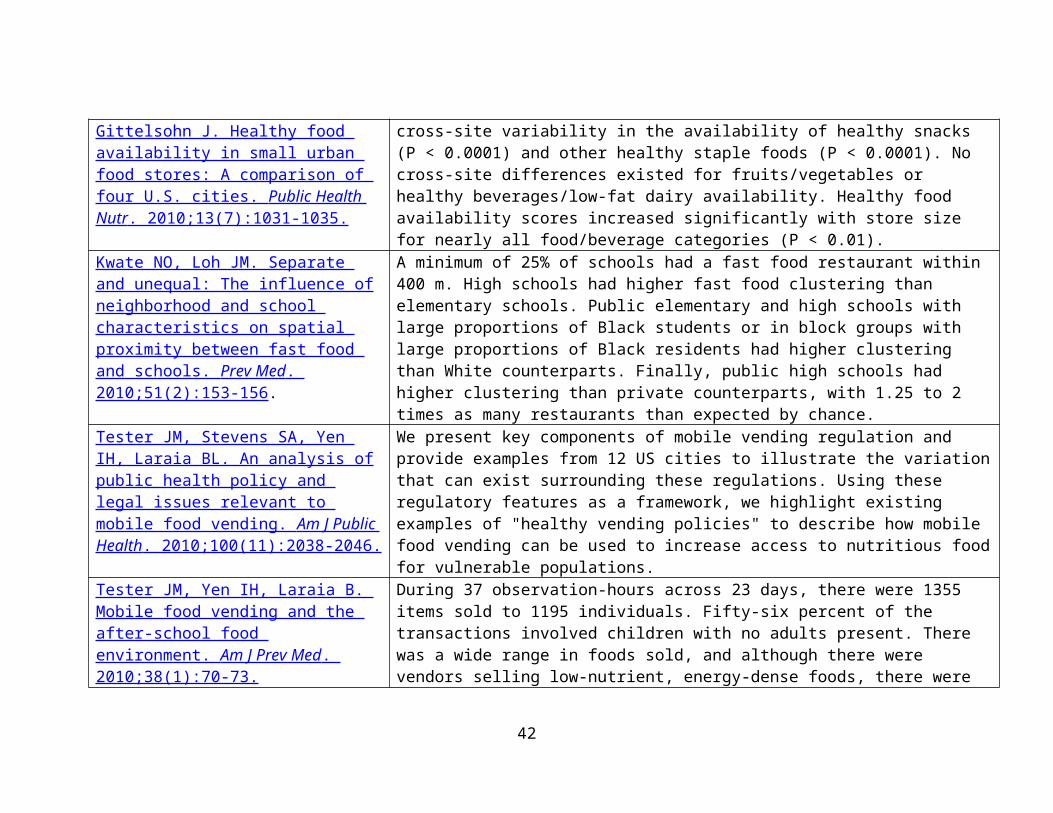
School Health Index: Self-Assessment & Planning Guide 2014 (SHI) o Online self-assessment and planning tool that schools can use to improve their health and safety policies
and programs. The Alliance for a Healthier Generation’s Healthy Schools Program has adopted CDC’s School Health Index as its assessment tool to help schools assess their current policies and practices as well as track progress over time.
SNAP-Ed : NCCOR helped USDA develop a toolkit and evaluation approaches to its new SNAP-Ed obesity prevention goals including the identification of potential strategies and interventions for improving the school food and physical activity environment, particularly those participating in the USDA National School Lunch Program.
Miura MR, Smith JA, Alderman J. Mapping School Food: A Policy Guide . The Public Health Advocacy Institute; 2007.
School Lunches from Home Relevant Peer-Reviewed Publication Key Findings
Caruso ML & Cullen KW. Quality and cost of student lunches brought from home. JAMA Pediatr . 2015;169(1):86- 90.
Compared with the NSLP guidelines, lunches brought from home contained more sodium (1110 vs ≤640 mg for elementary and 1003 vs ≤710 mg for intermediate students) and fewer servings of fruits (0.33 cup for elementary and 0.29 cup for intermediate students vs 0.50 cup per the NSLP guidelines), vegetables (0.07 cup for elementary and 0.11 cup for intermediate students vs 0.75 cup per the NSLP guidelines), whole grains (0.22-oz equivalent for elementary and 0.31-oz equivalent for intermediate students vs 0.50-oz minimum per the NLSP guidelines), and fluid milk (0.08 cup for elementary and 0.02 cup for intermediate students vs 1 cup per the NSLP guidelines). About 90% of lunches from home contained desserts, snack chips, and sweetened beverages, which are not permitted in reimbursable school meals. The cost of lunches from home averaged $1.93 for elementary and $1.76 for intermediate students. Students from lower-income intermediate schools brought significantly higher-priced ($1.94) lunches than did students from middle-income schools ($1.63).
42
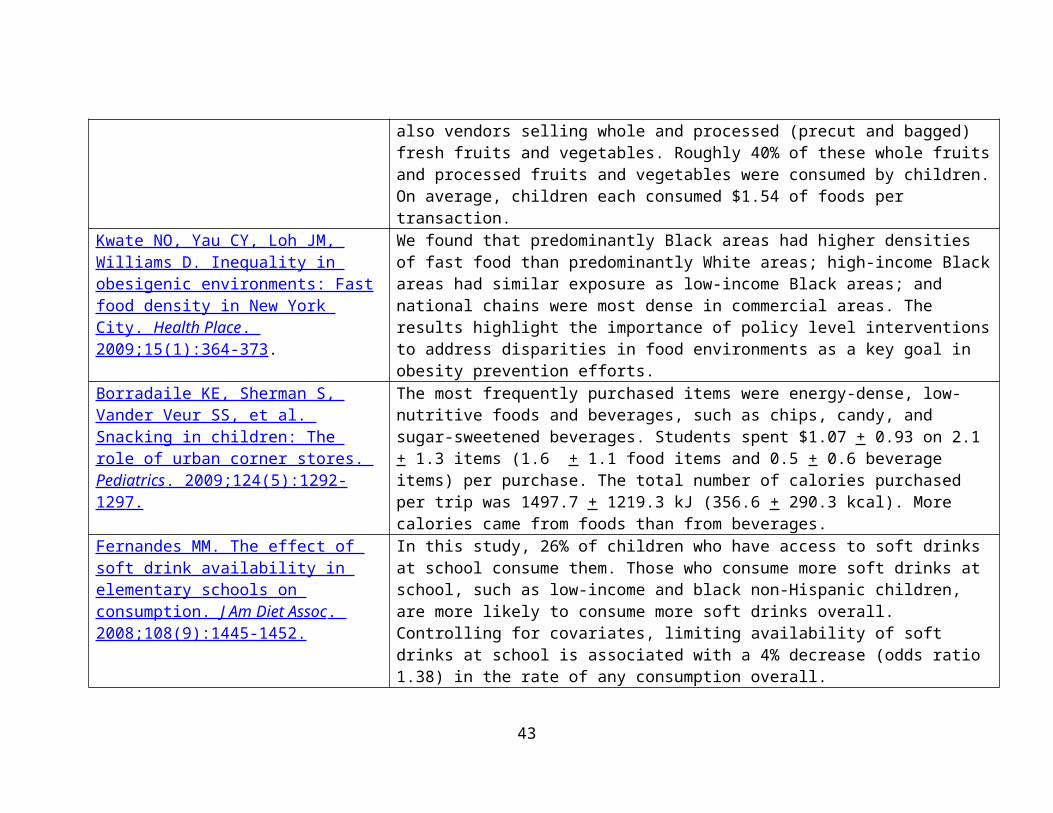
School Meal Nutrition StandardsRelevant Peer-Reviewed Publication Key Findings
Johnson DB, et al. Effect of the Healthy Hunger-Free Kids Act on the nutritional quality of meals selected by students and school lunch participation rates. JAMA Pediatr . 2016;170(1):e153918.
After implementation of the Healthy Hunger-Free Kids Act, change was associated with significant improvement in the nutritional quality of foods chosen by students, as measured by increased mean adequacy ratio from a mean of 58.7 (range, 49.6-63.1) prior to policy implementation to 75.6 (range, 68.7-81.8) after policy implementation and decreased energy density from a mean of 1.65 (range, 1.53-1.82) to 1.44 (range, 1.29-1.61), respectively. There was negligible difference in student meal participation following implementation of the new meal standards with 47% meal participation (range, 40.4%-49.5%) meal participation prior to the implemented policy and 46% participation (range, 39.1%-48.2%) afterward.
Cullen, KW, et al. Changes in foods selected and consumed after implementation of the new National School Lunch Program meal patterns in southeast Texas. Prev Med . 2015;2:440-443.
Significantly more 2013 students selected fruit, 100% juice, total fruit + 100% juice, other vegetables, whole grains, protein foods and milk, but fewer selected starchy vegetables. For those students selecting them, significantly more total fruit + 100% juice and red orange vegetables, but significantly less other vegetables, legumes, and protein foods were consumed. There were no differences in waste of fruit, whole grains, or vegetables, with the exception of legumes. More legumes were wasted in 2013 than 2011. The findings that students had similar consumption rates for fruit, whole grains, and most vegetables in this study are encouraging. Regular monitoring of student food selection and consumption at school is needed to assess whether the new meal patterns improve intake at school.
Cullen, KW, et al. Differential improvements in Student Fruit and Vegetable Selection and Consumption in Response to New National School Lunch Program Regulations: A Pilot Study. J Acad Nutr Diet . 2015 [Epub ahead of print].
Compared with students in the control schools, significantly more intervention elementary and intermediate school students selected total (P<0.001, P<0.05) and starchy vegetables (P<0.001, P<0.01); more intervention intermediate school students selected fruit (P<0.001), legumes (P<0.05), and protein foods (P<0.01). There were significantly greater amounts of these foods selected and consumed, but no differences in the proportion of the foods consumed by condition. Fewer calories were consumed by elementary and intermediate school intervention students.
Cullen, KW, et al. Changes in foods selected and consumed after
Significantly more 2013 students selected fruit, 100% juice, total fruit + 100% juice, other vegetables, whole grains, protein foods and milk, but fewer selected starchy
43
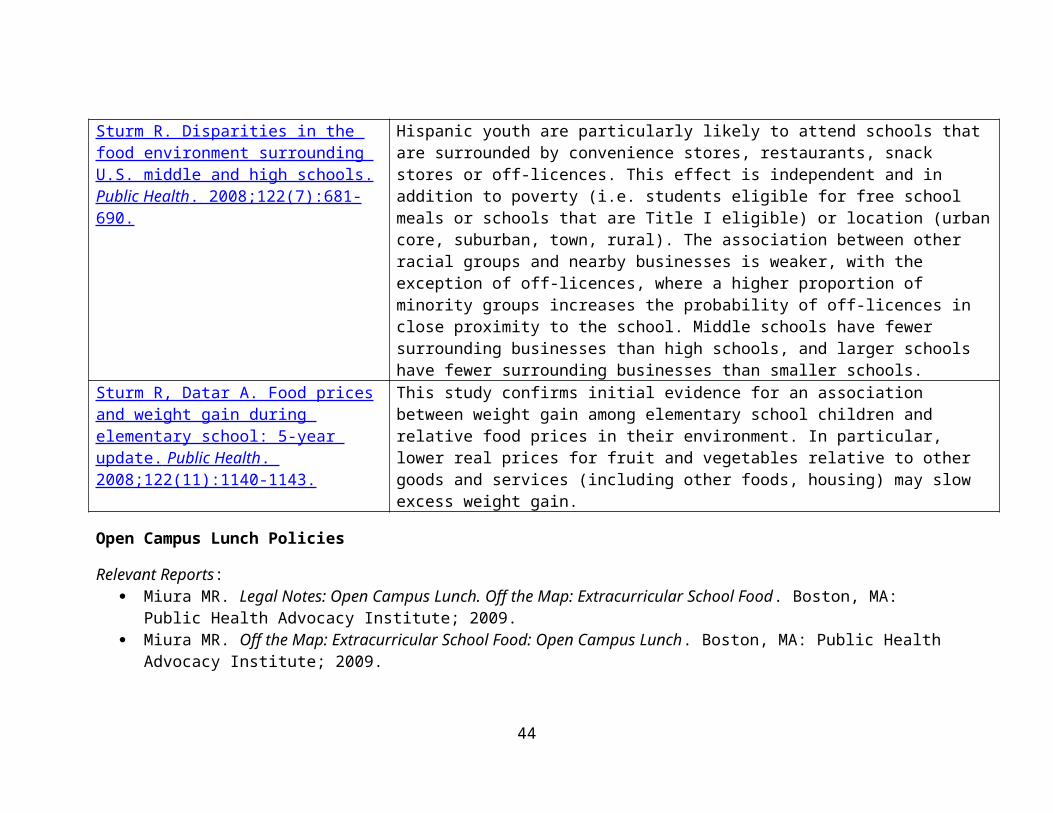
implementation of the new National School Lunch Program meal patterns in southeast Texas. Prev Med . 2015;2:440-443.
vegetables. For those students selecting them, significantly more total fruit + 100% juice and red orange vegetables, but significantly less other vegetables, legumes, and protein foods were consumed. There were no differences in waste of fruit, whole grains, or vegetables, with the exception of legumes. More legumes were wasted in 2013 than 2011. The findings that students had similar consumption rates for fruit, whole grains, and most vegetables in this study are encouraging. Regular monitoring of student food selection and consumption at school is needed to assess whether the new meal patterns improve intake at school.
Schwartz MB, et al. New school meal regulations increase fruit consumption and do not increase total plate waste. Child Obes . 2015. 11(3):242-247.
Comparing 2012 to 2014, the percentage of students choosing fruit significantly increased from 54% to 66% and fruit consumption remained high at 74%. Student selection of fruit increased by 9% for each additional type of fruit offered with the meal. The proportion of students who chose a vegetable dropped from 68% to 52%, but students selecting vegetables ate nearly 20% more of them, effectively lowering vegetable waste. Entrée consumption increased significantly from 71% to 84%, thereby also decreasing waste. Students responded positively to the new lunches. They consumed more fruit, threw away less of the entrees and vegetables, and consumed the same amount of milk. Overall, the revised meal standards and policies appear to have significantly lowered plate waste in school cafeterias.
Scratch-cookingRelevant Peer-Reviewed Publication Key Findings
Woodward-Lopez G, et al. Is scratch-cooking a cost-effective way to prepare healthy school meals with US Department of Agriculture foods? J Acad Nutr Diet . 2014;114(9):1349-1358.
There was no significant relationship between total costs and level of scratch-cooking. Entrées with the highest scratch-cooking scores had significantly lower food costs, higher labor costs, and not significantly different total costs compared with entrées with no scratch-cooking. Nutrient content was not consistently associated with scratch-cooking, but scratch-cooked entrées did include a larger variety of non-fast-food-type entrées.
44
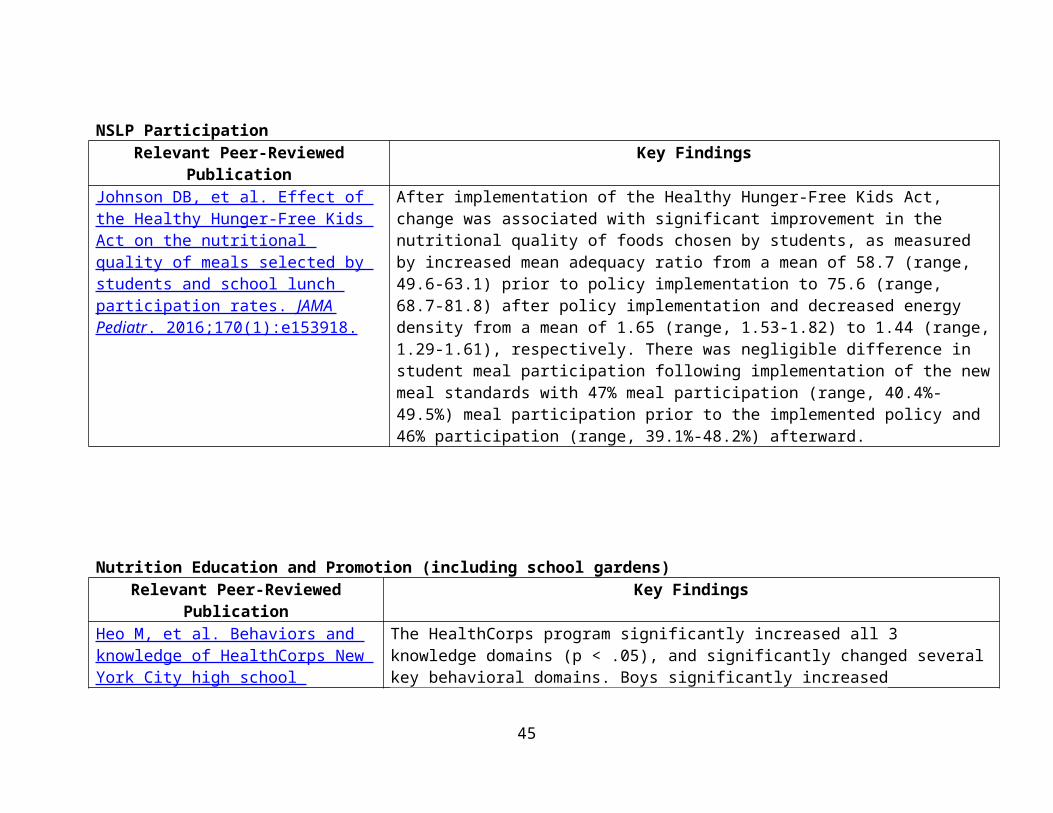
Sodium ReductionRelevant Peer-Reviewed Publication Key Findings
Cogswell ME, et al. Vital Signs: Sodium intake among U.S. school-aged children – 2009-2010. MMWR. 2014;63(36):789-797.
U.S. school-aged children consumed an estimated 3,279 mg of sodium daily with the highest total intake (3,672 mg/d) and intake per 1,000 kcal (1,681 mg) among high school–aged children. Forty-three percent of sodium came from 10 food categories: pizza, bread and rolls, cold cuts/cured meats, savory snacks, sandwiches, cheese, chicken patties/nuggets/tenders, pasta mixed dishes, Mexican mixed dishes, and soups. Sixty-five percent of sodium intake came from store foods, 13% from fast food/pizza restaurants, 5% from other restaurants, and 9% from school cafeteria foods. Among children aged 14–18 years, 16% of total sodium intake came from fast food/pizza restaurants versus 11% among those aged 6–10 years or 11–13 years (p<0.05). Among children who consumed a school meal on the day assessed, 26% of sodium intake came from school cafeteria foods. Thirty-nine percent of sodium was consumed at dinner, followed by lunch (29%), snacks (16%), and breakfast (15%).
Water Access Relevant Peer-Reviewed Publication Key Findings
Long MW, Gortmaker SL, Patel AI, Onufrak SJ, Wilking CL, Cradock AL. Public perception of quality and support for required access to drinking water in schools and parks. Am J Health Promot. In Press
Broad support for required access to water throughout the day in schools (96%) and parks (89%) and few participants believed water was unsafe in schools (10%) or parks (18%).
Patel AI, et al. Middle school student attitudes about school drinking fountains and water intake. Acad Ped . 2014;14:471-477.
Mean age of students was 12.3 (SD = 0.7) years; 75% were Latino, 89% low income, and 39% foreign born. Fifty-two percent reported lower than recommended overall water intake (<3 glasses/day), and 30% reported that they were unlikely or extremely unlikely to drink water at school. 59% percent reported that school fountains were unclean, 48% that fountain water does not taste good, 33% that fountains could make them sick, 31% that it was not okay to drink from fountains, and 24% that fountain water is contaminated. In adjusted analyses, attitudes about
45
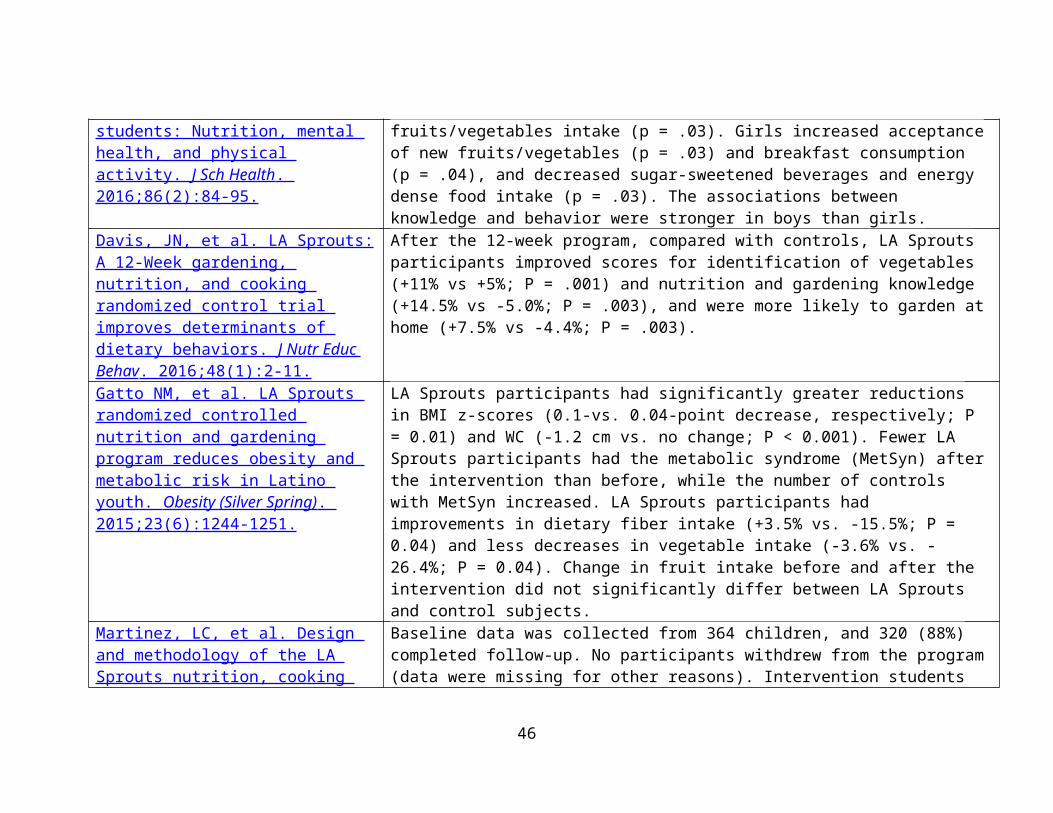
school drinking fountains were related to intentions to drink water at school were also associated with overall water intake.
Grummon AH, Oliva A, Hampton KE, Patel AI. Association Between Student Purchases of Beverages During the School Commute and In-School Consumption of Sugar-Sweetened Beverages, San Francisco Bay Area, 2013. Prev Chronic Dis . 2015; 12:150306.
One-fifth (20.4%) of students drank an SSB during lunch. Approximately 23% of SSBs were obtained during the school commute. Students who reported buying beverages during their school commute (50.1% of all students) were more likely to report drinking SSBs during lunch than students who reported that they do not buy beverages during the school commute (adjusted odds ratio 3.32, 95% confidence interval, 2.19-5.05, P < .001).
Elbel, B, et al. A water availability intervention in New York City public schools: Influence on youths’ water and milk behaviors. Am J Public Health . 2015;105(2):365-372.
Three months after implementation we observed a 3-fold increase in water taking (increase of 21.63 events per 100 students; P<.001) and a much smaller decline in milk taking (-6.73 events per 100 students; P=.012), relative to comparison schools. At 1 year, relative to baseline, there was a similar increase in water taking and no decrease in milk taking. Cafeteria workers reported that the water jets were simple to clean and operate.
Patel AI, Hecht K, Hampton KE, Grumbach JM, Braff-Guajardo E, Brindis CD. Tapping into Water: Key Considerations for Achieving Excellence in School Drinking Water Access. Am J Public Health . 2014;104(7):1314-9.
No schools met all criteria for excellent water access. High schools and middle schools had lower fountain:student ratios than elementary schools (odds ratio [OR] = 0.06; 95% confidence interval [CI] = 0.02, 0.20; OR = 0.30, 95% CI = 0.12, 0.70). Rural schools were more likely to offer a nonfountain water source than city schools (OR = 5.0; 95% CI = 1.74, 14.70). Newer schools were more likely to maintain water sources than older schools (OR = 0.98; 95% CI = 0.97, 1.00). Schools that offered free water in food service areas increased from pre- to postimplementation of California's school water policy (72%-83%; P < .048). Barriers to improving school water included cost of programs and other pressing concerns.
Patel AI, Chandran K, Hampton KE, et al. Observations of drinking water access in school food service areas before implementation of federal and state school water policy, California, 2011. Prev Chronic Dis . 2012;9:110315.
Fourteen of 24 schools offered free water in FSAs; 10 offered water via fountains, and 4 provided water through a nonfountain source. Four percent of students drank free water at lunch; intake at elementary schools (11%) was higher than at middle or junior high schools (6%) and high schools (1%). In secondary schools when water was provided by a nonfountain source, the percentage of students who drank free water doubled. Barriers to implementation of water requirements included lack of
46
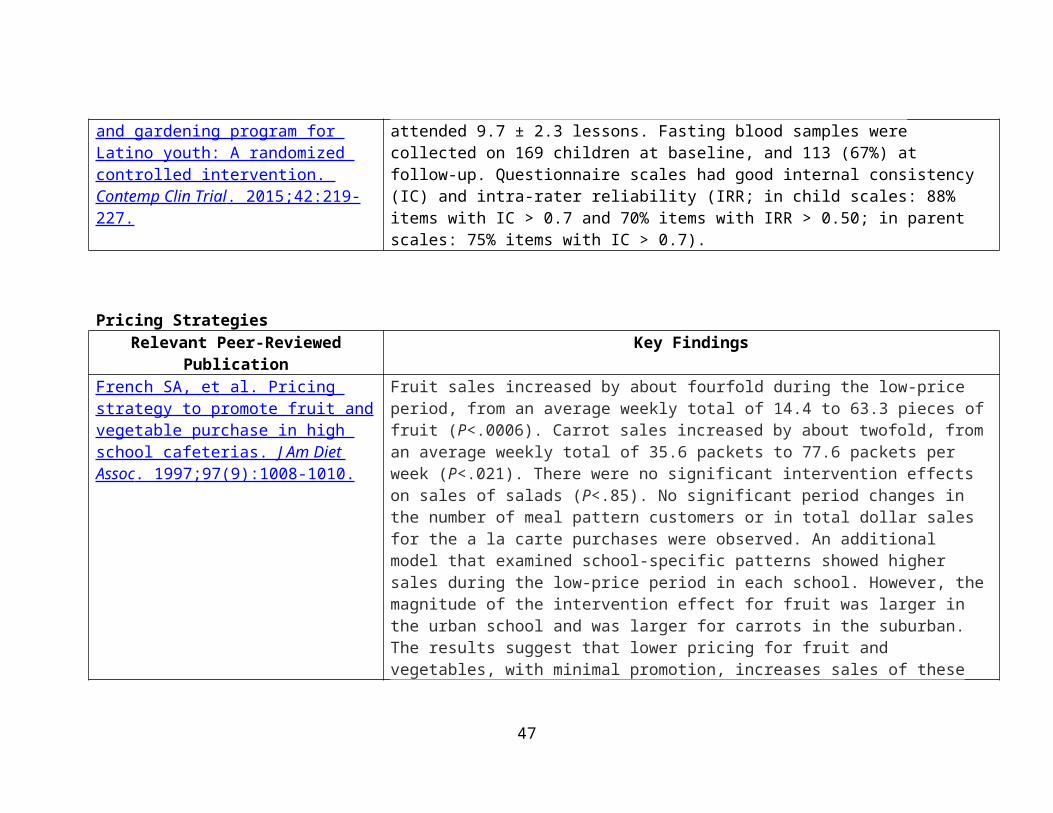
knowledge of legislation, cost, and other pressing academic concerns. No wellness policies included language about water in FSAs.
Patel A, Hampton KE. Encouraging consumption of water in school and child care settings: Access, challenges, and strategies for improvement. Am J Public Health. 2011;101(8).
Children and adolescents are not consuming enough water, instead opting for sugar-sweetened beverages (sodas, sports and energy drinks, milks, coffees, and fruit-flavored drinks with added sugars), 100% fruit juice, and other beverages. Drinking sufficient amounts of water can lead to improved weight status, reduced dental caries, and improved cognition among children and adolescents. Because children spend most of their day at school and in child care, ensuring that safe, potable drinking water is available in these settings is a fundamental public health measure. We sought to identify challenges that limit access to drinking water; opportunities, including promising practices, to increase drinking water availability and consumption; and future research, policy efforts, and funding needed in this area.
Patel, et al. Increasing the availability and consumption of drinking water in middle schools: A pilot study. Prev Chronic Dis . 2011;8(3):A60
Pilot program also showed the provision of filtered, chilled drinking water in school cafeterias coupled with promotion and education is associated with increased consumption of drinking water at school (See Patel, et al. Prev Chronic Dis . 2011;8(3):A60).
Relevant Reports: Grummon A, Hampton KE, Oliva A, Brindis CD, Patel AI. Water works: a guide to improving access to and consumption of water in schools to improve health and support learning .
Relevant Resources: Increasing Access to Drinking Water in Schools : Provides school health councils, nutrition services providers,
principals, teachers, parents, and other school staff with information and tools to meet free drinking water requirements in NSLP and SBP programs; help make clean, free drinking water readily available throughout multiple points in school settings; and promote consumption of water as a healthy beverage.
Nutrition and Obesity Policy Research and Evaluation Network : Thematic research network of the Prevention Research Centers Programs. Mission is to conduct transdisciplinary nutrition- and obesity-related policy research and evaluation along a policy change continuum. The work of NOPREN members helps foster understanding of the effectiveness of policies related to preventing childhood obesity through improved access to affordable, healthy foods and beverages in a variety of settings including communities, workplaces, healthcare facilities, childcare institutions, and schools. One of the newer working groups is focusing on School Wellness Policies.
47
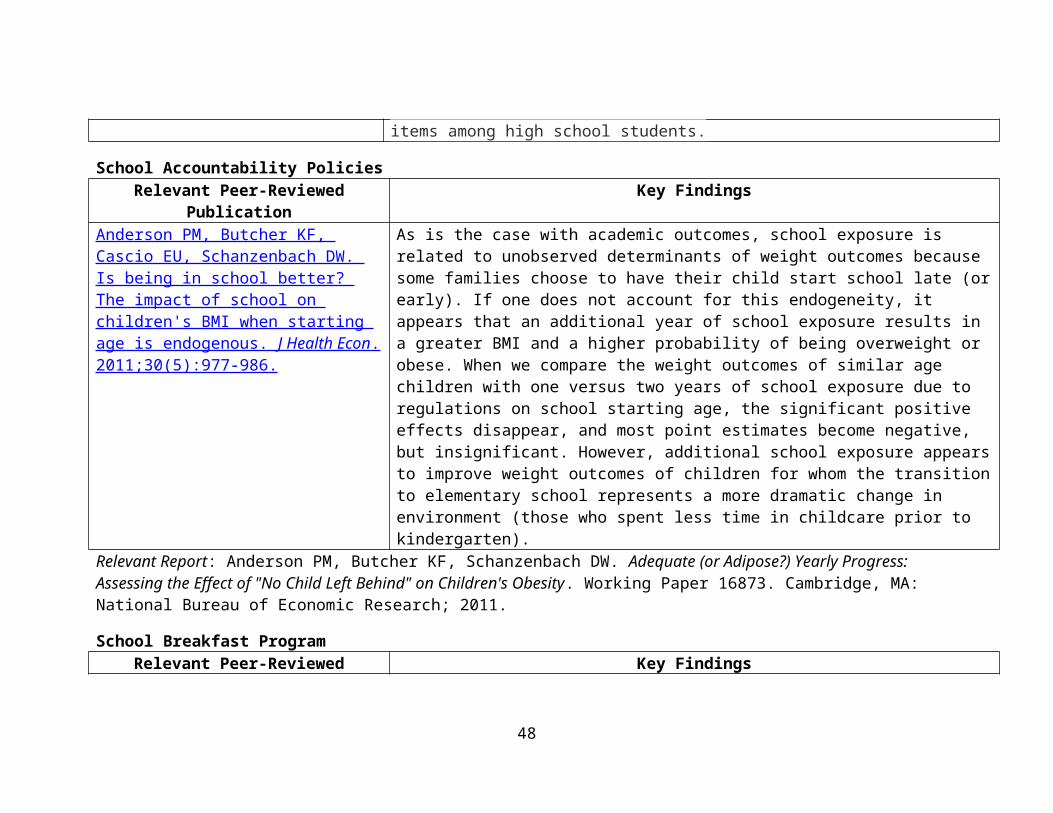
Other Childhood Obesity Relevant FindingsRelevant Peer-Reviewed Publication Key Findings
Jernigan, M, et al. Emotional health predicts changes in Body Mass Index (BMI-z) among Black and Latino youth. Clin Pediatr . 2015;54(7):693-696.
In this sample of predominantly Black and Latino students, more frequent negative emotional symptoms (eg, feeling sad, feeling nervous) among students in grades 5 and 6 predicted increased BMI-z scores 2 years later. Findings suggest that negative emotional symptoms increase youths’ risk for weight gain.
Rosenthal, L, et al. Weight- and race-based bullying: Health associations among urban adolescents. J Health Psychology . 2015;20(4):401-412.
Stigma-based bullying is associated with negative mental and physical health outcomes. In a longitudinal study, surveys and physical assessments were conducted with mostly Black and Latino, socioeconomically disadvantaged, urban students. As hypothesized, greater weight- and race-based bullying each was significantly indirectly associated with increased blood pressure and body mass index, as well as decreased overall self-rated health across 2 years, through the mechanism of more negative emotional symptoms. Results support important avenues for future research on mechanisms and longitudinal associations of stigma-based bullying with health. Interventions are needed to reduce stigma-based bullying and buffer adolescents from adverse health effects.
Katzmarzyk, PT, et al. An evolving scientific basis for the prevention and treatment of pediatric obesity. Int J Obes . 2014;38(7):887-905.
The 2013 Pennington Biomedical Research Center's Scientific Symposium focused on the treatment and management of pediatric obesity and was designed to (i) review recent scientific advances in the prevention, clinical treatment and management of pediatric obesity, (ii) integrate the latest published and unpublished findings and (iii) explore how these advances can be integrated into clinical and public health approaches. The symposium provided an overview of important new advances in the field, which led to several recommendations for incorporating the scientific evidence into practice. The science presented covered a range of topics related to pediatric obesity, including the role of genetic differences, epigenetic events influenced by in utero development, pre-pregnancy maternal obesity status, maternal nutrition and maternal weight gain on developmental programming of adiposity in offspring. Finally, the relative merits of a range of various behavioral approaches targeted at pediatric obesity were covered, together with the specific roles of pharmacotherapy and bariatric surgery in pediatric populations. In summary, pediatric obesity is a very challenging problem that is unprecedented in evolutionary
48
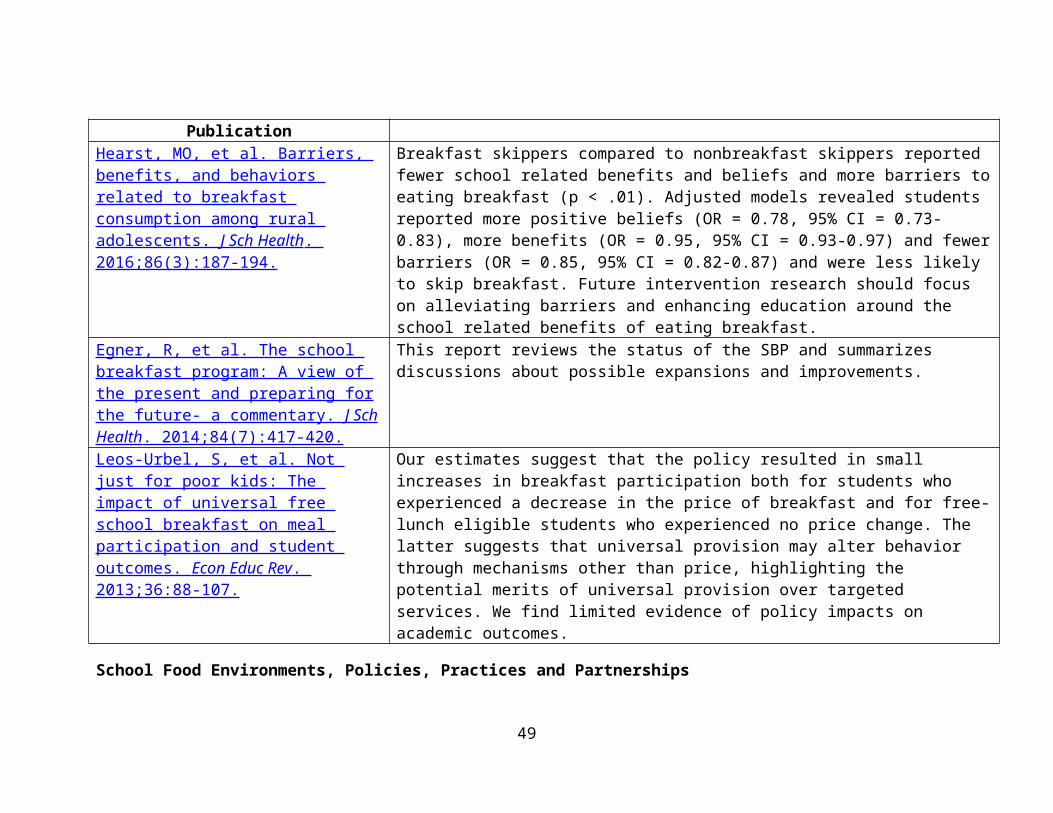
terms; one which has the capacity to negate many of the health benefits that have contributed to the increased longevity observed in the developed world.
Moreno, et al. Prevalence and prediction of overweight and obesity among elementary school students. J Sch Health . 2013;83(3):157-163 .
The Communities and Schools Together (CAST): Height and weight measurements were collected on 2,317 elementary school children in 1 school district. BMI was calculated using CDC NutStat program. Prevalence of >85 percentile was 30.9%, 34.4%, 35.3%, 37.1%, and 44.5% for K-5, respectively. Prevalence of >85th percentile was highest among Hispanic children. Ethnicity was the strongest predictor of inclusion in the >85th percentile category followed by grade and free and reduced lunch eligibility.
Kallem, S, et al. Shift- and persist: A protective factor for elevated BMI among low-socioeconomic-status children. Obesity (Silver Spring, MD). 2013;21(9):1759-1763.
Among children reporting engaging in less frequent shift-and-persist strategies, lower SES was associated with significantly higher BMI z-scores (P < 0.05). However, among children reporting engaging in more frequent shift-and-persist strategies, there was no association of SES with BMI z-score (P = 0.16), suggesting that shift-and-persist strategies may be protective against the association between SES and BMI. Interventions aimed at improving psychological resilience among children of low SES may provide a complementary approach to prevent childhood overweight and obesity among at-risk populations.
49